hses 1ete c17.qxd 5/16/04 1:29 pm page 488 section...
TRANSCRIPT

488 Chapter 17
17.3 Temperature Controls
Reading StrategyPreviewing Copy the table below. Beforeyou read, use Figure 15 to describe thetemperature variations for Vancouver andWinnipeg.
Key ConceptsWhat is a temperaturecontrol?
How do the heating ofland and water differ?
Why do some cloudsreflect a portion ofsunlight back to space?
Vocabulary◆ albedo◆ isotherm
Temperature is one of the basic elements of weatherand climate. When someone asks what it is like outside,air temperature is often the first element we mention. Ata weather station, the temperature is read on a regularbasis from instruments mounted in an instrument shelterlike the one in Figure 14. The shelter protects the instru-ments from direct sunlight and allows a free flow of air.
Why Temperatures VaryA temperature control is any factor that causes tempera-ture to vary from place to place and from time to time.Earlier in this chapter you examined the most importantcause for temperature variations—differences in thereceipt of solar radiation. Because variations in the angleof the sun’s rays and length of daylight depend on latitude,they are responsible for warmer temperatures in the trop-ics and colder temperatures toward the poles. Seasonaltemperature changes happen as the sun’s vertical raysmove toward and away from a particular latitude duringthe year. Factors other than latitude that exert astrong influence on temperature include heating of landand water, altitude, geographic position, cloud cover,and ocean currents.
List three factors that influence temperature.
Figure 14 This moderninstrument shelter contains anelectrical thermometer called athermistor.
Temperature Variations
Vancouver a.
Winnipeg b. ?
?
488 Chapter 17
FOCUS
Section Objectives17.6 Explain what a temperature
control is.17.7 Compare and contrast the
heating of land and water.17.8 Explain why some clouds
reflect a portion of sunlightback to space.
Build VocabularyLINCS Have students use the LINCSstrategy to learn and review the termsalbedo, windward, leeward, and isotherm.In LINCS exercises, students List whatthey know about each term, Imagine apicture that describes the word, Note a“sound-alike” word, Connect the termsto the sound-alike word by making up ashort story, and then perform a briefSelf-test.
Reading Strategya. slight temperature variationb. more extreme temperature variation
INSTRUCT
Why TemperaturesVaryBuild Science SkillsInterpreting Photographs Havestudents look at Figure 14 carefully.Ask: What is inside this shelter? (anelectrical thermometer called a thermistor)Why does the thermistor need to beprotected by a shelter? (Direct sunlightwould spoil the temperature readings, andit needs to be protected from breaking.)What does the shelter need to havevents for air flow? (The air inside theshelter cannot get hotter than theoutside air.)Logical, Visual
L2
2
L2
L2
Reading Focus
1
Section 17.3
HSES_1eTE_C17.qxd 5/16/04 1:29 PM Page 488

The Atmosphere: Structure and Temperature 489
Land and Water The heating of Earth’s surface controls the tem-perature of the air above it. To understand variations in air temperature,we consider the characteristics of the surface. Different land surfacesabsorb varying amounts of incoming solar energy. The largest contrast,however, is between land and water. Land heats more rapidly andto higher temperatures than water. Land also cools more rapidly andto lower temperatures than water. Temperature variations, therefore,are considerably greater over land than over water.
Monthly temperature data for two cities, shown in Figure 15, showthe influence of a large body of water. Vancouver, British Columbia, islocated along the windward Pacific coast. Winnipeg,Manitoba, is far from the influence of water. Both cities areat about the same latitude, so they experience similarlengths of daylight and angles of the sun’s rays. Winnipeg,however, has much greater temperature extremes thanVancouver does.Vancouver’s moderate year-round climateis due to its location by the Pacific Ocean.
Temperature variations in the Northern and Southernhemispheres are compared in Table 1. Water accounts for61 percent of the Northern Hemisphere, and landaccounts for the remaining 39 percent. In the SouthernHemisphere, 81 percent of the surface is water and only 19percent of the surface is land. The Southern Hemisphereshows smaller annual temperature variations.
Tem
per
atur
e (˚C
)
24
20
16
12
8
4
0
– 4
– 8
–12
–16
–20
Month
J F M A M J J A S O N D
Vancouver
(marine)W
inni
peg
(con
tinen
tal)
• VancouverWinnipeg •
Canada
United States
Tem
per
atur
e (˚F
)
40
70
60
50
30
20
10
0
Figure 15 Mean MonthlyTemperatures for Vancouver andWinnipeg Winnipeg illustrates thegreater extremes associated with aninterior location. Calculating How much lower isWinnipeg’s January mean temperaturethan Vancouver’s? Calculate thetemperature to the nearest degree.
Northern Southern Latitude Hemisphere Hemisphere
0 0 0
15 3 4
30 13 7
45 23 6
60 30 11
75 32 26
90 40 31
Table 1 Variation in Annual MeanTemperature Range (ºC) with Latitude
Integrating PhysicsSpecific Heat Water requires a greatdeal more heat to raise its temperaturethe same amount as an equal quantityof land. The amount of energy neededto raise the temperature of 1 g of asubstance 1°C is its specific heat. Thehigher a substance’s specific heat, themore heat it takes to raise its temp-erature a certain amount. Ask: Whenyou go to the beach on a sunny day,why does the sand feel hot? (The sandhas a low specific heat, so its temperaturerises quickly.) Why does the water feelcold even though it is sunny? (Thewater has a high specific heat, so itstemperature rises slowly.)Logical
Use VisualsFigure 15 Use this graph to helpstudents understand how data arepresented on climate graphs. Ask:What does the left axis indicate?(temperature in degrees Celsius)What does the right axis indicate?(temperature in degrees Fahrenheit)What does the bottom axis indicate?(month) What do the curves forVancouver and Winnipeg indicateabout their climates? (They havesimilar summer climates but Winnipeghas a much colder winter climate.)Visual, Logical
L1
L2
The Atmosphere: Structure and Temperature 489
Customize for English Language Learners
ELL students can benefit from relatingexamples from their lives to material in thesection. Encourage students to think about the
climate where they were born or grew up.Have them explain that climate in terms of thefactors that influence temperature. Answer to . . .
Figure 15 It is 21°C lower.
Accept any three ofthe following: latitude,
differential heating of land and water,altitude, geographic position, cloudcover, ocean currents
HSES_1eTE_C17.qxd 5/16/04 1:29 PM Page 489
490 Chapter 17
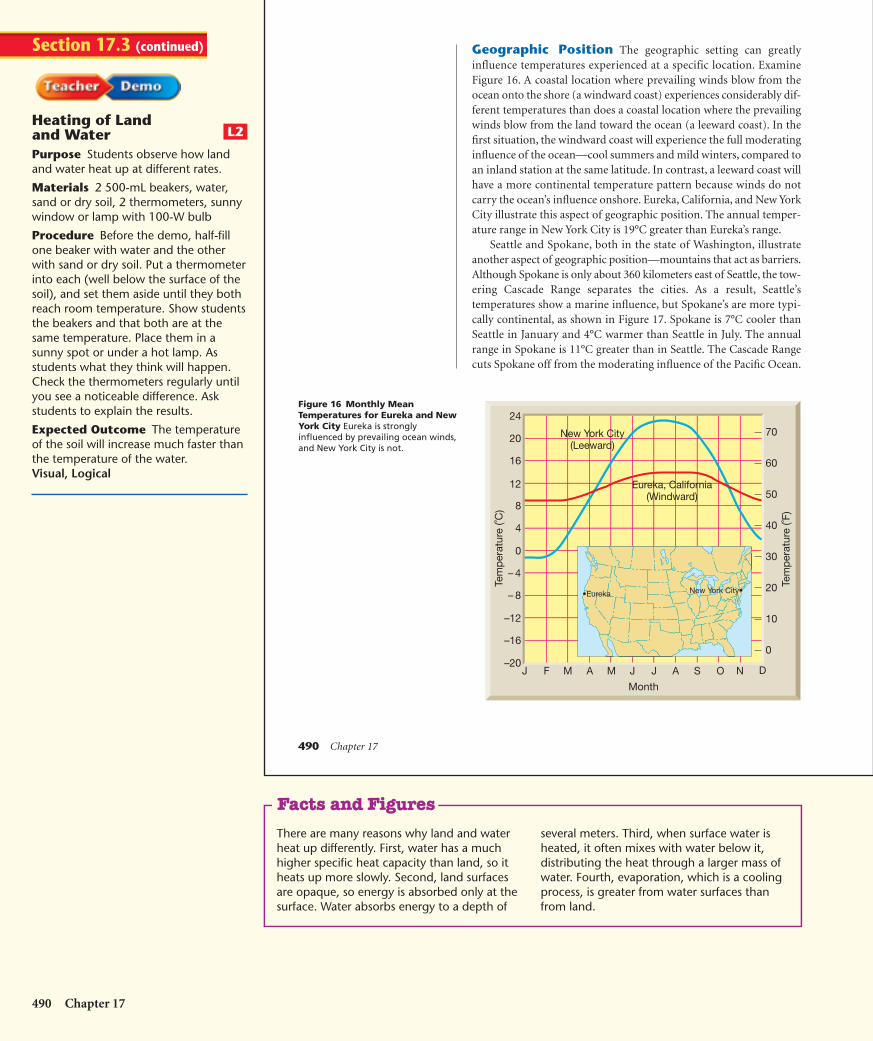
Geographic Position The geographic setting can greatlyinfluence temperatures experienced at a specific location. ExamineFigure 16. A coastal location where prevailing winds blow from theocean onto the shore (a windward coast) experiences considerably dif-ferent temperatures than does a coastal location where the prevailingwinds blow from the land toward the ocean (a leeward coast). In thefirst situation, the windward coast will experience the full moderatinginfluence of the ocean—cool summers and mild winters, compared toan inland station at the same latitude. In contrast, a leeward coast willhave a more continental temperature pattern because winds do notcarry the ocean’s influence onshore. Eureka, California, and New YorkCity illustrate this aspect of geographic position. The annual temper-ature range in New York City is 19°C greater than Eureka’s range.
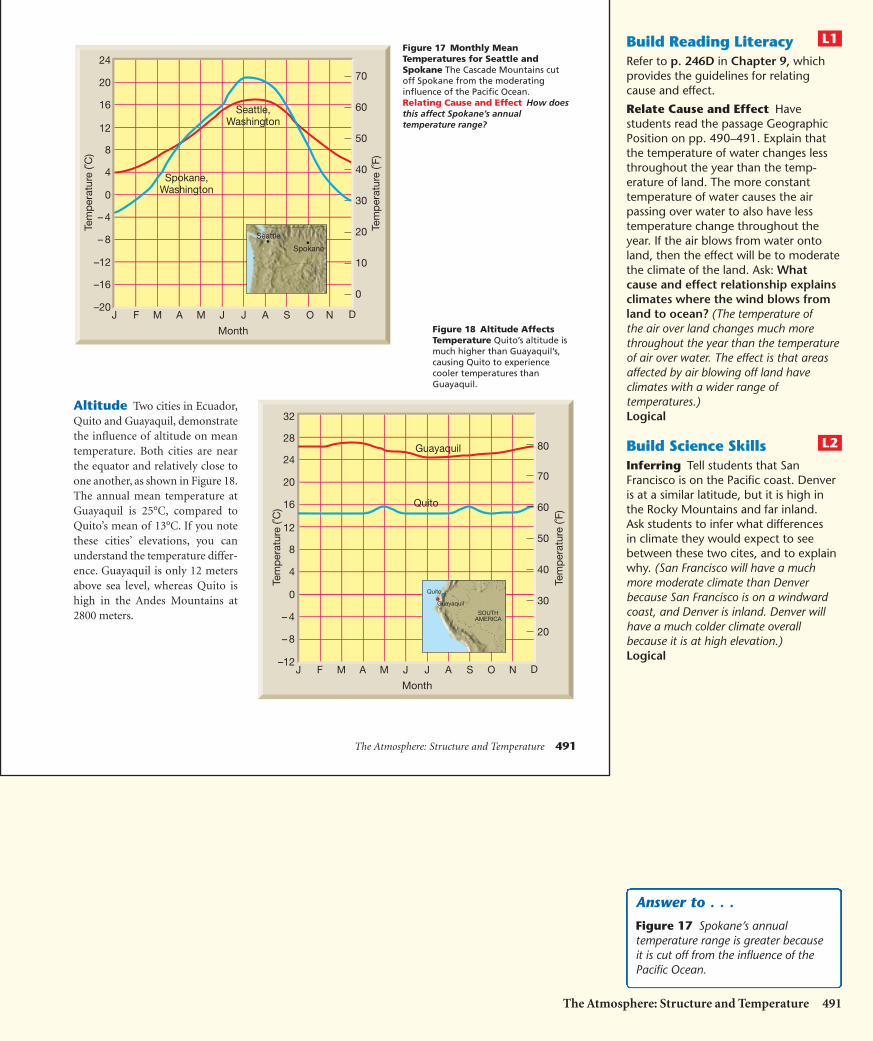
Seattle and Spokane, both in the state of Washington, illustrateanother aspect of geographic position—mountains that act as barriers.Although Spokane is only about 360 kilometers east of Seattle, the tow-ering Cascade Range separates the cities. As a result, Seattle’stemperatures show a marine influence, but Spokane’s are more typi-cally continental, as shown in Figure 17. Spokane is 7°C cooler thanSeattle in January and 4°C warmer than Seattle in July. The annualrange in Spokane is 11°C greater than in Seattle. The Cascade Rangecuts Spokane off from the moderating influence of the Pacific Ocean.
Figure 16 Monthly MeanTemperatures for Eureka and NewYork City Eureka is stronglyinfluenced by prevailing ocean winds,and New York City is not.
Eureka, California(Windward)
New York City(Leeward)
Tem
per
atur
e (˚C
)
24
20
16
12
8
4
0
– 4
– 8
–12
–16
–20
Month
J F M A M J J A S O N D
New York City••Eureka
Tem
per
atur
e (˚F
)
40
70
60
50
30
20
10
0
490 Chapter 17
Heating of Landand WaterPurpose Students observe how landand water heat up at different rates.
Materials 2 500-mL beakers, water,sand or dry soil, 2 thermometers, sunnywindow or lamp with 100-W bulb
Procedure Before the demo, half-fillone beaker with water and the otherwith sand or dry soil. Put a thermometerinto each (well below the surface of thesoil), and set them aside until they bothreach room temperature. Show studentsthe beakers and that both are at thesame temperature. Place them in asunny spot or under a hot lamp. Asstudents what they think will happen.Check the thermometers regularly untilyou see a noticeable difference. Askstudents to explain the results.
Expected Outcome The temperatureof the soil will increase much faster thanthe temperature of the water.Visual, Logical
L2
Section 17.3 (continued)
There are many reasons why land and waterheat up differently. First, water has a muchhigher specific heat capacity than land, so itheats up more slowly. Second, land surfacesare opaque, so energy is absorbed only at thesurface. Water absorbs energy to a depth of
several meters. Third, when surface water isheated, it often mixes with water below it,distributing the heat through a larger mass ofwater. Fourth, evaporation, which is a coolingprocess, is greater from water surfaces thanfrom land.
Facts and Figures
HSES_1eTE_C17.qxd 9/24/04 7:07 PM Page 490
The Atmosphere: Structure and Temperature 491
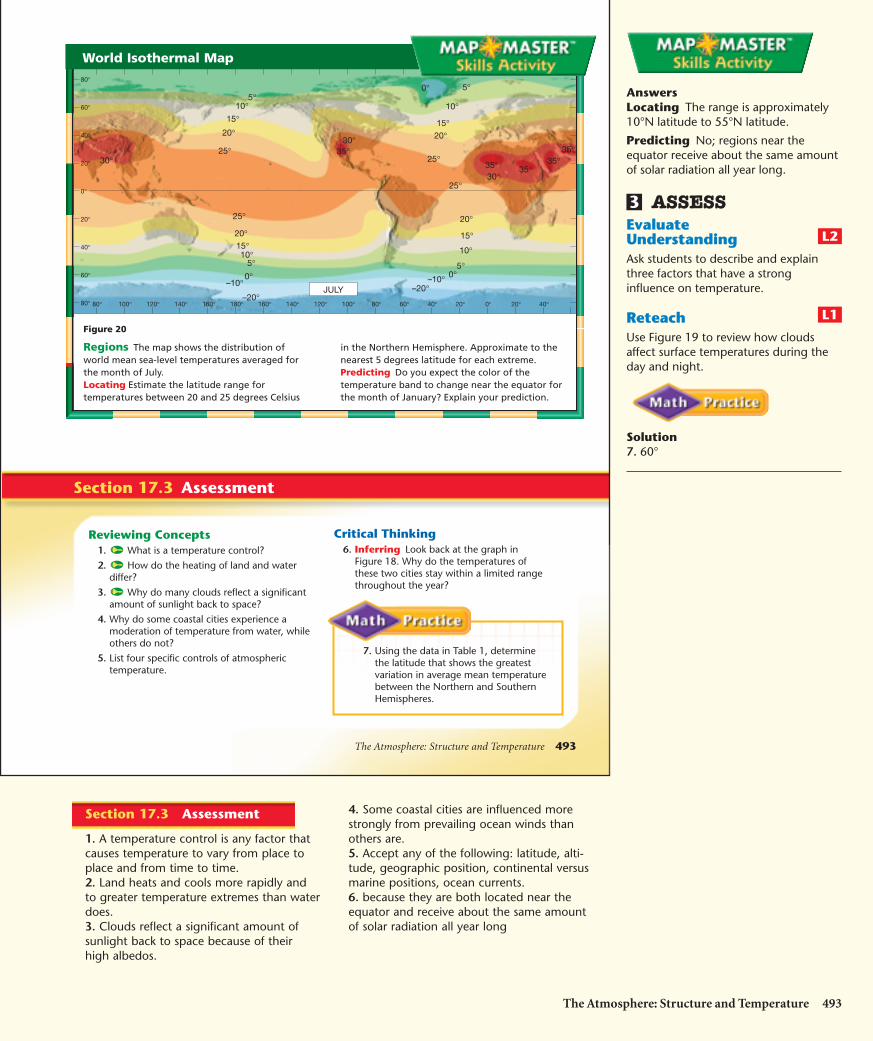
Altitude Two cities in Ecuador,Quito and Guayaquil, demonstratethe influence of altitude on meantemperature. Both cities are nearthe equator and relatively close toone another, as shown in Figure 18.The annual mean temperature atGuayaquil is 25°C, compared toQuito’s mean of 13°C. If you notethese cities’ elevations, you canunderstand the temperature differ-ence. Guayaquil is only 12 metersabove sea level, whereas Quito ishigh in the Andes Mountains at2800 meters.
Seattle,Washington
Spokane,Washington
Tem
per
atur
e (˚C
)
24
20
16
12
8
4
0
– 4
– 8
–12
–16
–20
Month
J F M A M J J A S O N D
Tem
per
atur
e (˚F
)
40
70
60
50
30
20
10
0
Spokane
Seattle• •
Quito
Guayaquil
Quito
Guayaquil
SOUTHAMERICA
Tem
per
atur
e (˚C
)
24
20
16
12
8
4
0
– 4
– 8
–12
Month
J F M A M J J A S O N D
Tem
per
atur
e (˚F
)40
70
60
50
30
20
28
32
80
Figure 18 Altitude AffectsTemperature Quito’s altitude ismuch higher than Guayaquil’s,causing Quito to experiencecooler temperatures thanGuayaquil.
Figure 17 Monthly MeanTemperatures for Seattle andSpokane The Cascade Mountains cutoff Spokane from the moderatinginfluence of the Pacific Ocean.Relating Cause and Effect How doesthis affect Spokane’s annualtemperature range?
Build Reading LiteracyRefer to p. 246D in Chapter 9, whichprovides the guidelines for relatingcause and effect.
Relate Cause and Effect Havestudents read the passage GeographicPosition on pp. 490–491. Explain thatthe temperature of water changes lessthroughout the year than the temp-erature of land. The more constanttemperature of water causes the airpassing over water to also have lesstemperature change throughout theyear. If the air blows from water ontoland, then the effect will be to moderatethe climate of the land. Ask: Whatcause and effect relationship explainsclimates where the wind blows fromland to ocean? (The temperature ofthe air over land changes much morethroughout the year than the temperatureof air over water. The effect is that areasaffected by air blowing off land haveclimates with a wider range oftemperatures.)Logical
Build Science SkillsInferring Tell students that SanFrancisco is on the Pacific coast. Denveris at a similar latitude, but it is high inthe Rocky Mountains and far inland.Ask students to infer what differencesin climate they would expect to seebetween these two cites, and to explainwhy. (San Francisco will have a muchmore moderate climate than Denverbecause San Francisco is on a windwardcoast, and Denver is inland. Denver willhave a much colder climate overallbecause it is at high elevation.)Logical
L2
L1
The Atmosphere: Structure and Temperature 491
Answer to . . .
Figure 17 Spokane’s annualtemperature range is greater becauseit is cut off from the influence of thePacific Ocean.
HSES_1eTE_C17.qxd 9/24/04 7:07 PM Page 491

492 Chapter 17
Cloud Cover and Albedo Albedo is the fraction of total radi-ation that is reflected by any surface. Many clouds have a highalbedo, and therefore reflect a significant portion of the sunlight thatstrikes them back to space. The extent of cloud cover is a factor thatinfluences temperatures in the lower atmosphere. By reducing theamount of incoming solar radiation, the maximum temperatures ona cloud-covered day will be lower than on a day when the clouds areabsent and the sky is clear, as shown in Figure 19A.
At night, clouds have the opposite effect, as shown in Figure 19B.Clouds act as a blanket by absorbing outgoing radiation emitted byEarth and reradiating a portion of it back to the surface. Thus, cloudynighttime air temperatures do not drop as low as they would on aclear night. The effect of cloud cover is to reduce the daily tempera-ture range by lowering the daytime maximum and raising thenighttime minimum.
World Distribution of TemperatureTake a moment to study Figure 20, which is a world isothermal map.Isotherms are lines that connect points that have the same temperature.From hot colors near the equator to cool colors toward the poles, thismap shows mean sea-level temperatures in the seasonally extreme monthof July. All temperatures on this map have been reduced to sea level toeliminate complications caused by differences in altitude.
On this map, you can study global temperature patterns and theeffects of the controlling factors of temperature, especially latitude,distribution of land and water, and ocean currents. The isotherms gen-erally trend east and west and show a decrease in temperatures fromthe tropics toward the poles. This map emphasizes the importance oflatitude as a control on incoming solar radiation, which in turn heatsEarth’s surface and the atmosphere above it.
Figure 19 A During daylighthours, clouds reflect solarradiation back to space. B Atnight, clouds absorb radiationfrom the land and reradiate someof it back to Earth, increasingnighttime temperatures.
A B
492 Chapter 17
Use VisualsFigure 19 Use the diagrams to helpstudents understand the effect cloudcover has on temperature. Ask: What ishappening to the solar radiation inFigure A? (The clouds are reflecting thesolar energy back into space.) How dothe clouds during the day affect thetemperature? (Because they reflect thesolar radiation, less radiation reachesEarth, so the temperatures are lower.)What is happening in Figure B? (Theclouds are absorbing radiation from landand reradiating some of it to Earth.) Howdo the clouds affect the temperature?(The clouds increase the temperaturebecause they are re-radiating the radiationfrom the land, increasing the temperature.)Why do clouds during the day andnight affect temperature differently?(They block the radiation in different ways.During the day, they block the sun’sradiation, and during the night theyblock the radiation from land.)Visual, Logical
World Distributionof TemperatureUse CommunityResourcesInvite a climatologist from a localcollege to visit the classroom anddiscuss factors that affect climate andworldwide temperature patterns. Askstudents to prepare questions for theclimatologist in advance. Remind themto use Who, What, Where, When, Why,and How questions.Interpersonal
L2
L1
Section 17.3 (continued)
The highest temperature ever recorded atEarth’s surface is nearly 59°C. It was recordedon September 13, 1922, at Azizia, Libya, inNorth Africa’s Sahara Desert. Not surprisingly,the lowest temperature was measured inAntarctica. It was –89°C. This temperature
was recorded at the Russian Vostok Station onAugust 24, 1960. The greatest annual rangeof temperatures is in Siberia (eastern Russia).Temperatures in Verkhoyansk, Siberia havegone from �68°C to 37°C, a span of 105°C.
Facts and Figures
HSES_1eTE_C17.qxd 5/16/04 1:30 PM Page 492
Section 17.3 Assessment
20°
40°
60°
80°
100°120°140°160°180°
0°
20°
40°
60°
80° 80° 60° 40° 20° 0° 20° 40°160°140°120°100°80°
0°
10°
15°
20°
25°
30°
5°
5°
25°
20°15°
10°
–10°–20°
30°
30°
10°15°20°
25°
5°
5°
25°
20°15°
10°
–10°
–20°JULY
0°
35°35° 35°
35°35°
0°
Figure 20
Regions The map shows the distribution ofworld mean sea-level temperatures averaged forthe month of July. Locating Estimate the latitude range fortemperatures between 20 and 25 degrees Celsius
in the Northern Hemisphere. Approximate to thenearest 5 degrees latitude for each extreme. Predicting Do you expect the color of thetemperature band to change near the equator forthe month of January? Explain your prediction.
Critical Thinking6. Inferring Look back at the graph in
Figure 18. Why do the temperatures ofthese two cities stay within a limited rangethroughout the year?
Reviewing Concepts1. What is a temperature control?
2. How do the heating of land and waterdiffer?
3. Why do many clouds reflect a significantamount of sunlight back to space?
4. Why do some coastal cities experience amoderation of temperature from water, whileothers do not?
5. List four specific controls of atmospherictemperature.
7. Using the data in Table 1, determinethe latitude that shows the greatestvariation in average mean temperaturebetween the Northern and SouthernHemispheres.
The Atmosphere: Structure and Temperature 493
World Isothermal Map
AnswersLocating The range is approximately10°N latitude to 55°N latitude.
Predicting No; regions near theequator receive about the same amountof solar radiation all year long.
ASSESSEvaluateUnderstandingAsk students to describe and explainthree factors that have a stronginfluence on temperature.
ReteachUse Figure 19 to review how cloudsaffect surface temperatures during theday and night.
Solution7. 60°
L1
L2
3
The Atmosphere: Structure and Temperature 493
4. Some coastal cities are influenced morestrongly from prevailing ocean winds thanothers are.5. Accept any of the following: latitude, alti-tude, geographic position, continental versusmarine positions, ocean currents.6. because they are both located near theequator and receive about the same amountof solar radiation all year long
Section 17.3 Assessment
1. A temperature control is any factor thatcauses temperature to vary from place toplace and from time to time.2. Land heats and cools more rapidly andto greater temperature extremes than waterdoes.3. Clouds reflect a significant amount ofsunlight back to space because of theirhigh albedos.
HSES_1eTE_C17.qxd 5/16/04 1:30 PM Page 493
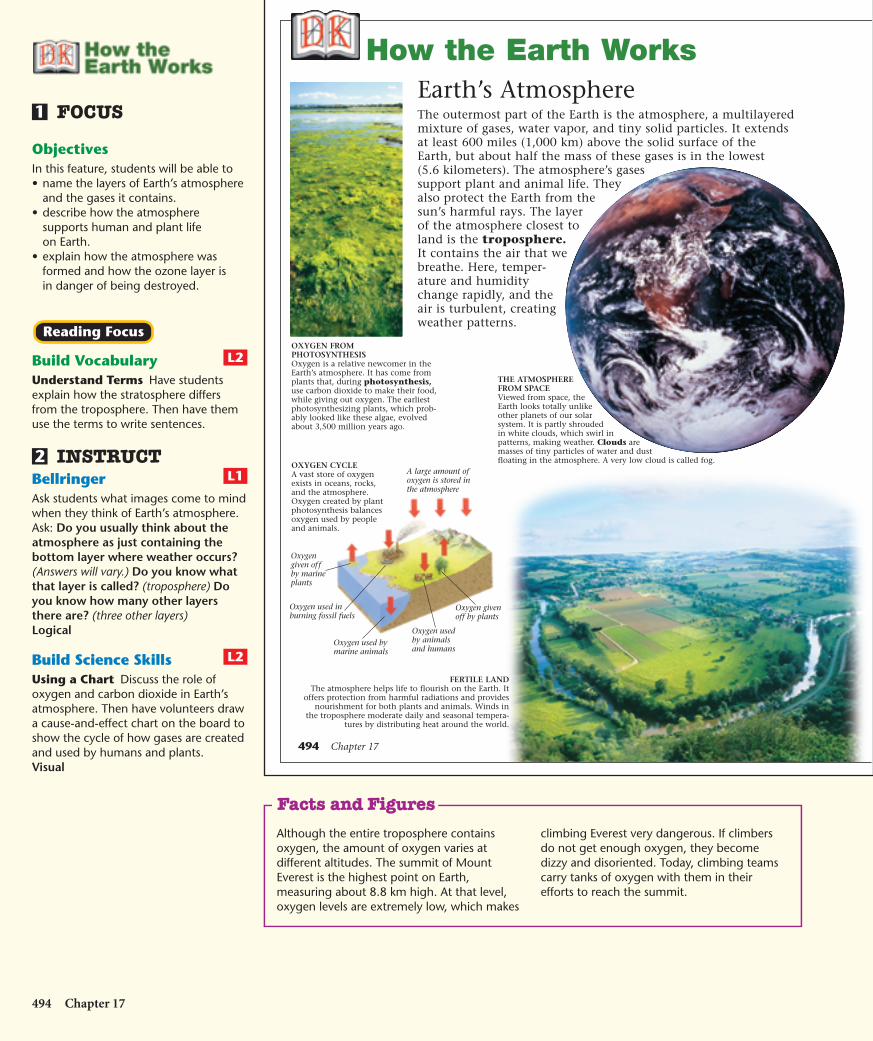
Earth’s AtmosphereThe outermost part of the Earth is the atmosphere, a multilayeredmixture of gases, water vapor, and tiny solid particles. It extendsat least 600 miles (1,000 km) above the solid surface of the Earth, but about half the mass of these gases is in the lowest (5.6 kilometers). The atmosphere’s gasessupport plant and animal life. Theyalso protect the Earth from thesun’s harmful rays. The layerof the atmosphere closest toland is the troposphere.It contains the air that webreathe. Here, temper-ature and humiditychange rapidly, and theair is turbulent, creatingweather patterns.
OXYGEN FROM PHOTOSYNTHESISOxygen is a relative newcomer in theEarth’s atmosphere. It has come fromplants that, during photosynthesis,use carbon dioxide to make their food,while giving out oxygen. The earliestphotosynthesizing plants, which prob-ably looked like these algae, evolvedabout 3,500 million years ago.
THE ATMOSPHEREFROM SPACEViewed from space, theEarth looks totally unlikeother planets of our solarsystem. It is partly shrouded in white clouds, which swirl inpatterns, making weather. Clouds aremasses of tiny particles of water and dustfloating in the atmosphere. A very low cloud is called fog.
How the Earth Works
FERTILE LANDThe atmosphere helps life to flourish on the Earth. It
offers protection from harmful radiations and providesnourishment for both plants and animals. Winds in
the troposphere moderate daily and seasonal tempera-tures by distributing heat around the world.
OXYGEN CYCLEA vast store of oxygenexists in oceans, rocks,and the atmosphere.Oxygen created by plantphotosynthesis balancesoxygen used by peopleand animals.
494 Chapter 17
494 Chapter 17
FOCUS
ObjectivesIn this feature, students will be able to• name the layers of Earth’s atmosphere
and the gases it contains.• describe how the atmosphere
supports human and plant lifeon Earth.
• explain how the atmosphere wasformed and how the ozone layer isin danger of being destroyed.
Build VocabularyUnderstand Terms Have studentsexplain how the stratosphere differsfrom the troposphere. Then have themuse the terms to write sentences.
INSTRUCTBellringerAsk students what images come to mindwhen they think of Earth’s atmosphere.Ask: Do you usually think about theatmosphere as just containing thebottom layer where weather occurs?(Answers will vary.) Do you know whatthat layer is called? (troposphere) Doyou know how many other layersthere are? (three other layers)Logical
Build Science SkillsUsing a Chart Discuss the role ofoxygen and carbon dioxide in Earth’satmosphere. Then have volunteers drawa cause-and-effect chart on the board toshow the cycle of how gases are createdand used by humans and plants.Visual
L2
L12
L2
Reading Focus
1
Although the entire troposphere containsoxygen, the amount of oxygen varies atdifferent altitudes. The summit of MountEverest is the highest point on Earth,measuring about 8.8 km high. At that level,oxygen levels are extremely low, which makes
climbing Everest very dangerous. If climbersdo not get enough oxygen, they becomedizzy and disoriented. Today, climbing teamscarry tanks of oxygen with them in theirefforts to reach the summit.
Facts and Figures
HSES_1eTE_C17.qxd 5/16/04 1:30 PM Page 494
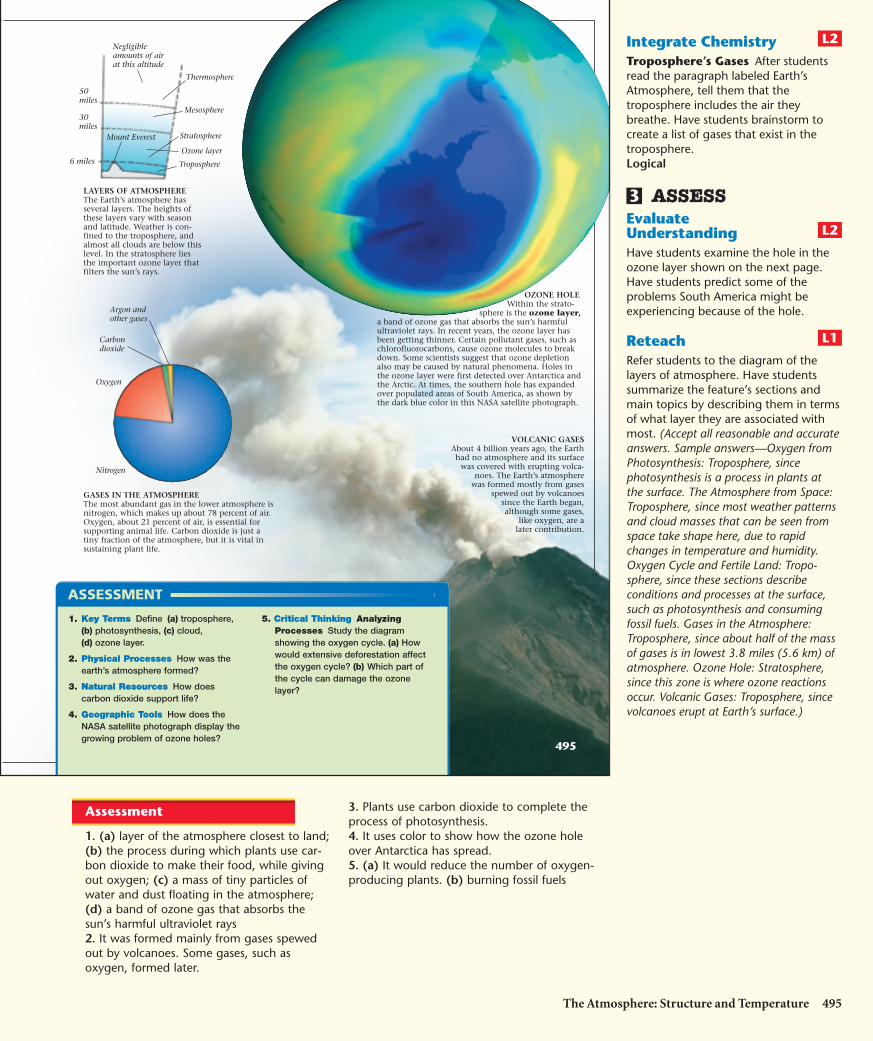
GASES IN THE ATMOSPHEREThe most abundant gas in the lower atmosphere isnitrogen, which makes up about 78 percent of air.Oxygen, about 21 percent of air, is essential forsupporting animal life. Carbon dioxide is just atiny fraction of the atmosphere, but it is vital insustaining plant life.
LAYERS OF ATMOSPHEREThe Earth’s atmosphere hasseveral layers. The heights ofthese layers vary with seasonand latitude. Weather is con-fined to the troposphere, andalmost all clouds are below thislevel. In the stratosphere liesthe important ozone layer thatfilters the sun’s rays.
OZONE HOLEWithin the strato-
sphere is the ozone layer,a band of ozone gas that absorbs the sun’s harmfulultraviolet rays. In recent years, the ozone layer hasbeen getting thinner. Certain pollutant gases, such aschlorofluorocarbons, cause ozone molecules to breakdown. Some scientists suggest that ozone depletionalso may be caused by natural phenomena. Holes inthe ozone layer were first detected over Antarctica andthe Arctic. At times, the southern hole has expandedover populated areas of South America, as shown bythe dark blue color in this NASA satellite photograph.
VOLCANIC GASESAbout 4 billion years ago, the Earthhad no atmosphere and its surface
was covered with erupting volca-noes. The Earth’s atmosphere
was formed mostly from gasesspewed out by volcanoes
since the Earth began,although some gases,
like oxygen, are alater contribution.
1. Key Terms Define (a) troposphere,(b) photosynthesis, (c) cloud,(d) ozone layer.
2. Physical Processes How was theearth’s atmosphere formed?
3. Natural Resources How doescarbon dioxide support life?
4. Geographic Tools How does theNASA satellite photograph display thegrowing problem of ozone holes?
5. Critical Thinking AnalyzingProcesses Study the diagramshowing the oxygen cycle. (a) Howwould extensive deforestation affectthe oxygen cycle? (b) Which part ofthe cycle can damage the ozonelayer?
495
Integrate ChemistryTroposphere’s Gases After studentsread the paragraph labeled Earth’sAtmosphere, tell them that thetroposphere includes the air theybreathe. Have students brainstorm tocreate a list of gases that exist in thetroposphere.Logical
ASSESSEvaluateUnderstandingHave students examine the hole in theozone layer shown on the next page.Have students predict some of theproblems South America might beexperiencing because of the hole.
ReteachRefer students to the diagram of thelayers of atmosphere. Have studentssummarize the feature’s sections andmain topics by describing them in termsof what layer they are associated withmost. (Accept all reasonable and accurateanswers. Sample answers—Oxygen fromPhotosynthesis: Troposphere, sincephotosynthesis is a process in plants atthe surface. The Atmosphere from Space:Troposphere, since most weather patternsand cloud masses that can be seen fromspace take shape here, due to rapidchanges in temperature and humidity.Oxygen Cycle and Fertile Land: Tropo-sphere, since these sections describeconditions and processes at the surface,such as photosynthesis and consumingfossil fuels. Gases in the Atmosphere:Troposphere, since about half of the massof gases is in lowest 3.8 miles (5.6 km) ofatmosphere. Ozone Hole: Stratosphere,since this zone is where ozone reactionsoccur. Volcanic Gases: Troposphere, sincevolcanoes erupt at Earth’s surface.)
L1
L2
3
L2
The Atmosphere: Structure and Temperature 495
3. Plants use carbon dioxide to complete theprocess of photosynthesis.4. It uses color to show how the ozone holeover Antarctica has spread.5. (a) It would reduce the number of oxygen-producing plants. (b) burning fossil fuels
Assessment
1. (a) layer of the atmosphere closest to land;(b) the process during which plants use car-bon dioxide to make their food, while givingout oxygen; (c) a mass of tiny particles ofwater and dust floating in the atmosphere;(d) a band of ozone gas that absorbs thesun’s harmful ultraviolet rays2. It was formed mainly from gases spewedout by volcanoes. Some gases, such asoxygen, formed later.
HSES_1eTE_C17.qxd 9/24/04 7:08 PM Page 495