hsice simulation guide mixed signal chip design lab department of computer science & engineering...
TRANSCRIPT
HSICE Simulation GuideHSICE Simulation Guide
Mixed Signal Chip Design Lab
Department of Computer Science & Engineering
The Penn State Univ.

Jan. 26, 2006 Insoo Kim
HSPICE Input/Output Files & SuffixesHSPICE Input/Output Files & Suffixes
HSPICE Input input netlist .sp design configuration .cfg initialization hspice.ini
HSPICE Output run status .st0 output listing .lis initial condition .ic measure output .m*# (e.g. .mt0,mt1,.) Analysis data, transient .tr# (e.g. .tr0,tr1,.) Analysis data, dc .sw# (e.g. .sw0,sw1,.) Analysis data, ac .ac# (e.g. .ac0,ac1,.) Plot file .gr# (e.g. .gr0, gr1,..)
Note: # is either a sweep or a hardcopy file number.
Typical Invocations:
hspice design > design.lis
or...
hspice design.ckt > design.out
.lis file contains results of:
.print & .plot
.op (operating point)
.options (results)
Run time status
Depends on .Option Post

Jan. 26, 2006 Insoo Kim
Netlist Structure : Recommended FormatNetlist Structure : Recommended Format
Title
Controls
Sources
Components
Models & Subckts
*** This is a better netlist.options post acct opts node.tran 0.1 5 $ needs 5 seconds to settle.print v(6) i(r16).plot v(4) v(14) v(data)
* Voltage sourcesv4 4 0 dc 0 ac 0 0 pulse 0 1 0 .15 .15 .4 2vdata data 0 sin(1.0 1.0 1.0 0.0 1.0)v6 6 0 exp(1 0 .1 .02 .6 .2)
* ComponentsL6 6 16 .05c6 16 0 .05r16 16 0 40c4 4 14 .1L5 data 15 1c5 15 0 .2
.model ...
.end

Input ControlInput Control
.option
.param
.alter
.model
.Lib
Jan. 26, 2006 Insoo Kim
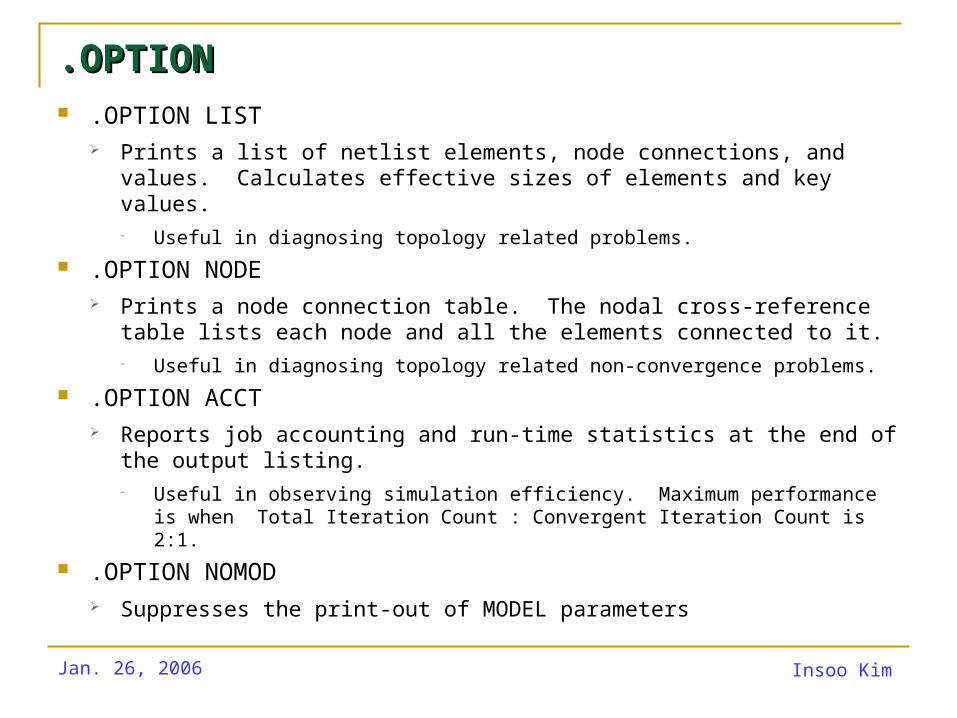
.OPTION.OPTION .OPTION LIST
Prints a list of netlist elements, node connections, and values. Calculates effective sizes of elements and key values. Useful in diagnosing topology related problems.
.OPTION NODE Prints a node connection table. The nodal cross-reference table lists
each node and all the elements connected to it. Useful in diagnosing topology related non-convergence problems.
.OPTION ACCT Reports job accounting and run-time statistics at the end of the output
listing. Useful in observing simulation efficiency. Maximum performance is when
Total Iteration Count : Convergent Iteration Count is 2:1.
.OPTION NOMOD Suppresses the print-out of MODEL parameters

Jan. 26, 2006 Insoo Kim
.OPTION.OPTION
.OPTION POST PROBE Graph nodal voltages, element currents, circuit response,
algebraic expressions from transient analysis, DC sweeps, AC analysis
Requesting Graph Data Format .OPTION POST (binary) .OPTION POST=2 (ASCII, platform independent)
.PROBE Write directly to the Graph Data File (without writing to the .LIS file) Limit data in Graph Data file to that specified
in .PRINT, .PLOT, .PROBE, .GRAPH

Jan. 26, 2006 Insoo Kim
.OPTION.OPTION
.OPTION SCALE profound effect on element parameter values. Geometric ELEMENT parameters (L, W, area, etc) Global works for MOSFETs, DIODEs, and JFETs
.OPTION SCALE=<value> .OPTION SCALE=1e-6
Local works for Passive Values Passive Devices are NOT affected by .OPTION SCALE
Cshunt 5 0 1u SCALE=10 (Result=10u) Labc 10 0 1u SCALE=10 (Result=10u)
Warning:
.OPTION SCALE=1e-6
M1 Vdd 10 20 0 mymodel L=1u W=1u
Results in L=1e-12 and W=1e-12!!!
.OPTION SCALE defaults to 1meter
Jan. 26, 2006 Insoo Kim
.PARAM.PARAM
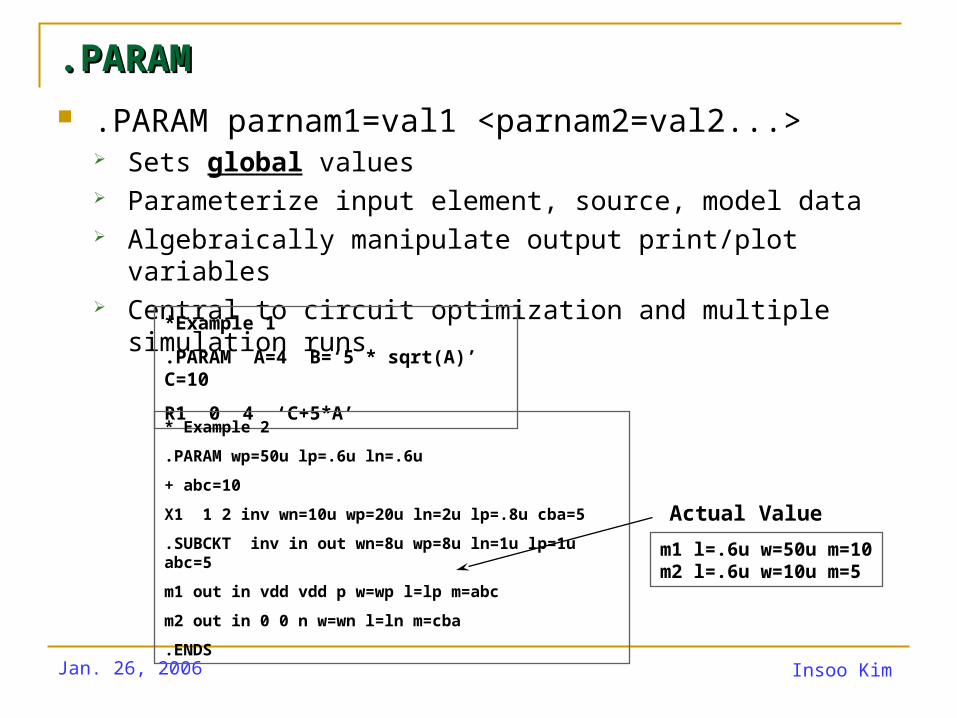
.PARAM parnam1=val1 <parnam2=val2...> Sets global values Parameterize input element, source, model data Algebraically manipulate output print/plot variables Central to circuit optimization and multiple simulation runs
*Example 1
.PARAM A=4 B=‘5 * sqrt(A)’ C=10
R1 0 4 ‘C+5*A’* Example 2
.PARAM wp=50u lp=.6u ln=.6u
+ abc=10
X1 1 2 inv wn=10u wp=20u ln=2u lp=.8u cba=5
.SUBCKT inv in out wn=8u wp=8u ln=1u lp=1u abc=5
m1 out in vdd vdd p w=wp l=lp m=abc
m2 out in 0 0 n w=wn l=ln m=cba
.ENDS
m1 l=.6u w=50u m=10m2 l=.6u w=10u m=5
Actual Value

Jan. 26, 2006 Insoo Kim
.PARAM.PARAM
Defining your own functions .param <function name>(arg1, <arg2>) = ‘parameter expr’
Nesting: WARNING!!! Does NOT work past 3 levels!!!
.param gain(out,in) = ‘v(out) / v(in)’
.print par(‘gain(2,1)’) ‘mygain’=par(‘gain(3,1)’)
.param X=2
.param squarit(a)=‘pow(a,2)’
+ fourth(b) =‘squarit(b) * squarit(b)’
+ sixteenth(c)=‘fourth(c) * fourth(c)’
.print ‘2nd’=par(‘squarit(X)’) ‘4th’=par(‘fourth(X)’) par(‘sixteenth(X)’)
2nd
4.0000
4th
16.0000
paramsixteenth(x)256.0000
HSPICEOutput
Jan. 26, 2006 Insoo Kim
.ALTER.ALTER .ALTER
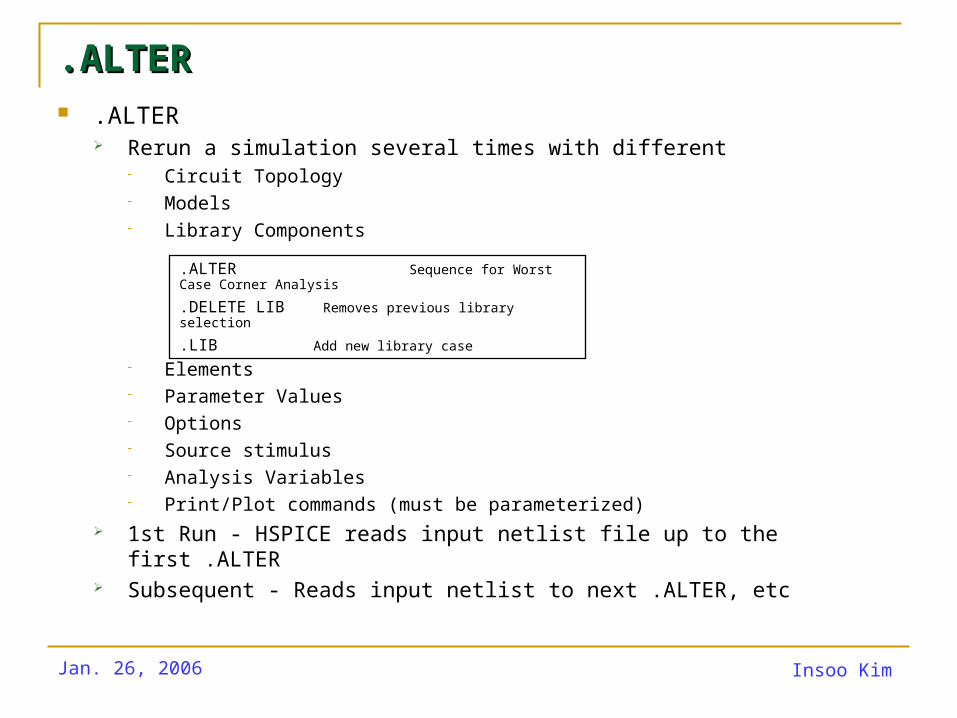
Rerun a simulation several times with different Circuit Topology Models Library Components
Elements Parameter Values Options Source stimulus Analysis Variables Print/Plot commands (must be parameterized)
1st Run - HSPICE reads input netlist file up to the first .ALTER Subsequent - Reads input netlist to next .ALTER, etc
.ALTER Sequence for Worst Case Corner Analysis
.DELETE LIB Removes previous library selection
.LIB Add new library case

Jan. 26, 2006 Insoo Kim
.ALTER.ALTER
Limitations: CAN include
Element Statements (except source) .DATA, .LIB, .DEL LIB, .INCLUDE, .MODEL statements .IC, .NODESET statements .OP, .OPTIONS, .PARAM, .TEMP, .TF, .TRAN, .DC, .AC
CANNOT include .PRINT, .PLOT, .GRAPH, or any other I/O statements
AVOID adding analysis statements under each .ALTER block. ( will cause huge penalty in simulation time and confusion in result outputting!)

Jan. 26, 2006 Insoo Kim
.ALTER.ALTER
Example Parameterize Source Statements
.PARAM A=4ns B=5ns
V1 VA GND PULSE (0v 5v 0ns A B 46.5ns 100ns)
V2 VB GND PULSE (0v 5v 0ns A B 96ns 200ns)
V3 VC GND PULSE (0v 5v 0ns A B 196.5ns 400ns)
.ALTER
.PARAM A=5ns B=6ns
.ALTER
.PARAM A=6ns B=7ns
.END

Jan. 26, 2006 Insoo Kim
.Model.Model .model Statement
.MODEL mname type <pname1=pval1 pname2=pval2 . . > mname Model name reference pname_I Parameter name pval_I Specifies the parameter value type Selects the model type, which must be one of the following:
Examples.model g nmos level=49***** Version Parameters+ hspver = 98.40 version = 3.20***** Geometry Range Parameters+ wmin = 0.64u wmax = 900.000u+ lmin = 0.28u lmax = 900.000u
OPT optimization model
PJF p-channel JFET model
PLOT plot model for the .GRAPH statement
PMOS p-channel MOFET model
PNP pnp BJT model
R resistor model
U lossy transmission line model (lumped)
W lossy transmission line model
SP S-Parameter
AMP operational amplifier model
C capacitor model
CORE magnetic core model
PMOS p-channel MOFET model
D diode model
L magnetic core mutual inductor model
NJF n-channel JFET model
NMOS n-channel MOFET model
NPN npn BJT model

Jan. 26, 2006 Insoo Kim
.Lib.Lib .LIB Library Call Statement
.LIB ‘<filepath>filename’ entryname entryname Entry name for the section of the library file to include filename Name of a file to include in the data file filepath Path to a file
.LIB Library File Definition Statement
.DEL LIB Statement .DEL LIB ‘<filepath>filename’ entryname
entryname Entry name used in the library call statement to be deleted filename Name of a file for deletion from the data file filepath Path name of a file, if the operating system
supports tree-structured directories
.LIB entryname1
<$ ANY VALID SET OF HSPICE STATEMENTS>
.ENDL entryname1
.LIB entryname2
<$ ANY VALID SET OF HSPICE STATEMENTS>
.ENDL entryname2

Jan. 26, 2006 Insoo Kim
.Lib.Lib
*Netlist R1 1 0 10k.lib ‘MyProcess.lib’ TTM1 1 1 2 0 nchan.end
* MyProcess.lib file
.lib TT $ typical process.param TOX_8=230 ....include ‘/usr/lib/cmos1.dat’.endl TT
.lib FF $ fast process
.param TOX_8=200 ...
.include ‘/usr/lib/cmos1.dat’
.endl FF
* file: /usr/lib/cmos1.dat.model nchan+ level=13 ...+ tox=tox_8
Output ControlOutput Control
.measure
Jan. 26, 2006 Insoo Kim
.PRINT.PRINT
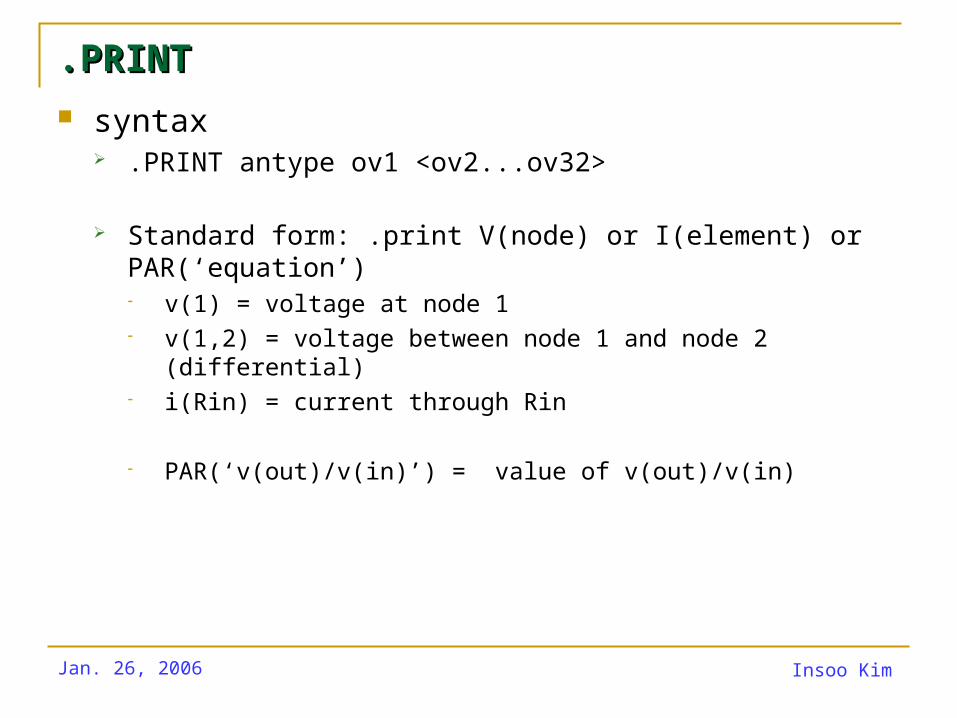
syntax .PRINT antype ov1 <ov2...ov32>
Standard form: .print V(node) or I(element) or PAR(‘equation’) v(1) = voltage at node 1 v(1,2) = voltage between node 1 and node 2 (differential) i(Rin) = current through Rin
PAR(‘v(out)/v(in)’) = value of v(out)/v(in)

Jan. 26, 2006 Insoo Kim
.PRINT.PRINT*** ID-Vds curve temp=0 nmos w=50 l=0.4 dbp011 ***.option nomod nopage acct wl scale=0.87u co=132.temp 25.inc '/home/users2/kyusun/model/model_typ'.param pa_vgs=4.0v
.dc vds 0v 4.5v 0.5v
vds vds gndvgs vg gnd pa_vgsvbb vbb gnd -1.0v
mnmos vds vg gnd vbb g w=0.36 l=0.27r1 vds vs_im 10kr2 vs_im gnd 10k
.print i(mnmos)
.end
Input file
Print value of current through element ‘mnmos’
Jan. 26, 2006 Insoo Kim
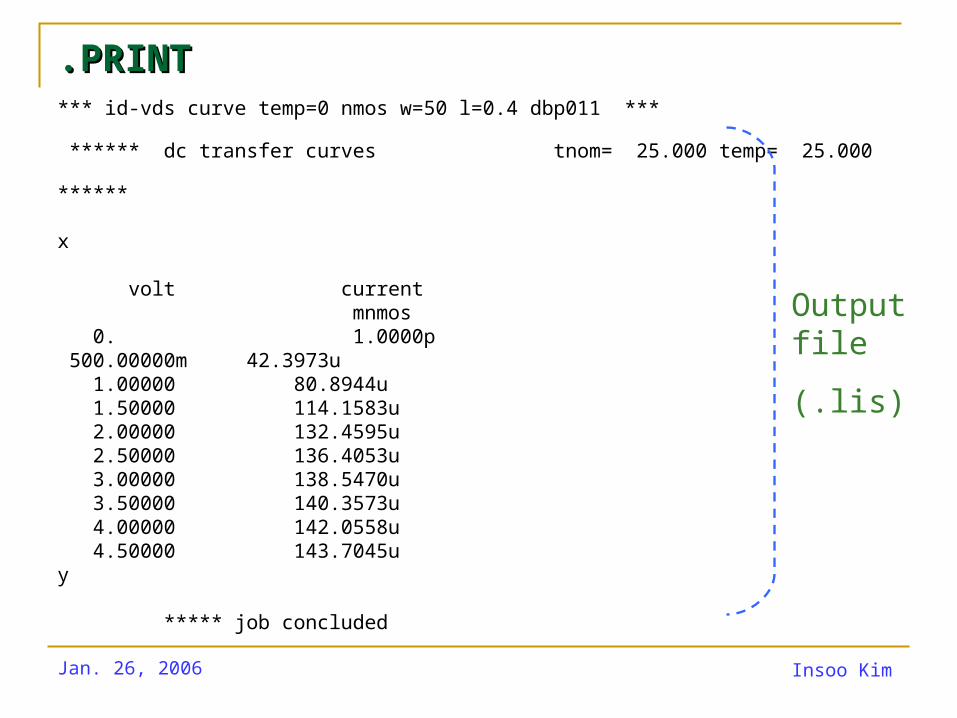
.PRINT.PRINT*** id-vds curve temp=0 nmos w=50 l=0.4 dbp011 *** ****** dc transfer curves tnom= 25.000 temp= 25.000 ******
x volt current mnmos 0. 1.0000p 500.00000m 42.3973u 1.00000 80.8944u 1.50000 114.1583u 2.00000 132.4595u 2.50000 136.4053u 3.00000 138.5470u 3.50000 140.3573u 4.00000 142.0558u 4.50000 143.7045u y
***** job concluded
Output file
(.lis)

Jan. 26, 2006 Insoo Kim
.MEASURE.MEASURE
.MEASURE Print user-defined electrical specifications of a circuit. .MEASURE is a post processor Seven Fundamental Measurement modes:
Rise, Fall, Delay Average, RMS, Min, Max, & Peak-to-Peak Find-When Equation Evaluation Derivative Evaluation Integral Evaluation Relative Error

Jan. 26, 2006 Insoo Kim
.MEASURE.MEASURE .MEASURE <DC | TRAN | AC> result TRIG TARG
<optimization options> result - name given the measured value in the HSPICE® output. TRIG trig_var VAL=trig_val <TD=timedelay> <CROSS=#of>
<RISE=#of> +<FALL=#of> TRIG AT=value TARG targ_var VAL=targ_val <TD=timedelay> <CROSS=#of |
LAST> +<RISE=#of | LAST> <FALLS=#of | LAST>
.MEAS TRAN TDLAY TRIG V(1) VAL=2.5 TD=10ns RISE=2
+ TARG V(2) VAL=2.5 FALL=2
Delay 10ns
...
...
2.5v
2.5v
TDLAY
V(1)
V(2)

Jan. 26, 2006 Insoo Kim
.MEASURE.MEASURE
.MEASURE <DC | TRAN | AC> result func out_var <FROM=val> <TO=val> <optimization options> func: AVG, RMS, MIN, MAX, PP result: name given the measured value in the HSPICE® output out_var: name of the output variable to be measured.
Examples .MEAS TRAN avgval AVG V(10) From=10ns To=55ns
Print out average nodal voltage of node 10 during tran time 10 to 55ns. Print as “avgval”
.MEAS TRAN maxval MAX V(1,2) From=15ns To=100ns Find the maximum voltage difference between nodes 1 and 2 from
time 15ns to 100ns. Print as “maxval”.

Jan. 26, 2006 Insoo Kim
.MEASURE.MEASURE FIND-WHEN
Allows any independent variables (time, freq, parameter), by using WHEN syntax, or any dependent variables (voltage, current, etc), by using FIND-WHENsyntax, to be measured when some specific event occurs.
.MEASURE <DC | TRAN | AC> result WHEN out_var=val <TD=val> +<RISE=#of> | LAST> <FALL=#of | LAST> <CROSS=#of | LAST> +<optimization options>
result - name given the measured value in the HSPICE® output file.
Example - when .MEAS TRAN fifth WHEN V(osc_out)=2.5v RISE=5
measure the time of the 5th rise of node “osc_out” at 2.5v. Report as “fifth” in listing.
Example - find - when .MEAS TRAN result FIND v(out) WHEN v(in)=40m
measure v(out) when v(in)=40m - store in variable result

Jan. 26, 2006 Insoo Kim
.MEASURE.MEASURE
Equation Evaluation Use this statement to evaluate an equation that can be a function
of the results of previous .Measure statements. The equation MUST NOT be a function of node voltages or
branch currents.
.MEASURE <DC | TRAN | AC> result PARAM=‘equation’ +<optimization options>
result - name given the measured value in the HSPICE® output file.
Example .MEAS TRAN Tmid PARAM=‘(T_from+T_to)/2’

Power SourcesPower Sources
Independent Sources
Jan. 26, 2006 Insoo Kim
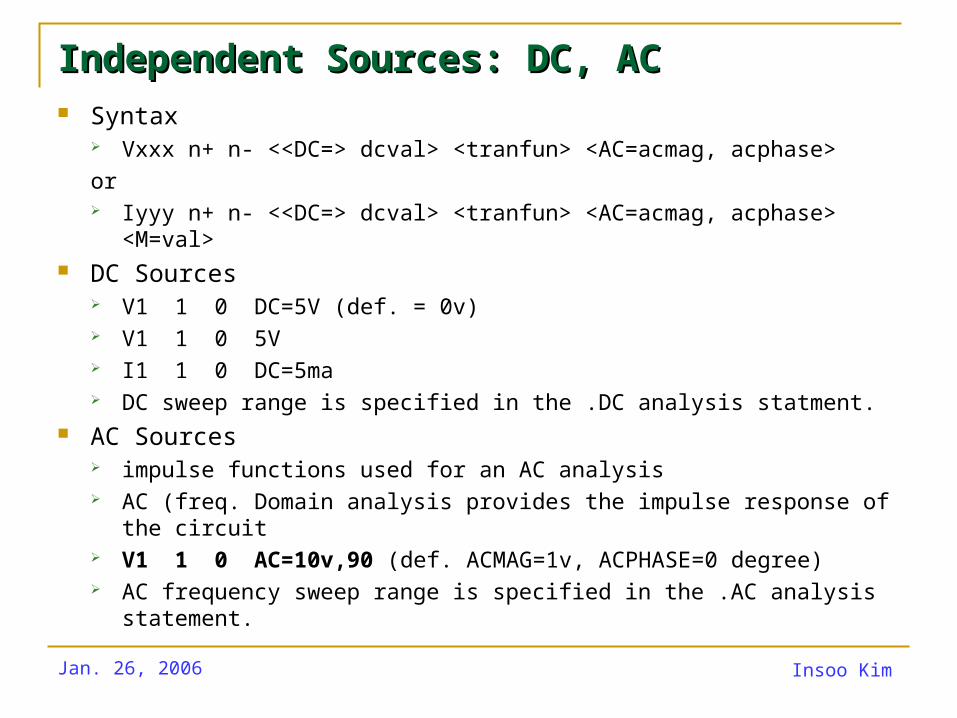
Independent Sources: DC, ACIndependent Sources: DC, AC Syntax
Vxxx n+ n- <<DC=> dcval> <tranfun> <AC=acmag, acphase>
or Iyyy n+ n- <<DC=> dcval> <tranfun> <AC=acmag, acphase> <M=val>
DC Sources V1 1 0 DC=5V (def. = 0v) V1 1 0 5V I1 1 0 DC=5ma DC sweep range is specified in the .DC analysis statment.
AC Sources impulse functions used for an AC analysis AC (freq. Domain analysis provides the impulse response of the circuit V1 1 0 AC=10v,90 (def. ACMAG=1v, ACPHASE=0 degree) AC frequency sweep range is specified in the .AC analysis statement.

Jan. 26, 2006 Insoo Kim
Independent Sources: TransientIndependent Sources: Transient
Time Varying (Transient) PULSE v1 v2 <td <tr <tf <pw <per>>>>
PULSE (v1 v2 <options> ) Eg) VIN 3 0 PULSE (-1 1 2ns 2ns 2ns 50ns 100ns)
V1,v2 must be defined
td delay from beginning of tran interval to 1st rise ramp. Def: 0.
tr rise time (default: TSTEP)
tf fall time (default: TSTEP)
pw pulse width (def: TSTEP)
per pulse period (def: TSTEP)
V1 1 0 pulse 0 5v 5ns 5ns 5ns 10ns 30ns
5 10 15 20 25 30 35
0
5per
td
tr tf
pw

Jan. 26, 2006 Insoo Kim
Independent Sources: PWLIndependent Sources: PWL
Piece-Wise Linear PWL t1 v1 <t2 v2 t3 v3...> <R <=repeat>> <TD=delay> PWL (t1 v1 <options>) PWL t1 I1 <t2 I2...> <options>
Value of source at intermediate values is determined by linear interpolation.
PL (ASPEC style) reverses order to voltage-time pairs.
VIN VGate 0 PWL (0 0v 5n 0v +10n 5v 13n 5v 15n 2.5v 22n 2.5v +25n 0 30n 0 R)
5 10 15 20 25 30 35
0
5

Jan. 26, 2006 Insoo Kim
Independent Transient SourcesIndependent Transient Sources: : SIN, MixedSIN, Mixed
SIN SIN vo va <freq <td <damping <phasedelay>>>> SIN (vo va <options> ) Examples:
VIN 3 0 SIN ( 0 1 100MEG 1ns 1e10) Damped sinusoidal source connected between nodes 3 and 0. 0v offset,
Peak of 1v, freq of 100 MHz, time delay of 1ns. Damping factor of 1e10. Phase delay (defaulted to 0) of 0 degrees.
Composite (Mixed) Specify source values for more than 1 type of analysis. Examples
VH 3 6 DC=2 AC=1,90 VCC 10 0 VCC PWL 0 0 10n VCC 15n VCC 20n 0 VIN 13 2 0.001 AC 1 SIN (0 1 1Meg)

AnalysisAnalysis
DC analysis
AC analysis
Transient analysis
Temperature analysis

Jan. 26, 2006 Insoo Kim
Analysis typesAnalysis types
Types and Order of Execution DC Operating (Bias) Point
First and most important job is to determine the DC steady state response (called the DC operating point)
DC Bias Point & DC Sweep Analysis .DC, .OP, .TF, .SENS
AC Bias Point & AC Frequency Sweep Analysis .AC, .NET, .Noise, .Distortion
Transient Bias Point & Transient Sweep Analysis .Trans, .Fourier, .OP <time>
Temperature Analysis .Temp
Advanced Modifiers: Monte Carlo, Optimization

Jan. 26, 2006 Insoo Kim
DC AnalysisDC Analysis
Getting DC Operating Point (Quiescent Point) is crucial before
performing DC or AC analysis
DC Operating point analysis have to be done before transient
analysis and/or AC analysis. Caps are OPEN, Inductors SHORT
Initialized by .IC, .NODESET, and Voltage Sources (time zero values)
5 DC Analysis & Operating Point Analysis Statements .DC Sweeps for power supply, temp, param, transfer curves
.OP Operating point is to be calculated at a specific time
.PZ Pole/Zero Analysis
.SENS DC small-signal sensitivities.
.TF DC small-signal transfer function

Jan. 26, 2006 Insoo Kim
.DC.DC .DC Statement - DC Sweep
.DC var1 start1 stop1 incr1 <var2 start2 stop2 incr2>
.DC var1 start1 stop1 incr1 <SWEEP var2 type np start2 stop2>
.DC var1 type np start1 stop1 <SWEEP DATA=datanm>
.DC DATA=datanm <SWEEP var2 start2 stop2 incr2>
.DC DATA=datanm var1 … Name of an independent voltage or current source,
any element or model parameter, or the keyword TEMP.
start1 … Starting voltage, current, element, model parameter,
or temperature values.
stop1 … Final voltage, current, element, model parameter,
or temperature values.
incr1 … Voltage, current, element, model parameter,
or temperature increment values.
SWEEP Indicates a second sweep has different type of variation
(DEC, OCT, LIN, POI, DATA statement) type Can be any of the following keywords: DEC, OCT, LIN, POI. np Number of points per decade
(or depending on the preceding keyword). DATA=datanm
Datanm is the reference name of a .DC statement
Jan. 26, 2006 Insoo Kim
.DC.DC
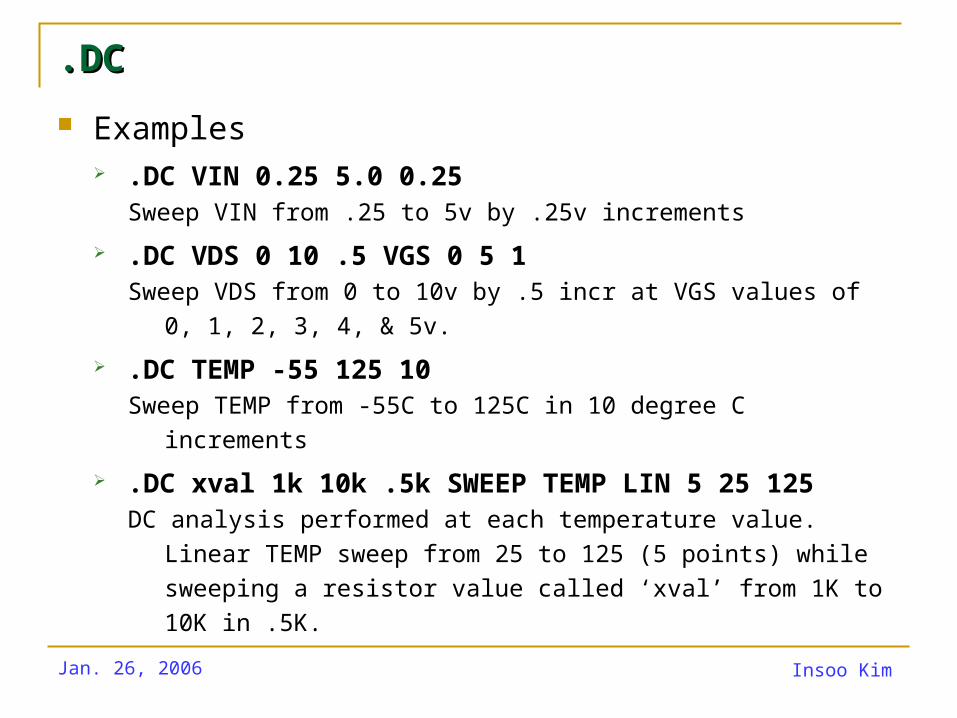
Examples .DC VIN 0.25 5.0 0.25
Sweep VIN from .25 to 5v by .25v increments
.DC VDS 0 10 .5 VGS 0 5 1Sweep VDS from 0 to 10v by .5 incr at VGS values of 0, 1, 2, 3, 4, & 5v.
.DC TEMP -55 125 10Sweep TEMP from -55C to 125C in 10 degree C increments
.DC xval 1k 10k .5k SWEEP TEMP LIN 5 25 125DC analysis performed at each temperature value. Linear TEMP sweep
from 25 to 125 (5 points) while sweeping a resistor value called ‘xval’
from 1K to 10K in .5K.

Jan. 26, 2006 Insoo Kim
.OP & .TF.OP & .TF
.OP <format> <time> <format> <time> (transient only) Calculating the operating point of MOSFETs at the specific time Reports:
Node voltages, Source Currents Power Dissipation at the Operating Point Semiconductor device currents, conductance, capacitances
.TF Outvar INSRC Calculating Small-signal DC gain, input resistance, output
resistance Examples
.TF V(4) V(1) DC Gain : V(4) / V(1) Input resistance : resistance value b/w node 1 and node 0 Ouput resistance : resistance value b/w node 4 and node 0
Jan. 26, 2006 Insoo Kim
AC AnalysisAC Analysis Analyze Frequency Response
After doing .OP analysis, HSPICE conducting AC analysis of the nonlinear device, such as MOSFET, at the DC operating point.
Includes white Noise Calculation considering resistors, semiconductor device
Flicker noise estimation AC Analysis Statements
.AC Compute output variables as a function of frequency .NOISE Noise Analysis .DISTO Distortion Analysis .NET Network analysis .SAMPLE Sampling Noise
.AC Sweep Statements: Frequency, Element Value, Temperature, Model parameter Value Random Sweep (Monte Carlo), Optimization and AC Design Analysis
Jan. 26, 2006 Insoo Kim
.AC.AC AC Sweep
.AC type np fstart fstop .AC type np fstart fstop <SWEEP var start stop incr>
.AC type np fstart fstop <SWEEP DATA=datanm> .AC DATA=datanm
fstart Starting frequency fstop Final frequency var Name of an independent voltage or current source,
any element or model parameter, or the keyword TEMP. start Starting voltage, current, element, model parameter,
or temperature values. stop Final voltage, current, element, model parameter,
or temperature values. incr Voltage, current, element, model parameter,
or temperature increment values. SWEEP Indicates a second sweep is specified in the .AC
statement.
Jan. 26, 2006 Insoo Kim
.AC.AC
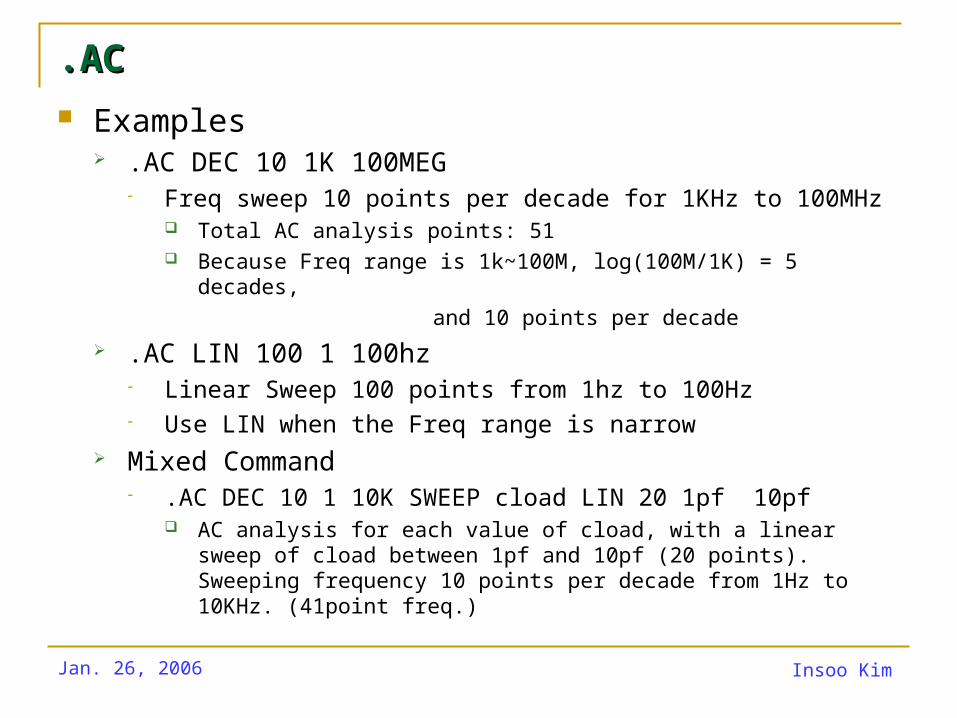
Examples .AC DEC 10 1K 100MEG
Freq sweep 10 points per decade for 1KHz to 100MHz Total AC analysis points: 51 Because Freq range is 1k~100M, log(100M/1K) = 5 decades,
and 10 points per decade
.AC LIN 100 1 100hz Linear Sweep 100 points from 1hz to 100Hz Use LIN when the Freq range is narrow
Mixed Command .AC DEC 10 1 10K SWEEP cload LIN 20 1pf 10pf
AC analysis for each value of cload, with a linear sweep of cload between 1pf and 10pf (20 points). Sweeping frequency 10 points per decade from 1Hz to 10KHz. (41point freq.)

Jan. 26, 2006 Insoo Kim
Transient AnalysisTransient Analysis
Transient Analysis StatementsCompute circuit solution as a function of time over a time range
.TRAN Statement Can be Used for: Transient Operating Point (eg. .OP 20n) Transient Temperature Sweep Transient Monte Carlo Analysis (random sweep) Transient Parameter Sweep Transient Optimization
Taking .OP results as a initial value for Transient Analysis

Jan. 26, 2006 Insoo Kim
.TRAN.TRAN .TRAN Statement
.TRAN tincr1 tstop1 <tincr2 tstop2...> <START=val> <UIC> + <SWEEP..> .TRAN var1 START=start1 STOP=stop1 STEP=incr1 .TRAN var1 START=start1 STOP=stop1 STEP=incr1
+ <SWEEP var2 type np start2 stop2> .TRAN tincr1 tstop1 <tincr2 tstop2<tincr3 tstop3>….> <START=val> .TRAN tincr1 tstop1 <tincr2 tstop2<tincr3 tstop3>….> <START=val>
+ <SWEEP var2 pstart pstop pincr> .TRAN DATA=datanm .TRAN var1 START=start1 STOP=stop1 STEP=incr1
+ <SWEEP DATA=datanm> .TRAN DATA=datanm <SWEEP var2 pstart pstop pincr>
UIC Calculates the initial transient conditions, rather than solving for the quiescent operating point

Jan. 26, 2006 Insoo Kim
.TRAN.TRAN tincr1 Printing/plotting increment for printer output, and the suggested
computing increment for the postprocessor tstop1 Time at which the transient analysis stops incrementing by
tincr1 var Name of an independent voltage or current source,
any element or model parameter, or the keyword TEMP. pstart Starting voltage, current, element, model parameter,
or temperature values. pstop Final voltage, current, element, model parameter,
or temperature values. pincr Voltage, current, element, model parameter,
or temperature increment values. START Time at which printing/plotting begins SWEEP Indicates a second sweep is specified on the .TRAN statement np Number of points per decade
(or depending on the preceding keyword). DATA=datanm Datanm is the reference name of a .TRAN statement type Can be any of the following keywords: DEC, OCT, LIN, POI.
Jan. 26, 2006 Insoo Kim
.TRAN.TRAN
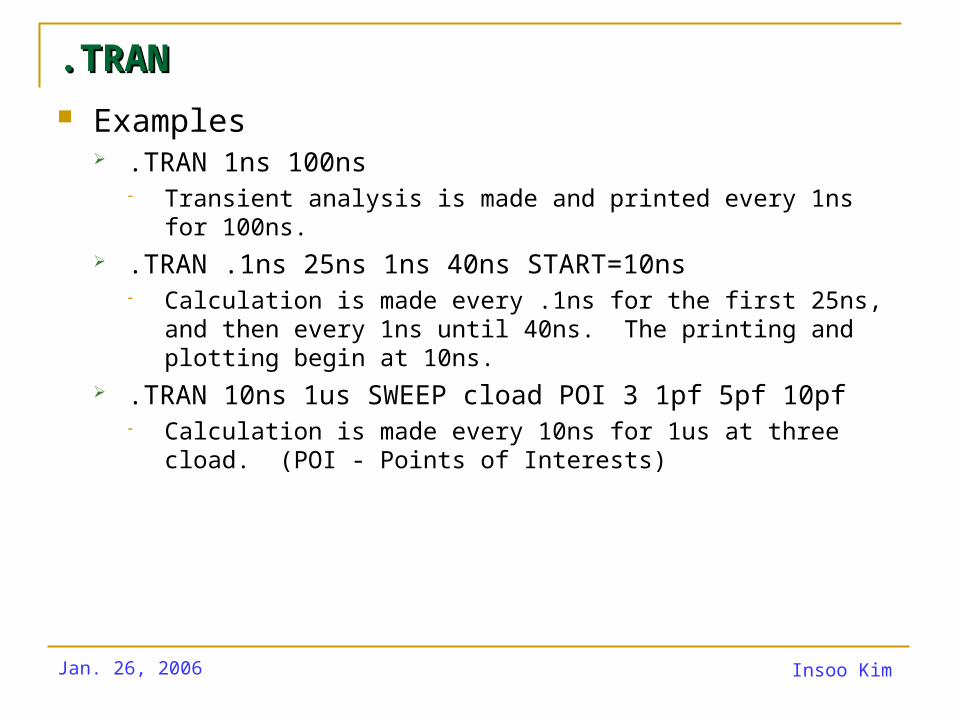
Examples .TRAN 1ns 100ns
Transient analysis is made and printed every 1ns for 100ns. .TRAN .1ns 25ns 1ns 40ns START=10ns
Calculation is made every .1ns for the first 25ns, and then every 1ns until 40ns. The printing and plotting begin at 10ns.
.TRAN 10ns 1us SWEEP cload POI 3 1pf 5pf 10pf Calculation is made every 10ns for 1us at three cload. (POI - Points
of Interests)
ExamplesExamples
Transient Analysis
AC Analysis

Jan. 26, 2006 Insoo Kim
Transient AnalysisTransient Analysis*** HSPICE Netlist file for DIFF AMP Transient Analysis*** Created by ikim
.option post
.option ACC=1 BRIEF=1
.param VDD=5.0v
.global VDD!
.temp 25
.op
.tans 0.1ns 100ns
.print i(M5)
.meas avgpow avg power from t1 to t2
.meas maxpow max power from t1 to t2
.param t1=10n
.param t2=90n
*** Source ****VVDD! VDD! 0 VDDVINn INn 0 pu 2.3v 2.7v 0n 0.1n 0.1ns 4.9ns 10nsVINp INp 0 dc 2.5vVb Vb 0 1.15vCout out 1fF
*** Components ***.inc ‘./diff_amp.net’.model ‘/home/users2/kyusun/tool/model/libcmos050t22a.sp’ CMOS1
.end

Jan. 26, 2006 Insoo Kim
AC AnalysisAC Analysis*** HSPICE Netlist file for DIFF AMP Frequency Analysis*** Created by ikim
.option post
.option ACC=1 BRIEF=1
.param VDD=5.0v
.global vdd! Gnd
.temp 25
.dc
.pz v(out) vinn
.ac dec 10 1k 10giga
*** Source ****VVDD! VDD! 0 VDDVINn INn 0 dc 2.5v ac 1, 180VINp INp 0 dc 2.5v ac 1Vb Vb 0 1.15vCout out 1fF
*** Components ***.inc ‘./diff_amp.net’.model ‘/home/users2/kyusun/tool/model/libcmos050t22a.sp’ CMOS1
.end