judith l. meece, unc-ch matthew irvin, unc-ch robert petrin, penn state univ. kai schafft, penn...
TRANSCRIPT
Judith L. Meece, UNC-CHMatthew Irvin, UNC-CHRobert Petrin, Penn State Univ.Kai Schafft, Penn State Univ.
Overview ofRural High SchoolAspirations Study
U.S. Department of Education, Institute of Educational SciencesResearch and Development Center Grant R305A040056-06
Collaborators
Thomas W. Farmer, Co-Principal InvestigatorSoo-yong Byun, Postdoctoral ScholarBryan Hutchins, Research Associate
Kimberly Dadisman, InvestigatorDylan Robertson, Investigator
Glen Elder, InvestigatorVonnie McLoyd, Investigator
Objectives of Overview
•Describe aims and design of Rural HSA Project;
•Present information on rural youth’s adult aspirations;
•Present information on educational barriers of rural youth;
•Present information on influence of community context on youths’ future aspirations;
•Discuss the implications of the research for school programs and school-community relations.
Aims of Rural HSA Study
To generate new information about rural high school students’ educational, vocational, and residential plans and aspirations for the future;
To assess rural high school students’ preparatory activities and planning for postsecondary education, work, and adult life;
To examine the impact of school experiences, geographical location, economic status, cultural or ethnic origins, family background, peer relations, and community characteristics on rural students’ aspirations and preparatory activities.
Giving a Voice to Rural Schools
“A lot of our students don’t think they have a future. Its hard to motivate them.” (School Guidance Counselor)
“We moved to a rural community to escape city schools. There is a lot that city schools can learn from rural schools.” (Parent of Participant)
“I plan to be a millionaire and to be very successful. Thank you for coming to our school.” (High School Student)

Design of RHSA Study
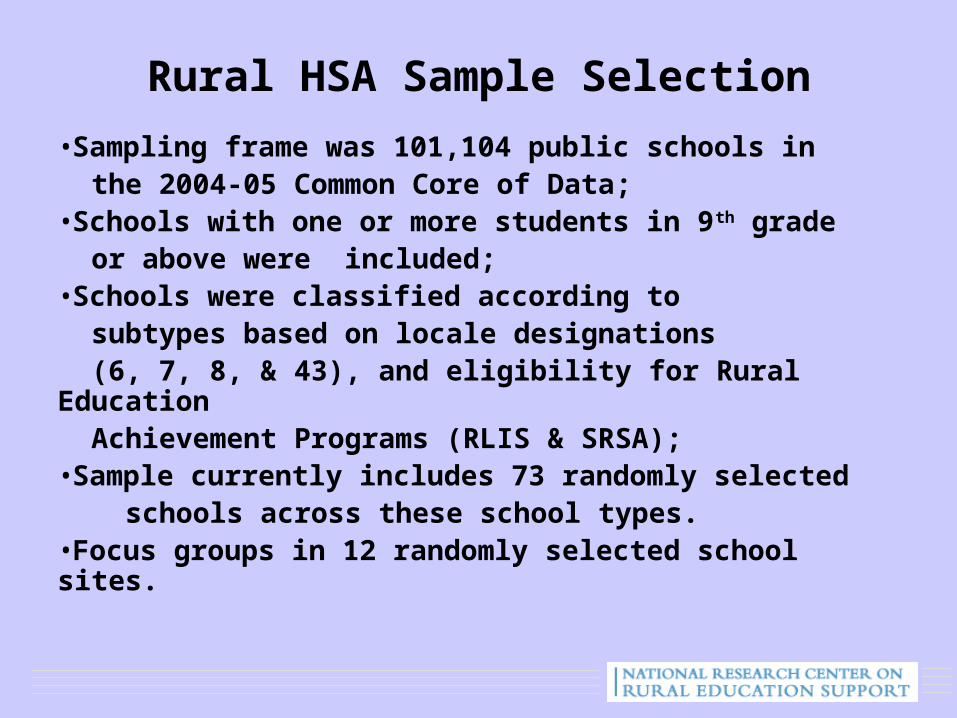
Rural HSA Sample Selection
•Sampling frame was 101,104 public schools in the 2004-05 Common Core of Data;•Schools with one or more students in 9th grade or above were included;•Schools were classified according to subtypes based on locale designations (6, 7, 8, & 43), and eligibility for Rural Education Achievement Programs (RLIS & SRSA);•Sample currently includes 73 randomly selected schools across these school types.•Focus groups in 12 randomly selected school sites.
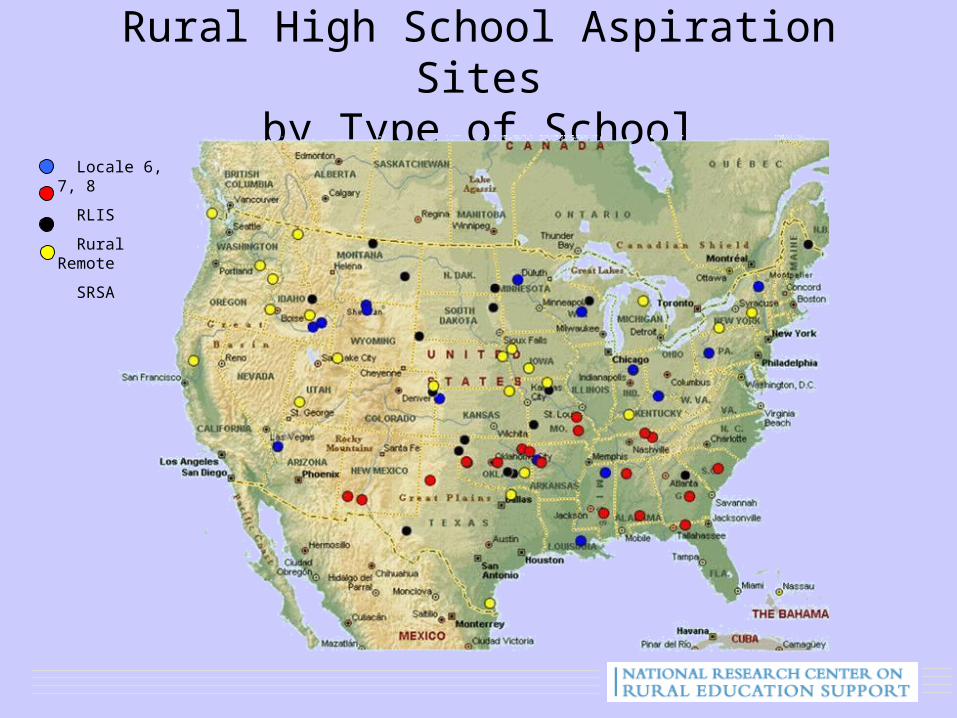
Rural High School Aspiration Sitesby Type of School
Locale 6, 7, 8
RLIS
Rural Remote
SRSA
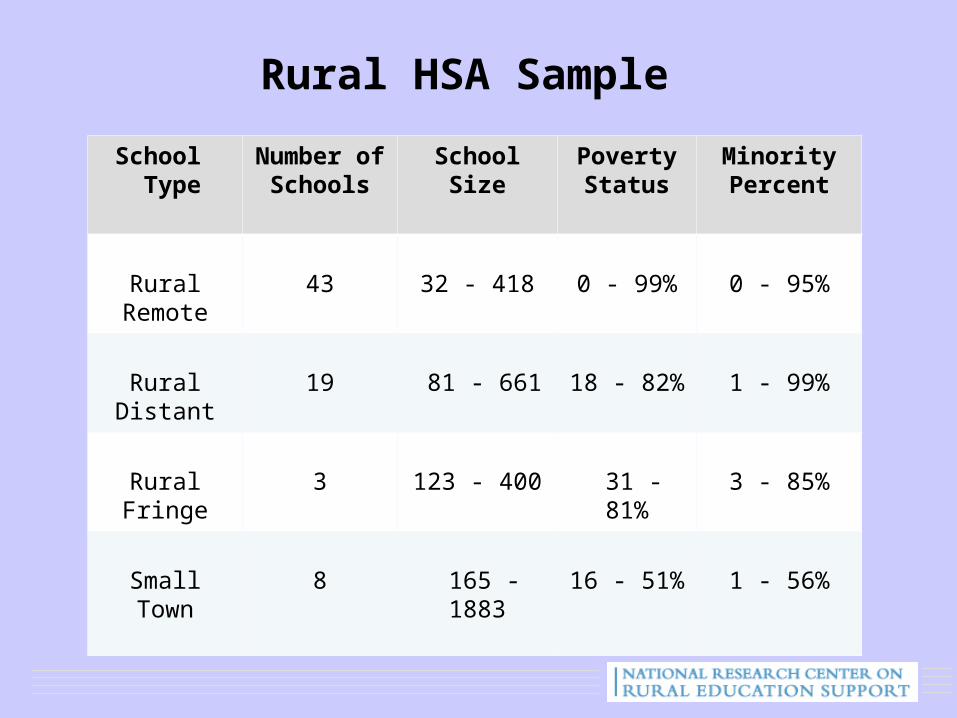
Rural HSA Sample
School Type
Number ofSchools
SchoolSize
PovertyStatus
MinorityPercent
Rural Remote 43 32 - 418 0 - 99% 0 - 95%
Rural Distant 19 81 - 661 18 - 82% 1 - 99%
Rural Fringe 3
123 - 400 31 - 81% 3 - 85%
Small Town 8 165 - 1883 16 - 51% 1 - 56%
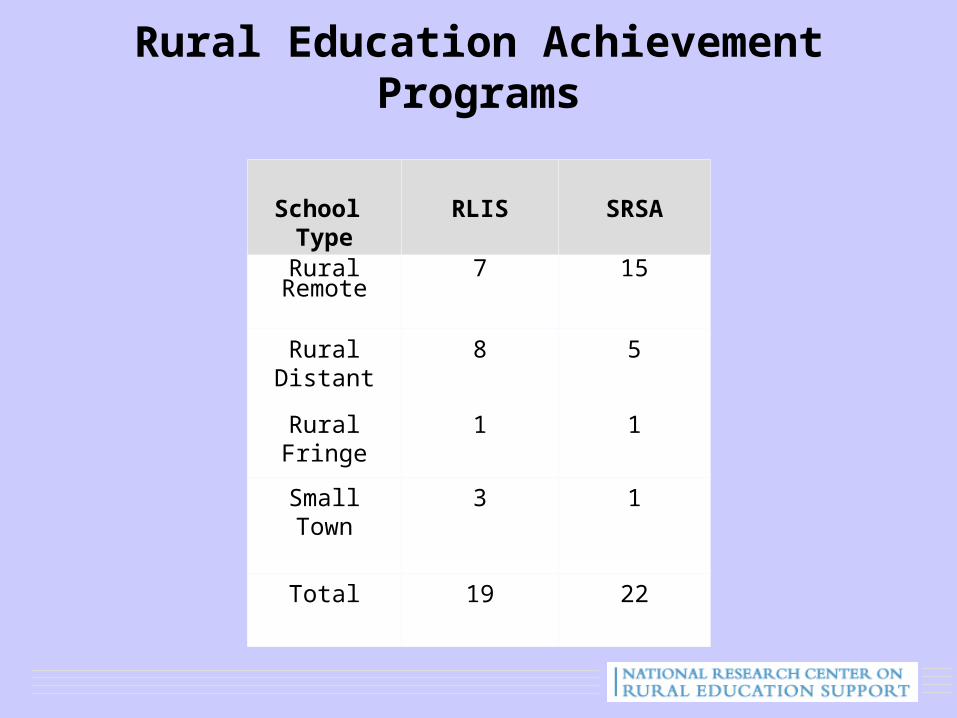
Rural Education Achievement Programs
School Type RLIS SRSA
Rural Remote 7 15
Rural Distant 8 5
Rural Fringe 1 1
Small Town 3 1
Total 19 22
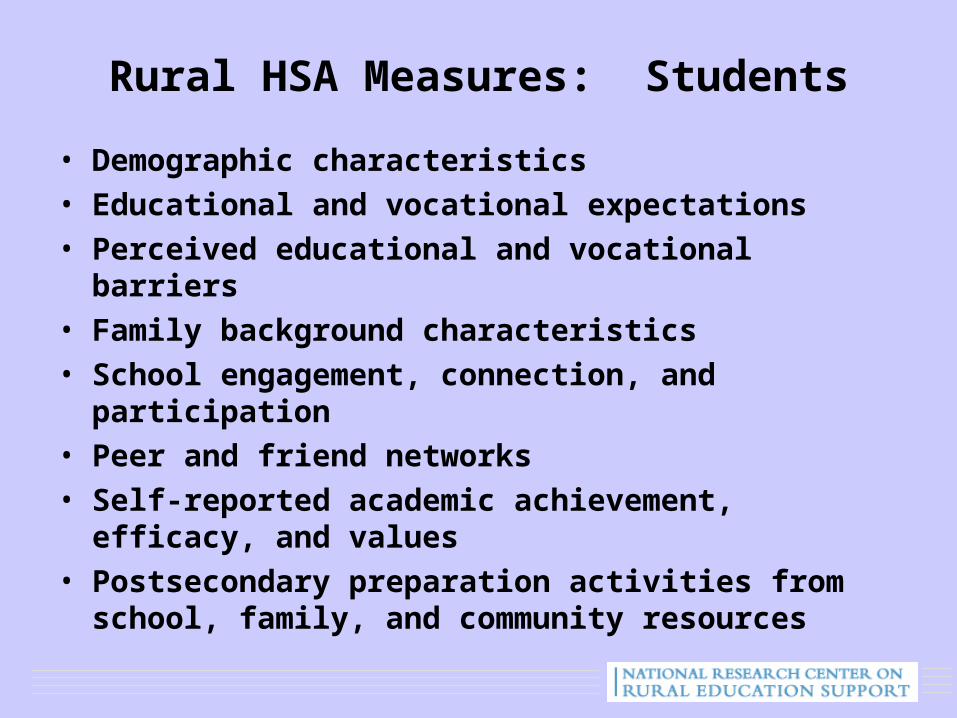
Rural HSA Measures: Students
• Demographic characteristics• Educational and vocational expectations• Perceived educational and vocational barriers• Family background characteristics• School engagement, connection, and participation• Peer and friend networks• Self-reported academic achievement, efficacy, and
values• Postsecondary preparation activities from school,
family, and community resources
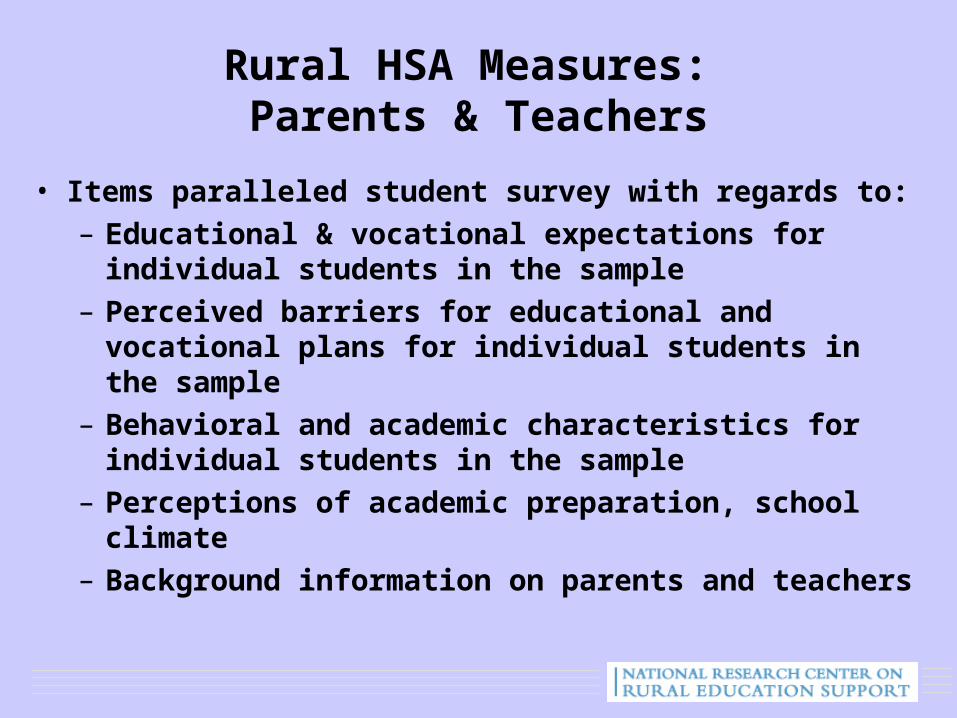
Rural HSA Measures: Parents & Teachers
• Items paralleled student survey with regards to:– Educational & vocational expectations for individual
students in the sample– Perceived barriers for educational and vocational
plans for individual students in the sample– Behavioral and academic characteristics for
individual students in the sample– Perceptions of academic preparation, school climate– Background information on parents and teachers
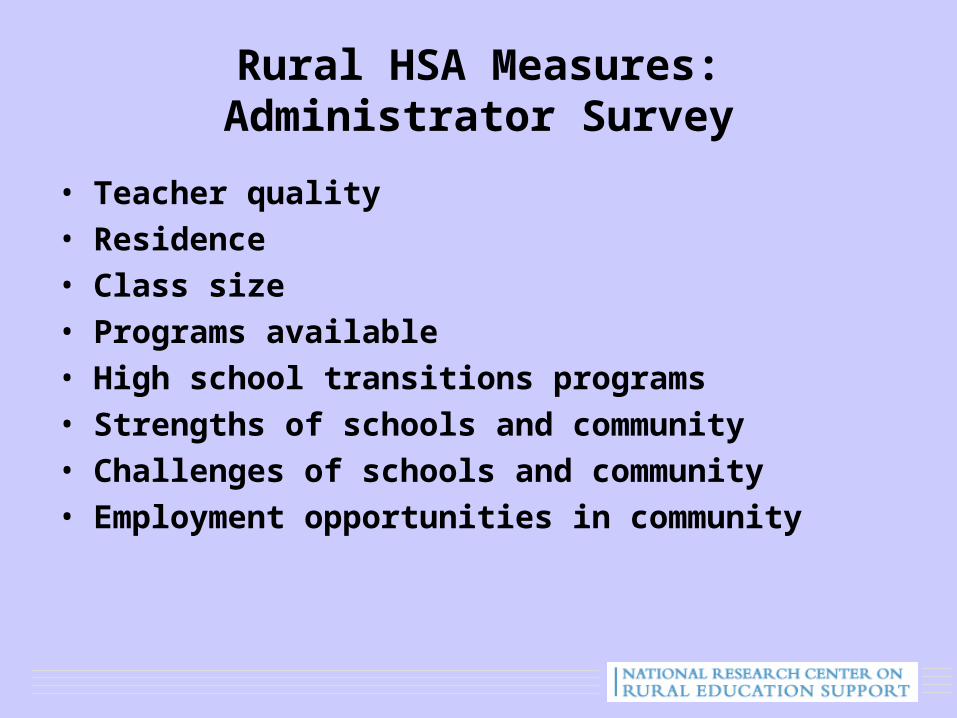
Rural HSA Measures:Administrator Survey
• Teacher quality• Residence• Class size• Programs available• High school transitions programs• Strengths of schools and community• Challenges of schools and community• Employment opportunities in community
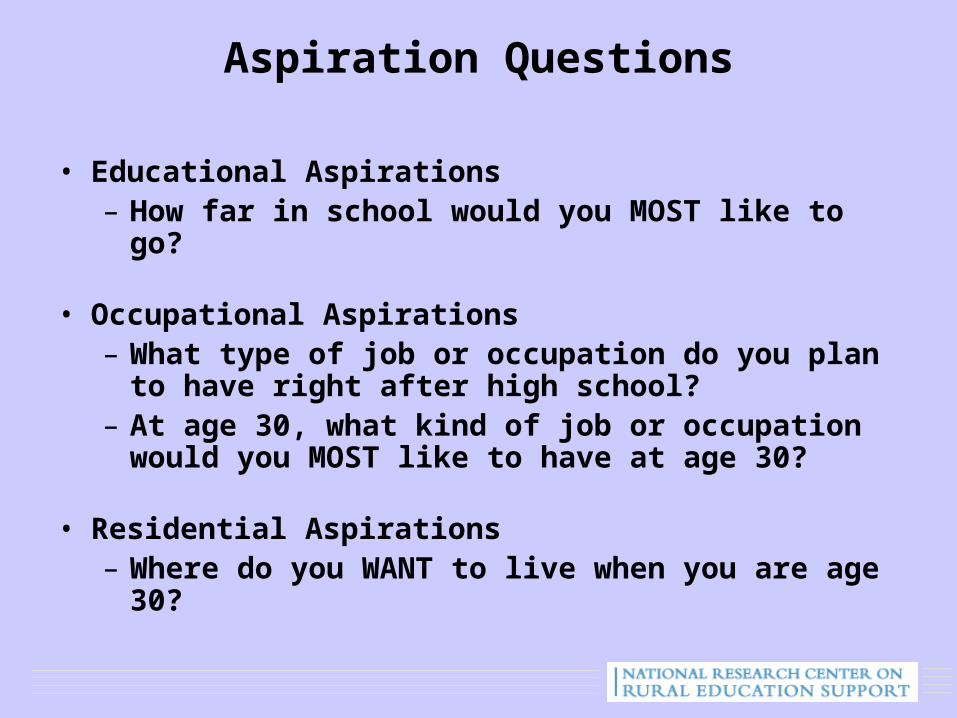
Aspiration Questions
• Educational Aspirations– How far in school would you MOST like to go?
• Occupational Aspirations– What type of job or occupation do you plan to
have right after high school?– At age 30, what kind of job or occupation would
you MOST like to have at age 30?
• Residential Aspirations– Where do you WANT to live when you are age 30?
Educational Aspirations
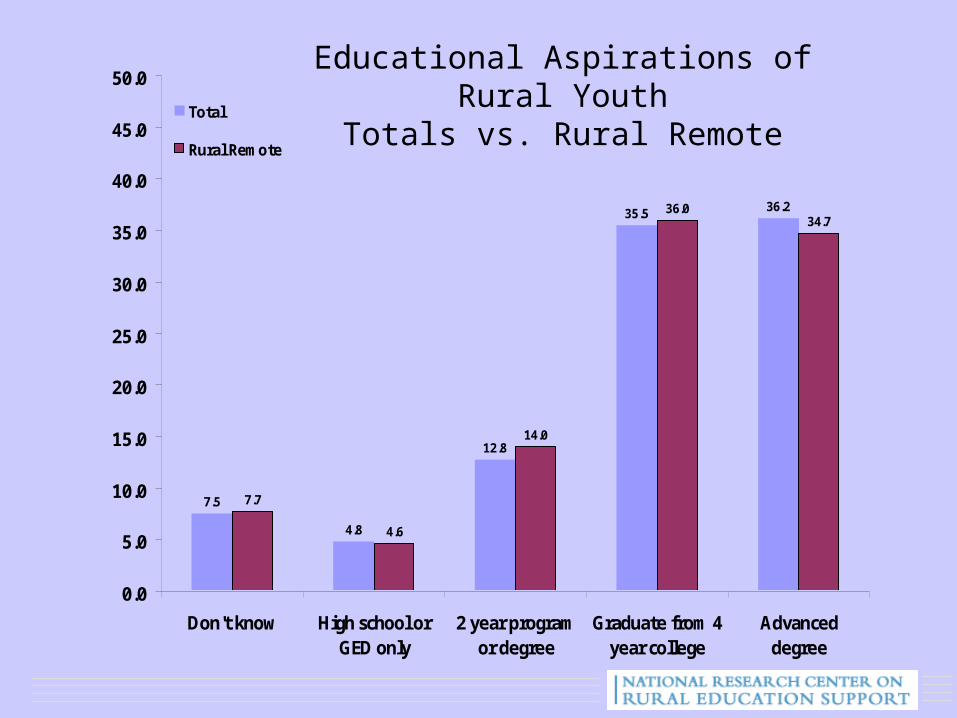
Educational Aspirations of Rural YouthTotals vs. Rural Remote
7.5
4.8
12.8
35.5 36.2
7.7
4.6
14.0
36.034.7
0.0
5.0
10.0
15.0
20.0
25.0
30.0
35.0
40.0
45.0
50.0
Don't know High school orGED only
2 year programor degree
Graduate from 4year college
Advanceddegree
Total
Rural Remote
0%
10%
20%
30%
40%
50%
60%
70%
80%
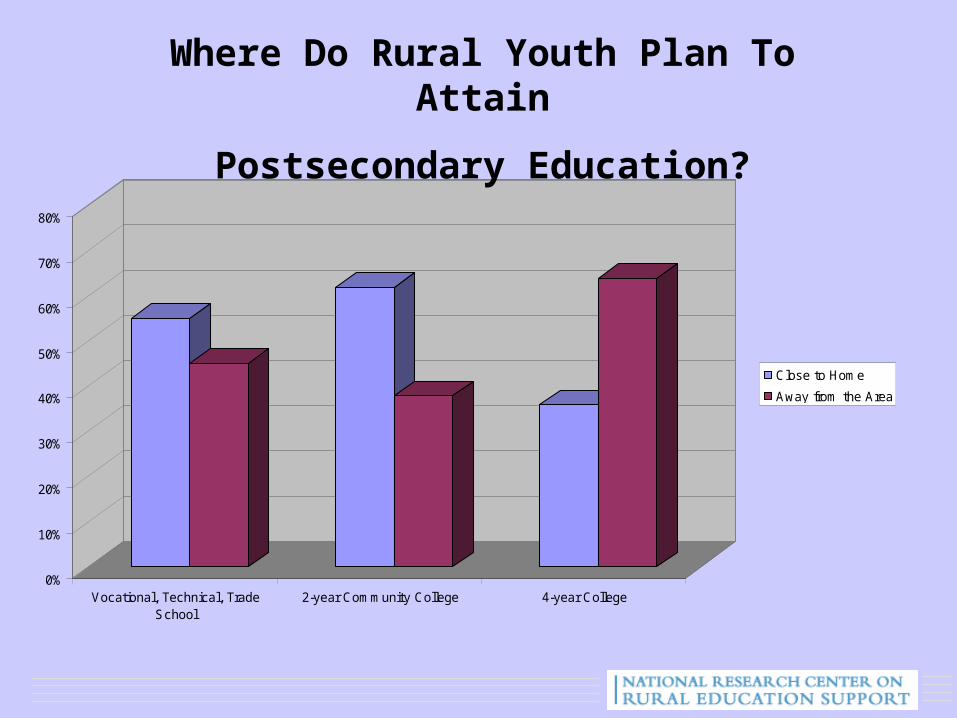
Vocational, Technical, TradeSchool
2-year Community College 4-year College
Close to Home
Away from the Area
Where Do Rural Youth Plan To Attain
Postsecondary Education?
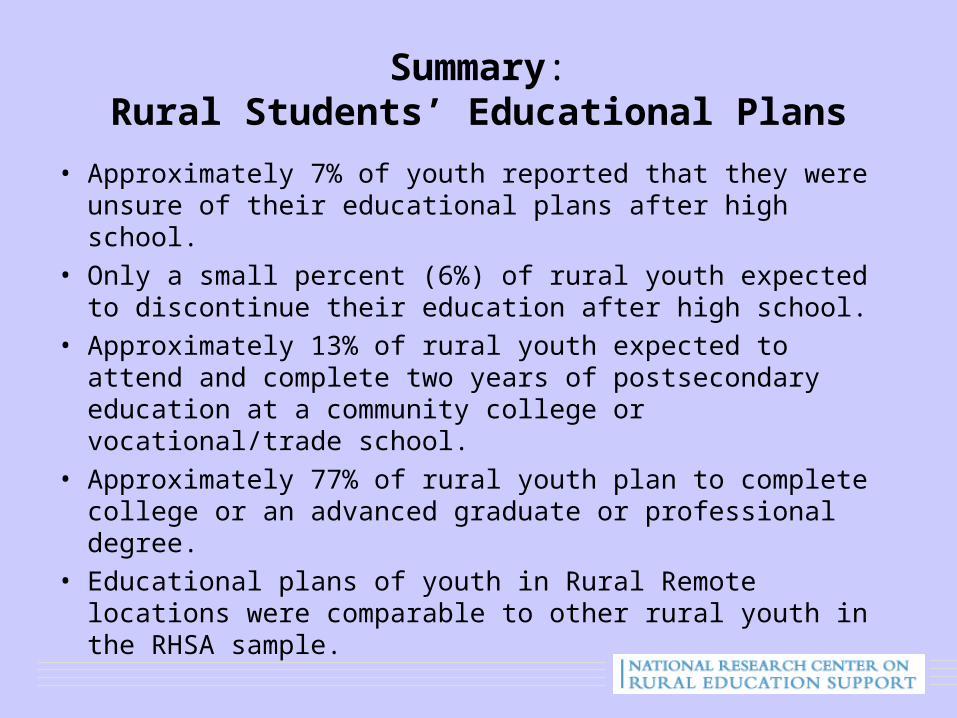
Summary:Rural Students’ Educational Plans
• Approximately 7% of youth reported that they were unsure of their educational plans after high school.
• Only a small percent (6%) of rural youth expected to discontinue their education after high school.
• Approximately 13% of rural youth expected to attend and complete two years of postsecondary education at a community college or vocational/trade school.
• Approximately 77% of rural youth plan to complete college or an advanced graduate or professional degree.
• Educational plans of youth in Rural Remote locations were comparable to other rural youth in the RHSA sample.
Future Vocational Aspirations
Total Rural Remote
N % N %
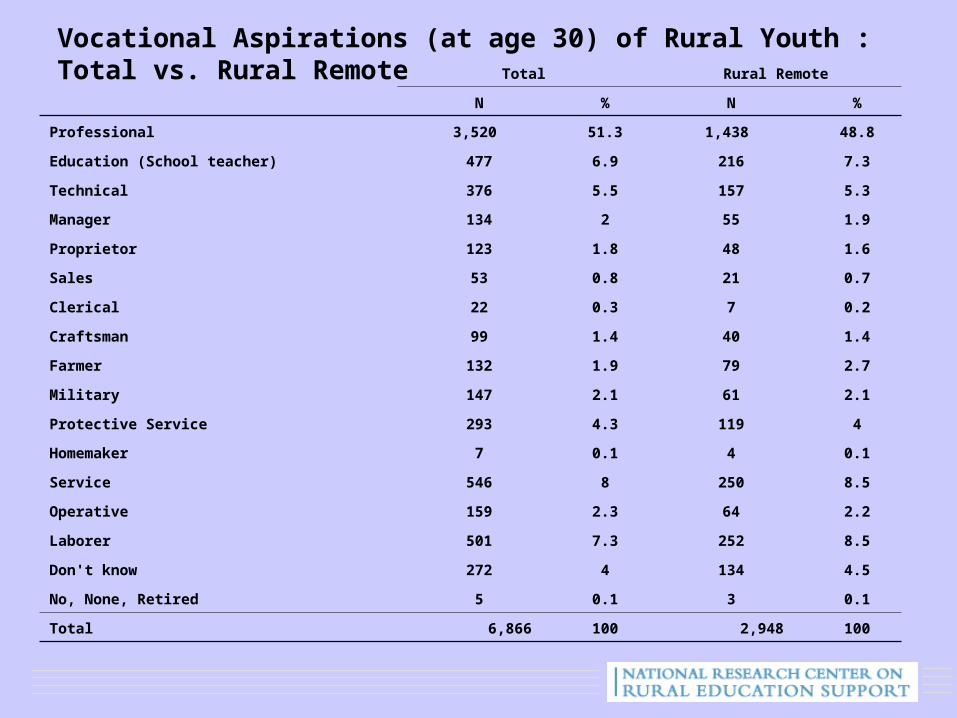
Professional 3,520 51.3 1,438 48.8
Education (School teacher) 477 6.9 216 7.3
Technical 376 5.5 157 5.3
Manager 134 2 55 1.9
Proprietor 123 1.8 48 1.6
Sales 53 0.8 21 0.7
Clerical 22 0.3 7 0.2
Craftsman 99 1.4 40 1.4
Farmer 132 1.9 79 2.7
Military 147 2.1 61 2.1
Protective Service 293 4.3 119 4
Homemaker 7 0.1 4 0.1
Service 546 8 250 8.5
Operative 159 2.3 64 2.2
Laborer 501 7.3 252 8.5
Don't know 272 4 134 4.5
No, None, Retired 5 0.1 3 0.1
Total 6,866 100 2,948 100
Vocational Aspirations (at age 30) of Rural Youth : Total vs. Rural Remote
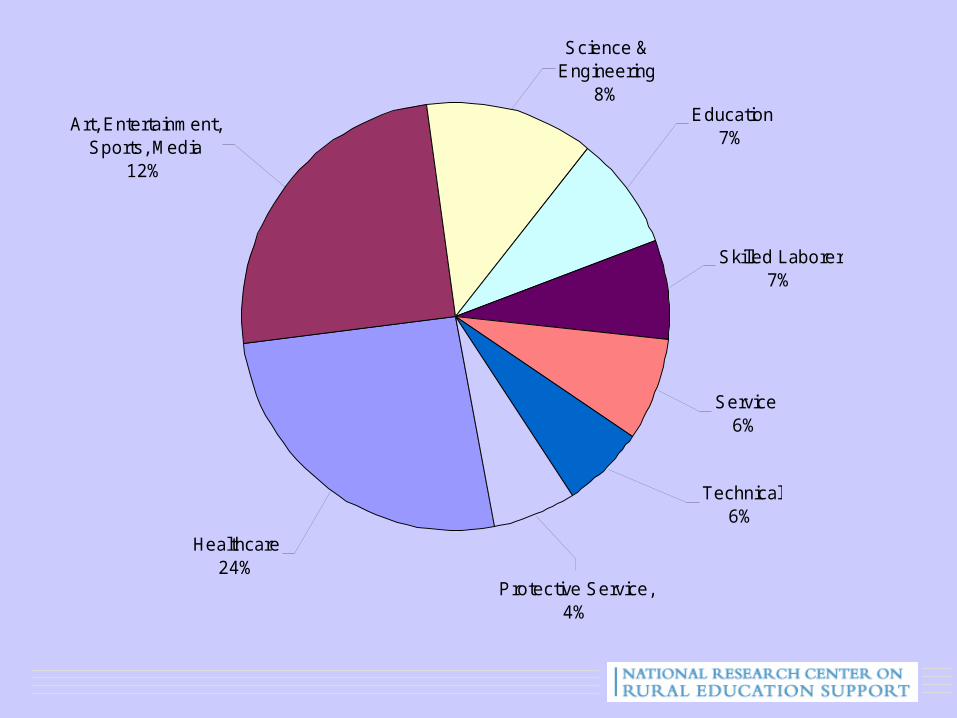
Service6%
Skilled Laborer7%
Art, Entertainment, Sports, Media
12%
Science & Engineering
8%Education
7%
Technical6%
Protective Service, 4%
Healthcare24%
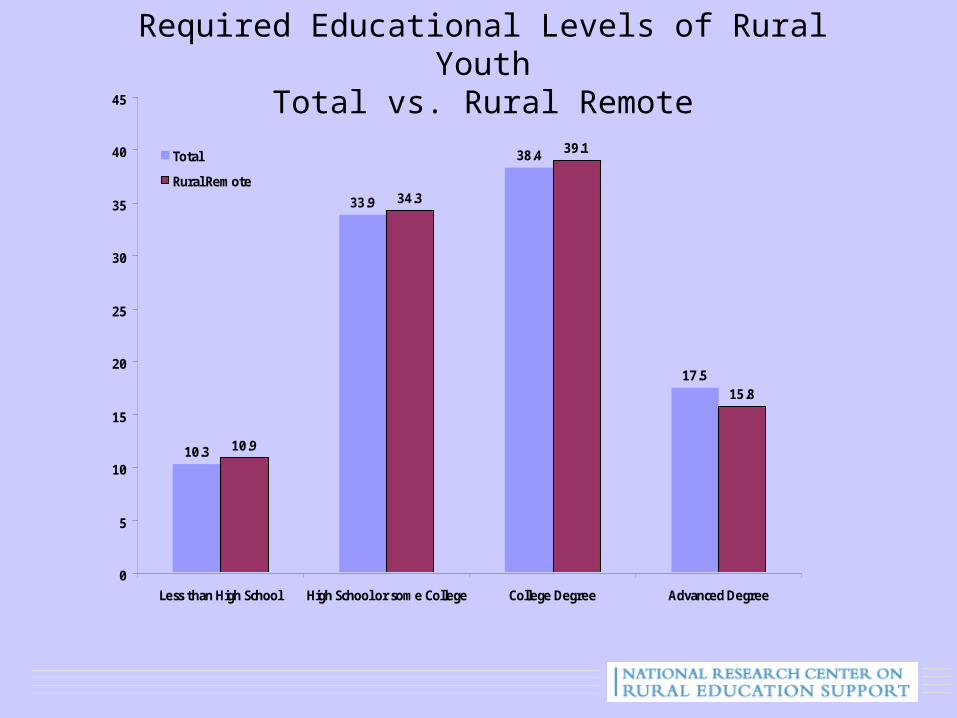
Required Educational Levels of Rural YouthTotal vs. Rural Remote
10.3
33.9
38.4
17.5
10.9
34.3
39.1
15.8
0
5
10
15
20
25
30
35
40
45
Less than High School High School or some College College Degree Advanced Degree
Total
Rural Remote
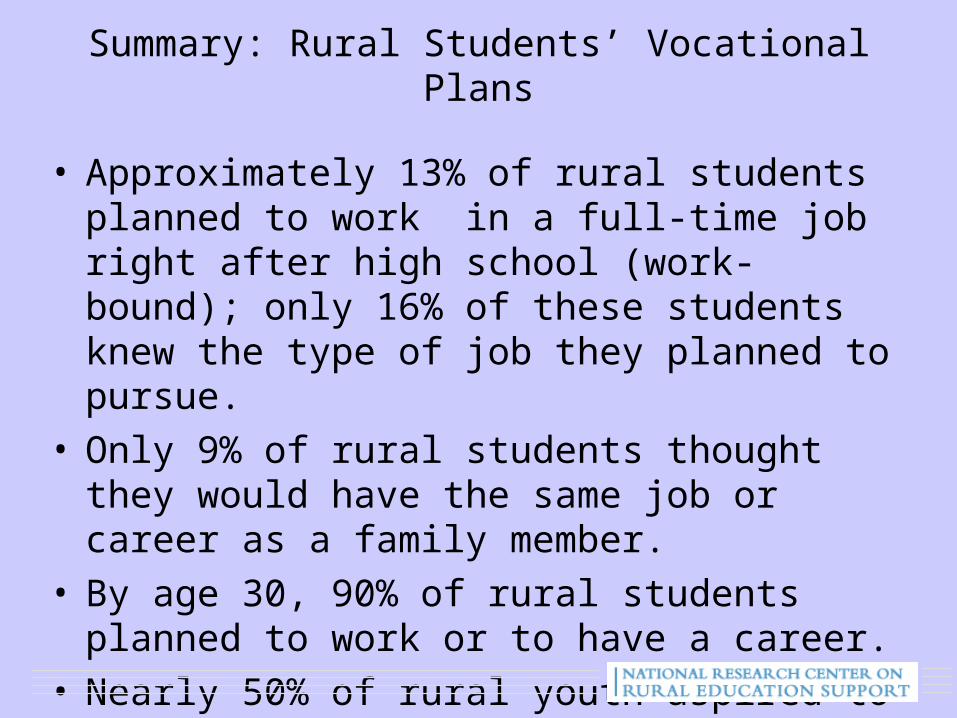
Summary: Rural Students’ Vocational Plans
• Approximately 13% of rural students planned to work in a full-time job right after high school (work-bound); only 16% of these students knew the type of job they planned to pursue.
• Only 9% of rural students thought they would have the same job or career as a family member.
• By age 30, 90% of rural students planned to work or to have a career.
• Nearly 50% of rural youth aspired to careers in healthcare, education, and technical fields.
Future Residential Plans
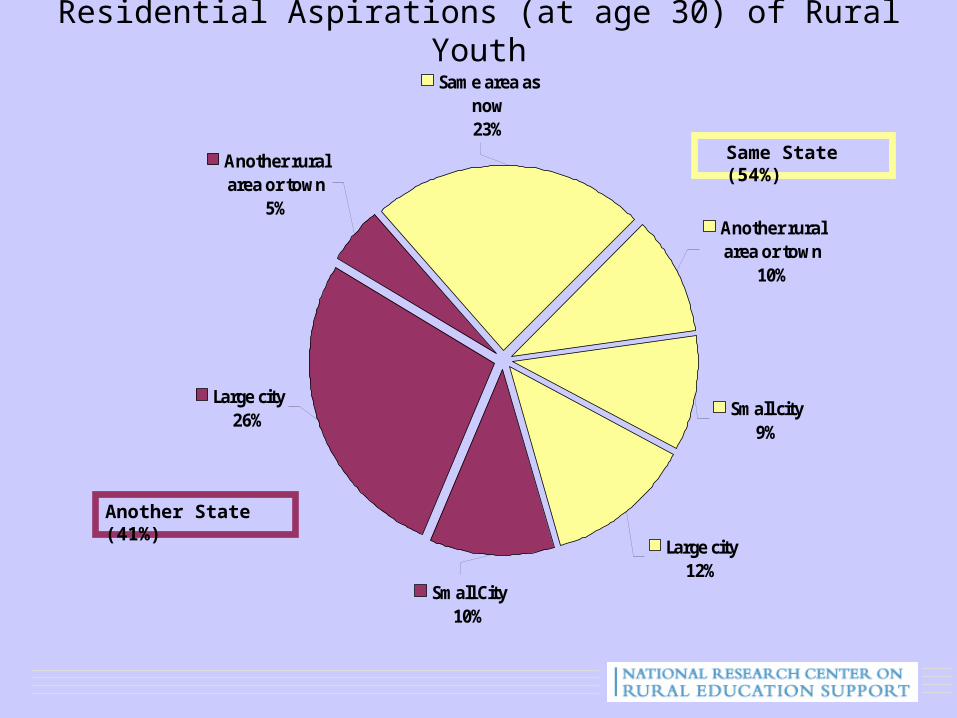
Residential Aspirations (at age 30) of Rural YouthSame area as
now23%
Another ruralarea or town
10%
Small city 9%
Large city 12%
Another rural area or town
5%
Large city 26%
Small City10%
Another State (41%)
Same State (54%)
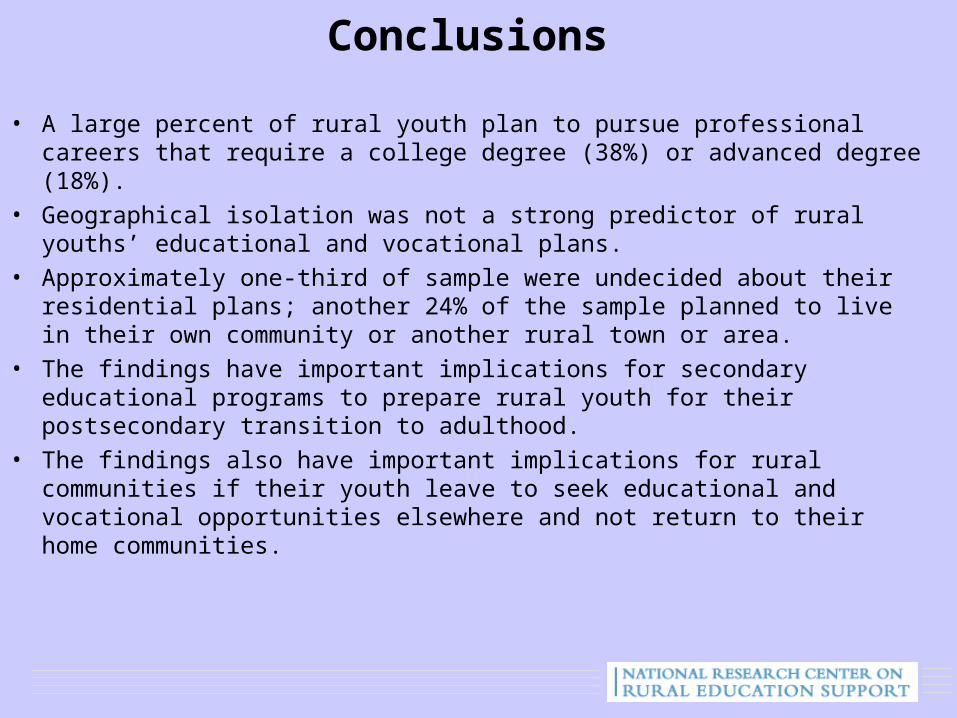
Conclusions
• A large percent of rural youth plan to pursue professional careers that require a college degree (38%) or advanced degree (18%).
• Geographical isolation was not a strong predictor of rural youths’ educational and vocational plans.
• Approximately one-third of sample were undecided about their residential plans; another 24% of the sample planned to live in their own community or another rural town or area.
• The findings have important implications for secondary educational programs to prepare rural youth for their postsecondary transition to adulthood.
• The findings also have important implications for rural communities if their youth leave to seek educational and vocational opportunities elsewhere and not return to their home communities.
Educational Barriers
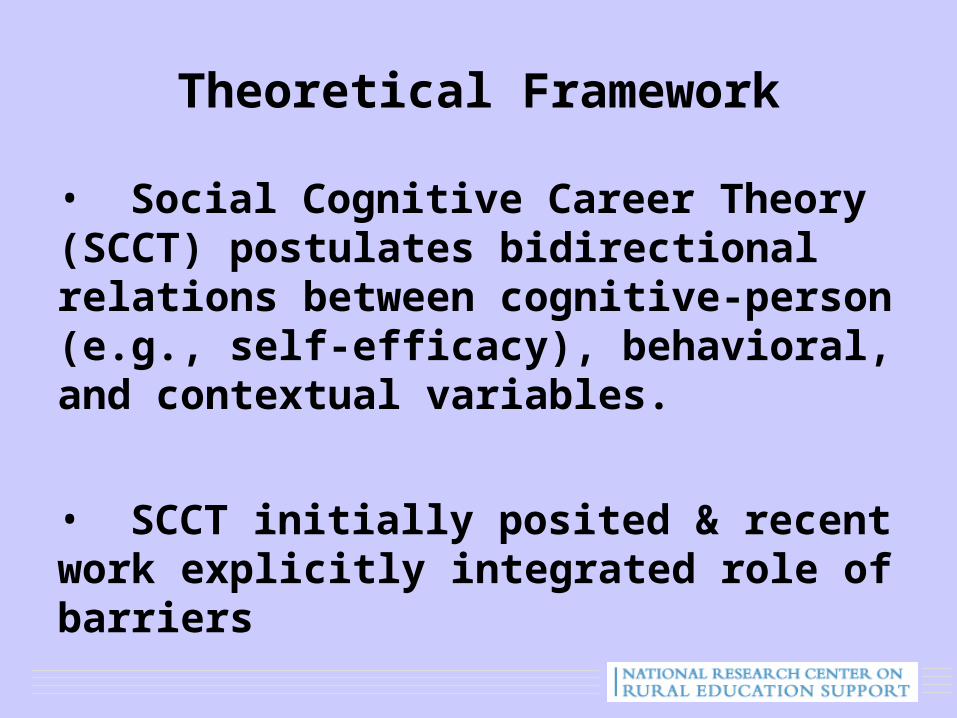
Theoretical Framework
• Social Cognitive Career Theory (SCCT) postulates bidirectional relations between cognitive-person (e.g., self-efficacy), behavioral, and contextual variables.
• SCCT initially posited & recent work explicitly integrated role of barriers
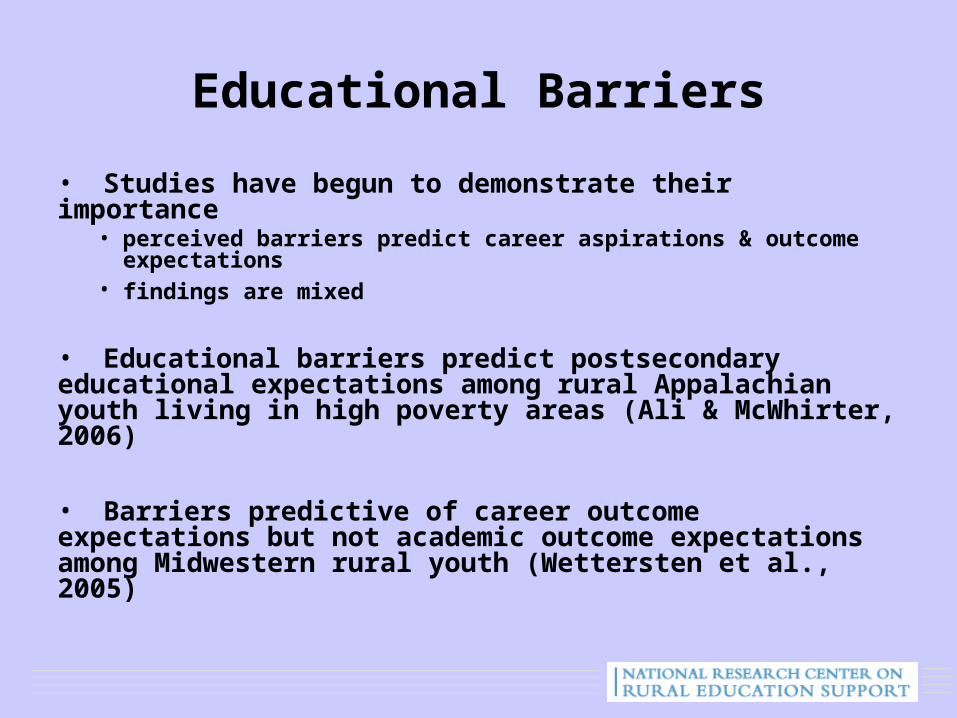
Educational Barriers
• Studies have begun to demonstrate their importance• perceived barriers predict career aspirations & outcome
expectations• findings are mixed
• Educational barriers predict postsecondary educational expectations among rural Appalachian youth living in high poverty areas (Ali & McWhirter, 2006)
• Barriers predictive of career outcome expectations but not academic outcome expectations among Midwestern rural youth (Wettersten et al., 2005)
Need to Consider Educational Barriers
• Perceived barriers central to postsecondary attainment as can prevent youth from pursuing aspirations and interests
• Identifying individual differences especially important for youth that may encounter difficulties in reaching postsecondary goals
• found gender and ethnic differences
Need to Consider Educational Barriers
• Little work has focused on rural youth or involved limited samples of rural youth
• Over 50% of U.S. districts and 10 million students are rural
• Less apt to complete college
(Johnson & Strange, 2007; Kusmin, 2007; Provasnik et al., 2007)
Purpose
• Describe educational barriers & clarify individual differences in perceived educational barriers among diverse sample of rural youth

Student-Report Measure of Educational Barriers
• asked whether planning to continue his/her education beyond high school (“No,” “Yes,” and “Not Sure”)
• if “No” asked how much each of several factors have affected plan not to continue his/her education beyond high school
• if “Yes” or “Not Sure” asked how difficult (1 = “not at all” to 7 = “very much”) each of several factors may make it to complete his/her postsecondary education
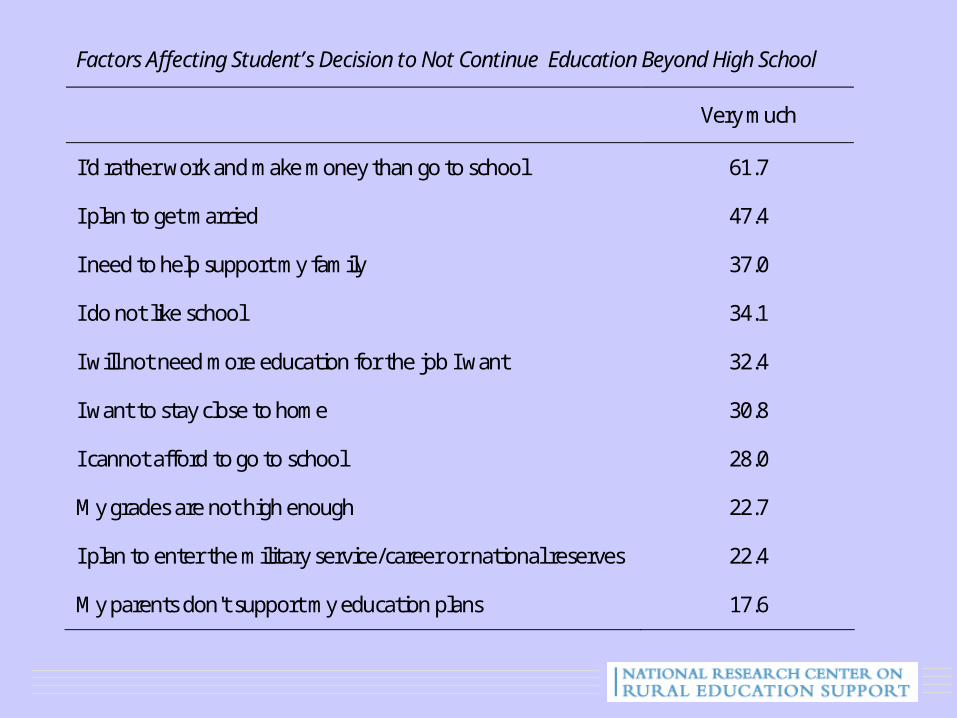
Factors Affecting Student’s Decision to Not Continue Education Beyond High School
Very much
I’d rather work and make money than go to school 61.7
I plan to get married 47.4
I need to help support my family 37.0
I do not like school 34.1
I will not need more education for the job I want 32.4
I want to stay close to home 30.8
I cannot afford to go to school 28.0
My grades are not high enough 22.7
I plan to enter the military service/career or national reserves 22.4
My parents don't support my education plans 17.6
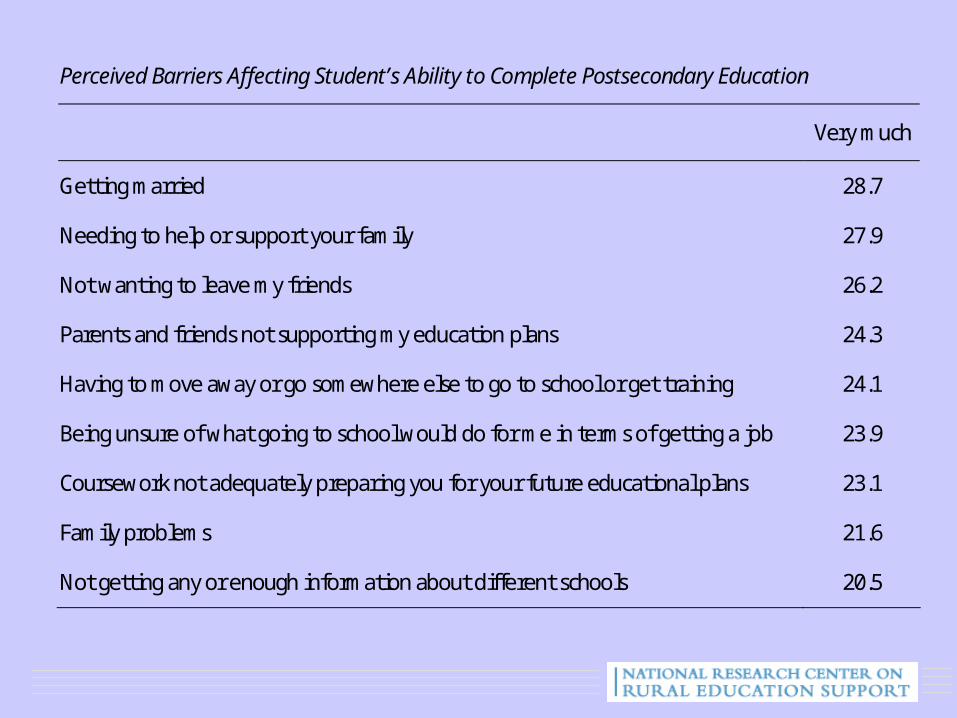
Perceived Barriers Affecting Student’s Ability to Complete Postsecondary Education
Very much
Getting married 28.7
Needing to help or support your family 27.9
Not wanting to leave my friends 26.2
Parents and friends not supporting my education plans 24.3
Having to move away or go somewhere else to go to school or get training 24.1
Being unsure of what going to school would do for me in terms of getting a job 23.9
Coursework not adequately preparing you for your future educational plans 23.1
Family problems 21.6
Not getting any or enough information about different schools 20.5
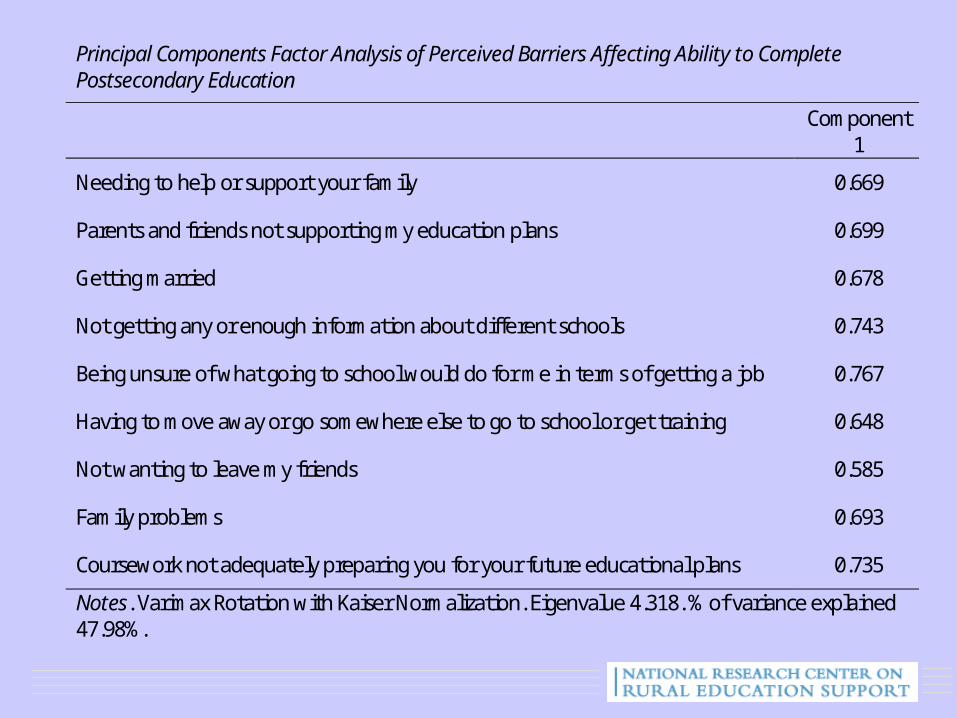
Principal Components Factor Analysis of Perceived Barriers Affecting Ability to Complete Postsecondary Education
Component
1
Needing to help or support your family 0.669
Parents and friends not supporting my education plans 0.699
Getting married 0.678
Not getting any or enough information about different schools 0.743
Being unsure of what going to school would do for me in terms of getting a job 0.767
Having to move away or go somewhere else to go to school or get training 0.648
Not wanting to leave my friends 0.585
Family problems 0.693
Coursework not adequately preparing you for your future educational plans 0.735
Notes. Varimax Rotation with Kaiser Normalization. Eigenvalue 4.318. % of variance explained 47.98%.
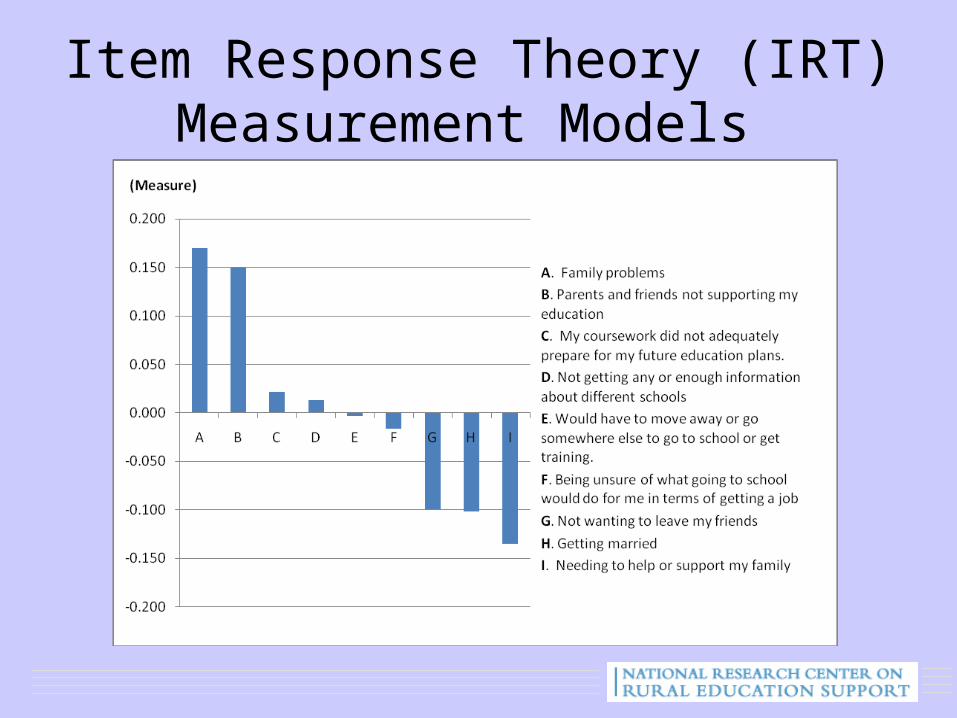
Item Response Theory (IRT) Measurement Models
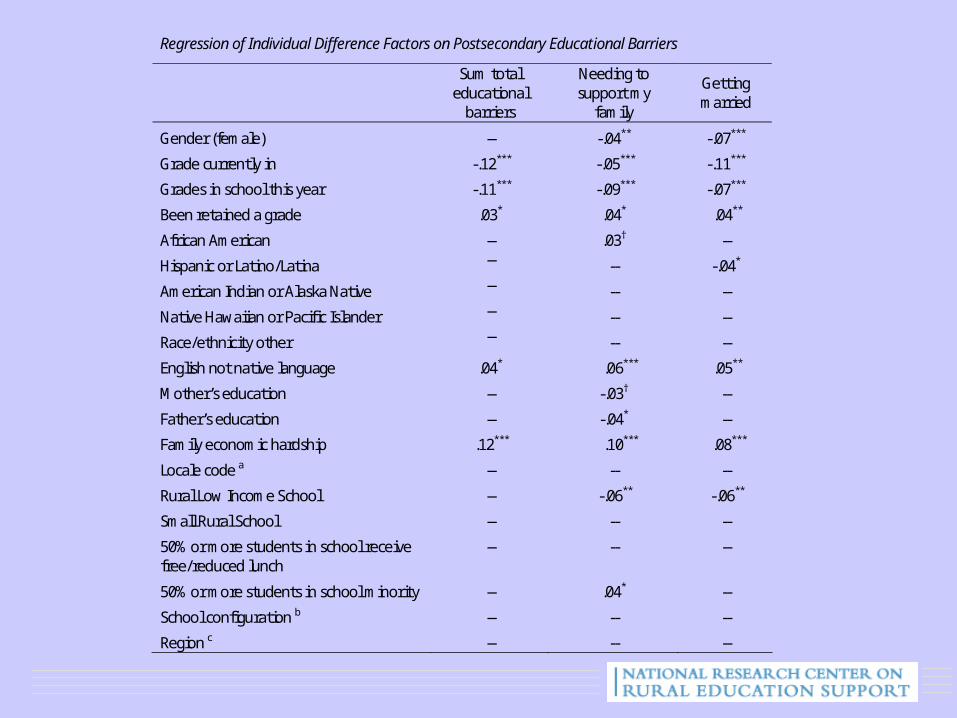
Regression of Individual Difference Factors on Postsecondary Educational Barriers
Sum total educational
barriers
Needing to support my
family
Getting married
Gender (female) -- -.04** -.07***
Grade currently in -.12*** -.05*** -.11***
Grades in school this year -.11*** -.09*** -.07***
Been retained a grade .03* .04* .04**
African American -- .03† --
Hispanic or Latino/Latina -- -- -.04*
American Indian or Alaska Native -- -- --
Native Hawaiian or Pacific Islander -- -- --
Race/ethnicity other -- -- --
English not native language .04* .06*** .05**
Mother’s education -- -.03† --
Father’s education -- -.04* --
Family economic hardship .12*** .10*** .08***
Locale code a -- -- --
Rural Low Income School -- -.06** -.06**
Small Rural School -- -- --
50% or more students in school receive free/reduced lunch
-- -- --
50% or more students in school minority -- .04* --
School configuration b -- -- --
Region c -- -- --
Rural High School Students’Perceptions of Their Local Economy and Economic
Prospects
Robert A. PetrinCenter for Education and Development Science
Pennsylvania State University
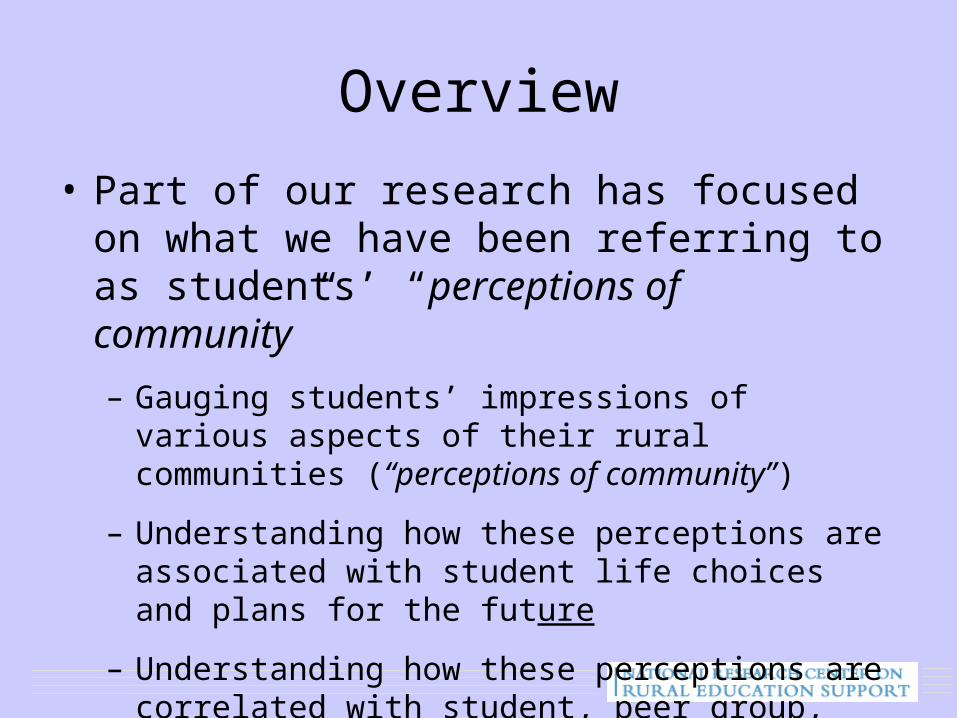
Overview
• Part of our research has focused on what we have been referring to as students’ “perceptions of community”
– Gauging students’ impressions of various aspects of their rural communities (“perceptions of community”)
– Understanding how these perceptions are associated with student life choices and plans for the future
– Understanding how these perceptions are correlated with student, peer group, school, and community characteristics
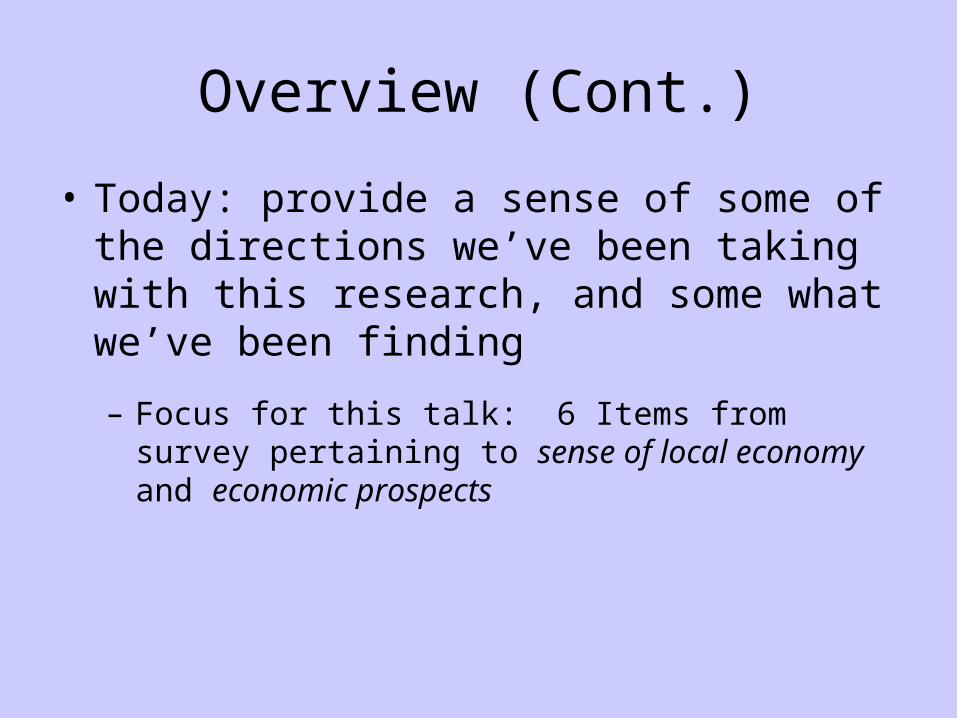
Overview (Cont.)
• Today: provide a sense of some of the directions we’ve been taking with this research, and some what we’ve been finding
– Focus for this talk: 6 Items from survey pertaining to sense of local economy and economic prospects
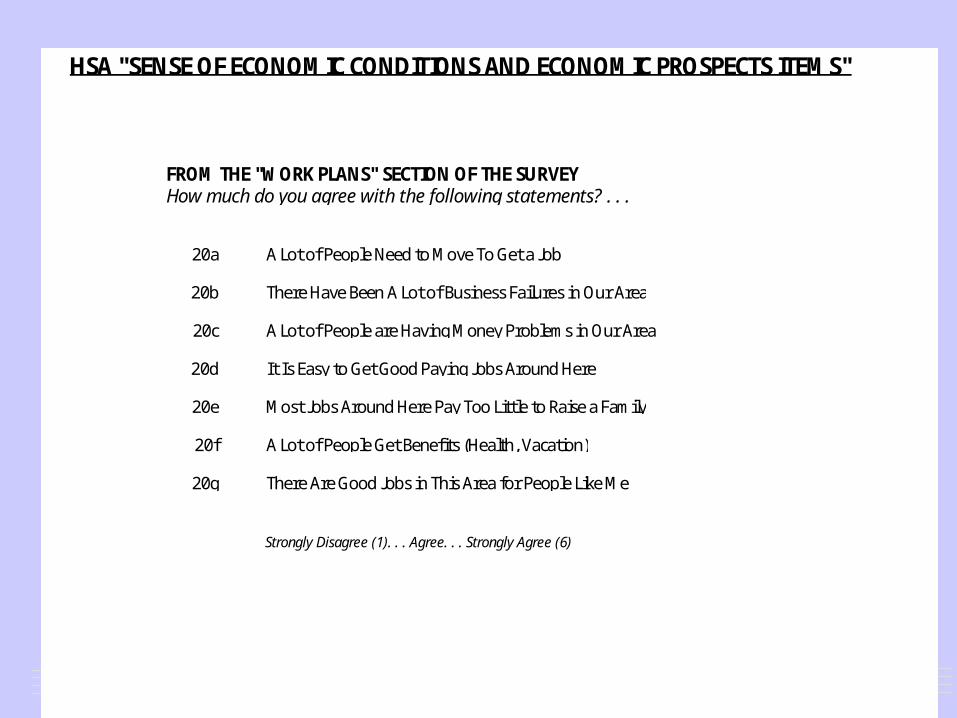
FROM THE "WORK PLANS" SECTION OF THE SURVEYHow much do you agree with the following statements? . . .
20a A Lot of People Need to Move To Get a Job
20b There Have Been A Lot of Business Failures in Our Area
20c A Lot of People are Having Money Problems in Our Area
20d It Is Easy to Get Good Paying Jobs Around Here
20e Most Jobs Around Here Pay Too Little to Raise a Family
20f A Lot of People Get Benefits (Health, Vacation)
20g There Are Good Jobs in This Area for People Like Me
Strongly Disagree (1). . . Agree. . . Strongly Agree (6)
HSA "SENSE OF ECONOMIC CONDITIONS AND ECONOMIC PROSPECTS ITEMS"
Overview (Cont.)
• In working with these items we draw upon various methodologies to . . .
– Aggregate student responses to make them more analytically tractable, easier to use
– Evaluate meaningful patterns of responses
• In particular, we’ve made extensive use of
• Factor Analysis(*)
• Latent Class Analysis
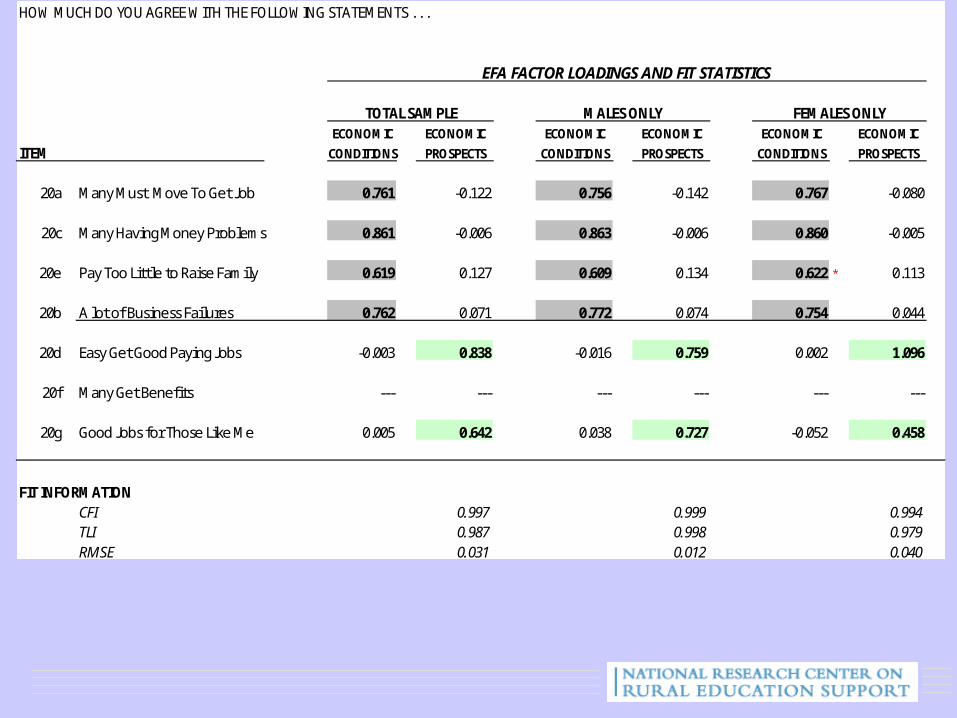
HOW MUCH DO YOU AGREE WITH THE FOLLOWING STATEMENTS . . .
ECONOMIC ECONOMIC ECONOMIC ECONOMIC ECONOMIC ECONOMICITEM CONDITIONS PROSPECTS CONDITIONS PROSPECTS CONDITIONS PROSPECTS
20a Many Must Move To Get Job 0.761 -0.122 0.756 -0.142 0.767 -0.080
20c Many Having Money Problems 0.861 -0.006 0.863 -0.006 0.860 -0.005
20e Pay Too Little to Raise Family 0.619 0.127 0.609 0.134 0.622 * 0.113
20b A lot of Business Failures 0.762 0.071 0.772 0.074 0.754 0.044
20d Easy Get Good Paying Jobs -0.003 0.838 -0.016 0.759 0.002 1.096
20f Many Get Benefits --- --- --- --- --- ---
20g Good Jobs for Those Like Me 0.005 0.642 0.038 0.727 -0.052 0.458
FIT INFORMATIONCFI 0.997 0.999 0.994TLI 0.987 0.998 0.979RMSE 0.031 0.012 0.040
TOTAL SAMPLE MALES ONLY FEMALES ONLY
EFA FACTOR LOADINGS AND FIT STATISTICS
Overview (Cont.)
• In this case, the indicators are categorical, the resulting CFA measures are interval-scaled
– Can use resulting measures to make simple mean comparisons, by selected outcomes and predictors
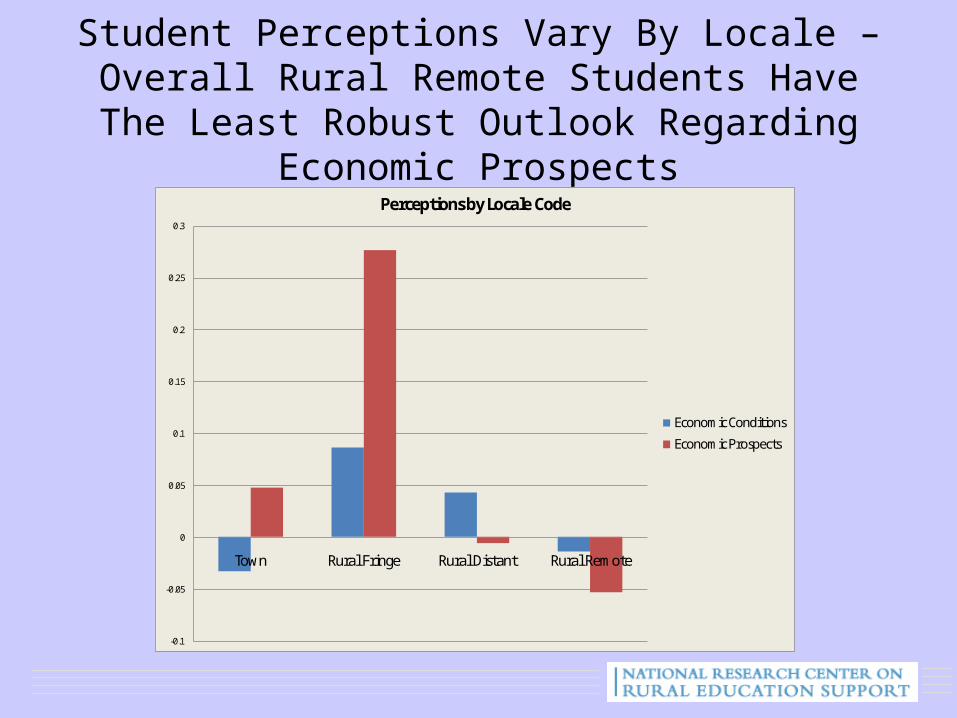
Student Perceptions Vary By Locale – Overall Rural Remote Students Have The Least Robust
Outlook Regarding Economic Prospects
-0.1
-0.05
0
0.05
0.1
0.15
0.2
0.25
0.3
Town Rural Fringe Rural Distant Rural Remote
Perceptions by Locale Code
Economic Conditions
Economic Prospects
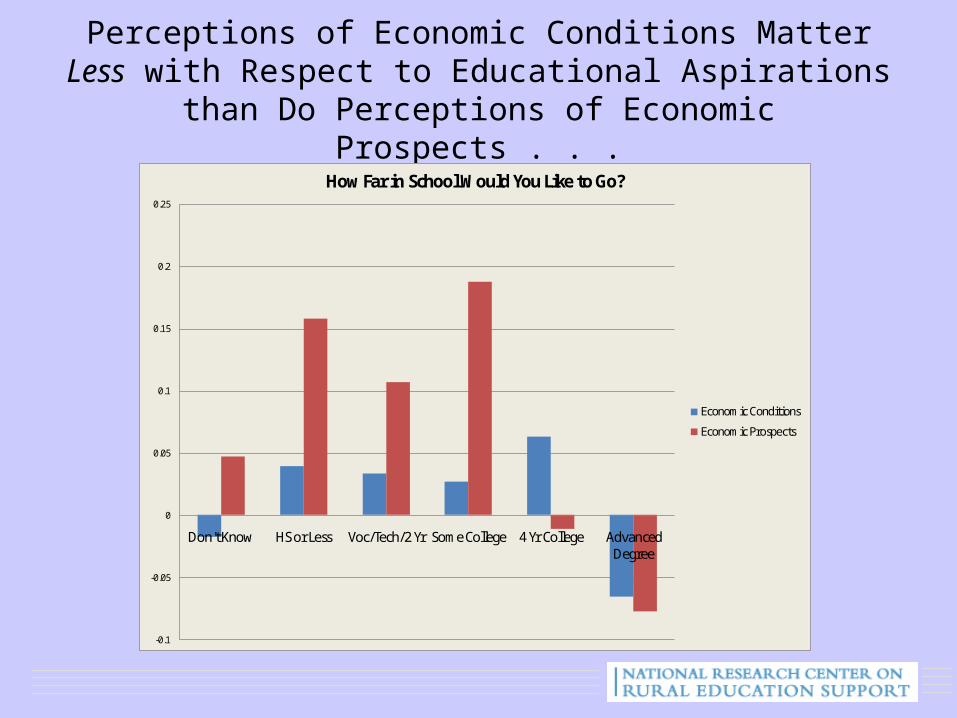
Perceptions of Economic Conditions Matter Less with Respect to Educational Aspirations than Do Perceptions of
Economic Prospects . . .
-0.1
-0.05
0
0.05
0.1
0.15
0.2
0.25
Don't Know HS or Less Voc/Tech/2 Yr Some College 4 Yr College Advanced Degree
How Far in School Would You Like to Go?
Economic Conditions
Economic Prospects
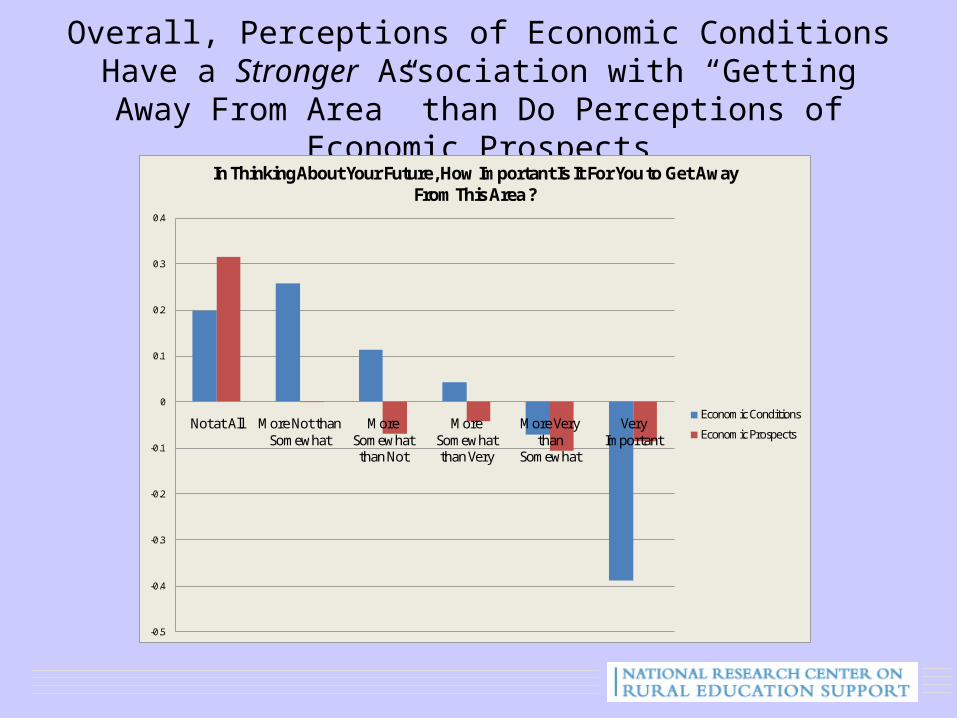
Overall, Perceptions of Economic Conditions Have a Stronger Association with “Getting Away From Area” than
Do Perceptions of Economic Prospects
-0.5
-0.4
-0.3
-0.2
-0.1
0
0.1
0.2
0.3
0.4
Not at All More Not than Somewhat
More Somewhat than Not
More Somewhat than Very
More Very than
Somewhat
Very Important
In Thinking About Your Future, How Important Is It For You to Get Away From This Area ?
Economic Conditions
Economic Prospects
Additional Analyses
• We have also used regression-style analyses to examine predictors of Economic Conditions, Economic Prospects
– Throughout our exploratory analyses (not shown), we consistently found evidence that such associations differed by gender
– Therefore we modeled differences in predictive relationships by gender
Selected Findings
• In these gender-specific analyses we found . . .
– For Boys:• Self-reported academic program tends to play a
stronger role for boys than is case for girls
– College Prep boys have a less robust sense of economic prospects (vs. boys in General Program)
– Voc/Tech/Ag boys have a more robust sense of economic prospects (vs. boys in General Program)
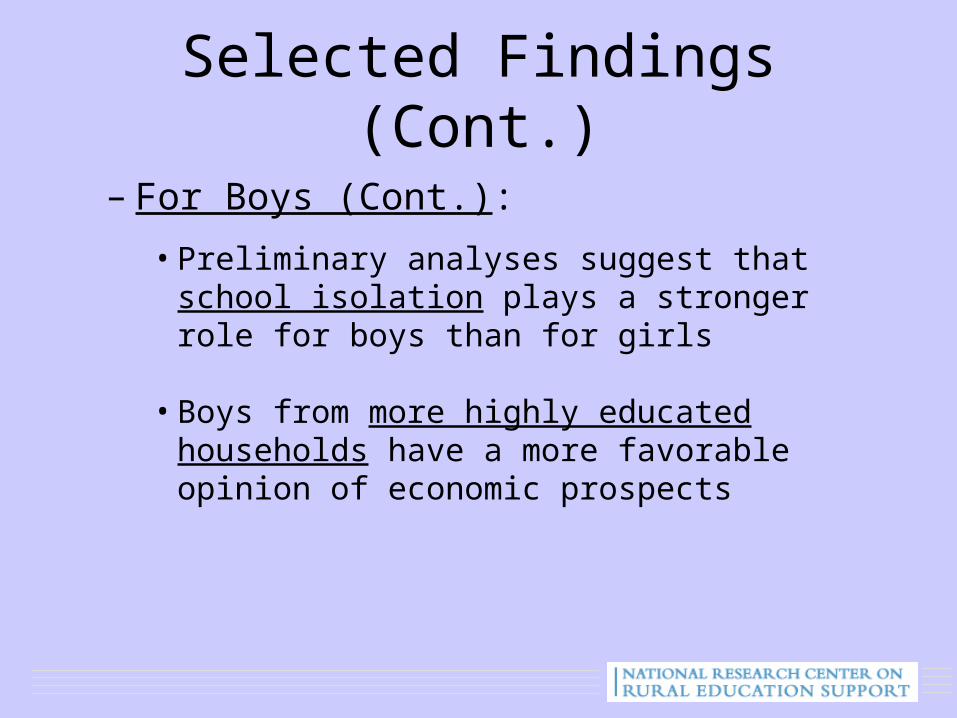
Selected Findings (Cont.)
– For Boys (Cont.):
• Preliminary analyses suggest that school isolation plays a stronger role for boys than for girls
• Boys from more highly educated households have a more favorable opinion of economic prospects
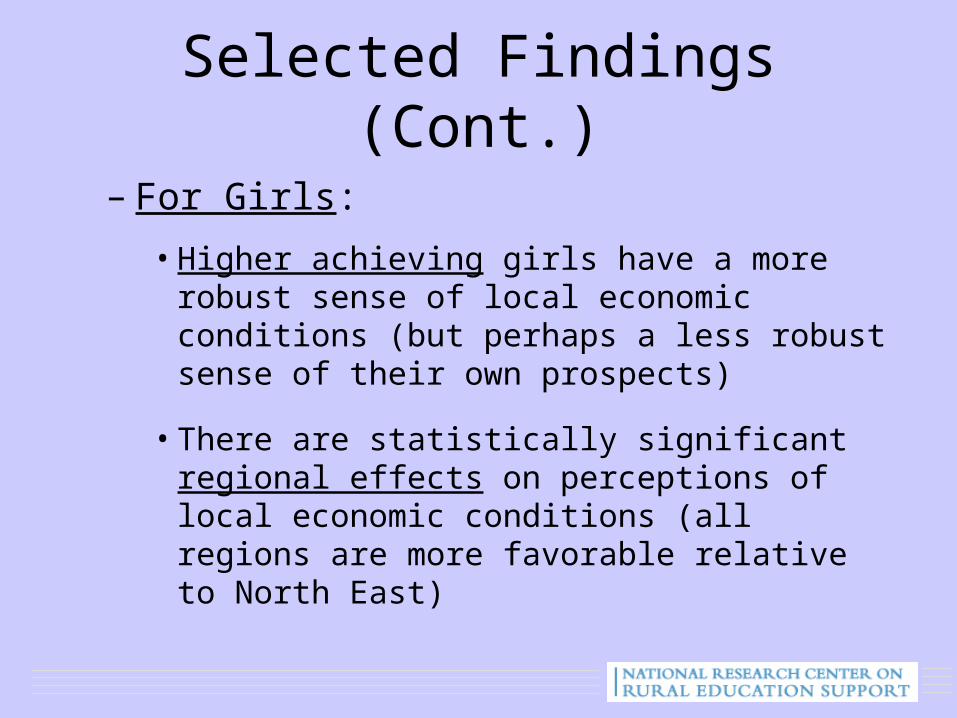
Selected Findings (Cont.)
– For Girls:
• Higher achieving girls have a more robust sense of local economic conditions (but perhaps a less robust sense of their own prospects)
• There are statistically significant regional effects on perceptions of local economic conditions (all regions are more favorable relative to North East)

Selected Findings (Cont.)
– For Both Boys and Girls:
• Students in higher grade levels tend to have a less favorable sense of local economy
• Students in poorer schools have less favorable views of local economy, and a less favorable views of their economic prospects
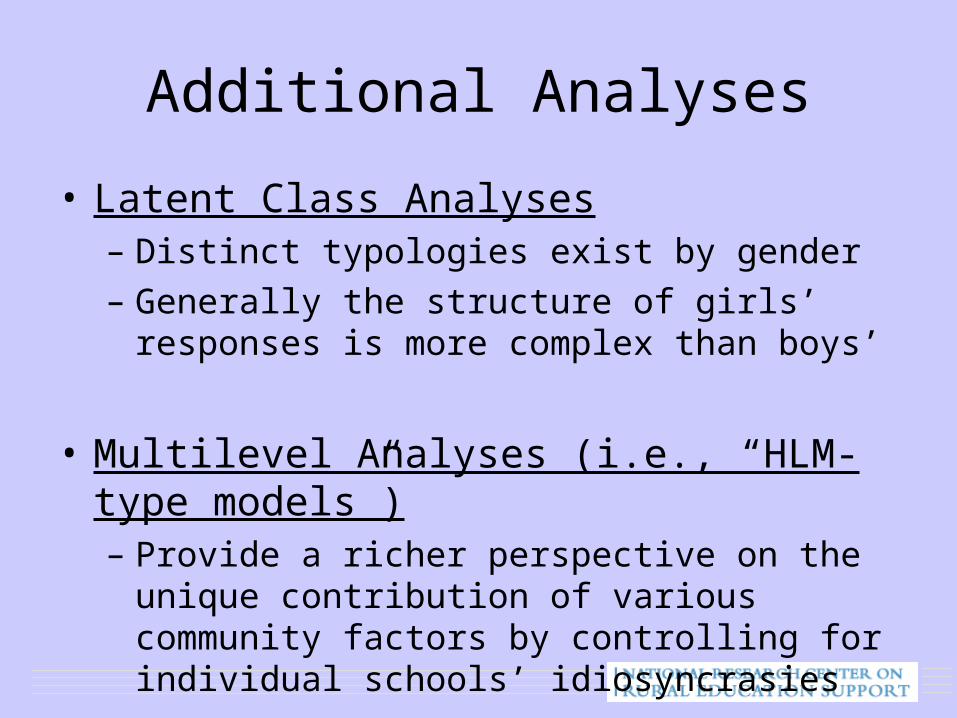
Additional Analyses
• Latent Class Analyses– Distinct typologies exist by gender– Generally the structure of girls’ responses is more
complex than boys’
• Multilevel Analyses (i.e., “HLM-type models”)– Provide a richer perspective on the unique
contribution of various community factors by controlling for individual schools’ idiosyncrasies