ht media group q3 fy 2019-20 consolidated financial results€¦ · ht media group q3 fy 2019-20 ....
TRANSCRIPT
1
Consolidated Financial Results
HT MEDIA GROUP Q3 FY 2019-20
Cautionary Statements
2
Certain statements in this presentation may be forward-looking statements. Such forward looking statements are subject to risks and uncertainties like regulatory changes, local political and economic developments, technological risks and many other factors that could cause our actual results to differ materially from those contained in the relevant forward-looking statements. HT Media Group will not, in any way, be responsible for any action taken based on such statements and undertakes no obligation to publicly update these forward-looking statements to reflect subsequent events or circumstances.
This is a quarterly webcast presentation, combining information for the public listed companies “HT Media Limited” and its subsidiary “Hindustan Media Ventures Limited”. Key objective of this presentation is to facilitate a unified platform for quarterly performance discussion pertaining to both the companies. It is neither intended to be an exhaustive review nor to provide any trading, financial, legal advice or outlook.
Chairperson’s Message
3
“Our third quarter results reflect the ongoing broad-based slowdown in the economy. Weakness in
demand has led to advertisers being cautious with spends. As a consequence, our Print and Radio
businesses faced pressure on revenues. On the positive side, the Shine business continues to exhibit
healthy growth for the fifth straight quarter. Despite revenue pressures, profitability has improved
on the back of lower newsprint prices and a tight control on costs.
We reiterate a cautious outlook for the upcoming quarters, and believe it may be some time before
the macroeconomic growth bottoms out. We are hopeful of a revival in the next financial year but
will remain focused on cost and efficiency measures which should hold us in good stead in the
interim. We also continue to explore new avenues of growth and will invest in key focus areas.”
Mrs. Shobhana Bhartia
Chairperson and Editorial Director
HT Media Ltd & Hindustan Media Ventures Ltd

Table of Contents
4
PARTICULARS SLIDE NO.
Consolidated Performance 5
Business Unit Performance 7
Print 8
Print – English 10
Print – Hindi (HMVL) 12
Radio 14
Annexures 18

CONSOLIDATED PERFORMANCE
5

Consolidated Financial Summary
6
1EBITDA before exceptional items
2As at 31st Dec
Consolidated Total Revenue for Q3’20 at
Rs 636 Cr, down by 5% over LY
EBITDA at Rs 118 Cr, and margins at 19%
(vis-à-vis 13% in previous year), driven by
softening of newsprint prices and cost
control
Consolidated PBT at Rs 42 Cr (LY Q3 PBT
of Rs 23 Cr)
CONSOLIDATED PERFORMANCE FINANCIAL HIGHLIGHTS
Particulars (Rs Cr) Q3'19 Q3'20 Change %
Total Revenue 670 636 -34 -5%
EBITDA1 85 118 33 39%
EBITDA margin (%) 13% 19%
PBT 23 42 19 83%
PAT 34 14 -20 -58%
PAT margin (%) 5% 2%
Net Cash2 1,117 999 -118 -11%

BUSINESS UNIT PERFORMANCE
7

8
PRINT – ENGLISH
PRINT – HINDI
RADIO
9
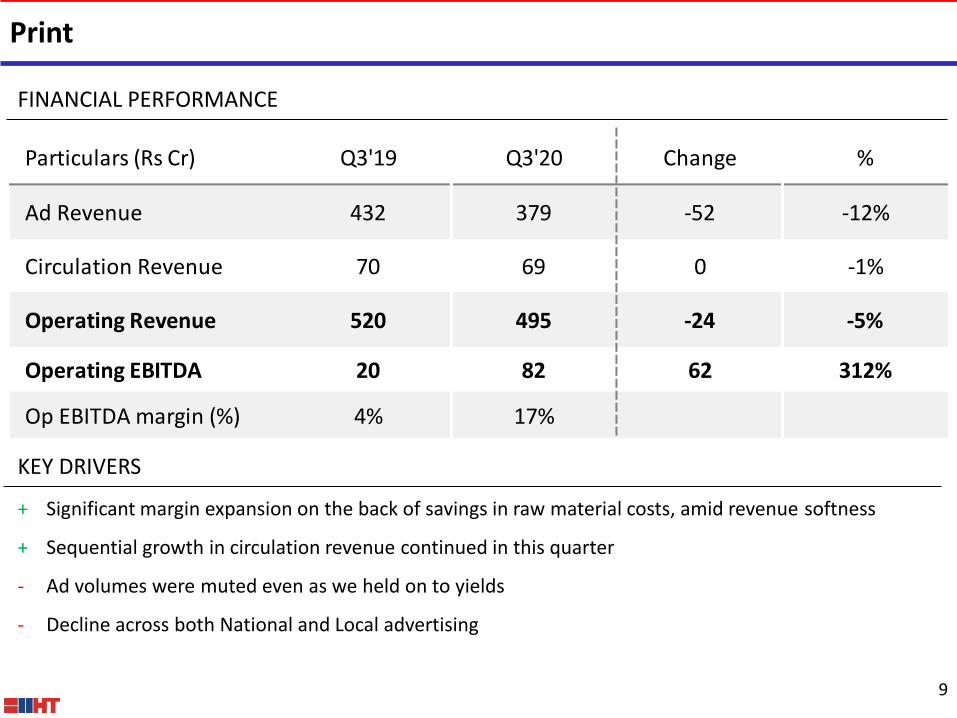
FINANCIAL PERFORMANCE
+ Significant margin expansion on the back of savings in raw material costs, amid revenue softness
+ Sequential growth in circulation revenue continued in this quarter
- Ad volumes were muted even as we held on to yields
- Decline across both National and Local advertising
KEY DRIVERS
Particulars (Rs Cr) Q3'19 Q3'20 Change %
Ad Revenue 432 379 -52 -12%
Circulation Revenue 70 69 0 -1%
Operating Revenue 520 495 -24 -5%
Operating EBITDA 20 82 62 312%
Op EBITDA margin (%) 4% 17%
10
PRINT – ENGLISH
PRINT – HINDI
RADIO
Print – English
11
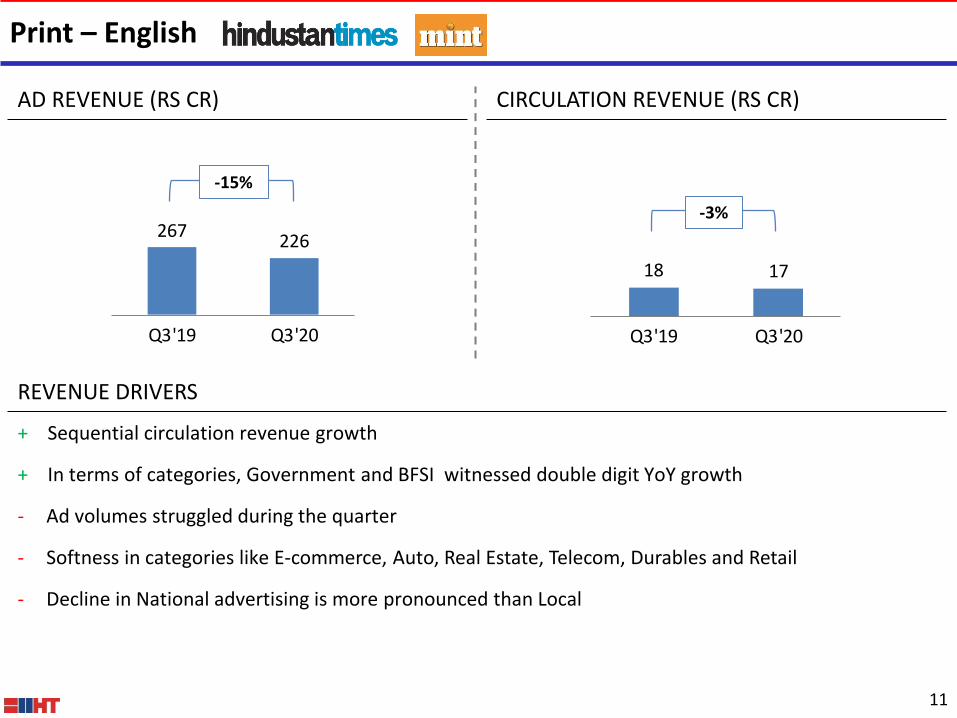
+ Sequential circulation revenue growth
+ In terms of categories, Government and BFSI witnessed double digit YoY growth
- Ad volumes struggled during the quarter
- Softness in categories like E-commerce, Auto, Real Estate, Telecom, Durables and Retail
- Decline in National advertising is more pronounced than Local
AD REVENUE (RS CR) CIRCULATION REVENUE (RS CR)
REVENUE DRIVERS
-15%
-3% 267
226
Q3'19 Q3'20
18 17
Q3'19 Q3'20
12
PRINT – ENGLISH
PRINT – HINDI
RADIO
13
REVENUE DRIVERS
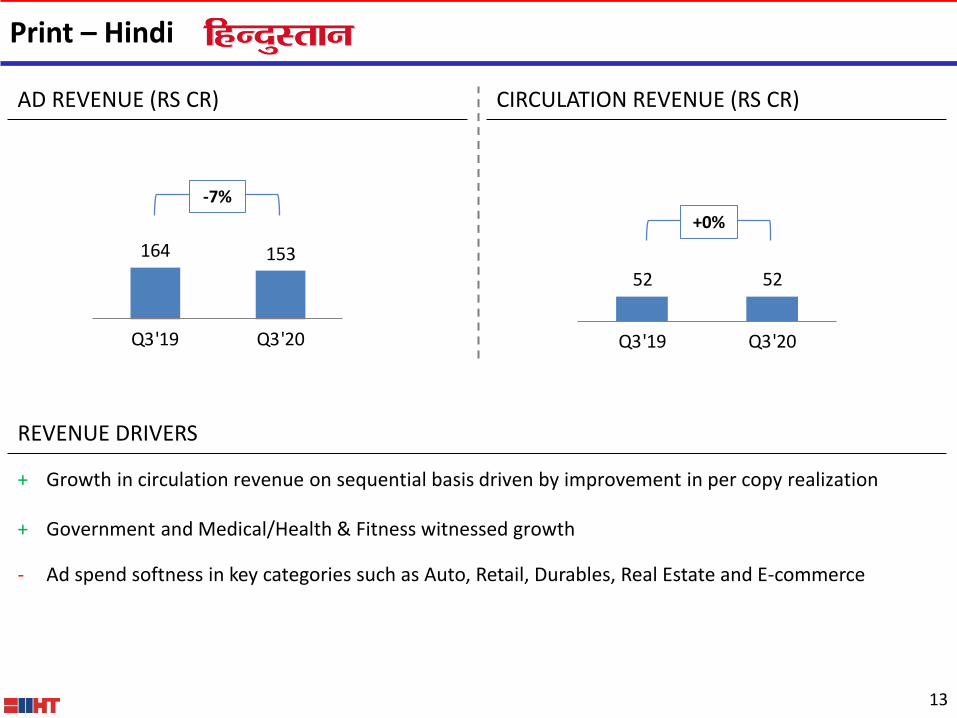
Print – Hindi
+ Growth in circulation revenue on sequential basis driven by improvement in per copy realization
+ Government and Medical/Health & Fitness witnessed growth
- Ad spend softness in key categories such as Auto, Retail, Durables, Real Estate and E-commerce
AD REVENUE (RS CR) CIRCULATION REVENUE (RS CR)
-7%
+0%
164 153
Q3'19 Q3'20
52 52
Q3'19 Q3'20

14
PRINT – ENGLISH
PRINT – HINDI
RADIO

Radio
15
- Muted spends in key categories such as Government, FMCG, Auto and Travel & Tourism
- Radio revenue (ex-NMW) witnessed a decline of 19% YoY
+ Growth in BFSI, Real Estate and Education categories
+ Yields improved across stations
PERFORMANCE DRIVERS
FINANCIAL PERFORMANCE
Particulars (Rs Cr) Q3'19 Q3'20 Change %
Operating Revenue 53 58 5 9%
Operating EBITDA 22 14 -8 -35%
Op EBITDA margin (%) 41% 24%

16
Q&A
Dial-in number for Q&A
+91 22 6280 1202
+91 22 7115 8103

17
HT Media Group
Hindustan Times House,
2nd Floor, 18-20, Kasturba Gandhi Marg
New Delhi – 110001, India
Anna Abraham
Amit Madaan
Sankalp Raghuvanshi
[email protected] +91 11 6656 1605
Saket Somani
Ravi Gothwal
[email protected] +91 22 6169 5988

ANNEXURES
18

Consolidated P&L – HT Media Ltd
19
Particulars (Rs Cr) Q3'19 Q3'20 YoY (%)
Total Revenue 670 636 -5%
Raw Materials & change in inventory 217 146 -33%
Employee Cost 104 109 5%
Other expenses 264 263 0%
EBITDA1 85 118 39%
Margin (%) 13% 19% 6%
PAT 34 14 -58%
Margin (%) 5% 2% -3%
1EBITDA before exceptional items

Consolidated P&L – Hindustan Media Ventures Ltd
20
Particulars (Rs Cr) Q3'19 Q3'20 YoY (%)
Total Revenue 253 236 -7%
Raw Materials & change in inventory 105 71 -33%
Employee Cost 29 31 5%
Other expenses 74 77 3%
EBITDA 44 58 31%
Margin (%) 17% 24% 7%
PAT 28 32 16%
Margin (%) 11% 14% 3%