htm benchmarking guide 2nd edition - amazon...
TRANSCRIPT

HTM Benchmarking Guide | 2ND EDITION
By Ted Cohen, UC Davis Medical Center Frank Painter, University of Connecticut Matt Baretich, Baretich Engineering David Braeutigam, Braeutigam Enterprises

©2018 AAMI. All Rights Reserved.

i© 2018 AAMI n HTM Benchmarking Guide (2nd Edition)
HTM Benchmarking Guide | 2ND EDITION
By Ted Cohen, UC Davis Medical Center Frank Painter, University of Connecticut Matt Baretich, Baretich Engineering David Braeutigam, Braeutigam Enterprises

ii © 2018 AAMI n HTM Benchmarking Guide (2nd Edition)
Preface to the 1st EditionBenchmarking has been around nearly as long as the clinical engineering profession itself. From
the beginning, we have tried to measure our current performance against standards of practice,
against our own past performance, and against other healthcare technology management (HTM)
programs. It has not been easy.
One of the fundamental problems has been that we have measured our performance in ways
that differ from those of our colleagues. We also have long recognized that we are dealing with
“apples and oranges” when trying to compare our HTM programs, which we typically regard as
unique and special, with other programs. If our numbers look bad, we can say we are different
and they do not measure things the way we do.
But those days are gone. As HTM professionals, we need to measure our performance and be
able to demonstrate that it is competitive with performance in other healthcare facilities. This
HTM Benchmarking Guide, published by AAMI, is an effort to take a step in the right direction.
We look at the history and current need for benchmarking. We summarize the literature and
identify available tools. We provide examples from AAMI’s web-based Benchmarking Solutions
platform as food for thought and a starting point for discussion. Time to get moving!
—Ted Cohen, Frank Painter, and Matt Baretich
Subject Matter Experts for AAMI’s Benchmarking Solution
iii© 2018 AAMI n HTM Benchmarking Guide (2nd Edition)
Preface to the 2nd EditionIt has been only three years since the 1st edition of the HTM Benchmarking Guide was published
in 2015, but a lot has happened:
AAMI’s Benchmarking Solution (ABS), an online subscription service that was in operation
from 2009 to 2016, was decommissioned. The reasons are outlined in this new edition.
The HTM Benchmarking Task Force was established to apply lessons learned from our ABS
experience. The Task Force has completed its work, which is included in this edition.
One lesson was the importance of appropriately allocating corporate-level HTM expenses
to individual facilities within a multiple-facility system. Systems are the new norm.
Another lesson was the need to distinguish (a) equipment maintenance expenses from (b)
engineering and project-related expenses. The latter category is where HTM is growing.
And, to supplement the long list of ABS metrics that were included in the 1st edition,
we have proposed refinements in the definitions of a short list of key performance
benchmarks.
Additionally, the 2nd edition of the HTM Benchmarking Guide has benefited from the
addition of David Braeutigam to the team.
—Ted Cohen, Frank Painter, Matt Baretich, and David Braeutigam
Subject Matter Experts for the AAMI HTM Benchmarking Task Force
iv © 2018 AAMI n HTM Benchmarking Guide (2nd Edition)
HTM Benchmarking Task Force MembersADVOCATE HEALTHCARE: Steve Vanderzee
BAYSTATE MEDICAL CENTER: James Bosman
CATHOLIC HEALTH INITIATIVES: Courtney Nanney
HOSPITAL FOR SICK CHILDREN: Mario Ramirez
INTERMOUNTAIN HEALTHCARE: Mike Busdicker
ISS SOLUTIONS: Barbara Maguire, David Brown
KAISER PERMANENTE: George Panagiotopoulos
MARICOPA INTEGRATED HEALTH SYSTEM: Pete Larose
MERCY HOSPITAL SAINT LOUIS: Douglas Dreps
PARKLAND HEALTH AND HOSPITAL SYSTEM: Travis Kobernick
SUTTER HEALTH: Ray Laxton
TEXAS HEALTH RESOURCES: Gerard Larose
UC DAVIS HEALTH SYSTEM: Colleen Ward
UT SOUTHWESTERN MEDICAL CENTER: Paul Stodolka
1© 2018 AAMI n HTM Benchmarking Guide (2nd Edition)
The U.S. healthcare system, and the healthcare technology on which it depends, is going through
complex and fundamental changes. The Affordable Care Act, a major change highlighted in
the 1st edition of the HTM Benchmarking Guide, is now the focus of major political activity. The
HITECH (Health Information Technology for Economic and Clinical Health) Act and the ARRA
(American Recovery and Reinvestment Act) have created many regulations that include financial
incentives to computerize healthcare data and to expand the use of electronic medical records
(EMRs)/electronic health records (EHRs).
These and other pressures are driving further consolidation of hospitals and medical providers
into larger multi-hospital systems with large associated group practices. Meanwhile the wide-
spread use of technology continues to increase in healthcare and in all aspects of our lives,
including wireless communication technologies, wearable activity monitoring devices, video
streaming, and new automobile technologies.
How do these changes affect HTM? The consolidation of healthcare organizations has allowed
many organizations to create and grow their in-house technical abilities. Most healthcare orga-
nizations are now large enough to have a well-trained and active HTM or Clinical Engineering
department, either “in-house” or available from the corporate or system level. The HTM program
may not directly service every technology (it’s rare that they can), but most can support many of
the more common technologies and many are capable of managing the service and supporting
all of the medical technologies (albeit with some help from the manufacturer and other service
providers).
One important result, as projected by the U.S. Bureau of Labor Statistics, is that the Biomedical
Equipment Technician occupational category (which the BLS refers to as Medical Equipment
Repairers) is projected to grow by 30% per year for the next 10 years and is listed as one of the
10 fastest-growing professions in the United States (www.bls.gov/ooh/installation-maintenance-
and-repair/medical-equipment-repairers.htm).
Another impact on HTM is that computerization in the healthcare delivery system has resulted in
a tremendous growth in the number of medical devices connected to the information technol-
ogy (IT) network. Not long ago, the majority of connected devices were a few large, expensive
medical imaging systems connected to an image repository system or PACS (picture archiving and
communication system). Now the average hospital has hundreds or thousands of other devic-
es—including continuous patient monitoring devices, “smart” infusion pumps, glucometers, and
other products—that send and receive data over the IT network.
Another impact, and contrast, is in clinical alarm management. The Joint Commission has issued
a ongoing National Patient Safety Goal that calls on healthcare facilities to better manage clinical
alarms. With the increase in continuous monitoring in acute care areas and further requirements
for continuously monitoring patients on opioid medications likely forthcoming, alarms are going
to become increasingly prevalent. At the same time, there is pressure to decrease the number of
“nuisance” alarms in order to avoid “alarm fatigue,” which is the desensitization to non-action-
able or low-priority alarms. All of these changes drive a need for more engineers, technicians,
and IT professionals to work in healthcare to make these new complex “systems of systems”
work effectively.
Introduction

2 © 2018 AAMI n HTM Benchmarking Guide (2nd Edition)
How do all these changes affect HTM benchmarking as a management tool? HTM programs
are growing and need to do so efficiently. Benchmarking allows some guidelines and relevant
comparisons to similar organizations (peers) to be made regarding staffing and other factors in
growing HTM or Clinical Engineering programs. Multiple metrics are needed to accurately mea-
sure how well an HTM program operates. Financial performance, customer service, equipment
uptime, and other indicators all are needed. For example, the cost-of-service ratio (COSR)—the
ratio of the total of all internal and external service costs and repair parts costs divided by the
total of all medical device acquisition costs—continues to be the most well- established financial
performance metric. Device count has been shown to be a poor workload indicator unless the
equipment in the workload is of similar cost and complexity.
Other contrasts on the HTM front include inefficiencies caused by the various, sometimes contra-
dictory, regulations from federal, state, local, and other regulators—AEM (Alternative Equipment
Maintenance) programs, requirements for 100% on-schedule completion of scheduled mainte-
nance, exaggerated attention for RPTs (Relocatable Power Taps), continued mandates for periodic
electrical safety leakage current inspections by many jurisdictions despite recognition since the
2012 edition of NFPA 99 Health Care Facilities Code that such testing is unnecessary—and so on.

3© 2018 AAMI n HTM Benchmarking Guide (2nd Edition)
Why Benchmark?It’s all about performance improvement! As HTM program managers, we are continually chal-
lenged to do better, to do more with less, to improve in terms of cost, quality, regulatory compli-
ance, patient safety, and every aspect of our work. Here’s how benchmarking can help:
1. Measure our performance. We have to know where we are before we can plan to move
forward. First, collect data using definitions that are standard across the HTM profession.
Next, calculate standard performance metrics. Basic metrics provide detailed assessments
within the broad areas of equipment, staffing, and costs. Examples include the various
costs associated with equipment maintenance and the value (acquisition cost, typically) of
the equipment maintained. Calculated metrics usually are ratios that normalize the data
across different institutions. For example, the COSR is the annual maintenance cost divided
by the equipment value which, as we discuss below, we propose is best measured by
equipment acquisition cost.
2. Benchmark our performance. Ask the questions: 1) Where do we measure up? and 2)
Where do we fall short? To answer these questions, we have to compare our performance
metrics with those of our peers—however we choose to define our peer group. We should
use benchmarking tools that give us flexibility in selecting a peer group and that have per-
formance data for a wide variety of HTM programs. We might be interested in comparing
the performance of our HTM programs with that of HTM programs in facilities of similar
size or geographic location. If we are a specialty facility, such as a pediatric hospital, we
might want to compare our performance with other such facilities. If we provide extensive
in-house maintenance services for imaging and laboratory equipment, we might not want
to focus on HTM programs that handle only general biomedical equipment.
3. Improve our performance. When we have identified opportunities for improvement—
opportunities we know are achievable because our peers have achieved them—we need
to drill down into the data and see what they are doing better. We should search the HTM
literature. We should talk to other HTM professionals. When we have done our research,
we can create a performance improvement project and monitor our progress. Suppose we
find that our peers are doing better than we are in terms of COSR data. After further re-
search, it appears that the key factor is how they manage their imaging equipment service.
That gives us a target for our performance improvement efforts. Do we need to adjust the
service levels for our service contracts? Should we invest in more staff training so we can
bring additional services in house? Asking the right questions is the best way to get the
right answers.
Benchmarking
4 © 2018 AAMI n HTM Benchmarking Guide (2nd Edition)
One use for benchmarking and metrics is to determine if your staffing levels are appropriate compared with your workload and with other like institutions (peers). In these times of budget con-straints, and with personnel costs often being the largest percent of the budget, having metrics that quantify staffing needs based on workload is very important.
At the University of California (UC) Davis Medical Center, we used AAMI’s Benchmarking Solution to help define staffing metrics based on several quantitative metrics and qualitative survey responses. These included the value of equipment managed or maintained, full-time equivalent (FTE) counts, device counts per FTE, derived hourly cost, and COSR.
Here’s how we did it:
Use the demographics selection (e.g., hospital size, location) to define a peer group or use all respondents for a particular time period (e.g., 2013).
Measure and report your current and historic COSR (Cohen 2010). A COSR of less than about 6% validates that the overall expenses for current workload are within reason (i.e., average or better compared with all respondents).
Measure and report current and historic staffing ratios based on the amount of equipment supported. Several measurements can be made, including the amount (acquisition cost) of equipment supported by one FTE, equipment counts supported by one FTE (only useful for low-cost equipment), and workload estimates by type of equipment based on historical data, manufacturer information, and other published workload data (e.g., ECRI Institute data).
If the measurements are being used to justify additional staff needed to support a new or expanded clinical service or a new healthcare facility, measure and report the net increase in workload estimated for the new project’s equipment.
Split the net increase in workload into “one-time startup workload” (e.g., planning, installation, incoming inspection) and long-term, continuing repair and maintenance workload. Make sure to remove from the long-term workload analysis any replaced equipment that will be leaving.
From the long-term workload increase, and the metrics listed above, calculate estimates of the FTEs required to support the additional equipment.
For any “big-ticket” items, develop a specific draft support plan in collaboration with the customer department and refine the specifics for these more complex and expensive
systems. This may include obtaining quotations for parts agreements or other “shared” support arrangements with the manufacturer or a third-party vendor.
Other metrics to consider analyzing include the ratio of external repair and maintenance costs to overall costs (sometimes called “penetration”) and your hourly service costs compared with your peers.
Conduct an internal review and “sanity check” on the preliminary results.
Review the analysis results with your administrator and key stakeholders.
The Clinical Engineering department at UC Davis Medical Center used a similar process for developing plans for adding staff for a new hospital wing that opened in 2010. We used benchmarking data from a peer group of 17 university hospitals that all main-tained at least some imaging equipment in-house. The peer group data showed that one FTE technician or specialist maintained about $5.5 million (acquisition cost) of equipment.
Evaluation of the additional workload details based on the types of equipment involved revealed that two BMET 3 specialists would be needed: one for operating room (OR) integration and other OR equipment support, and one for the automated clinical laborato-ry. We also would need a Radiology Equipment Specialist for the seven new or upgraded cardiac catheterization laboratories and other new radiology equipment. Other positions requested were designated as BMET 2 generalists.
A draft report was presented to hospital administration. After that presentation, and further discussion with Clinical Laboratory man-agement and the vendor of the lab automation lines, it was deter-mined that the FTE request for the lab automation line would be dropped because the lab automation line was going to be placed on a full-service contract, and the vendor was not amenable to any workload sharing with consequent cost savings. Subsequently, a “final” report was presented to a group of C-suite leadership who reviewed all staffing requests for the new building. Ultimate-ly, four FTEs were approved for Clinical Engineering. Benchmark data analysis definitely helped “sell” this proposal.
Depending on the project, another AAMI’s Benchmarking Solution metric that has been widely used to further validate or adjust staffing levels is device count per technician (1,087 devices per technician in this case study). However, with an average device cost around $11,000, one should be very careful using this metric for very expen-sive or very low-cost equipment. One CT scanner does not equal one infusion pump.
HTM Staffing at UC Davis Medical Center
CASE STUDY:

5© 2018 AAMI n HTM Benchmarking Guide (2nd Edition)
Benchmarking in ContextSeveral HTM-related benchmarking tools are in use today. Some of these tools are commercially
available to any healthcare organization: BiomedicalBenchmark from ECRI Institute and ActionOI
from Truven Health Analytics. Others are proprietary and customized for the internal objectives of
their particular organizations. These tools also differ significantly in scope and focus.
Selection of a benchmarking tool must also take into account the level of development for a
particular HTM program. AAMI’s HTM Levels Guide (see References) defines three HTM program
levels:
Level 1 – Fundamental: These programs provide a basic level of technology services and compliance with applicable standards and regulations.
Level 2 – Established: Programs at this level have moved beyond the basics to provide additional services, with a focus on cost-effectiveness.
Level 3 – Advanced: These programs are on the leading edge, demonstrating the full range of potential for HTM contributions to patient care.
Level 1 HTM programs typically engage in only the most basic types of benchmarking. They will, for example, measure their financial performance in terms of budget compliance. For example, they will measure Joint Commission–mandated metrics for on-time completion of scheduled maintenance.
Level 2 HTM programs carry out internal benchmarking activities, monitoring multiple met-rics within the program over time. Examples of additional metrics at this level are detailed maintenance costs, use error, productivity, customer satisfaction, and the COSR metric. Performance improvement activities focus on improving these metrics year over year.
Level 2 HTM programs also consider external benchmarking relative to HTM programs in similar healthcare organizations. Some of the internal metrics may be compared with peers and competitors when those external metrics are available.
Level 3 HTM programs regularly perform internal and external benchmarking. These efforts are an integral part of their ongoing identification of best practices and pursuit of improved performance. This level of benchmarking requires access to external performance metrics, typically through the use of a benchmarking tool like those listed above. It also typically requires generation and reporting of detailed metrics to a shared database associated with the selected benchmarking tool.
6 © 2018 AAMI n HTM Benchmarking Guide (2nd Edition)
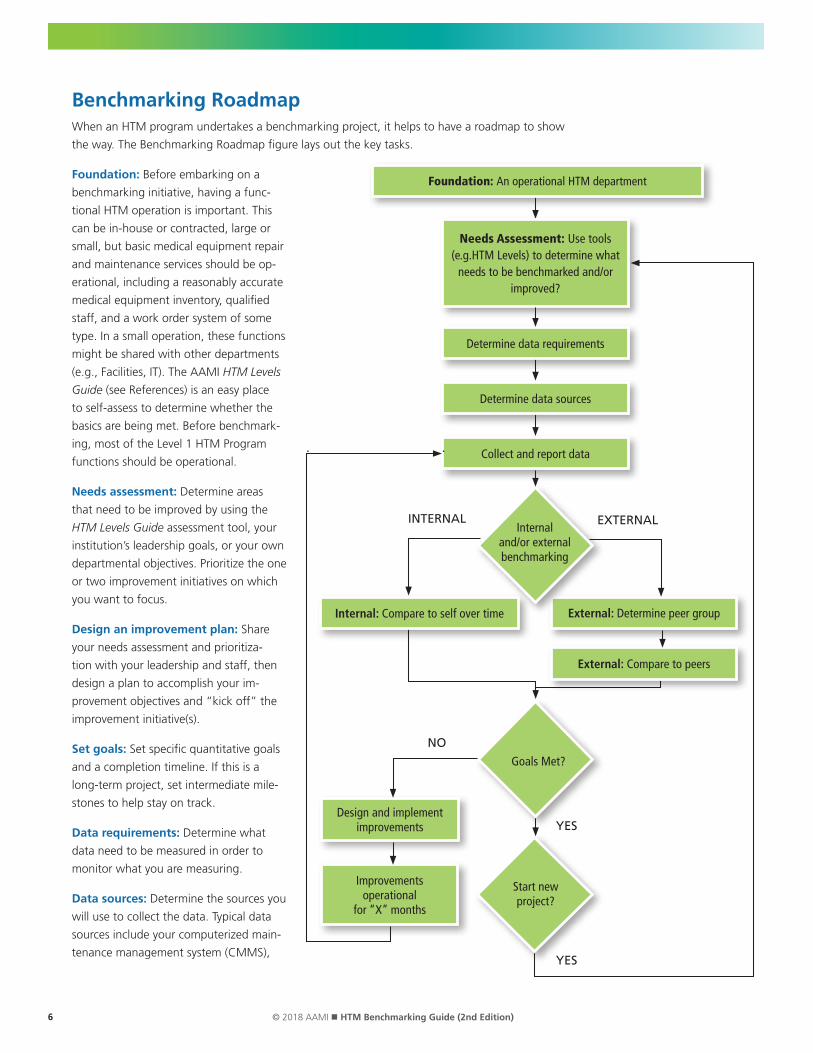
Benchmarking RoadmapWhen an HTM program undertakes a benchmarking project, it helps to have a roadmap to show
the way. The Benchmarking Roadmap figure lays out the key tasks.
Foundation: Before embarking on a
benchmarking initiative, having a func-
tional HTM operation is important. This
can be in-house or contracted, large or
small, but basic medical equipment repair
and maintenance services should be op-
erational, including a reasonably accurate
medical equipment inventory, qualified
staff, and a work order system of some
type. In a small operation, these functions
might be shared with other departments
(e.g., Facilities, IT). The AAMI HTM Levels
Guide (see References) is an easy place
to self-assess to determine whether the
basics are being met. Before benchmark-
ing, most of the Level 1 HTM Program
functions should be operational.
Needs assessment: Determine areas
that need to be improved by using the
HTM Levels Guide assessment tool, your
institution’s leadership goals, or your own
departmental objectives. Prioritize the one
or two improvement initiatives on which
you want to focus.
Design an improvement plan: Share
your needs assessment and prioritiza-
tion with your leadership and staff, then
design a plan to accomplish your im-
provement objectives and “kick off” the
improvement initiative(s).
Set goals: Set specific quantitative goals
and a completion timeline. If this is a
long-term project, set intermediate mile-
stones to help stay on track.
Data requirements: Determine what
data need to be measured in order to
monitor what you are measuring.
Data sources: Determine the sources you
will use to collect the data. Typical data
sources include your computerized main-
tenance management system (CMMS),
Goals Met?
Start new project?
Foundation: An operational HTM department
Determine data requirements
Collect and report data
External: Determine peer group
External: Compare to peers
Internal: Compare to self over time
Design and implement improvements
Improvements operational
for “X” months
Needs Assessment: Use tools (e.g.HTM Levels) to determine what
needs to be benchmarked and/or improved?
Internal and/or external benchmarking
NO
EXTERNAL INTERNAL
YES
YES
Determine data sources

7© 2018 AAMI n HTM Benchmarking Guide (2nd Edition)
financial reports, and purchasing records. We have found that the most difficult information for
HTM programs to access is the value of the medical equipment managed or maintained by HTM
programs.
Historically, this information has not flowed to HTM; however, without equipment value data
(e.g., acquisition cost), calculating the COSR—the key financial indicator of HTM program cost-
effectiveness—is impossible. In such cases, one of the first performance improvement efforts of
the HTM program may simply be getting access to this information.
Data collection: Collect and record the data periodically (e.g., quarterly for internal benchmark-
ing, annually for external benchmarking).
Internal benchmarking: Frequently compare the newly collected data against your prior data
sets to determine if you are trending in the direction desired for your objectives.
External benchmarking: Determine your appropriate comparison (peer) group. Usually less fre-
quently than the internal comparison, compare the newly collected data against the peer group’s
prior data sets to determine if you are trending in the direction desired for your objectives.
Goals met? Have the goals been met? Are the metrics trending in the right direction and at the
expected pace? If yes, continue until the goals are met. When goals are met, ensure they are
sustainable before moving on to another performance improvement project.
If the project is not trending in the right direction or is moving too slowly, then assess whether
the improvement needs to be redesigned and reimplemented. Collect the next set of data after
allowing enough time for improvements to show progress.
Future DirectionsThe various benchmarking tools that are available have substantial overlap in terms of data fields
and calculated metrics; however, important differences result from variations in the scope and
focus of the tools. Moreover, any two HTM programs using the same benchmarking tool may dif-
fer in how they define and record their data. Do personnel costs include benefits? Do equipment
inventories count each module of a patient monitoring system or the system as a whole? Is there
a large amount of field service travel time involved and how is travel accounted for on work or-
ders? Do personnel hours include “nonproductive” time, such as meetings and vacations? If we
don’t collect data consistently, we can’t benchmark our performance against our peers.
This “apples and oranges” situation arises primarily from two factors. First, HTM programs have
tended to evolve independently. Pioneering HTM professionals invented the field and managed
their programs as they saw fit. There was little need (or opportunity) for benchmarking when the
emphasis was on just getting the job done. But consolidation in the healthcare system and the
need for continual performance improvement have made variations in HTM practice untenable.
The second factor, perhaps a consequence of the first, is that the HTM profession has not made
standardization a priority. We all tend to think of our HTM programs as unique and special but,
realistically, many of our core processes are quite similar: equipment inspection, maintenance,
and repair. We now are seeing the development of standards, both formal and de facto, in many
aspects of HTM practice. Additional standardization may be warranted to support our perfor-
mance improvement objectives.

8 © 2018 AAMI n HTM Benchmarking Guide (2nd Edition)
To help move this process along, the HTM Benchmarking Guide includes a summary of all the
metrics used in AAMI’s Benchmarking Solution (Appendix A). This list has been evolving since
2009 and has been improved over the years by feedback from AAMI’s Benchmarking Solution
subscribers. Appendices B through D include additional information for future directions in HTM
benchmarking.
Although this document is based on the HTM literature and the experience of many HTM
professionals, it is not a final product. Instead, it is intended to start a conversation among HTM
stakeholders about how to move forward—and perhaps initiate some new HTM benchmark-
ing-related projects.
The HTM stakeholders we have in mind include, of course, the many HTM professionals practic-
ing in healthcare facilities—large and small facilities, independent and members of healthcare
systems, with HTM programs of varying levels—and the healthcare systems and organizations of
which they are part of.
Other stakeholders include professional associations like AAMI, accrediting organizations like The
Joint Commission, and recognized professional resources like ECRI Institute. Also included are
companies that provide HTM services to healthcare facilities.
Other key stakeholders are companies that provide CMMS software. A large portion of the
benchmarking data is contained in CMMS databases and having relevant CMMS data flow easily
into benchmarking software would be beneficial.
We also see an important trend among leading CMMS software providers: moving beyond the
basic inventory, scheduling, and maintenance history functions to providing comprehensive HTM
management tools. As that trend continues, more and more CMMS data fields will become
relevant to HTM benchmarking. That could mean more data flowing (with some degree of auto-
mation) from CMMS software to benchmarking software. It also might mean eventually incorpo-
rating benchmarking functions into CMMS software.
But HTM benchmarking progress depends on standardization of data fields and definitions, data
collection methods, and calculated performance metrics. We hope you will use this benchmark-
ing guide as a reference for future benchmarking projects. If we can all move the HTM field
toward standardization of key definitions and data fields, as well as making data collection easier,
we will make real progress toward widespread financial and performance benchmarking for
HTM.

9© 2018 AAMI n HTM Benchmarking Guide (2nd Edition)
References
1. Baretich MF, Painter F, Cohen T. HTM Levels Guide: A program-planning tool for healthcare technology management departments (2nd edition). Association for the Advancement of Medical Instrumentation. 2016.
2. Baretich MF. AEM Program Guide: Alternative PM for Patient Safety. Association for the Advancement of Medical Instrumentation. 2018.
3. Baretich MF. Electrical Safety Manual (2015 edition). Association for the Advancement of Medical Instrumentation. 2015.
4. Baretich MF. How to Use Financial Benchmarks. Biomedical Instrumentation & Technology. 2011;45(5)405–7.
5. Baretich MF. The Value of Certification. Biomedical Instrumentation & Technology. 2012;46(1):68–71.
6. Barta RA. Dashboards: A Required Business Management Tool. Biomedical Instrumentation & Technology. 2010;44(3)228–30.
7. Bureau of Labor Statistics. Occupational Outlook Handbook (www.bls.gov/ooh/installation-maintenance-and-repair/medical-equipment-repairers.htm).
8. Cohen T, Baretich MF. Computerized Maintenance Management Systems for Healthcare Technology Management (3rd edition). Association for the Advancement of Medical Instrumentation. 2017.
9. Cohen T. AAMI’s Benchmarking Solution: Analysis of Cost of Service Ratio and Other Metrics. Biomedical Instrumentation & Technology. 2010;44(4):346–9.
10. Cohen T. HTM Departments Should Operate like a Business. Biomedical Instrumentation & Technology. 2017;51(4):301-5.
11. Cohen T. HTM Departments Should Operate like a Business: Response to Maddock. Biomedical Instrumentation & Technology. 2017;51(5):359.
12. Cohen T. Staffing Metrics: A Case Study. Biomedical Instrumentation & Technology. 2011;45(4):321–3.
13. Cruz AM, Barr C, Denis ER. Offering Integrated Medical Equipment Management in an Application Service Provider Model. Biomedical Instrumentation & Technology. 2007;41(6)479–90.
14. Dickey DM, Wylie M, Gresch A. Benchmarking That Matters: A Proposed New Direction for Clinical Engineering. Biomedical Instrumentation & Technology. 2011;45(2):115–20.
15. Dickey DM. A Numbers Game – Benchmarker Beware. Journal of Clinical Engineering. 2008;33(3):140–2.
16. Dinsmore JD Jr. Benchmarking 101. Biomedical Instrumentation & Technology. 2006;40(1):29–31.
17. Dummert M. Staffing Models: How to Do It Right. Biomedical Instrumentation & Technology. 2012;46(1)44–7.
18. ECRI Institute. Communication Tips for Clinical Engineering. Health Devices. 2013;42(6):188–93.
19. ECRI Institute. Measuring Up. Health Devices. 2009;38(9):296–301.
20. Ewing C. Developing a Staffing Model for Service Delivery: Kaiser Permanente Northern California Clinical Technology. Journal of Clinical Engineering. 2015;40(1):25-34.
21. Gaev JA. Developing Benchmarks for Clinical Engineering Activities: A Methodology. Biomedical Instrumentation & Technology. 2007;41(4):267–77.
22. Ibey AAM, King D, Hsieh T, et al. What Constitutes a Clinical Engineering Asset? Journal of Clinical Engineering. 2015;49(3):165-8.
23. Kobernick T. Using Data to Help Evaluate and Justify Your Staffing Needs. Biomedical Instrumentation & Technology. 2010;44(2):118–9.
24. Lewis D. When Benchmarking Goes Bad: What Recourse Do CE Departments Have? Biomedical Instrumentation & Technology. 2008;42(5):364–6.
25. Lynch PK. Are You Ready For the Future? Biomedical Instrumentation & Technology. 2012;46(2):150–1.
26. Lynch PK. Why Can’t We Learn? Biomedical Instrumentation & Technology. 2014;48(5)398–9.
27. Maddock K, Hertzler L. On Sculpture, Baseball, and Benchmarking. Biomedical Instrumentation & Technology. 2007;41(4)332.
28. Maddock KE. The (Benchmarking) Glass is Half Full. Biomedical Instrumentation & Technology. 2006;40(4):328.
29. Netwal R. Budget Model Can Help Department Take Control of Its Financial Future. Biomedical Instrumentation & Technology. 2010;44(5):389–90.
30. Painter F. Designing and Developing A CE Department. Biomedical Instrumentation & Technology. 2011;45(6):488–90.
31. Perspectives From ECRI Institute: Benchmarking for Clinical Engineering Departments. Journal of Clinical Engineering. 2009;34(1):39–40.
32. Stiefel RH. Cautions and Precautions. Biomedical Instrumentation & Technology. 2011;45(3):231.
33. Stiefel RH. Performance Improvement: A Topic Whose Time Has Come—Again. Biomedical Instrumentation & Technology. 2010;44(2):147–9.
34. Subhan A. Clinical Engineering Staffing. Journal of Clinical Engineering. 2013;38(2):47-8.
35. Vockley M. Opening Doors: Get Noticed by the C-Suite. Biomedical Instrumentation & Technology. 2010;44(3):192–7.
36. Wang B, Eliason RW, Richards SM. Clinical Engineering Benchmarking: An Analysis of American Acute Care Hospitals. Journal of Clinical Engineering. 2008;33(1):24–7.
10 © 2018 AAMI n HTM Benchmarking Guide (2nd Edition)
37. Wang B, Eliason RW, Vanderzee SC. Global Failure Rate: A Promising Medical Equipment Management Outcome Benchmark. Journal of Clinical Engineering. 2006;31(3):145–51.
38. Wang B, Fedele J, Pridgen B. Evidence-Based Maintenance: Part I: Measuring Maintenance Effectiveness With Failure Codes. Journal of Clinical Engineering. 2010;35(3):132–44.
39. Wang B, Fedele J, Pridgen B. Evidence-Based Maintenance: Part II: Comparing Maintenance Strategies Using Failure Codes. Journal of Clinical Engineering. 2010;35(4):223–30.
40. Wang B, Fedele J, Pridgen B. Evidence-Based Maintenance: Part III, Enhancing Patient Safety Using Failure Code Analysis. Journal of Clinical Engineering. 2011;36(2):72–84.
41. Wang B, Rui T, Fedele J. Clinical Engineering Productivity and Staffing Revisited: How Should It Be Measured and Used? Journal of Clinical Engineering. 2012;37(4):135–45.
42. Wang B, Rui T, Koslosky J. Evidence-Based Maintenance: Part IV—Comparison of Scheduled Inspection Procedures. Journal of Clinical Engineering. 2013;38(3):108–16.
43. Wang B. Who Drank My Wine? Biomedical Instrumentation & Technology. 2006;40(6):418.
44. Williams JS. Benchmarking Best Practice: Using Quality Measures to Strengthen Equipment Services. Biomedical Instrumentation & Technology. 2009;43(3):209–10.
45. Williams JS. For the Kids: Managing Medical Equipment in Children’s Hospitals. Biomedical Instrumentation & Technology. 2009;43(5):360–7.
46. Williams JS. Steady Performance Gives Rural Department Edge to Respond to Challenges. Biomedical Instrumentation & Technology. 2008;42(4):291–3.
47. Zheng K, Wang B, Feng Q. Benchmarking Comparison Between Zhejiang Province and American Hospitals. Journal of Clinical Engineering. 2016;41(3):145-152.
11© 2018 AAMI n HTM Benchmarking Guide (2nd Edition)
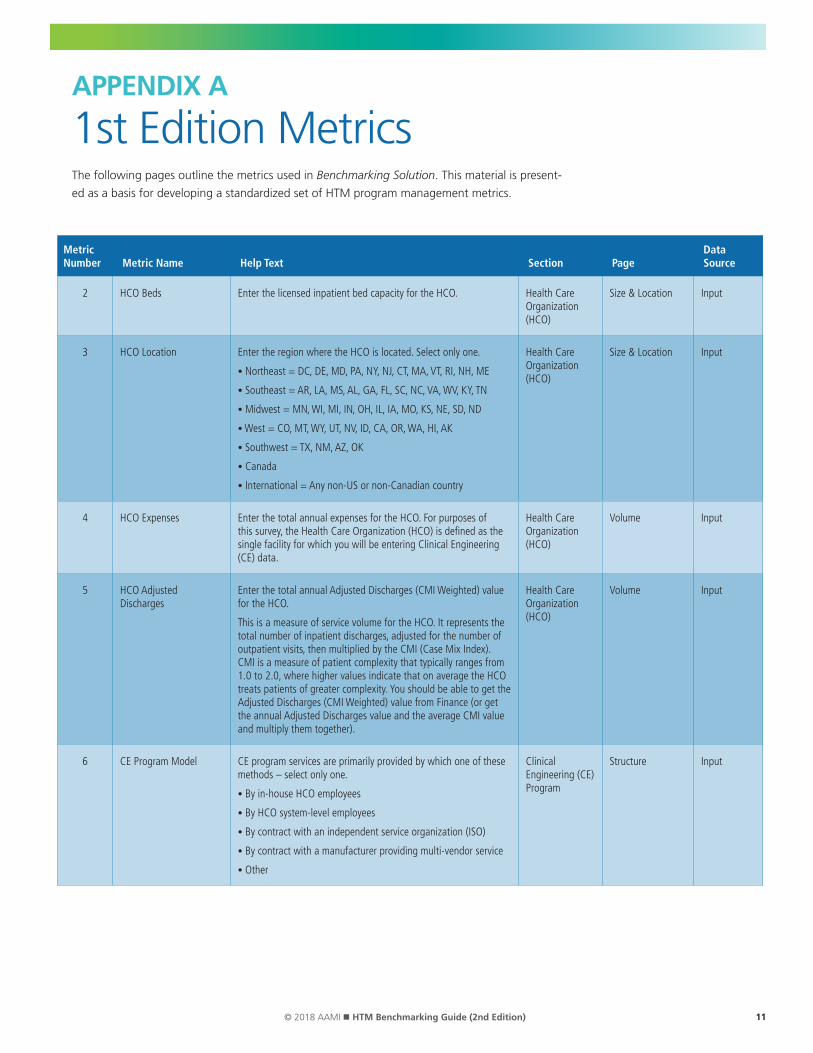
APPENDIX A
1st Edition MetricsThe following pages outline the metrics used in Benchmarking Solution. This material is present-
ed as a basis for developing a standardized set of HTM program management metrics.
Metric Number Metric Name Help Text Section Page
Data Source
2 HCO Beds Enter the licensed inpatient bed capacity for the HCO. Health Care Organization (HCO)
Size & Location Input
3 HCO Location Enter the region where the HCO is located. Select only one.
• Northeast = DC, DE, MD, PA, NY, NJ, CT, MA, VT, RI, NH, ME
• Southeast = AR, LA, MS, AL, GA, FL, SC, NC, VA, WV, KY, TN
• Midwest = MN, WI, MI, IN, OH, IL, IA, MO, KS, NE, SD, ND
• West = CO, MT, WY, UT, NV, ID, CA, OR, WA, HI, AK
• Southwest = TX, NM, AZ, OK
• Canada
• International = Any non-US or non-Canadian country
Health Care Organization (HCO)
Size & Location Input
4 HCO Expenses Enter the total annual expenses for the HCO. For purposes of this survey, the Health Care Organization (HCO) is defined as the single facility for which you will be entering Clinical Engineering (CE) data.
Health Care Organization (HCO)
Volume Input
5 HCO Adjusted Discharges
Enter the total annual Adjusted Discharges (CMI Weighted) value for the HCO.
This is a measure of service volume for the HCO. It represents the total number of inpatient discharges, adjusted for the number of outpatient visits, then multiplied by the CMI (Case Mix Index). CMI is a measure of patient complexity that typically ranges from 1.0 to 2.0, where higher values indicate that on average the HCO treats patients of greater complexity. You should be able to get the Adjusted Discharges (CMI Weighted) value from Finance (or get the annual Adjusted Discharges value and the average CMI value and multiply them together).
Health Care Organization (HCO)
Volume Input
6 CE Program Model CE program services are primarily provided by which one of these methods – select only one.
• By in-house HCO employees
• By HCO system-level employees
• By contract with an independent service organization (ISO)
• By contract with a manufacturer providing multi-vendor service
• Other
Clinical Engineering (CE) Program
Structure Input

12 © 2018 AAMI n HTM Benchmarking Guide (2nd Edition)
Metric Number Metric Name Help Text Section Page
Data Source
7 CE Program Reporting The CE program manager reports to which one of these HCO services – select only one.
• Facility Services
• Information Technology (IT)
• Supply Chain Management
• Nursing
• Support Services
• Finance
• Administration
• Other
Clinical Engineering (CE) Program
Structure Input
8 Committee Participation A representative of CE is an active member of which of these committees (check all that apply).
• Safety/Environment of Care
• Capital Acquisition
• Facility Design/Renovation
• Risk Management
• Patient Safety
• Strategic Planning
• Nursing Operations or Education
• IT Networking or Security
• Laser Safety
• Product Evaluation
• Quality Assurance
• Performance Improvement
• Radiation Safety
• None of the above
Clinical Engineering (CE) Program
Responsibilities Input
9 Equipment Acquisition Responsibilities
The CE program has significant responsibility and accountability for which of these medical equipment acquisition activities (check all that apply).
• Participation in equipment selection
• Arranging or managing evaluations by clinicians
• Specifying at least minimum requirements (e.g., standards compliance) for equipment acquisition
• Recommending maintenance and warranty requirements
• Incoming inspection
• Installation of equipment that does not require manufacturer or vendor installation
• Management of the installation when accomplished by others
• Authority to withhold all or partial payment if all purchase conditions are not met
• None of the above
Clinical Engineering (CE) Program
Responsibilities Input

13© 2018 AAMI n HTM Benchmarking Guide (2nd Edition)
Metric Number Metric Name Help Text Section Page
Data Source
10 Equipment Acquisition – Technologies
The CE program plays a significant role in the selection and acquisition of which of these technologies (check all that apply).
• Imaging (e.g., x-ray, ultrasound, CT, MRI)
• Therapeutic Radiology (e.g., gamma knife, linear accelerators, radiation treatment equipment)
• Clinical Laboratory (including devices used for the preparation, storage, and analysis of patient specimens and pharmaceuticals)
• Specialized surgical equipment (e.g., robotics)
• General biomedical equipment (devices for monitoring, diagnosis, treatment, or life support, but not included in the categories above)
• Non-patient care devices (e.g., patient transportation, patient entertainment systems, general purpose computers, communications equipment, and other systems not included in the categories above)
• None of the above
Clinical Engineering (CE) Program
Responsibilities Input
11 Equipment Maintenance Responsibilities
The CE program has significant responsibility and accountability for which of these medical equipment maintenance activities (check all that apply).
• Selection of vendors and negotiation of maintenance contracts
• Scheduled maintenance by CE
• Repairs by CE
• Documenting in the CMMS all maintenance performed by all providers
• Overseeing repairs performed by vendors or manufacturers
• Overseeing scheduled maintenance performed by vendors or manufacturers
• Including all costs in the CMMS documentation regardless of provider
• Deinstallation and disposal of medical equipment
• None of the above
Clinical Engineering (CE) Program
Responsibilities Input
12 Equipment Maintenance – Technologies
The CE program is responsible for managing or providing maintenance for which of these technologies (check all that apply).
• Imaging (e.g., x-ray, ultrasound, CT, MRI)
• Therapeutic Radiology (e.g. gamma knife, linear accelerator, radiation treatment equipment)
• Clinical Laboratory (including devices used for the preparation, storage, and analysis of patient specimens and pharmaceuticals)
• Specialized surgical equipment (e.g., robotics)
• General biomedical equipment (devices for monitoring, diagnosis, treatment, or life support, but not included in the categories above)
• Non-patient care devices (e.g. patient transportation, patient entertainment systems, general purpose computers, communications equipment, and other systems not included in the categories above)
• None of the above
Clinical Engineering (CE) Program
Responsibilities Input

14 © 2018 AAMI n HTM Benchmarking Guide (2nd Edition)
Metric Number Metric Name Help Text Section Page
Data Source
13 CE Space – Shop Square feet of shop space for the CE program. Clinical Engineering (CE) Program
Space Input
14 CE Space – Office Square feet of office space for the CE program. Clinical Engineering (CE) Program
Space Input
15 CE Space – Other Square feet of other space for the CE program. Clinical Engineering (CE) Program
Space Input
16 CE Space – Total This answer is the sum of CE space for shop, office, and other. Clinical Engineering (CE) Program
Space Calculated
17 Devices – Total Total number of all devices managed or maintained by CE.
• Managed by the CE program means that CE is responsible for maintenance (inspection, scheduled maintenance, and repair) and the cost of maintenance using an external service provider (by contract or by non-contract labor and materials).
• Maintained by the CE program means that CE is responsible for maintenance (inspection, scheduled maintenance, and repair) using CE staff.
Devices Number of Devices Input
18 Devices – Imaging and Therapeutic Radiology
Total number of all imaging equipment and therapeutic radiology equipment managed or maintained by CE. Examples are x-ray equipment, ultrasound equipment, CT systems, nuclear medicine systems, MR systems, linear accelerators, and other radiation treatment equipment.
Devices Number of Devices Input
19 Devices – Laboratory Equipment
Total number of all clinical laboratory equipment managed or maintained by CE. This category includes devices used for the preparation, storage, or analysis of patient specimens and pharmaceuticals.
Devices Number of Devices Input
20 Devices – General Biomedical Equipment
Total number of all the general biomedical equipment (devices not included in the two categories above) managed or maintained by CE. These are devices that provide monitoring, diagnosis, treatment, or life support. Examples: physiological monitors, infusion pumps, dialysis equipment, surgical equipment, scales, clinic equipment, ventilators, etc.
Devices Number of Devices Input
21 Devices – Other Total number of all other devices (patient care and non-patient care devices not included in the three categories above) managed or maintained by CE. Examples: beds, stretchers, wheelchairs, nurse call systems, patient entertainment systems, general purpose computers, communications equipment, TVs, etc.
Devices Number of Devices Input
23 CT Scanners The number of CT scanners that are managed or maintained by the CE program.
Devices Device Count Details
Input
24 MRI Scanners The number of MRI scanners that are managed or maintained by the CE program.
Devices Device Count Details
Input
25 Hybrid Imaging Systems The number of hybrid imaging systems (e.g., PET/CT, SPECT/CT) that are managed or maintained by the CE program.
Devices Device Count Details
Input
15© 2018 AAMI n HTM Benchmarking Guide (2nd Edition)
Metric Number Metric Name Help Text Section Page
Data Source
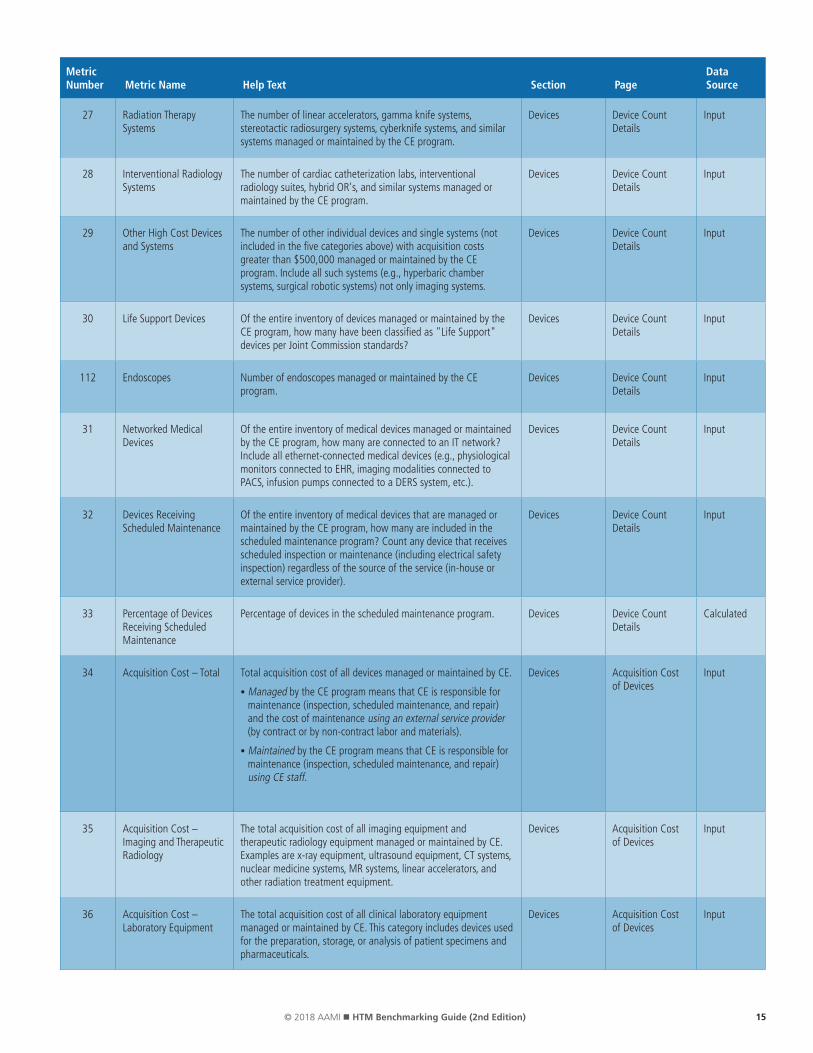
27 Radiation Therapy Systems
The number of linear accelerators, gamma knife systems, stereotactic radiosurgery systems, cyberknife systems, and similar systems managed or maintained by the CE program.
Devices Device Count Details
Input
28 Interventional Radiology Systems
The number of cardiac catheterization labs, interventional radiology suites, hybrid OR's, and similar systems managed or maintained by the CE program.
Devices Device Count Details
Input
29 Other High Cost Devices and Systems
The number of other individual devices and single systems (not included in the five categories above) with acquisition costs greater than $500,000 managed or maintained by the CE program. Include all such systems (e.g., hyperbaric chamber systems, surgical robotic systems) not only imaging systems.
Devices Device Count Details
Input
30 Life Support Devices Of the entire inventory of devices managed or maintained by the CE program, how many have been classified as "Life Support" devices per Joint Commission standards?
Devices Device Count Details
Input
112 Endoscopes Number of endoscopes managed or maintained by the CE program.
Devices Device Count Details
Input
31 Networked Medical Devices
Of the entire inventory of medical devices managed or maintained by the CE program, how many are connected to an IT network? Include all ethernet-connected medical devices (e.g., physiological monitors connected to EHR, imaging modalities connected to PACS, infusion pumps connected to a DERS system, etc.).
Devices Device Count Details
Input
32 Devices Receiving Scheduled Maintenance
Of the entire inventory of medical devices that are managed or maintained by the CE program, how many are included in the scheduled maintenance program? Count any device that receives scheduled inspection or maintenance (including electrical safety inspection) regardless of the source of the service (in-house or external service provider).
Devices Device Count Details
Input
33 Percentage of Devices Receiving Scheduled Maintenance
Percentage of devices in the scheduled maintenance program. Devices Device Count Details
Calculated
34 Acquisition Cost – Total Total acquisition cost of all devices managed or maintained by CE.
• Managed by the CE program means that CE is responsible for maintenance (inspection, scheduled maintenance, and repair) and the cost of maintenance using an external service provider (by contract or by non-contract labor and materials).
• Maintained by the CE program means that CE is responsible for maintenance (inspection, scheduled maintenance, and repair) using CE staff.
Devices Acquisition Cost of Devices
Input
35 Acquisition Cost – Imaging and Therapeutic Radiology
The total acquisition cost of all imaging equipment and therapeutic radiology equipment managed or maintained by CE. Examples are x-ray equipment, ultrasound equipment, CT systems, nuclear medicine systems, MR systems, linear accelerators, and other radiation treatment equipment.
Devices Acquisition Cost of Devices
Input
36 Acquisition Cost – Laboratory Equipment
The total acquisition cost of all clinical laboratory equipment managed or maintained by CE. This category includes devices used for the preparation, storage, or analysis of patient specimens and pharmaceuticals.
Devices Acquisition Cost of Devices
Input
16 © 2018 AAMI n HTM Benchmarking Guide (2nd Edition)
Metric Number Metric Name Help Text Section Page
Data Source
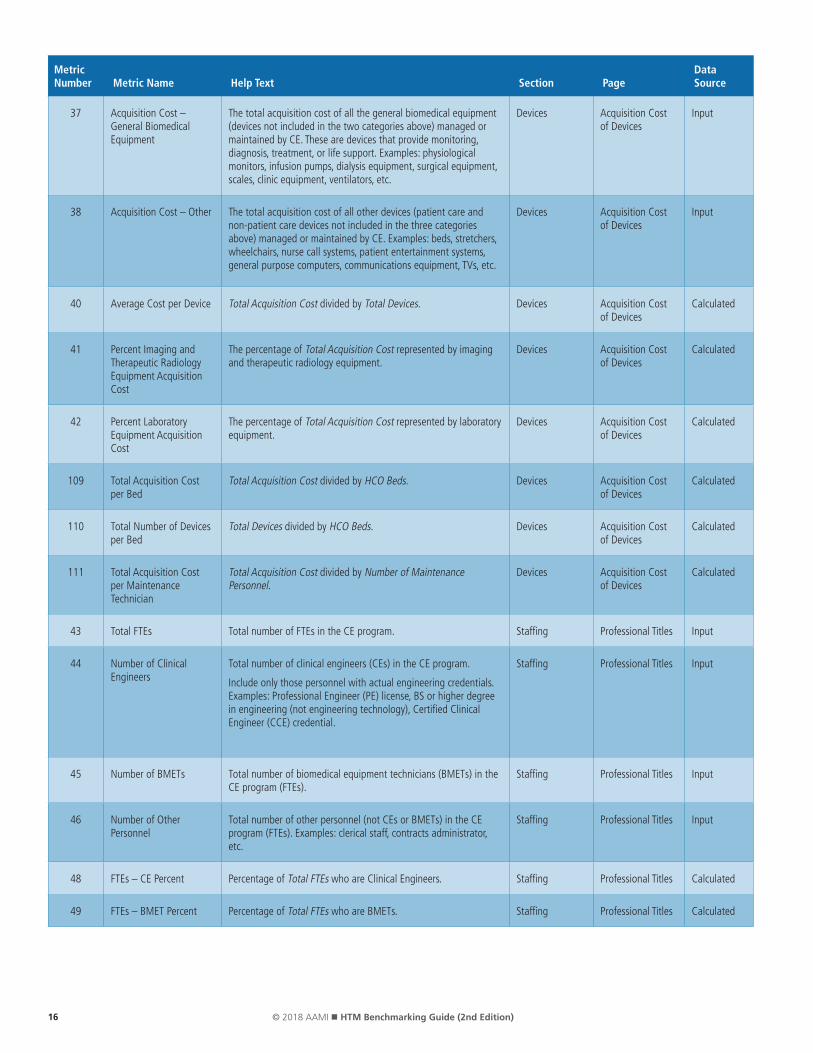
37 Acquisition Cost – General Biomedical Equipment
The total acquisition cost of all the general biomedical equipment (devices not included in the two categories above) managed or maintained by CE. These are devices that provide monitoring, diagnosis, treatment, or life support. Examples: physiological monitors, infusion pumps, dialysis equipment, surgical equipment, scales, clinic equipment, ventilators, etc.
Devices Acquisition Cost of Devices
Input
38 Acquisition Cost – Other The total acquisition cost of all other devices (patient care and non-patient care devices not included in the three categories above) managed or maintained by CE. Examples: beds, stretchers, wheelchairs, nurse call systems, patient entertainment systems, general purpose computers, communications equipment, TVs, etc.
Devices Acquisition Cost of Devices
Input
40 Average Cost per Device Total Acquisition Cost divided by Total Devices. Devices Acquisition Cost of Devices
Calculated
41 Percent Imaging and Therapeutic Radiology Equipment Acquisition Cost
The percentage of Total Acquisition Cost represented by imaging and therapeutic radiology equipment.
Devices Acquisition Cost of Devices
Calculated
42 Percent Laboratory Equipment Acquisition Cost
The percentage of Total Acquisition Cost represented by laboratory equipment.
Devices Acquisition Cost of Devices
Calculated
109 Total Acquisition Cost per Bed
Total Acquisition Cost divided by HCO Beds. Devices Acquisition Cost of Devices
Calculated
110 Total Number of Devices per Bed
Total Devices divided by HCO Beds. Devices Acquisition Cost of Devices
Calculated
111 Total Acquisition Cost per Maintenance Technician
Total Acquisition Cost divided by Number of Maintenance Personnel.
Devices Acquisition Cost of Devices
Calculated
43 Total FTEs Total number of FTEs in the CE program. Staffing Professional Titles Input
44 Number of Clinical Engineers
Total number of clinical engineers (CEs) in the CE program.
Include only those personnel with actual engineering credentials. Examples: Professional Engineer (PE) license, BS or higher degree in engineering (not engineering technology), Certified Clinical Engineer (CCE) credential.
Staffing Professional Titles Input
45 Number of BMETs Total number of biomedical equipment technicians (BMETs) in the CE program (FTEs).
Staffing Professional Titles Input
46 Number of Other Personnel
Total number of other personnel (not CEs or BMETs) in the CE program (FTEs). Examples: clerical staff, contracts administrator, etc.
Staffing Professional Titles Input
48 FTEs – CE Percent Percentage of Total FTEs who are Clinical Engineers. Staffing Professional Titles Calculated
49 FTEs – BMET Percent Percentage of Total FTEs who are BMETs. Staffing Professional Titles Calculated

17© 2018 AAMI n HTM Benchmarking Guide (2nd Edition)
Metric Number Metric Name Help Text Section Page
Data Source
50 Number of Managers and Supervisors
Number of FTEs in the CE department that are primarily involved in management and supervision.
Allocate fractional FTEs for working supervisors (e.g., a full-time employee who does supervisory work 40% of the time and maintenance work 60% of the time would have 0.4 FTE here and 0.6 FTE in the next question).
Staffing Professional Roles Input
51 Number of Maintenance Personnel
The number of FTEs in the CE department that are primarily involved in maintenance (inspection, scheduled maintenance, repair) and related activities.
Staffing Professional Roles Input
52 Number of Personnel in Other Roles
The number of FTEs in the CE department that are primarily involved in other functions (not management/supervision and not maintenance).
Staffing Professional Roles Input
54 Percent Management Staff
Percentage of CE staff in management or supervision. Staffing Professional Roles Calculated
55 Percent Maintenance Staff
Percentage of CE staff in maintenance activities. Staffing Professional Roles Calculated
57 Span of Control Number of employees per supervisor. Staffing Professional Roles Calculated
58 Certification Support Select all of the certification-related policies that have been adopted by the CE program.
• Reimbursement of the application or testing fee
• Reimbursement for study materials
• Reimbursement for review classes
• Reimbursement for travel costs of testing
• Formal recognition of certification achievements
• Promotion or increase in pay for certification
• None of the above
Staffing Professional Qualifications
Input
59 Certification – CCE Number of CE program staff who hold the Certified in Clinical Engineering (CCE) credential.
Staffing Professional Qualifications
Input
60 Certification – CBET Number of CE program staff who hold one or more BMET certification (CBET, CLES, CRES) credentials.
Staffing Professional Qualifications
Input
61 Certification – IT Number of CE program staff who hold one or more IT certification credentials. Examples: Cisco and Microsoft networking and computer certifications, A+, Network+, etc.
Staffing Professional Qualifications
Input
62 Certification – CCE Percent
Percentage of Total FTEs with CE certification credential. Staffing Professional Qualifications
Calculated
63 Certification – CBET Percent
Percentage of Total FTEs with BMET certification credentials. Staffing Professional Qualifications
Calculated
64 Certification – IT Percent Percentage of Total FTEs with IT certification credentials. Staffing Professional Qualifications
Calculated
18 © 2018 AAMI n HTM Benchmarking Guide (2nd Edition)
Metric Number Metric Name Help Text Section Page
Data Source
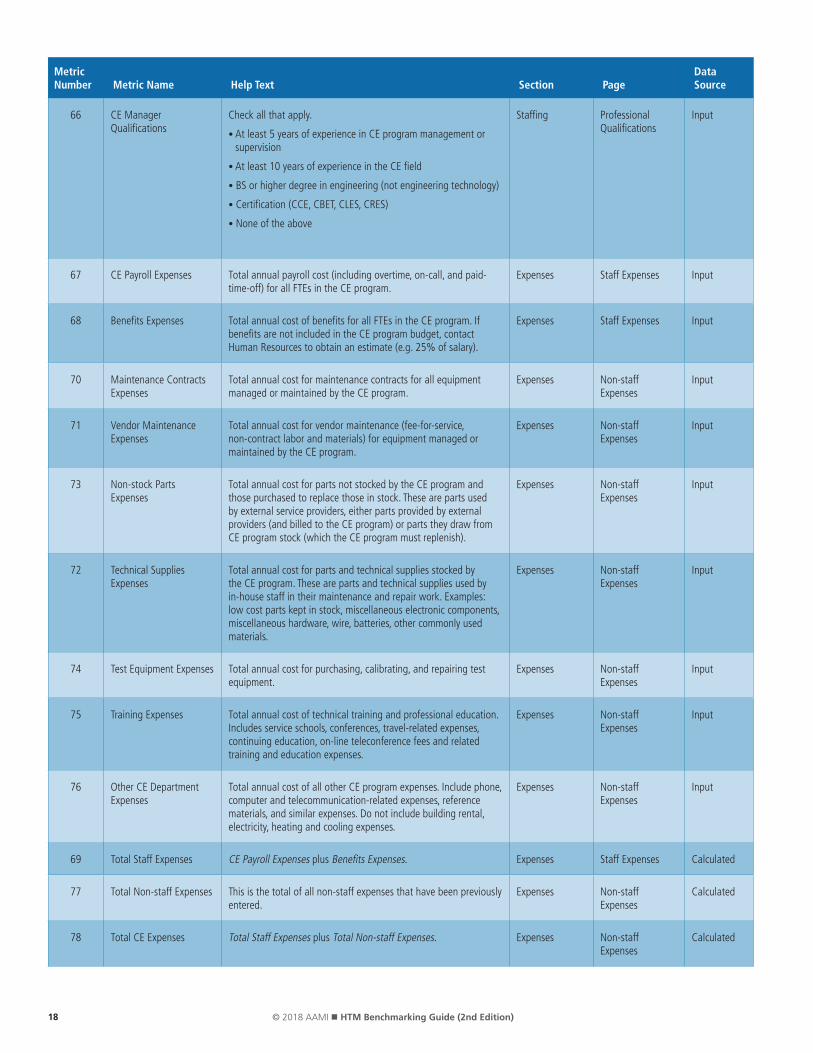
66 CE Manager Qualifications
Check all that apply.
• At least 5 years of experience in CE program management or supervision
• At least 10 years of experience in the CE field
• BS or higher degree in engineering (not engineering technology)
• Certification (CCE, CBET, CLES, CRES)
• None of the above
Staffing Professional Qualifications
Input
67 CE Payroll Expenses Total annual payroll cost (including overtime, on-call, and paid-time-off) for all FTEs in the CE program.
Expenses Staff Expenses Input
68 Benefits Expenses Total annual cost of benefits for all FTEs in the CE program. If benefits are not included in the CE program budget, contact Human Resources to obtain an estimate (e.g. 25% of salary).
Expenses Staff Expenses Input
70 Maintenance Contracts Expenses
Total annual cost for maintenance contracts for all equipment managed or maintained by the CE program.
Expenses Non-staff Expenses
Input
71 Vendor Maintenance Expenses
Total annual cost for vendor maintenance (fee-for-service, non-contract labor and materials) for equipment managed or maintained by the CE program.
Expenses Non-staff Expenses
Input
73 Non-stock Parts Expenses
Total annual cost for parts not stocked by the CE program and those purchased to replace those in stock. These are parts used by external service providers, either parts provided by external providers (and billed to the CE program) or parts they draw from CE program stock (which the CE program must replenish).
Expenses Non-staff Expenses
Input
72 Technical Supplies Expenses
Total annual cost for parts and technical supplies stocked by the CE program. These are parts and technical supplies used by in-house staff in their maintenance and repair work. Examples: low cost parts kept in stock, miscellaneous electronic components, miscellaneous hardware, wire, batteries, other commonly used materials.
Expenses Non-staff Expenses
Input
74 Test Equipment Expenses Total annual cost for purchasing, calibrating, and repairing test equipment.
Expenses Non-staff Expenses
Input
75 Training Expenses Total annual cost of technical training and professional education. Includes service schools, conferences, travel-related expenses, continuing education, on-line teleconference fees and related training and education expenses.
Expenses Non-staff Expenses
Input
76 Other CE Department Expenses
Total annual cost of all other CE program expenses. Include phone, computer and telecommunication-related expenses, reference materials, and similar expenses. Do not include building rental, electricity, heating and cooling expenses.
Expenses Non-staff Expenses
Input
69 Total Staff Expenses CE Payroll Expenses plus Benefits Expenses. Expenses Staff Expenses Calculated
77 Total Non-staff Expenses This is the total of all non-staff expenses that have been previously entered.
Expenses Non-staff Expenses
Calculated
78 Total CE Expenses Total Staff Expenses plus Total Non-staff Expenses. Expenses Non-staff Expenses
Calculated

19© 2018 AAMI n HTM Benchmarking Guide (2nd Edition)
Metric Number Metric Name Help Text Section Page
Data Source
81 In-house Maintenance Costs
Total annual cost for maintenance provided by CE program personnel. Includes Total Staff Expenses plus Total Non-staff Expenses minus Non-stock Parts Expenses, Maintenance Contracts Expenses, and Vendor Maintenance Expenses (or Total Expenses less External Maintenance Costs).
Operations Maintenance/Repair
Calculated
82 External Maintenance Costs
Total annual cost for maintenance provided by external sources. Includes Non-stock Parts Expenses plus Maintenance Contracts Expenses plus Vendor Maintenance Expenses.
Operations Maintenance/Repair
Calculated
83 External Maintenance Cost to Total Maintenance Cost Ratio
External Maintenance Costs divided by Total Expenses expressed as a percentage.
Operations Maintenance/Repair
Calculated
79 Travel Time Total hours that CE program personnel spent TRAVELING to "off-campus" work locations (e.g. clinics, outpatient surgery centers, etc.). "Off-campus" definition: Greater than 1 mile, required to drive, fly, etc. Beyond walking distance.
Operations Maintenance/Repair
Input
80 In-house Maintenance Hours
Total annual hours expended by CE program staff on equipment maintenance (inspection, scheduled maintenance, and repair). Use actual data recorded in the CMMS.
Operations Maintenance/Repair
Input
65 Training Received Hours Total paid hours of training received by CE program staff. Staffing Professional Qualifications
Input
87 Product Alerts/Recalls Hours
Number of hours the CE program staff spend on handling product alerts and recalls.
Operations Technology Management
Input
84 Incident Investigation Hours
Number of hours the CE program staff spend on incident investigation. Include all hours spent on incident investigations and follow-up, including Failure Modes and Effects Analysis (FMEA) and Root Cause Analysis (RCA).
Operations Technology Management
Input
85 Strategic Planning and Pre-Procurement Technology Evaluation Hours
Number of hours the CE program staff spend on strategic planning and pre-purchase/pre-procurement evaluations. Include strategic planning, market research, technology assessment, replacement planning, evaluation, specification and RFP development, bid evaluation (e.g. for projects, include time spent up until vendor selection and contract award).
Operations Technology Management
Input
86 Technology Implementation Hours
Number of hours CE program staff spend on technology implementation. Include pre-implementation planning, implementation planning, clinician/facility/vendor/IT coordination, and installation. Do not include time included in the pre-purchase/pre-procurement question immediately above. Do not include time for incoming inspection of equipment.
Operations Technology Management
Input
88 Teaching Hours Number of hours the CE program staff spend on TEACHING other staff. Include time for developing training materials as well as actual training time. Examples: clinical staff in-services, provision of training to other staff (including CE program staff, clinicians, and any other HCO personnel), and "one-on-one" teaching.
Operations Technology Management
Input
89 Hours for other projects and tasks not included above
Hours for other projects and tasks not included above Example: Medical device research and development. Do not include maintenance activities (inspection, scheduled maintenance, and repair) here.
Operations Technology Management
Input
20 © 2018 AAMI n HTM Benchmarking Guide (2nd Edition)
Metric Number Metric Name Help Text Section Page
Data Source
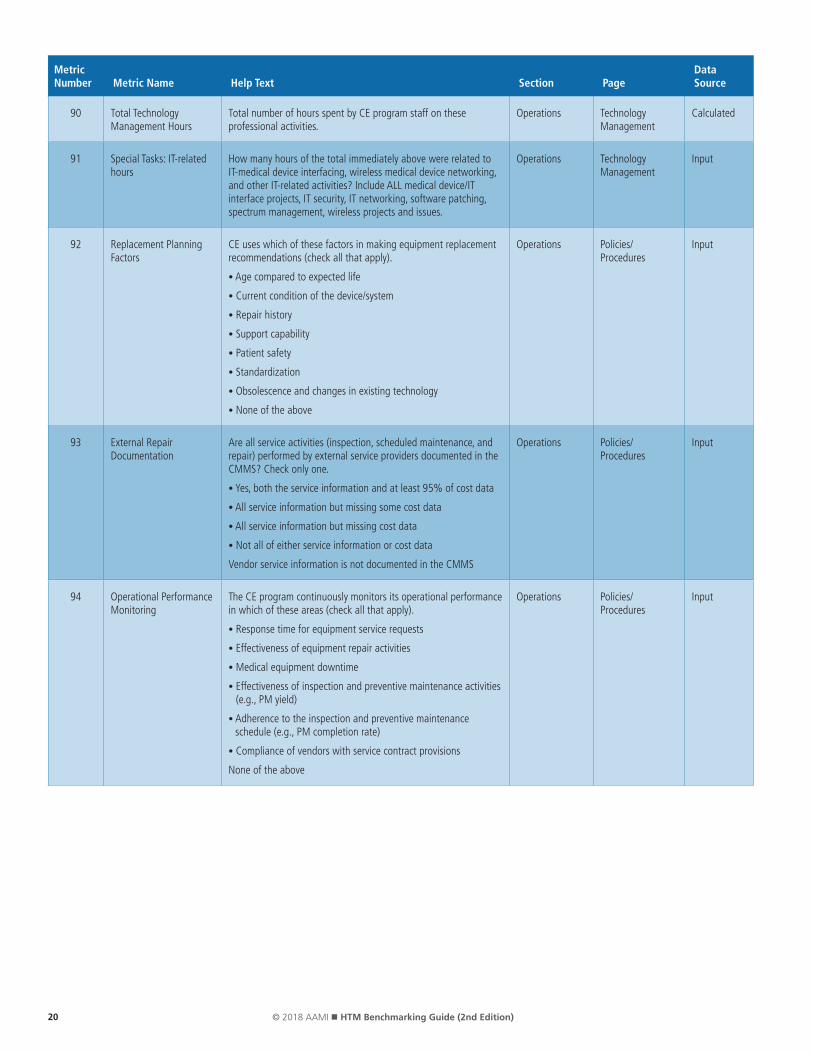
90 Total Technology Management Hours
Total number of hours spent by CE program staff on these professional activities.
Operations Technology Management
Calculated
91 Special Tasks: IT-related hours
How many hours of the total immediately above were related to IT-medical device interfacing, wireless medical device networking, and other IT-related activities? Include ALL medical device/IT interface projects, IT security, IT networking, software patching, spectrum management, wireless projects and issues.
Operations Technology Management
Input
92 Replacement Planning Factors
CE uses which of these factors in making equipment replacement recommendations (check all that apply).
• Age compared to expected life
• Current condition of the device/system
• Repair history
• Support capability
• Patient safety
• Standardization
• Obsolescence and changes in existing technology
• None of the above
Operations Policies/Procedures
Input
93 External Repair Documentation
Are all service activities (inspection, scheduled maintenance, and repair) performed by external service providers documented in the CMMS? Check only one.
• Yes, both the service information and at least 95% of cost data
• All service information but missing some cost data
• All service information but missing cost data
• Not all of either service information or cost data
Vendor service information is not documented in the CMMS
Operations Policies/Procedures
Input
94 Operational Performance Monitoring
The CE program continuously monitors its operational performance in which of these areas (check all that apply).
• Response time for equipment service requests
• Effectiveness of equipment repair activities
• Medical equipment downtime
• Effectiveness of inspection and preventive maintenance activities (e.g., PM yield)
• Adherence to the inspection and preventive maintenance schedule (e.g., PM completion rate)
• Compliance of vendors with service contract provisions
None of the above
Operations Policies/Procedures
Input

21© 2018 AAMI n HTM Benchmarking Guide (2nd Edition)
Metric Number Metric Name Help Text Section Page
Data Source
95 IT-Related Planning The CE program is actively involved in planning which of these IT-related activities (check all that apply).
• Remote monitoring of medical device network performance
• Manage backup and system administrative functions in clinical equipment networks
• Integration of medical devices and IT systems (e.g., EMR)
• Computer and network security
• Wireless spectrum management
• Clinical alarm and alarm secondary communication management
• Network design for networked clinical systems
None of the above
Operations Policies/Procedures
Input
96 Scheduled Maintenance Outcomes
What percentage of scheduled inspection and maintenance work orders identify a need for corrective maintenance? Sometimes this is called “PM yield”. Please note that ten percent, for example, should be entered as “10” rather than as “0.10” for this item.
Operations Policies/Procedures
Input
97 NPF Outcomes What percentage of work orders are identified as “No Problem Found,” “Could Not Duplicate,” “Use Error,” “Abuse,” or similar designation? Please note that ten percent, for example, should be entered as “10” rather than as “0.10” for this item.
Operations Policies/Procedures
Input
98 Shop Space per maintenance FTE
CE Shop Space divided by Total Maintenance Personnel. Operations Calculated Performance Metrics
Calculated
99 Devices per Technician Total Devices divided by Total Maintenance Personnel. Operations Calculated Performance Metrics
Calculated
100 In-house Maintenance Hours to Paid Hours Ratio
In-house Maintenance Hours to paid hours (Maintenance FTEs x 2080 hours) as a percentage. This can be used as an approximate measure of department productivity.
Operations Calculated Performance Metrics
Calculated
101 Hourly Cost of In-house Maintenance
The cost per hour for the in-house staff to provide services is calculated by dividing In-house Maintenance Costs by In-house Maintenance Hours.
Operations Calculated Performance Metrics
Calculated
102 Technology Management %
This is the percentage of CE program work that is spent on technology management activities (as distinct from maintenance and repair activities).
Operations Calculated Performance Metrics
Calculated
103 Total CE program expense relative to total HCO expense
The cost to run the CE program as a percentage of the HCO's operating cost is calculated by dividing the Total CE Expenses by HCO Expenses, expressed as a percentage.
Operations Calculated Performance Metrics
Calculated
104 Total CE program expense per Adjusted Discharges (CMI Weighted)
The cost to run the CE program per Adjusted Discharge (CMI Weighted) is calculated by dividing Total CE Expenses by HCO Adjusted Discharges.
Operations Calculated Performance Metrics
Calculated
105 Cost of Service Ratio (COSR)
The ratio of the Total Maintenance Cost to the Total Acquisition Cost is calculated by dividing Total CE Expenses by Total Acquisition Cost, expressed as a percentage.
Operations Calculated Performance Metrics
Calculated

22 © 2018 AAMI n HTM Benchmarking Guide (2nd Edition)
APPENDIX B
2nd Edition MetricsIn addition to the 1st edition metrics listed in Appendix A, the HTM Benchmarking Task Force developed and reviewed a small
set of refined and standardized definitions for HTM performance metrics (see below). The intent of these metrics is to provide a
focused set of non-financial performance indicators to complement earlier financial indicators, such as COSR.
In many hospitals, scheduled maintenance compliance (percentage of scheduled maintenance completed on schedule) is the only
HTM performance indicator used because it is the metric that accrediting organizations require and review. Our proposed indicators
attempt to measure equipment reliability and HTM staff support, both of which impact the quality and safety of patient care.
The performance metrics listed in the table below have been used by individual institutions for many years, but there are few (if
any) published studies of their use for external benchmarking. We encourage HTM programs (and CMMS vendors) to implement
these performance metrics and, if possible, use them for published benchmarking comparison studies. We also encourage clinical
engineers and other HTM professionals to participate in AAMI’s HTM-related standards development efforts, including work now
under way to develop an online repository of standardized HTM terminology.
Metric Category
Metric Name
Numerator Definition
Denominator Definition
CMMS Fields Metric Formula Comments and Notes
X Failures per Device per Year
Failure Count Device Count A. CM Work Order Close Date
B. Device Count
C. CM Work Order Count
D. Failure “Root Cause”
For one-year period based on Work Order Close Date:
Gross Failure Count = C/B
Filtered Failure Count = C/B where C is only as designated by the failure filter D (e.g., not counting use errors)
• Further define failures as:
• Required: Gross (all non-scheduled work orders).
• Optional: Include filtered (only confirmed device problems or failures, not including use errors, facility or utility problems, IT problems, etc.).
X & Y Uptime Hard Downtime Hours System Scheduled Hours per Year
A. Hard Down Hours
B. System Schedule
C. System Open Hours per Year
Average Uptime %
= (ΣC-ΣA)/ ΣC x 100
• Define critical systems for downtime purposes.
• Include only “hard” downtime in numerator. Define “hard” as system not usable for clinical care.
• Include only normal schedule in denominator (e.g., 24x7 or MF 8-5).
• Exclude planned downtime hours (e.g., PM for 24x7 systems).
Y Average Turnaround Time
Work Order End Date & Time – Work Order Start Date & Time
Averaged over one-year period
A. Work Order End Date & Time
B. Work Order Start Date & Time
C. Work Order Count
Σ(A-B)/ ΣC • Overall
• Optionally, as additional metric, filter for only HTM department work, removing vendor impact (e.g., awaiting parts).
Y Average Response Time
Initial HTM Department Response Date & Time – Request Date & Time
Averaged over one-year period
A. Work Order Initial Response Date & Time
B. Work Order Request Date & Time
C. Work Order Count
D. Work Order Response Request Category
Σ(A-B)/ ΣC • Required: Overall.
• Option: Calculate for each Response Request Priority category (e.g., 80% of those CM work orders requested as a “Response < 4 hours” actually had a response of less than 4 hours.
X & Y Repeat Repairs Number of repair requests for the same device within a 30-day timeframe
Number of CM work orders in one-year period
A. Work Order Type (CM Only)
B. Work Order Request Data
C. Equipment ID Tag
(RequestDate2-RequestDate1) ≤ 30 days
.AND. (Tag2-Tag1)
Metric Category X: Device Reliability
Metric Category Y: HTM Support Capability
23© 2018 AAMI n HTM Benchmarking Guide (2nd Edition)
As healthcare systems have grown through mergers and acquisitions, some have created cor-
porate HTM departments. For benchmarking purposes, new guidelines are needed in order to
appropriately capture these corporate level costs and other changes. Traditional HTM benchmark
metrics have been structured to measure the cost of HTM departments within individual hospitals
using metrics such as the Cost of Service Ratio and Effective Hourly Rate. However, some of these
HTM functions, and therefore their costs, are now being carried out by corporate HTM depart-
ments and may not be allocated to individual hospital accounts.
To maintain the capability to compare hospitals by size, geographic location, and other “demo-
graphic” characteristics, we need to continue to allocate all HTM costs to individual hospitals and
to provide some new “rollup” capabilities to look at an overall healthcare system. The bench-
marking level of granularity (clinic, hospital, campus, region, national, international) is, of course,
left up to the individual organization, but if we want to perform regional benchmarking, we have
to provide data at the region level, and/or for each individual entity within the region, including
their allocated corporate overhead.
Tasks performed at the corporate HTM level will vary at each institution and may include both
repair and maintenance activities (e.g. corporate level field service specialists) and project and
engineering work (see Appendix D). Project and engineering work can include risk management
and accident investigation, technology assessment and pre-purchase evaluations, IT-related tasks
(e.g., interoperability, cybersecurity), CMMS management, service contract management, and
many other clinical engineering activities. For benchmarking purposes, our proposed cost alloca-
tion guidelines are as follow:
1. For any repair and maintenance work, including field service, cost allocation should be to
the individual work order and its associated device. Since the device is typically “owned”
by a hospital or clinic the cost allocation roll-up should be to that specific entity. This is
no different from the benchmarking allocations and roll-up traditionally being done for
individual hospitals. Labor costs (Effective Hourly Rate) for corporate-level field service
staff should be fully burdened and include salary, benefits, allocated management and
staff (e.g., clerical), other overhead, and all the other internal costs used in the HTM
Benchmarking definition for Effective Hourly Rate.
2. Costs that are not funded to individual work orders or project accounts at the hospital
level need to be allocated. After a review of several allocation methodologies—including
number of beds, number of devices, and number of FTEs—we propose that Equipment
Acquisition Cost be used as the allocating metric for costs that are not otherwise directly
allocated.
Allocation of Corporate-Level HTM Expenses
APPENDIX C

24 © 2018 AAMI n HTM Benchmarking Guide (2nd Edition)
We recommend the use of acquisition cost as the allocating metric because it is already in use for
COSR calculations. However, if equipment acquisition cost data are not available, other allocating
metrics can probably be used with relatively little effect on allocation values.
For example, suppose a large multi-state healthcare organization has a centralized HTM office
that includes 12 FTEs (6 field service FTE, 1 technology assessment and pre-purchase evaluation
clinical engineer, 2 CMMS support staff, 2 CE-IT staff, and 1 clerk). Fully burdened (Effective
Hourly Rate) costs for the field service staff are allocated directly to the work orders and devices
that are owned by individual hospitals and clinics and therefore are already allocated.
Total remaining costs for the HTM corporate office—including the other 6 FTEs at their Effec-
tive Hourly Rate (for a total of $800,000) plus $200,000 in other costs associated with the
non-field service staff (e.g., software/CMMS license fees, supplies, training, etc.) for a total of
$1,000,000—need to be allocated to individual facilities. The table below shows how these cor-
porate costs would be allocated on the basis of Equipment Acquisition Cost.
Facility Equipment Acquisition Cost
Allocation Percentage
Allocation Amount
Central Hospital $100,000,000 45% $454,545
South Hospital $50,000,000 23% $227,273
Regional Hospital $50,000,000 23% $227,273
Surgery Center $10,000,000 5% $45,455
Imaging Center $10,000,000 5% $45,455
TOTAL $220,000,000 100% $1,000,000
Regardless of which allocation methodology is used, the most important factor for accurate
benchmarking is that all corporate HTM costs are captured.

25© 2018 AAMI n HTM Benchmarking Guide (2nd Edition)
APPENDIX D
As HTM organizations spend more and more time on IT-connected medical devices and other
project and engineering activities, some organizations may find it necessary to split their bench-
marking activities so that repair and maintenance activities are separated from project and
engineering activities. This appendix proposes a framework for implementing, for benchmarking
purposes, the separation of medical equipment repair and maintenance activities from engineer-
ing and project activities.
Separating project work particularly impacts larger HTM departments that have significant engi-
neering time spent on projects. Acquisition Cost is used as the COSR denominator, a repair and
maintenance workload analog, but acquisition cost does not measure engineering and project
workload. Therefore, significant project and engineering time and costs should not be included
in the COSR calculation.
However, separating out project costs does add significant complexity to an already complex
process. Therefore, HTM departments that wish to use the total HTM department budget, if they
have an all-inclusive HTM department budget, and choose not to separate out project costs, may
prefer to continue to do so.
Note that for management, supervision and other overhead functions, costs should be allocated
accordingly (e.g. if 80% of the staff is allocated to repair and maintenance activities, then 80%
of management costs should be included in the Repair and Maintenance “bucket”).
Equipment Maintenance vs. Projects and Engineering
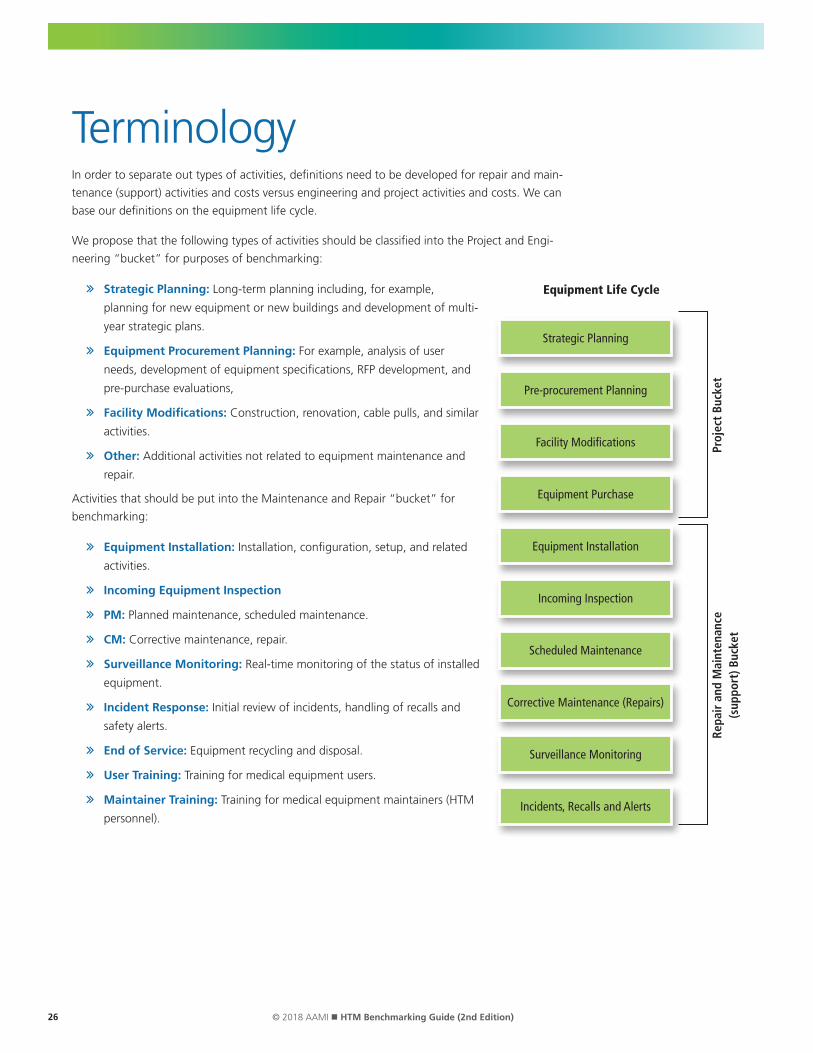
26 © 2018 AAMI n HTM Benchmarking Guide (2nd Edition)
TerminologyIn order to separate out types of activities, definitions need to be developed for repair and main-
tenance (support) activities and costs versus engineering and project activities and costs. We can
base our definitions on the equipment life cycle.
We propose that the following types of activities should be classified into the Project and Engi-
neering “bucket” for purposes of benchmarking:
Strategic Planning: Long-term planning including, for example,
planning for new equipment or new buildings and development of multi-
year strategic plans.
Equipment Procurement Planning: For example, analysis of user
needs, development of equipment specifications, RFP development, and
pre-purchase evaluations,
Facility Modifications: Construction, renovation, cable pulls, and similar
activities.
Other: Additional activities not related to equipment maintenance and
repair.
Activities that should be put into the Maintenance and Repair “bucket” for
benchmarking:
Equipment Installation: Installation, configuration, setup, and related
activities.
Incoming Equipment Inspection
PM: Planned maintenance, scheduled maintenance.
CM: Corrective maintenance, repair.
Surveillance Monitoring: Real-time monitoring of the status of installed
equipment.
Incident Response: Initial review of incidents, handling of recalls and
safety alerts.
End of Service: Equipment recycling and disposal.
User Training: Training for medical equipment users.
Maintainer Training: Training for medical equipment maintainers (HTM
personnel).
Strategic Planning
Pre-procurement Planning
Facility Modifications
Equipment Purchase
Equipment Installation
Incoming Inspection
Scheduled Maintenance
Corrective Maintenance (Repairs)
Surveillance Monitoring
Incidents, Recalls and Alerts
Proj
ect
Buck
etRe
pair
and
Mai
nten
ance
(s
uppo
rt) B
ucke
t
Equipment Life Cycle

27© 2018 AAMI n HTM Benchmarking Guide (2nd Edition)
Special cases that may need to be further defined and refined:
Research and development for products or systems (tentatively Projects and Engineering).
IT-related work: A large amount of HTM-based, IT-related work involves interfaces.
Generally, implementing a new interface is a Project and Engineering activity; updating and
adding medical devices to an existing interface are Maintenance and Repair activities.
• Case 1 – CE device to CE device interface): When there is an interface of device 1
to device 2, and both devices are supported by HTM, then the work tasks can be
allocated to either Projects and Engineering or Maintenance and Repair as shown in the
Equipment Life Cycle figure, depending on where in its life cycle the equipment lies.
• Case 2 – IT system to IT system interface: For an interface of system 1 to system 2,
where both systems are supported by IT, then if there is any CE consultation or other CE
involvement, it would fall into the Projects and Engineering category.
• Case 3 – Medical device (CE-supported) to IT system interface: This is the most common
case where a medical device (CE-supported) interfaces with an IT supported system.
New interfaces are in the Projects and Engineering category. This includes planning
and design, and pre-implementation testing. For installation, configuration, and
production testing of additional devices to existing interfaces, put these activities into
the Maintenance and Repair category, along with most post-installation support.
Other IT-related support:
• Cybersecurity: More and more HTM time is being spent on IT security audits and
specific malware mitigations. The scope of these activities ranges from “cleaning” a
specific device that has been attacked (Maintenance and Repair) to security analysis for
a broad range of devices (Projects and Engineering).
• Other IT-related support can include many other facets that usually can be divided
between the already defined categories. For those HTM departments with IT specialists
(e.g. clinical systems engineers, hybrid HTM/IT specialists), this may require allocating
staff time and cost between the Maintenance and Repair and Projects and Engineering
categories.
• HTM activities not defined above: For example, operation of medical equipment
during a patient procedure (e.g., operating an intra-aortic balloon pump during
patient transport) would fall into the Projects and Engineering category for purposes of
benchmarking.
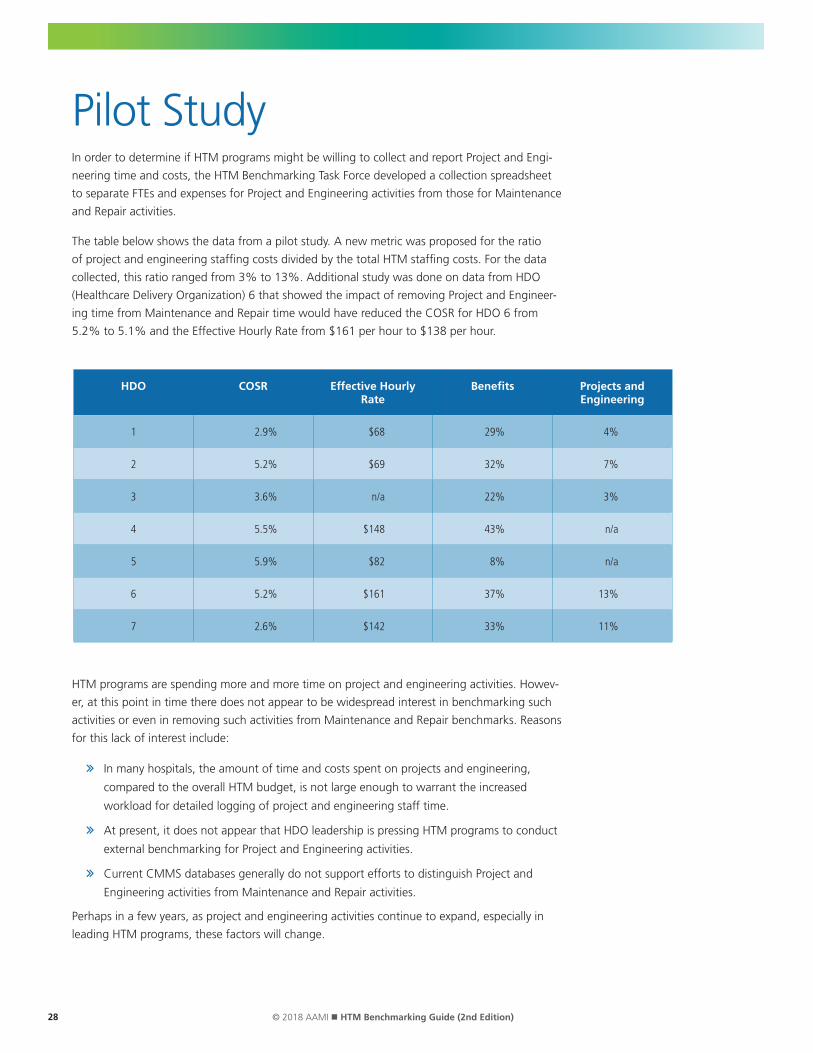
28 © 2018 AAMI n HTM Benchmarking Guide (2nd Edition)
Pilot StudyIn order to determine if HTM programs might be willing to collect and report Project and Engi-
neering time and costs, the HTM Benchmarking Task Force developed a collection spreadsheet
to separate FTEs and expenses for Project and Engineering activities from those for Maintenance
and Repair activities.
The table below shows the data from a pilot study. A new metric was proposed for the ratio
of project and engineering staffing costs divided by the total HTM staffing costs. For the data
collected, this ratio ranged from 3% to 13%. Additional study was done on data from HDO
(Healthcare Delivery Organization) 6 that showed the impact of removing Project and Engineer-
ing time from Maintenance and Repair time would have reduced the COSR for HDO 6 from
5.2% to 5.1% and the Effective Hourly Rate from $161 per hour to $138 per hour.
HTM programs are spending more and more time on project and engineering activities. Howev-
er, at this point in time there does not appear to be widespread interest in benchmarking such
activities or even in removing such activities from Maintenance and Repair benchmarks. Reasons
for this lack of interest include:
In many hospitals, the amount of time and costs spent on projects and engineering,
compared to the overall HTM budget, is not large enough to warrant the increased
workload for detailed logging of project and engineering staff time.
At present, it does not appear that HDO leadership is pressing HTM programs to conduct
external benchmarking for Project and Engineering activities.
Current CMMS databases generally do not support efforts to distinguish Project and
Engineering activities from Maintenance and Repair activities.
Perhaps in a few years, as project and engineering activities continue to expand, especially in
leading HTM programs, these factors will change.
HDO COSR Effective Hourly Rate
Benefits Projects and Engineering
1 2.9% $68 29% 4%
2 5.2% $69 32% 7%
3 3.6% n/a 22% 3%
4 5.5% $148 43% n/a
5 5.9% $82 8% n/a
6 5.2% $161 37% 13%
7 2.6% $142 33% 11%
4301 N. Fairfax Drive Suite 301Arlington, VA 22203-1633Phone: +1-703-525-4890Web: www.aami.org