human life is unlimited – but short - andrewgelman.com · earlier papers, (weon and je, 2009;...
TRANSCRIPT

Extremes manuscript No.(will be inserted by the editor)
Human life is unlimited – but short
Holger Rootzén · Dmitrii Zholud
Abstract Does the human lifespan have an impenetrable biological upper limit which ultimately will stopfurther increase in life lengths? This question is important for understanding aging, and for society, andhas led to intense controversies. Demographic data for humans has been interpreted as showing existenceof a limit, or even as an indication of a decreasing limit, but also as evidence that a limit does not exist.This paper studies what can be inferred from data about human mortality at extreme age. We find that inwestern countries and Japan and after age 110 the risk of dying is constant and is about 47% per year.Hence data does not support that there is a finite upper limit to the human lifespan. Still, given the presentstage of biotechnology, it is unlikely that during the next 25 years anyone will live longer than 128 years inthese countries. Data, remarkably, shows no difference in mortality after age 110 between sexes, betweenages, or between different lifestyles or genetic backgrounds. These results, and the analysis methodsdeveloped in this paper, can help testing biological theories of aging and aid confirmation of success ofefforts to find a cure for aging.
Keywords Extreme human life lengths · no influence of lifestyle on survival at extreme age · noinfluence of genetic background on survival at extreme age · future record ages · supercentenarians ·Jeanne Calment · limit for human life span · force of mortality · size-biased sampling · generalized Paretodistribution
Mathematics Subject Classification (2000) 62P10 · 62N01
1 Does the human lifespan have a finite limit?
Inferences about mortality at extreme age crucially depend on the quality of data, and on analysis re-specting the way data has been collected. Bad data or wrong analysis can, and has, led to misleadingconclusions, and also good analyses become outdated when more informative data is collected. Con-clusions about a limit for the human lifespan are only meaningful if they are accompanied by a cleardefinition of the concept of a limit for the random variation of lifespans of individuals. They have led tointense controversies (Couzin-Frankel, 2011).
A recent Nature Letter, Dong et al. (2016), claims that "the maximum lifespan of humans is fixed andsubject to natural constraints". The claim rests on plots showing that the rate of improvement in survival
Holger RootzénChalmers and Gothenburg University: E-mail: [email protected] ZholudChalmers and Gothenburg University: E-mail: [email protected]

2 Holger Rootzén, Dmitrii Zholud
is slower at very high ages; the observation that annual average age at death of supercentenarians (humanswho are more than 110 years old) has not changed; and on analysis of the yearly highest to the fifth highestreported age at death. However, a slower rate of improvement is still an improvement, and, if anything,it contradicts the existence of a limit. Further, record age will increase as more supercentenarians areobserved, even if the distribution of their life lengths does not change. Finally, the analysis of the yearlyhighest reported ages of death made in the letter is misleading. Thus the conclusion in Dong et al. (2016)is unfounded and based on inappropriate use of statistics. Additional details are given in Section 4.
A similar claim that there is a "biologic barrier limiting further life-span progression" is made inAntero-Jacquemin et al. (2014). The claim is based on analysis methods which do not distinguish betweena finite and an infinite limit, which do not take truncation caused by sampling scheme into account (seediscussion below), and which sometimes exclude the most extreme life lengths from analysis. Neitherof the papers Dong et al. (2016) or Antero-Jacquemin et al. (2014) define the concept of a limit for thehuman lifespan.
Earlier papers, (Weon and Je, 2009; Aarssen and de Haan, 1994; Wilmoth et al., 2000), argue bothfor and against a limit for the human lifespan. The arguments are based on analysis of data from theNetherlands or Sweden with maximum recorded ages 112 years or less. Extrapolation to conclusionsabout the existence, or not, of a limit of 122.45 or more years, the age of the longest living documentedhuman, Jeanne Calment, are long, and thus uncertain.
In a careful analysis Gampe (2010) studies survival after age 110 using non-parametric EM estimatesin a life-table setting. Her results agree with the present paper and hence, specifically, provide importantconfirmation that the parametric models we use are appropriate. However our parametric approach makesa much more detailed analysis possible, and, in particular, addresses the question of a limit for the humanlifespan; make predictions about future record ages possible; and makes it possible to perform tests and toobtain reasonable confidence intervals. There is some consensus that "the notion of an intractable species-specific senescent death and species-specific maximum lifespan" has been refuted (Vaupel, 2010).
To summarize, the question if there is a limit to the human lifespan still has not received any convinc-ing answer. In this paper we use the best available data, the International Database on Longevity (IDL,2016) to give the currently best possible answer to the question, and to study how factors such as gender,age, lifestyle, or genetic background change - or do not change - human mortality at extreme age. We usestatistical Extreme Value Theory which is the appropriate statistical framework for study of extreme ages.
Unvalidated data on ages of supercentenarians is known to be completely unreliable (Poulain, 2010).The IDL database contains validated life lengths of 668 supercentenarians from 15 countries, with "datacollection performed in such a way that age-ascertainment bias is avoided". This means that validationwas performed with equal effort for younger and older supercentenarians. The only other data on vali-dated lifespans of supercentenarians, the GRG (2016) list, does not have a clearly specified plan for datacollection, and is expected to be agebiased.
The sampling scheme in the IDL database is somewhat different for different countries, but typicallyIDL contains ages of persons who died in some time interval, say 1980-1999, at age exceeding 110 years.The time intervals are different for different countries. This sampling scheme leads to both left and righttruncation of life lengths. The analysis in this paper throughout takes this truncation into account; fordetails see Section 3.3. This is important: analysis which does not do this properly would lead to cruciallydifferent results.
Extreme value statistics provides methods for analysis of the most extreme parts of data: extremefloods, extreme winds, extreme financial events – or extreme life lengths, here excess life length after age110. The generalized Pareto (GP) distributions play the same role for analysis of extreme excesses as theGaussian distribution does in other parts of statistics (Coles, 2001; Beirlant et al., 2004). The exponentialdistribution is the most important GP distribution. It has the "lack of memory property": if, e.g., excesslife length has an exponential distribution, then also excess life length after a higher age and conditional

Human life is unlimited – but short 3
on survival has the same exponential distribution. In particular this makes it the default distribution inreliability theory.
We summarize the main results of the analysis in Section 2. Details on data and the statistical analysisare given in Section 3, and comments on the Dong et al. (2016) paper in Section 4. Section 5 contains aconcluding discussion.
2 The human lifespan is unbounded, but short
Our aim is to estimate the "force of mortality" at extreme age. The force of mortality, or hazard rate, isthe instantaneous rate of mortality so that, e.g., (assuming the measurement unit is year) the probabilityof dying tomorrow is 1/365 times the force of mortality today. Formally, the force of mortality equalsminus the derivative of the log survival function (here again with survival measured in years). We modelexcess life length (life length minus 110 years) of supercentenarians with a GP distribution. The GPmodel includes three different cases with distinct behaviors of the force of mortality. In the first case thereis a finite age at which the force of mortality tends to infinity and beyond which survival is not possible– in this case lifespans have a finite limit; in the second case the force of mortality is constant – life isunlimited but short (more precisely, survival after age 110 is short); and in the third case the force ofmortality decreases with age – life is unlimited. In the second case excess life length has an exponentialdistribution. The three cases are illustrated in Figure 1. Additionally, Figure 1 shows the importance oftaking truncation caused by the sampling scheme into account.
110 112 114 116 118 1200
1
2
3
4
5
Age
For
ce o
f mor
talit
y
110 112 114 116 118 1200
0.5
1
1.5
Age
For
ce o
f mor
talit
y
110 112 114 116 118 1200.3
0.4
0.5
0.6
0.7
0.8
Age
For
ce o
f mor
talit
y
Fig. 1 Left: GP distribution fitted to IDL data for Japan, without taking truncation into account. Life appears to have a finite limitequal to 116.0 years. Middle: Exponential distribution fitted to all IDL data with validation level A, with truncation taken intoaccount. Life is unlimited but short. Right: GP distribution fitted to IDL data for France, without truncation taken into account. Lifeappears to be unlimited. However, changing estimation for Japan and France so that truncation is taken into account leads to theconclusion that, in fact, also in these countries life is unlimited but short.
Around 10 times as many women as men live to age 110 years. Nevertheless, likelihood ratio testsusing the assumption of a GP distribution, or assuming an exponential distribution, show that differencesin mortality, if any, between women and men after age 110 are too small to be detectable from the IDLdata. Further, the age bias in the GRG data does not affect the null hypothesis of no difference betweenwomen and men, and in fact a GP distribution based test for the GRG data also did not reject this nullhypothesis. For the full results, see Table 2.
Likelihood ratio tests also did not detect any difference in survival of supercentenarians between southand north Europe, between western Europe and north America, or between Japan and the other countries.Wald tests did not identify any differences in mortality above age 110 for earlier and later parts of thedata, and likelihood ratio tests did not reject the hypothesis that survival after age 110 has an exponentialdistribution.
Thus, our conclusion is that in western Europe, north America, and Japan excess human life lengthafter age 110 follows an exponential distribution – human life is unlimited, but short – and that survival isthe same for women and men, during earlier periods and later ones, and in countries with very different

4 Holger Rootzén, Dmitrii Zholud
lifestyles and genetic compositions. The mean of the exponential distribution was estimated to be 1.34with 95% confidence interval (1.22, 1.46). Survival after 110 in these countries can hence be describedas follows: each year a coin is tossed, and if heads comes up it means a person will live one more year;more precisely, the estimated probability to survive one more year is 47%, with 95% confidence interval(0.44, 0.50).
The number of persons who live longer than 110 years is rapidly increasing (Figure 2). Still, it is avery extreme event that a woman will live 110 years: the probability is only about 2 out of 100,000. Fora man this probability is ten times smaller. Given an unchanged mortality after age 110 and a continuedincrease in the number of supercentenarians, it is likely that the record age which will be documentedin western Europe, north America or Japan during the coming 25 years will exceed 119 years but willbe shorter than 128 years (Figure 3, Section 3.2). If the record falls outside this interval, it would be anindication that survival has changed.
1980 1982 1984 1986 1988 1990 1992 1994 1996 1998 2000Year of death
0
5
10
15
20
25
30
Num
ber
of s
uper
cent
enar
ians
1980 1982 1984 1986 1988 1990 1992 1994 1996 1998 2000Year of death
0
5
10
15
20
25
30
Num
ber
of s
uper
cent
enar
ians
Fig. 2 Yearly number of deaths of validated supercentenarians from England and Wales, Italy, and USA. Line and 95% confidenceinterval for the means are computed using Poisson regression with Left: identity link Right: log link.
115 120 125 130 1350
0.05
0.1
0.15
0.2
0.25
0.3
Age
Den
stity
EstimateLower boundUpper bound
115 120 125 130 1350
0.05
0.1
0.15
0.2
0.25
0.3
Age
Den
stity
EstimateLower boundUpper bound
Fig. 3 Probability density for record life length during 2018-2042 moves left if parameter σ of exponential distribution, or thenumber of deaths of supercentenarians (n), are decreased, and to the right if they are increased. Plots show estimated density ofrecord life length (blue) together with lower (green) and upper (red) bounding densities obtained by setting σ and n equal to thelower or upper bounds in their confidence intervals. Parameter n is estimated using Poisson regression with Left: identity link Right:log link.

Human life is unlimited – but short 5
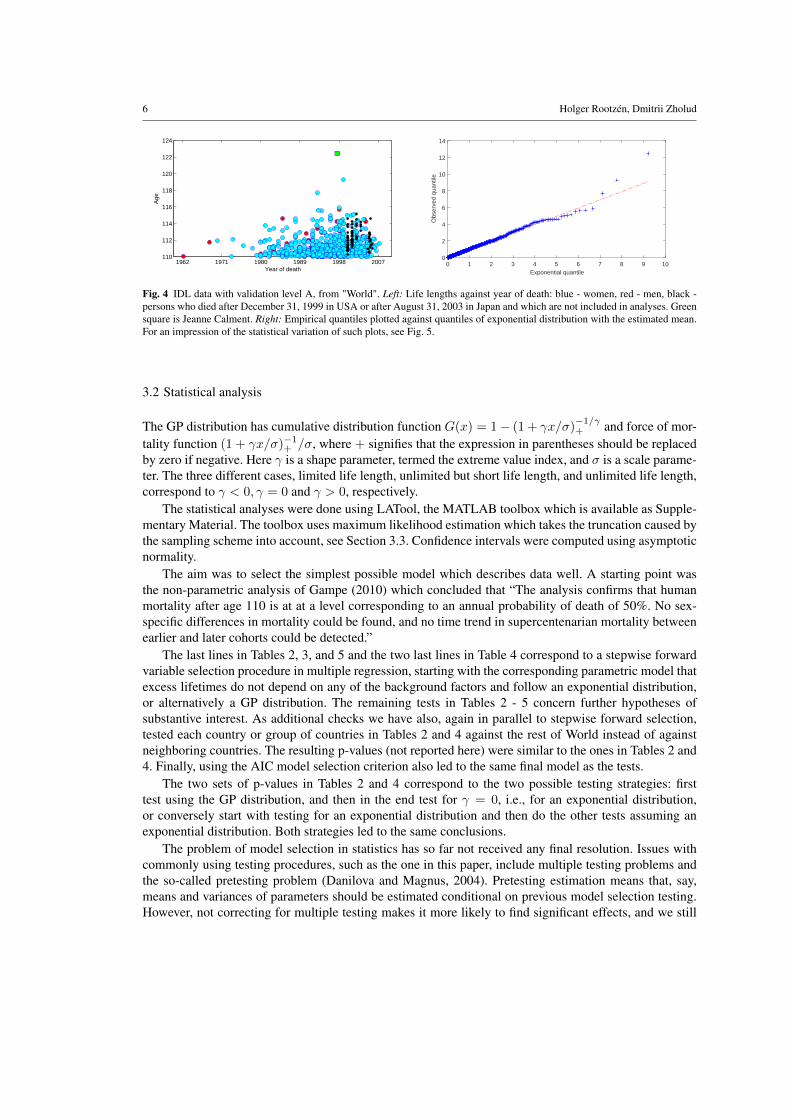
Jeanne Calment lived 3.18 years longer than the second longest-living person in the IDL data, whichseems extreme, and could indicate that she is an "outlier". Her life length is the longest of the 566 su-percentenarians with validation level A, and the probability that the largest of 566 exponential variableswith mean 1.34 is larger that 12.45 (her excess life length, 122.45-110 years) is 5%. Thus there is someevidence that her life length is close to being an outlier – or that, alternatively, mortality decreases atextremely high age, say after age 118.
3 Materials and Methods
3.1 International database on longevity
The IDL (2016) database contains validated supercentenarian life lengths from 15 countries. The inclu-sion criterion typically is that the death has occurred in a specified time interval, however with differenttime intervals for different countries, and with somewhat more complicated criteria for USA and Japan.There are two validation levels, A and B, where level A signifies the most thorough validation.
In the analysis of the IDL data we only used the 566 life lengths with validation level A, and countrieswere grouped geographically, and so that groups contain 64 or more supercentenarians (Table 1). Thegrouping was mandated by the fact that data from several countries included too few supercentenariansto make it meaningful to analyse these countries separately.
We excluded persons who died in the USA after December 31, 1999, and persons who died in Japanafter August 31, 2003 ; see Section 3.3 below. In the sequel we for brevity just write "Europe&America"for the data set which contains countries from western Europe, north America, and Australia, and "World"for the entire data set. To investigate the possibility of time trends in mortality of supercentenarians thedata sets were split into two parts according to year of death. Except for World, the division was made sothat the second part included more persons than the first one, but with the difference between the numberof persons in the parts as small as possible.
Including the 32 persons in countries validated at level B (Belgium, Finland, Norway, Sweden,Switzerland) in the analysis did not change conclusions. We also did the analyses reported below forlife lengths in excess of higher age thresholds: 110.5, 111, 111.5, and 112 years. This did not changeany of the conclusions, although estimates of course were somewhat different, and confidence intervalswere wider for higher thresholds. The estimates and tests which result if one includes validation level Bdata and/or uses higher thresholds can be obtained from the MATLAB toolbox LATool which we havedeveloped and which is available as Supplementary Material. Similarly, removing the largest age, JeanneCalment’s age, from the data did not change conclusions.
Table 1 Data sets used for analysis. Except for the GRG data set, IDL data with validation level A. Persons who died after December31, 1999, in USA or after August 31, 2003, in Japan, are excluded.
ID consists of women menNorth Europe Denmark, Germany, England and Wales 79 5South Europe Italy, France, Spain 97 17Europe North and south Europe 176 22North America USA, Quebec 272 28Japan Japan 55 9Europe&America Australia, Europe, North America, 452 50World Europe&America, Japan 507 59GRG any country 319 27
6 Holger Rootzén, Dmitrii Zholud
1962 1971 1980 1989 1998 2007110
112
114
116
118
120
122
124
Year of death
Age
0 1 2 3 4 5 6 7 8 9 10Exponential quantile
0
2
4
6
8
10
12
14
Obs
erve
d qu
antil
e
Fig. 4 IDL data with validation level A, from "World". Left: Life lengths against year of death: blue - women, red - men, black -persons who died after December 31, 1999 in USA or after August 31, 2003 in Japan and which are not included in analyses. Greensquare is Jeanne Calment. Right: Empirical quantiles plotted against quantiles of exponential distribution with the estimated mean.For an impression of the statistical variation of such plots, see Fig. 5.
3.2 Statistical analysis
The GP distribution has cumulative distribution function G(x) = 1− (1 + γx/σ)−1/γ+ and force of mor-
tality function (1 + γx/σ)−1+ /σ, where + signifies that the expression in parentheses should be replacedby zero if negative. Here γ is a shape parameter, termed the extreme value index, and σ is a scale parame-ter. The three different cases, limited life length, unlimited but short life length, and unlimited life length,correspond to γ < 0, γ = 0 and γ > 0, respectively.
The statistical analyses were done using LATool, the MATLAB toolbox which is available as Supple-mentary Material. The toolbox uses maximum likelihood estimation which takes the truncation caused bythe sampling scheme into account, see Section 3.3. Confidence intervals were computed using asymptoticnormality.
The aim was to select the simplest possible model which describes data well. A starting point wasthe non-parametric analysis of Gampe (2010) which concluded that “The analysis confirms that humanmortality after age 110 is at at a level corresponding to an annual probability of death of 50%. No sex-specific differences in mortality could be found, and no time trend in supercentenarian mortality betweenearlier and later cohorts could be detected.”
The last lines in Tables 2, 3, and 5 and the two last lines in Table 4 correspond to a stepwise forwardvariable selection procedure in multiple regression, starting with the corresponding parametric model thatexcess lifetimes do not depend on any of the background factors and follow an exponential distribution,or alternatively a GP distribution. The remaining tests in Tables 2 - 5 concern further hypotheses ofsubstantive interest. As additional checks we have also, again in parallel to stepwise forward selection,tested each country or group of countries in Tables 2 and 4 against the rest of World instead of againstneighboring countries. The resulting p-values (not reported here) were similar to the ones in Tables 2 and4. Finally, using the AIC model selection criterion also led to the same final model as the tests.
The two sets of p-values in Tables 2 and 4 correspond to the two possible testing strategies: firsttest using the GP distribution, and then in the end test for γ = 0, i.e., for an exponential distribution,or conversely start with testing for an exponential distribution and then do the other tests assuming anexponential distribution. Both strategies led to the same conclusions.
The problem of model selection in statistics has so far not received any final resolution. Issues withcommonly using testing procedures, such as the one in this paper, include multiple testing problems andthe so-called pretesting problem (Danilova and Magnus, 2004). Pretesting estimation means that, say,means and variances of parameters should be estimated conditional on previous model selection testing.However, not correcting for multiple testing makes it more likely to find significant effects, and we still
Human life is unlimited – but short 7
didn’t find any such effects, so this issue only strengthens our conclusions. Further, since we didn’t findany significant factors, the pretest problem is not relevant for our analysis.
An alternative view of our procedure is that we start with an exponential model and then do modelchecking on it. For a discussion of questions related to this, see Mayo and Cox (2006).
For exponentially distributed life lengths the probability to survive one more year is e−1/σ . Insertingthe estimate and confidence limits for σ into this formula gives the estimate and confidence interval forthe yearly survival probability.
The maximum, or record, Mn, of n exponential random variables with parameter σ has cumulativedistribution function (1−e−x/σ)n and probability density function ne−x/σ(1−e−x/σ)n−1/σ. Hence, topredict the size of the record age in some time period both the value of σ (estimated above) and the valueof n, the number of supercentenarians who will die in the period, is needed.
To estimate the trend in the number of supercentenarians using data from different countries, the datamust cover the same time period. Such data is available for supercentenarians who died in the time period1980-1999, for the countries Italy, England and Wales, and USA. Using Poisson regression with linearlink function, the expected number of supercentenarians who will die in these three countries during thenext 25 years, i.e. in 2018-2042, was estimated to be 1,690 with a 95% confidence interval (1,326, 2,054).
The ratio of the number of persons aged 100–104 in north America, western Europe and Japan1 inthe year 2000 in the Human Mortality Database (HMD, 2016) to the same number for Italy, Englandand Wales, and USA is 1.76. We used this ratio, 1.76, as a proxy for the relative number of deaths ofsupercentenarians in these countries. Multiplying the estimate and confidence interval with 1.76 gave theestimate n = 2, 974, with confidence interval (2,334, 3,615), for the expected number of supercente-narians who will die in the period 2018-2042 in north America, western Europe and Japan. Assumingindependence of this interval and the 95% confidence interval for σ gives a joint confidence level 90%.
The same computations using a log link (i.e. assuming an exponential growth of the number of super-centenarians) in the Poisson regression gave the estimate n = 18, 717 with confidence interval (7,429,46,962) obtained by simulating parameter values from the limiting normal distribution. It may be notedthat these predictions only depend on changes in survival up to age 110 and are not affected by futurefluctuations in birth rates: all supercentenarians who will die in the interval 2018-2042 are already born.
Inserting x = age−110 and the estimates σ = 1.34, n = 2, 974 into the formula for the probabilitydensity function for the record gives the blue graph in Figure 3, left panel. Instead using the lower confi-dence interval bounds σ = 1.22, n = 2, 334 gives a lower bound probability density function: this is thegreen graph in Figure 3, left. The upper bound, and the graphs in Figure 3, right, are computed similarly.
Using the formula for the cumulative distribution function of record age and the linear estimate ofn gives the estimate 3% for the probability that the record age is lower than 119. Instead inserting thelower bounds of the confidence intervals into the formula gives the upper bound estimate 23% of theprobability. Similar computations, using the exponential growth estimate of n gives the estimate 3% forthe probability that the record age exceeds 128 years, and the upper bound 19% for this probability. Thisshows that it is likely that the record age will fall in the interval 119-128 years. These results are obtainedassuming that present mortality and growth of number of supercentenarians remain unchanged.
There are only 9 persons in the World data set who lived longer than 115 years, and hence littledata to confirm an exponential distribution beyond this age. Still these 9 data points are in agreementwith an exponential distribution (Figure 4). In view of predictions of very rapid growth of the number ofcentenarians (Thatcher, 2010), the results based on the exponential regression for n may capture the mostlikely development.
In the computations above we for simplicity of exposition used the expected rather than actual, ran-dom, number of supercentenarians. However, assuming a Poisson distribution with mean n for the number
1 Austria, Canada, Denmark, Belgium, France, Finland, Iceland, Ireland, Italy, Japan, the Netherlands, Norway, Portugal, Spain,Sweden, UK, USA,

8 Holger Rootzén, Dmitrii Zholud
N of supercentenarians who die in 2018-2042, the distribution of the record age is
P (MN ≤ x) = (P (MN ≤ x|N)) = E((1− e−x/σ)N
)= en{(1−e
−x/σ)−1} = e−ne−x/σ
.
It can be seen by numerical computation that for the parameter values used above the difference betweenthis expression and (1 − e−x/σ)n is less than one unit in the second decimal. The same holds for thedensities obtained by differentiation of the two formulas.
3.3 The IDL sampling scheme: left and right truncation
The two exponential qq-plots in Figure 5 are quite different, and illustrate that the sampling scheme has tobe taken into account in the analysis. Specifically, the explanation of the difference between the plots is notthat US mortality changed at the end of 1999, but instead that the sampling schemes for the 1980-1999data and the 2000-2003 data were different. The 1980-1999 data consists of ages of supercentenarianswho died in this interval, while the 2000-2003 data consists of supercentenarians who were alive at theend of 1999 but died before the middle of 2003. The effects of the 1980-1999 sampling scheme arediscussed below. The 2000-2003 sampling scheme leads to two kinds of biases: persons who have longerlives are more likely to be alive at any given point of time, say December 31, 1999, but on the other hand,persons with very long life are not included in the data set because they have not died before the middleof 2003. These effects are different from those caused by the 1980-1999 sampling scheme, see below.Simulations confirmed that these sampling schemes can produce qq-plots like those in Figure 5. A furtherillustration of the importance of taking the sampling scheme for the IDL data into account is given byFigure 1.
In principle, the bias caused by the different sampling scheme used for the USA 2000-2003 data couldbe taken into account, and also this part of the data could be used. However, the information given aboutthe sampling plan for IDL supercentenarians who died in the USA after 1999 was not sufficient to make itpossible for us to do this. Hence, supercentenarians who died in the USA after December 31, 1999, havebeen excluded from the analysis. For similar reasons, supercentenarians who died in Japan after August31, 2003, have also been excluded from the analysis.
Additionally, for reasons of confidentiality, for US supercentenarians only the year of death, and notthe exact death date, is given. In the analysis we assumed that all US supercentenarian deaths occurred onJuly 2. However, conclusions didn’t change if we instead set the death dates to January 1, or to December31.
If the sampling scheme is that a cohort, all persons who are born in some time interval, is followeduntil all persons in it are dead, then there is no bias in the observed ages. Similarly, if a population isstationary and there are no trends in the probability of becoming a supercentenarian, then recorded agesof supercentenarians who died in some time interval, say 1980-1999, are not subject to bias. However,the IDL database does not follow cohorts until they are extinct, and the probability of living until age 110is increasing with time. This increase, if not taken into account, would lead to bias in the estimation oflife length from the IDL data: small excess life lengths are less likely to be included in the beginning ofthe interval but more likely to be included in the end of the interval – and there are more deaths in theend. In the estimates and test performed here, we have taken this into account by letting the likelihoodcontribution from a person be conditional on the time of achieving age 110 and of death date beingcontained in the observation interval, as follows.
Suppose that a sample consists of all supercentenarian deaths in some country during the time interval(b, e). Let {ti} be the times of achieving age 110 and {xi} be the corresponding excess ages at death.Further suppose that excess life lengths have cumulative distribution function F and probability density

Human life is unlimited – but short 9
function f , where in our analysis F is either a GP distribution function or an exponential distributionfunction. Then supercentenarian i is included in the sample if one of the following two conditions aresatisfied: if a) ti ≤ b and b ≤ ti + xi < e or if b) ti > b and ti + xi < e.
In the case a) the excess life length of supercentenarian i is truncated so that it only is included inthe sample if b − ti ≤ xi < e − ti. Hence the likelihood contribution from the excess life length of asupercentenarian in the sample whose 110 year birthday was before the beginning of the sampling timeinterval, i.e. with ti ≤ b, is
f(xi)
F (e− ti)− F (b− ti),
In case b) where the 110 year birthday occurred after the beginning of the sampling interval, ti > b, theexcess life length is truncated to so that xi ≤ ei−ti, and the likelihood contribution from supercentenariani is
f(xi)
F (e− ti).
The full likelihood is then obtained by taking the product of the likelihood contributions for all super-centenarians and countries included in an analysis.
Estimation using truncated and/or censored observations, such as the truncated observations in theIDL database, is of central interest in survival analysis and in analysis of failure time data, see e.g. Ander-sen et al. (1992) and Kalbfleish and Prentice (2002) for much more information and asymptotic theory.However, the particular truncation setting above does not seem to be considered explicitly in these books.Instead, the formulas are contained in Gampe (2010).
Uniform confidence limits for pp-plots or qq-plots for left and right truncated data do not seem tobe available in the literature. To illustrate the statistical uncertainty of such plots we have instead usedsimulation; se Fig. 5.
0 1 2 3 4 5 6 7 8
Exponential quantile
0
2
4
6
8
10
Obs
erve
d qu
antil
e
0 1 2 3 4 5 6 7 8Exponential quantile
0
2
4
6
8
10
Obs
erve
d qu
antil
e
Fig. 5 Illustration of effect of size-biased sampling: Left: Empirical quantiles for IDL supercentenarians who died 1980-1999 inUSA plotted against quantiles of exponential distribution with estimated mean (red line, with observations in blue). To illustrate thestatistical variation of such plots, we have simulated 100 data sets with the estimated mean for the US 1980-1999 data, and with thesame 110 year birthdates and truncations, and inserted the empirical quantile lines (dotted) for these data sets in the plot . Right:Empirical quantiles for IDL supercentenarians who died 2000-2003 in USA plotted against quantiles of exponential distributionwith the estimated mean for IDL supercentenarians who died 1980-1999 in USA.

10 Holger Rootzén, Dmitrii Zholud
Table 2 p-values for likelihood ratio tests of the null hypothesis of no difference in mortality between women and men after age110. Middle column assumes GP distribution, right column exponential distribution. A "-" means that the test for exponentialdistribution of data rejects at the 0.01% level for the GRG data set.
ID GP expNorth Europe 0.94 0.81South Europe 0.14 0.40Europe 0.57 0.63North America 0.72 0.56Japan 0.77 0.76Europe&America 0.42 0.43World 0.43 0.41GRG 0.17 -
Table 3 p-values for Wald tests of the null hypothesis of no difference in mortality between first and last half of data. "mean"is the estimated parameter of the exponential distribution, not the mean of the observed life lengths; tests assume an exponentialdistribution.
ID death date # mean death date # mean p-valueNorth Europe 1970-1997 41 1.78 1998-2006 43 1.45 0.49South Europe 1973-1997 50 1.61 1998-2007 64 1.19 0.26Europe 1968-1997 91 1.70 1998-2007 107 1.29 0.18North America 1962-1992 141 1.17 1993-2002 159 1.14 0.73Japan 1996-2000 28 2.71 2001-2005 36 1.28 0.30Europe&America 1962-1994 242 1.34 1995-2008 251 1.21 0.33World 1962-1996 309 1.30 1997-2008 260 1.20 0.33
Table 4 p-values for likelihood ratio tests of the null hypothesis of no difference in mortality between groups of countries. Middlecolumn assumes GP distribution, right column exponential distribution.
ID GP expNorth Europe vs south Europe 0.30 0.49Europe vs north America 0.24 0.23Europe&America vs Japan 0.37 0.41
Table 5 Estimates of shape parameter γ of the generalized Pareto distribution, with 95% asymptotic confidence intervals in paren-theses, and p-values for likelihood ratio test of the null hypothesis that data follows an exponential distribution. N/A indicates thatcomputation of the inverse of the Hessian was not numerically stable.
ID shape parameter p-valueNorth Europe 0.04 N/A 0.49South Europe -0.04 (-0.19, 0.10) 0.19Europe -0.03 (-0.18, 0.11) 0.52North America -0.03 (-0.14, 0.09) 0.31Europe&America -0.03 (-0.12, 0.06) 0.18Japan 0.15 N/A 0.47World -0.03 (-0.12, 0.06) 0.21

Human life is unlimited – but short 11
4 Comments on X. Dong, B. Milholland, J. Vijg, Nature 538, 257 (2016).
Figure 6, left, reproduces Figure 2.a of the Dong et al. (2016) Nature Letter, but with the yearly numberof deaths of supercentenarians, nt, added. The plot is based on IDL data for England and Wales, France,USA, and Japan. The data sets for the different countries cover different time periods, and as a result ofthis the yearly number of supercentenarian deaths in the plot varies from 0 to 42. The yearly maximumreported age at death follows the same pattern as the number of supercentenarian deaths, and in particularthe decline in the maximum recorded age at death after 1995 follows the decline in yearly number ofdeaths. That the yearly maximum reported age at death shows the same pattern as the yearly numberof deaths is completely as expected: the maximum of many lifespans is stochastically larger than themaximum of few lifespans, and hence the maximum age is likely to be larger for years with many deaths.
The right plot in Figure 6 instead of nt adds the mean of the maximum of nt independent exponentialvariables, with parameter 1.35 estimated from these countries. This does not take truncation into account,but still, again as expected, the mean and the regression lines agree well. Figure 7 shows the same plotsas in Fig. 6, left, done separately for individual countries. There is no evidence of a trend break in theseplots.
Thus, in conclusion, the apparent trend break in Figure 2.a in Dong et al. (2016) is an artifact causedby inappropriate combination of data from different time periods.
Figure 2.b of Dong et al. (2016) adds the 2nd to 5th highest reported age at death to Figure 2.a. Thepattern is the same as in Figure 2.a, and the explanation is the same: inappropriate combination of datafrom different time periods. Further, the statement in Dong et al. (2016) that "the annual average age atdeath for these supercentenarians has not increased since 1968 (Figure 2.c)" does not imply that there isa limit. Again: records increase as more attempts to break them are made, even without a change in theunderlying distribution. The conclusion "our data strongly suggest that the duration of life is limited" inDong et al. (2016) is based on wrong and misleading analysis.
1965 1970 1975 1980 1985 1990 1995 2000 2005 2010108
110
112
114
116
118
120
122
124
y=0.15311x-191.0734
y=-0.27622x+667.5023
Yea
rly m
axim
um r
epor
ted
age
at d
eath
(ye
ars)
Year
0
5
10
15
20
25
30
35
40
Num
ber
of d
eath
s
1965 1970 1975 1980 1985 1990 1995 2000 2005 2010108
110
112
114
116
118
120
122
124
y=0.15311x-191.0734
y=-0.27622x+667.5023
Yea
rly m
axim
um r
epor
ted
age
at d
eath
(ye
ars)
Year
Fig. 6 Yearly maximum reported age at death for supercentenarians. Combined data consisting of England and Wales 1968-2006,France 1987-2003, USA 1980-2003, and Japan 1996-2005. Dashed - dotted lines: blue regression lines for deaths 1968-1994, redregression line for deaths 1995-2006. Left: Dashed line is yearly number of deaths, nt. Right: Solid line is 110 + mean of maximumof nt exponential variables with σ = 1.35.

12 Holger Rootzén, Dmitrii Zholud
1965 1970 1975 1980 1985 1990 1995 2000 2005 2010108
110
112
114
116
118
120
122
124
y=0.074393x-36.0528
y=0.022697x+67.2363Y
early
max
imum
rep
orte
d ag
e at
dea
th (
year
s)
Year
0
1
2
3
4
5
6
Num
ber
of d
eath
s
1986 1988 1990 1992 1994 1996 1998 2000 2002 2004108
110
112
114
116
118
120
122
124
y=0.16883x-225.3766
y=-0.26667x+646.5111
Yea
rly m
axim
um r
epor
ted
age
at d
eath
(ye
ars)
Year
0
2
4
6
8
10
Num
ber
of d
eath
s
1980 1985 1990 1995 2000 2005108
110
112
114
116
118
120
122
124
y=0.18929x-263.1107
y=0.2x-285.3556
Yea
rly m
axim
um r
epor
ted
age
at d
eath
(ye
ars)
Year
0
5
10
15
20
25
Num
ber
of d
eath
s
1995 1996 1997 1998 1999 2000 2001 2002 2003 2004 2005 2006108
110
112
114
116
118
120
122
124
y=0.21212x-311.6485
Yea
rly m
axim
um r
epor
ted
age
at d
eath
(ye
ars)
Year
0
5
10
15
Num
ber
of d
eath
s
Fig. 7 Yearly maximum reported age at death for supercentenarians. Dashed - dotted lines: blue is regression lines for deaths 1968-1994, red regression line for deaths 1995-2006. Dashed lines are yearly number of deaths. Top left: England and Wales, Top right:France, Bottom left: USA, and Bottom right: Japan.
5 Discussion
As shown above, available data does not exhibit any statistically significant differences in survival atextreme age between women and men; between persons with different lifestyles or genetic backgrounds;between different time periods; or between different ages, say between 110-year-olds and 115-year-olds.Further, sample sizes are large enough that differences bigger than 5% - 10% (depending on the samplesizes in the individual tests) in yearly survival probabilities would be likely to be detected. These resultsare surprising and remarkable and can inform the search for demographic or biological theories of aging.In particular, the fact that lifestyle factors, which are important for survival at younger ages, ceases toplay a role after age 110 is of both biological and popular interest.
Box 1 of Vaupel (2010) gives an introduction to the important explanation of mortality at high ageas resulting from a mixture of subpopulations with different frailty. Presumably the composition of sub-populations of humans reaching 110 years of age differs, at least somewhat, between persons who livedearlier and who lived later, or between countries. If the frailty hypothesis is correct, mortality should thenbe different in at least some of the countries or in one of the time periods. However, we did not find anysuch differences. This weakens the case for the frailty explanation.
A fundamental hypothesis on how we age is that "the rate at which the chance of death increases withage for humans is a basic biological constant, very similar and perhaps invariant across individuals andover time", see Vaupel (2010). For mortality after 110, this would mean that the distribution of excess lifelength in the future should still be exponential, but with lower yearly probability of death. The methodsdeveloped in this paper provide an efficient way of checking if this indeed is the case: power calculationsshow that an increase of 5% or more in yearly survival in a future data set of the same size as the IDLdata would be detectable.
Substantial efforts to find "a cure for aging" and in "engineering better humans" with the aim ofextending the length of human life, perhaps indefinitely, are underway, see e.g. Vijg and Campisi (2008);Longo et al. (2015); Häggström (2016). Success of such efforts could happen either in a dramatic andobvious way, or gradually. In the latter case the results of this paper, together with similar analyses ofdata to be collected in the future, will aid early confirmation of success of the efforts.

Human life is unlimited – but short 13
Finally, as in any analysis of the human lifespan, conclusions are based on now existing data, and maybe modified if more data becomes available. In particular, the IDL data set only includes 9 persons wholived longer than 115 years, so data is sparse above this age. However, also these 9 data points agree wellwith our conclusion that human life is unbounded but short.
Electronic supplementary material: LATool, a MATLAB toolbox for life length analysis. Makes itpossible to do alternative analyses. The toolbox consists of three files which are available on Extremes’supplementary materials web page,???, and a data file, data.mat, which can be obtained by logging in tothe IDL database at http://www.supercentenarians.org/ The toolbox may also be obtained by sending amail to [email protected] and [email protected].
AcknowledgementsWe thank Anthony Davison, Jutta Gampe, Olle Häggström, Peter Jagers, Niels Keiding, Steve Marron,Thomas Mikosch, Olle Nerman, and an associate editor for comments. Research supported by the Knutand Alice Wallenberg Foundation, grant KAW 2012.0067.
References
Aarssen, K. and L. de Haan (1994). On the maximal life span of humans. Mathematical Population Studies 4, 259–281.Andersen, P., O. Borgan, R. Gill, and N. Keiding (1992). Statistical models based on counting processes. Springer Verlag, New
York.Antero-Jacquemin, J., G. Berthelot, A. Marck, P. Noirez, A. Latouche, and J.-F. Toussaint (2014). Learning from leaders: Life-span
trends in olympians and supercentenarians. J Gerontol A Biol Sci Med Sci 70, 1–6.Beirlant, J., Y. Goegebeur, J. Segers, and J. Teugels (2004). Statistics of Extremes: Theory and Applications. John Wiley & Sons.Coles, S. G. (2001). An Introduction to Statistical Modeling of Extreme Values. Springer.Couzin-Frankel, J. (2011). A pitched battle over life span. Science 333(8), 549–550.Danilova, D. and J. R. Magnus (2004). On the harm that ignoring pretesting can cause. J. Econometrics 122.Dong, X., B. Milholland, and J. Vijg (2016). Evidence for a limit to human lifespan. Nature 538, 257–259.Gampe, J. (2010). Human mortality beyond age 110. In H. Maier and et al. (Eds.), Supercentenarians, Chapter 13, pp. 219–230.
Heidelberg: Springer-Verlag.GRG (2016). Gereontology research group list of validated deceased supercentenarians. URL: www.grg.org.Häggström, O. (2016). Here be dragons, science, technology and the future of humanity. Oxford University press.HMD (2016). Human mortality database. URL: www.mortality.org.IDL (2016). International database on longevity. URL: www.supercentenarians.org.Kalbfleish, J. D. and R. L. Prentice (2002). The statistical analysis of failure time data. Wiley, Hoboken New Jersey.Lilliefors, H. W. (1969). On the kolmogorov-smirnov test for the exponential distribution with mean unknown. Journal of the
American Statistical Association 64, 387–389.Longo, V. D., A. Antebi, A. Bartke, N. Barzila, H. M. Brown-Borg, C. Caruso, and T. J. Curiel (2015). Interventions to slow ageing
in humans: are we ready? Aging Cell 14, 497–510.Mayo, D. G. and D. R. Cox (2006). A Frequentist Statistics as a Theory of Inductive Inference. in Optimality: The Second Erich L.
Lehmann Symposium. Vol. 49, Lecture Notes-Monograph Series, Institute of Mathematical Statistics.Poulain, M. (2010). On the age validation of supercentenarians. In H. Maier and et al. (Eds.), Supercentenarians, Chapter 1, pp.
4–30. Heidelberg: Springer-Verlag.Thatcher, R. A. (2010). The growth of high ages in England and Wales, 1635-2106. In H. Maier and et al. (Eds.), Supercentenarians,
Chapter 11, pp. 191–201. Heidelberg: Springer-Verlag.Vaupel, J. W. (2010). Biodemography of human ageing. Nature 464(25), 536–542.Vijg, J. and J. Campisi (2008). Puzzels, promises, and a cure for ageing. Nature 544, 1065–1071.Weon, B. M. and J. H. Je (2009). Theoretical estimation of maximum human lifespan. Biogerontology 10, 65–71.Wilmoth, J. R., L. Deegan, H. Lundstrom, and S. Horiuch (2000). Increase of maximum life-span in Sweden, 1861-1999. Sci-
ence 289, 2366–2368.