human resources: annual report -...
TRANSCRIPT

EXECUTIVE BOARD EB120/24 Add.1120th Session 21 December 2006Provisional agenda item 7.2
Human resources: annual report
Report by the Secretariat
1. The information below represents a preview of the Organization’s staffing profile as at 30 September 2006. It includes details on the following: the overall staffing situation by main location and grade; the distribution of staff by sex, geographical representation, age profile and length of service, nature of appointment, and retirement projections; and the distribution of the workforce across the main occupational groups. The eighth human resources annual report containing complete data as at 31 December 2006 will be submitted to the Sixtieth World Health Assembly.
STAFFING PROFILE
Appointment categories
2. At 30 September 2006, WHO had a total of 4443 staff members on either fixed-term appointments of one to five years or career-service/service appointments (both referred to hereafter as “long-term appointments”).1 Of these, 1732 (39.0%) were in the professional category, 2406 (54.1%) in the general services category and 305 (6.9%) in the national professional officer category (see Table 1). The number of staff members holding long-term appointments has increased by 175 (4.1%) compared with the number reported in the annual report as at 30 September 2005.2
3. In addition to staff holding long-term appointments, there were 3697 staff holding temporary appointments (including consultants); 1275 of these held short-term appointments and 2422 held term-limited appointments (see Table 2).
Gender distribution
4. The percentage of women in the professional and higher categories has increased since the annual report as at 30 September 2005, rising to 36.4% from 35.6% (see figure).
5. The distribution of staff with long-term appointments by organizational location, grade and sex is shown in Table 3. It can be seen that, of the 1732 staff members on long-term appointments in the professional category, 1101 (63.6%) are men and 631 (36.4%) are women. This report shows that
1 This figure excludes staff from PAHO and IARC. 2 See document EB117/21 Add.1.

EB120/24 Add.1
2
women outnumbered men at grades P.2 and P.3. Since the annual report as at 30 September 2005, the representation of women at grades P.4 and above has improved. The proportion of women at grade P.4 is now 40.7% and at P.5 it is 31.4%; however, at P.6/D.1 level it has declined from 21.0% to 19.3%. There has been an increase in the proportion of women at D.2 level, which has risen from 24.4% to 28.6%. The proportion of women in ungraded posts has also increased, rising from 28.0% to 28.6%.
Geographical representation
6. Of the 1540 staff serving in posts counted for geographical purposes, 822 were nationals of developed countries (53.0%). The table attached at Annex to the current annual report1 shows recruitments during the period 1 January to 30 September 2006. It indicates that of a total of 133 appointments, 29.0% were from developing countries.
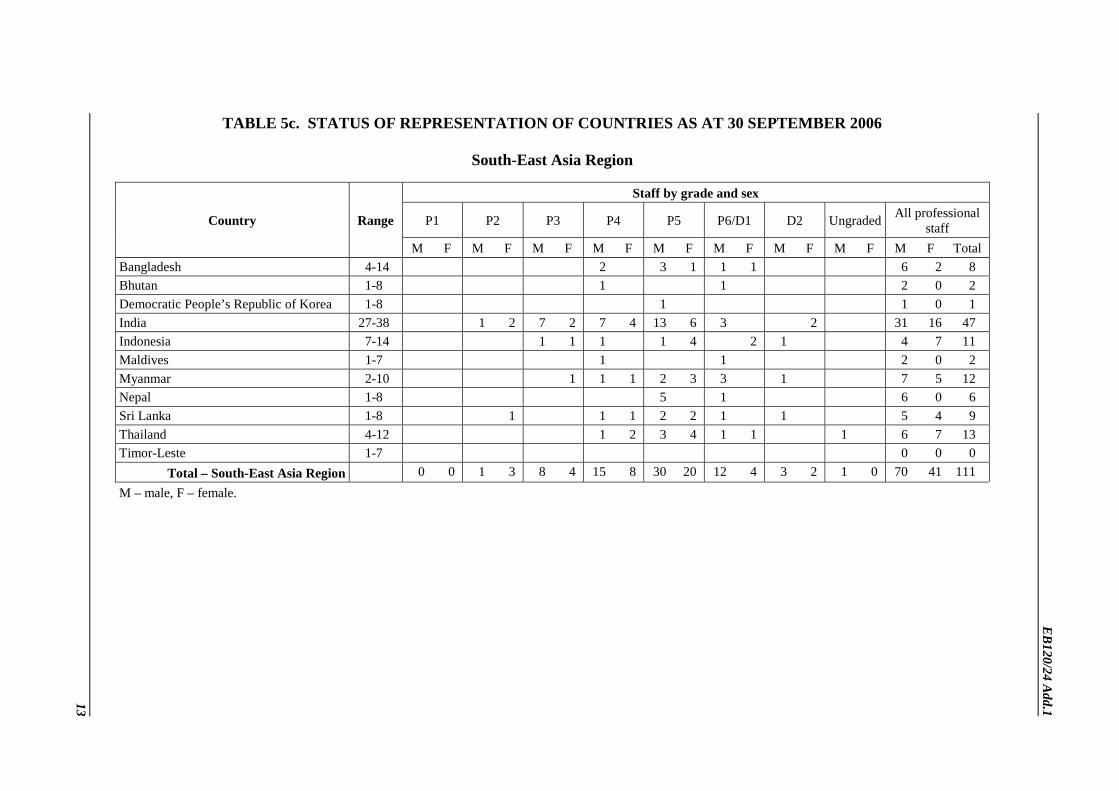
7. As of 30 September 2006, 110 countries were within their desirable range (including seven at the top of their range of representation); 42 countries (including two Associate Members) were unrepresented, eight were underrepresented and 35 were overrepresented (see Table 4). Table 5 gives details of the status of representation of countries, by region (the date excludes staff in posts funded by the country of their nationality). The following changes have taken place since the annual report as at 30 September 2005:
• two countries that were unrepresented (Haiti and Luxembourg) are now within their desirable range of representation;
• one country that was previously within its desirable range of representation (Singapore) is now unrepresented;
• one country that was underrepresented (Mexico) is now within its desirable range of representation;
• one country that was within its desirable range (United States of America) is now underrepresented;
• four countries that were overrepresented (Jordan, Mali, Mauritius, and Russian Federation) are now within their desirable range of representation;
• five countries that were within their desirable range of representation (Italy, Malawi, Sri Lanka, Thailand and Zimbabwe) are now overrepresented.
8. Table 6 provides information on the distribution of professional staff by location of assignment and region of nationality.
Age, gender, region, grade, length of service and turnover of staff
9. Over half the staff in the professional category (52.9%) are aged 50 or more. In the general service category, staff aged 50 or more continue to represent the largest age group (38.2%), whereas in
1 See document EB120/24.

EB120/24 Add.1
3
the national professional officer category, staff in their forties represent the largest age group (44.9%) (see Tables 7 and 8).
10. The largest single group of staff (representing 43.8% of the workforce) has less than five years of service. The approximate average length of service is more than seven years for professional staff and 11 years for general service staff (see Table 9).
11. Table 10 provides data on staff appointments (involving staff who have taken up duty in the period to 30 September 2006). In the case of the professional category, it shows that 61 staff (43.6%) were recruited externally, 64 appointments (45.7%) represented conversions of existing temporary contracts, and 15 staff (10.7%) were reassigned through interagency transfer. In the professional category, 41.0% of new appointments were women (against 40.2% as at 30 September 2005).
12. According to current projections, almost 17.0% of the workforce is due to retire within the next five years and just under 38.0% within the next 10 years (see Table 11).
Occupational groups
13. 50.2% of the posts held by professional staff are in the category “Dental, nutrition, medical, nursing and veterinary specialists”. Within this group, 91.5% are “Medical specialists” and 1.5% are “Nursing specialists”. The second largest occupational group is that of “Administrative specialists”, which accounts for 26.8% (see Table 12). In that group, 19.1% of posts are held by “Administrative officers”, 12.8% by “Technical cooperation administators”, 12.3% by “Computer information systems specialists” and 11.6% by “Financial management specialists”.
ACTION BY THE EXECUTIVE BOARD
14. The Board is invited to note the report.
FIGURE AND TABLES
15. The figure and tables referred to in the preceding paragraphs are listed below for ease of reference:
Figure Percentage of women in the professional and higher categories, 1990 – 30 September 2006
Table 1 Number of staff holding long-term appointments by grade and main location at year end 2002, 2004 and at 30 September 2006
Table 2 Number of staff holding long-term and temporary appointments (including consultants) as at 30 September 2006
Table 3 Distribution of staff by organizational location, grade and sex as at 30 September 2006
Table 4 Summary of countries not within range by region as at 30 September 2006
Table 5a-f Status of representation of countries as at 30 September 2006

EB120/24 Add.1
4
Table 6 Total staff in the professional and higher categories by location of assignment and region of nationality as at 30 September 2006
Table 7 Staff by age, sex and location as at 30 September 2006
Table 8 Staff by grade and age (all locations) as at 30 September 2006
Table 9 Staff by length of service as at 30 September 2006
Table 10 Appointments during year 2006 (up to 30 September 2006)
Table 11 Staff retirement projections
Table 12 Distribution of occupied professional and higher category posts across main occupational groups

5
EB
120/24 Add.1
TABLE 1. NUMBER OF STAFF HOLDING LONG-TERM APPOINTMENTS BY GRADE AND MAIN LOCATION AT YEAR END 2002, 2004 AND AT 30 SEPTEMBER 20061
Staff numbers at 31 December 2002 Staff numbers at 31 December 2004 Staff numbers at 30 September 2006
Headquarters Regional offices
Countries Total Headquarters Regional offices
Countries Total Headquarters Regional offices
Countries Total
Ungraded 3 6 0 9 13 6 0 19 15 6 0 21 D2 43 6 3 52 39 6 2 47 39 7 3 49 D1/P6 72 37 43 152 94 37 49 180 104 49 49 202 P5 302 178 80 560 319 193 85 597 339 208 115 662 P4 144 151 96 391 188 154 100 442 219 186 103 508 P3 72 59 21 152 90 71 26 187 96 74 25 195 P2 22 54 18 94 28 47 18 93 39 39 16 94 P1 0 0 1 1 0 0 0 0 0 1 0 1
Total professional 658 491 262 1 411 771 514 280 1 565 851 570 311 1 732
National professional officers 0 14 162 176 0 27 218 245 0 64 241 305
Total general service 644 987 468 2 099 687 984 536 2 207 676 1 107 623 2 406
Grand total 1 302 1 492 892 3 686 1 458 1 525 1 034 4 017 1 527 1 741 1 175 4 443
1 Figures for headquarters and regional offices include unassigned staff (those seconded to other organizations or on leave without pay).

EB
120/24 Add.1
6
TABLE 2. NUMBER OF STAFF HOLDING LONG-TERM AND TEMPORARY APPOINTMENTS (INCLUDING CONSULTANTS) AS AT 30 SEPTEMBER 2006
Category Headquarters Africa The Americas South-East Asia
Europe Eastern Mediterranean
Western Pacific
Total
Long-term appointments
Professional staff 851 289 110 123 127 111 121 1 732
National professional staff 0 194 4 34 37 21 15 305
General service staff 676 545 83 333 202 313 254 2 406
Total 1 527 1 028 197 490 366 445 390 4 443
Temporary appointments
• Term-limited appointments
Professional staff 300 180 26 17 37 70 23 653
National professional staff 0 115 0 8 36 9 0 168
General service staff 208 1 140 9 41 59 111 33 1 601
Total 508 1 435 35 66 132 190 56 2 422
• Short-term appointments
Professional staff 132 49 37 63 46 73 44 444
Consultants 63 123 43 6 3 58 23 319
National professional staff 0 77 0 13 13 5 0 108
General service staff 71 125 13 65 53 38 39 404
Total 266 374 93 147 115 174 106 1 275
Total staff holding temporary appointments 774 1 809 128 213 247 364 162 3 697
Total number of staff 2 301 2 837 325 703 613 809 552 8 140

7
EB
120/24 Add.1
TABLE 3. DISTRIBUTION OF STAFF BY ORGANIZATIONAL LOCATION, GRADE AND SEX AS AT 30 SEPTEMBER 2006 Professional staff
P1 P2 P3 P4 P5 P6/D1 D2 Ungraded Total Percentage Location
M F T M F T M F T M F T M F T M F T M F T M F T M F T M F
Headquarters 0 0 0 10 29 39 38 58 96 107 112 219 217 122 339 79 25 104 28 11 39 10 5 15 489 362 851 57.5 42.5 Africa 0 0 0 21 14 35 27 16 43 53 20 73 80 24 104 27 4 31 1 1 2 1 0 1 210 79 289 72.7 27.3 The Americas 0 0 0 1 5 6 5 5 10 55 26 81 8 3 11 1 0 1 0 0 0 0 1 1 70 40 110 63.6 36.4 South-East Asia 0 0 0 0 2 2 5 2 7 17 12 29 40 21 61 17 4 21 1 1 2 1 0 1 81 42 123 65.9 34.1 Europe 1 0 1 2 3 5 7 11 18 24 19 43 32 16 48 8 2 10 0 1 1 1 0 1 75 52 127 59.1 40.9 Eastern Mediterranean 0 0 0 2 3 5 9 8 17 14 6 20 32 11 43 21 2 23 2 0 2 1 0 1 81 30 111 73.0 27.0 Western Pacific 0 0 0 1 1 2 4 0 4 31 12 43 45 11 56 10 2 12 3 0 3 1 0 1 95 26 121 78.5 21.5
Total 1 0 1 37 57 94 95 100 195 301 207 508 454 208 662 163 39 202 35 14 49 15 6 21 1 101 631 1 732 63.6 36.4
Percentage by grade 100 0.0 100 39.4 60.6 100 48.7 51.3 100 59.3 40.7 100 68.6 31.4 100 80.7 19.3 100 71.4 28.6 100 71.4 28.6 100 63.6 36.4 100
Percentage of total 0.1 5.4 11.3 29.3 38.2 11.7 2.8 1.2 100
National professional officers A B C D Total Percentage
Location M F T M F T M F T M F T M F T M F
Africa 1 0 1 46 15 61 82 48 130 1 1 2 130 64 194 67.0 33.0 The Americas 1 1 2 0 0 0 0 2 2 0 0 0 1 3 4 25.0 75.0 South-East Asia 4 0 4 2 1 3 25 2 27 0 0 0 31 3 34 91.2 8.8 Europe 7 3 10 11 15 26 1 0 1 0 0 0 19 18 37 51.4 48.6
Eastern Mediterranean 0 0 0 10 10 20 1 0 1 0 0 0 11 10 21 52.4 47.6
Western Pacific 1 4 5 3 4 7 1 1 2 1 0 1 6 9 15 40.0 60.0
Total 14 8 22 72 45 117 110 53 163 2 1 3 198 107 305 64.9 35.1
Percentage by grade 63.6 36.4 100 61.5 38.5 100 67.5 32.5 100 66.7 33.3 100 64.9 35.1 100
Percentage of total 7.2 38.4 53.4 1.0 100
General service staff
G1 G2 G3 G4 G5 G6 G7 Total Percentage Location
M F T M F T M F T M F T M F T M F T M F T M F T M F
Headquarters 0 0 0 0 1 1 20 8 28 37 141 178 53 222 275 36 132 168 8 18 26 154 522 676 22.8 77.2 Africa 47 3 50 68 1 69 71 7 78 28 35 63 25 67 92 32 64 96 51 46 97 322 223 545 59.1 40.9 The Americas 0 0 0 0 0 0 0 1 1 5 15 20 3 24 27 4 25 29 1 5 6 13 70 83 15.7 84.3 South-East Asia 10 1 11 55 0 55 32 10 42 32 38 70 46 31 77 23 11 34 34 10 44 232 101 333 69.7 30.3 Europe 0 0 0 12 0 12 6 6 12 10 23 33 12 102 114 5 16 21 2 8 10 47 155 202 23.3 76.7 Eastern Mediterranean 19 1 20 37 0 37 25 3 28 12 74 86 18 56 74 14 26 40 4 24 28 129 184 313 41.2 58.8 Western Pacific 2 1 3 14 1 15 23 7 30 7 36 43 7 72 79 15 45 60 7 17 24 75 179 254 29.5 70.5
Total 78 6 84 186 3 189 177 42 219 131 362 493 164 574 738 129 319 448 107 128 235 972 1 434 2 406 40.4 59.6
Percentage by grade 92.9 7.1 100 98.4 1.6 100 80.8 19.2 100 26.6 73.4 100 22.2 77.8 100 28.8 71.2 100 45.5 54.5 100 40.4 59.6 100
Percentage of total 3.5 7.9 9.1 20.4 30.7 18.6 9.8 100
M – male, F – female, T – total.

8 EB
120/24 Add.1
TABLE 4. SUMMARY OF COUNTRIES NOT WITHIN RANGE BY REGION AS AT 30 SEPTEMBER 2006 (Note: countries not listed are within range)
Region Unrepresented countries Underrepresented countries Overrepresented countries
Africa Comoros Lesotho Seychelles Swaziland
– Burkina Faso Cameroon Congo Côte d’Ivoire Ethiopia Ghana Kenya
Malawi Nigeria Rwanda Senegal Uganda Zambia Zimbabwe
The Americas Antigua and Barbuda Barbados Belize Dominica Grenada Puerto Rico*
Saint Kitts and Nevis Saint Lucia Saint Vincent and the Grenadines Suriname
United States of America Canada Colombia
South-East Asia Timor-Leste – India Myanmar
Sri Lanka Thailand
Europe Andorra Bosnia and Herzegovina Monaco Montenegro San Marino
Tajikistan The former Yugoslav Republic of Macedonia Uzbekistan
Germany Israel
Belgium Denmark France Ireland Italy
Netherlands Sweden Switzerland United Kingdom of Great Britain and Northern Ireland
Eastern Mediterranean
Kuwait Oman
Qatar United Arab Emirates
Saudi Arabia Egypt Lebanon
Sudan Tunisia
Western Pacific Brunei Darussalam Cook Islands Kiribati Marshall Islands Micronesia (Federated States of) Nauru Niue
Palau Papua New Guinea Samoa Singapore Tokelau* Tonga Tuvalu Vanuatu
China Japan Republic of Korea Singapore Viet Nam
Australia Philippines
* Associate Member.

9
EB
120/24 Add.1
TABLE 5a. STATUS OF REPRESENTATION OF COUNTRIES AS AT 30 SEPTEMBER 2006
African Region
Staff by grade and sex
P1 P2 P3 P4 P5 P6/D1 D2 Ungraded All professional
staff Country Range
M F M F M F M F M F M F M F M F M F Total
Algeria 2-10 2 1 3 2 7 1 8
Angola 1-8 1 1 1 1 4 0 4
Benin 1-8 1 2 1 2 2 6 2 8
Botswana 1-8 1 1 1 1 2 2 4
Burkina Faso 1-8 1 1 1 2 1 1 4 3 10 4 14
Burundi 1-8 1 3 2 1 5 2 7
Cameroon 1-8 1 2 2 1 4 2 8 4 12
Cape Verde 1-7 1 1 1 1 2
Central African Republic 1-8 2 1 3 0 3
Chad 1-8 1 1 1 2 1 3
Comoros 1-7 0 0 0
Congo 1-8 6 3 1 1 10 1 11
Côte d’Ivoire 1-8 1 2 1 4 1 2 7 4 11
Democratic Republic of the Congo 2-12 1 2 3 1 2 8 1 9
Equatorial Guinea 1-7 1 1 2 0 2
Eritrea 1-8 1 2 3 0 3
Ethiopia 2-12 1 2 4 2 3 2 1 7 8 15
Gabon 1-8 1 1 1 1 2 3
Gambia 1-8 1 2 1 2 1 7 0 7
Ghana 1-8 1 1 2 2 3 3 1 2 1 10 6 16
Guinea 1-8 1 2 2 1 1 6 1 7
Guinea-Bissau 1-8 1 1 1 1 2
Kenya 1-10 1 2 2 3 3 2 2 2 9 8 17
Lesotho 1-8 0 0 0
9

10
EB
120/24 Add.1
Staff by grade and sex
P1 P2 P3 P4 P5 P6/D1 D2 Ungraded All professional
staff Country Range
M F M F M F M F M F M F M F M F M F Total
Liberia 1-8 1 1 1 1 2
Madagascar 1-8 1 2 2 3 2 5
Malawi 1-8 2 1 5 1 7 2 9
Mali 1-8 2 4 1 1 7 1 8
Mauritania 1-8 1 2 3 1 7 0 7
Mauritius 1-8 1 1 1 1 1 1 1 5 2 7
Mozambique 1-8 2 1 2 1 3
Namibia 1-8 1 1 1 2 1 3
Niger 1-8 1 1 4 1 6 1 7
Nigeria 4-14 1 1 4 5 2 3 1 14 3 17
Rwanda 1-8 1 3 6 1 10 1 11
Sao Tome and Principe 1-7 1 1 0 1
Senegal 1-8 1 1 2 2 2 3 2 2 7 8 15
Seychelles 1-7 0 0 0
Sierra Leone 1-8 1 1 1 2 1 3
South Africa 4-11 2 1 5 2 1 7 4 11
Swaziland 1-7 0 0 0
Togo 1-8 1 1 2 2 6 0 6
Uganda 1-8 1 4 1 6 1 1 11 3 14
United Republic of Tanzania 1-10 1 2 3 2 1 4 5 9
Zambia 1-8 1 2 2 5 1 2 9 4 13
Zimbabwe 1-8 1 1 1 3 1 2 1 9 1 10
Total – African Region 0 0 21 11 23 15 59 23 98 28 33 9 3 3 2 1 239 90 329
M – male, F – female.

11
EB
120/24 Add.1
TABLE 5b. STATUS OF REPRESENTATION OF COUNTRIES AS AT 30 SEPTEMBER 2006
Region of the Americas
Staff by grade and sex
P1 P2 P3 P4 P5 P6/D1 D2 Ungraded All professional
staff Country Range
M F M F M F M F M F M F M F M F M F Total
Antigua and Barbuda 1-7 0 0 0
Argentina 9-16 3 3 1 1 1 4 5 9
Bahamas 1-7 1 1 0 1
Barbados 1-7 0 0 0
Belize 1-7 0 0 0
Bolivia 1-8 1 2 2 1 3
Brazil 21-29 1 4 7 8 1 3 1 15 10 25
Canada 19-26 3 4 6 4 9 7 3 1 1 1 23 16 39
Chile 2-9 1 2 1 2 1 2 3 6 9
Colombia 3-10 6 3 1 1 1 8 4 12
Costa Rica 1-8 1 2 1 3 1 4
Cuba 1-8 1 3 1 1 5 1 6
Dominica 1-7 0 0 0
Dominican Republic 1-8 1 2 1 1 2 3 5
Ecuador 1-8 1 2 1 3 1 4
El Salvador 1-8 2 2 2 2 4
Grenada 1-7 0 0 0
Guatemala 1-8 1 2 3 0 3
Guyana 1-7 1 2 1 2 2 4
Haiti 1-8 1 1 0 1
Honduras 1-8 1 1 1 1 2
Jamaica 1-8 1 1 1 1 2
Mexico 11-17 1 4 1 1 1 1 2 8 3 11
Nicaragua 1-8 2 2 2 2 4

12
EB
120/24 Add.1
Staff by grade and sex
P1 P2 P3 P4 P5 P6/D1 D2 Ungraded All professional
staff Country Range
M F M F M F M F M F M F M F M F M F Total
Panama 1-8 2 1 1 3 1 4
Paraguay 1-8 2 1 2 1 3
Peru 2-10 2 1 1 3 1 4
Puerto Rico* 1-8 0 0 0
Saint Kitts and Nevis 1-7 0 0 0
Saint Lucia 1-7 0 0 0
Saint Vincent and the Grenadines 1-7 0 0 0
Suriname 1-7 0 0 0
Trinidad and Tobago 1-8 1 1 1 1 2 2 4
United States of America 142-193 4 10 7 22 21 32 23 12 2 3 3 2 81 60 141
Uruguay 1-8 2 1 2 3 2 5
Venezuela (Bolivarian Republic of) 2-9 2 2 2 2 4
Total – Region of the Americas 0 0 2 6 14 16 75 56 62 42 22 4 7 3 3 1 185 128 313
* Associate Member.
M – male, F – female.
13
EB
120/24 Add.1
TABLE 5c. STATUS OF REPRESENTATION OF COUNTRIES AS AT 30 SEPTEMBER 2006
South-East Asia Region
Staff by grade and sex
P1 P2 P3 P4 P5 P6/D1 D2 Ungraded All professional
staff Country Range
M F M F M F M F M F M F M F M F M F Total
Bangladesh 4-14 2 3 1 1 1 6 2 8
Bhutan 1-8 1 1 2 0 2
Democratic People’s Republic of Korea 1-8 1 1 0 1
India 27-38 1 2 7 2 7 4 13 6 3 2 31 16 47
Indonesia 7-14 1 1 1 1 4 2 1 4 7 11
Maldives 1-7 1 1 2 0 2
Myanmar 2-10 1 1 1 2 3 3 1 7 5 12
Nepal 1-8 5 1 6 0 6
Sri Lanka 1-8 1 1 1 2 2 1 1 5 4 9
Thailand 4-12 1 2 3 4 1 1 1 6 7 13
Timor-Leste 1-7 0 0 0
Total – South-East Asia Region 0 0 1 3 8 4 15 8 30 20 12 4 3 2 1 0 70 41 111
M – male, F – female.

14
EB
120/24 Add.1
TABLE 5d. STATUS OF REPRESENTATION OF COUNTRIES AS AT 30 SEPTEMBER 2006
European Region
Staff by grade and sex
P1 P2 P3 P4 P5 P6/D1 D2 Ungraded All professional
staff Country Range
M F M F M F M F M F M F M F M F M F Total Albania 1-8 1 0 1 1 Andorra 1-7 0 0 0 Armenia 1-8 1 1 1 1 2 Austria 7-14 2 2 1 2 5 2 7 Azerbaijan 1-8 1 1 0 1 Belarus 1-8 1 1 0 1 Belgium 9-15 1 5 3 5 3 6 2 18 7 25 Bosnia and Herzegovina 1-8 0 0 0 Bulgaria 1-8 2 2 1 2 3 5 Croatia 1-8 1 1 2 0 2 Cyprus 1-7 1 1 0 1 Czech Republic 2-9 1 2 1 2 2 4 Denmark 6-12 2 2 2 1 3 4 1 11 4 15 Estonia 1-8 1 1 0 1 Finland 4-11 2 3 1 2 1 7 8 France 42-58 2 7 6 14 7 23 10 9 4 1 1 1 55 30 85 Georgia 1-8 1 1 1 1 2 3 Germany 63-86 1 1 5 12 7 17 10 2 1 33 23 56 Greece 4-11 1 3 3 1 4 Hungary 1-8 1 1 0 1 Iceland 1-7 1 1 0 1 Ireland 3-9 1 1 4 4 2 2 2 1 2 9 10 19 Israel 3-10 1 0 1 1 Italy 34-47 2 7 4 19 4 8 5 41 8 49 Kazakhstan 1-8 2 0 2 2 Kyrgyzstan 1-8 1 0 1 1

15
EB
120/24 Add.1
Staff by grade and sex
P1 P2 P3 P4 P5 P6/D1 D2 Ungraded All professional
staff Country Range
M F M F M F M F M F M F M F M F M F Total Latvia 1-8 1 1 1 1 2 Lithuania 1-8 1 1 1 2 1 3 Luxembourg 1-8 1 1 0 1 Malta 1-7 1 1 1 1 2 3 Monaco 1-7 0 0 0 Montenegro 1-7 0 0 0 Netherlands 13-20 1 1 2 8 4 14 4 4 2 1 28 13 41 Norway 5-12 3 1 1 2 3 4 7 Poland 4-11 1 4 2 5 2 7 Portugal 4-10 1 1 2 2 2 4 Republic of Moldova 1-8 1 0 1 1 Romania 1-8 1 1 1 1 1 3 4 Russian Federation 12-19 7 1 8 1 2 17 2 19 San Marino 1-7 0 0 0 Serbia 1-7 2 0 2 2 Slovakia 1-8 1 1 1 1 2 Slovenia 1-8 1 0 1 1 Spain 18-26 1 1 4 4 5 1 2 1 7 12 19 Sweden 8-14 2 2 1 4 4 3 1 1 7 11 18 Switzerland 9-16 1 4 3 4 4 4 3 1 13 11 24 Tajikistan 1-8 0 0 0 The former Yugoslav Republic of Macedonia 1-8 0 0 0 Turkey 5-12 1 3 2 1 1 5 3 8 Turkmenistan 1-8 1 0 1 1 Ukraine 2-10 1 1 1 1 2 3 United Kingdom of Great Britain and Northern Ireland 37-51 3 1 7 10 9 14 13 10 2 3 2 39 35 74 Uzbekistan 1-10 0 0 0
Total – European Region 1 0 1 11 24 41 84 69 140 73 56 13 14 5 4 3 324 215 539
M – male, F – female.

16
EB
120/24 Add.1
TABLE 5e. STATUS OF REPRESENTATION OF COUNTRIES AS AT 30 SEPTEMBER 2006
Eastern Mediterranean Region
Staff by grade and sex
P1 P2 P3 P4 P5 P6/D1 D2 Ungraded All professional
staff Country Range
M F M F M F M F M F M F M F M F M F Total
Afghanistan 1-8 2 1 1 3 1 4
Bahrain 1-7 1 1 0 2 2
Djibouti 1-7 2 2 0 2
Egypt 3-12 1 2 2 2 4 1 1 4 8 9 17
Iran (Islamic Republic of) 4-12 4 2 4 2 6
Iraq 2-9 1 1 1 3 0 3
Jordan 1-8 1 1 1 1 1 2 5 2 7
Kuwait 1-8 0 0 0
Lebanon 1-8 1 2 1 4 1 1 4 6 10
Libyan Arab Jamahiriya 1-8 1 1 0 1
Morocco 1-10 2 3 5 0 5
Oman 1-8 0 0 0
Pakistan 5-14 2 6 2 10 0 10
Qatar 1-7 0 0 0
Saudi Arabia 5-11 1 1 2 0 2
Somalia 1-8 3 1 1 5 0 5
Sudan 1-10 2 1 1 5 4 12 1 13
Syrian Arab Republic 1-8 1 3 1 4 1 5
Tunisia 1-8 1 1 1 3 5 9 2 11
United Arab Emirates 2-8 0 0 0
Yemen 1-8 1 2 3 0 3
Total – Eastern Mediterranean Region 0 0 1 2 8 4 12 6 32 12 24 2 1 0 2 0 80 26 106
M – male, F – female.

17
EB
120/24 Add.1
TABLE 5f. STATUS OF REPRESENTATION OF COUNTRIES AS AT 30 SEPTEMBER 2006
Western Pacific Region
Staff by grade and sex
P1 P2 P3 P4 P5 P6/D1 D2 Ungraded All professional
staff Country Range
M F M F M F M F M F M F M F M F M F Total
Australia 12-19 1 2 2 3 4 5 4 1 1 1 14 10 24
Brunei Darussalam 1-7 0 0 0
Cambodia 1-8 1 1 2 0 2
China 40-55 1 1 1 2 3 8 3 2 1 1 14 9 23
Cook Islands 1-7 0 0 0
Fiji 1-7 1 1 0 1
Japan 121-166 2 1 4 5 5 11 6 1 1 1 1 20 18 38
Kiribati 1-7 0 0 0
Lao People’s Democratic Republic 1-8 1 1 0 1
Malaysia 3-9 1 2 2 1 1 1 1 4 5 9
Marshall Islands 1-7 0 0 0
Micronesia (Federated States of) 1-7 0 0 0
Mongolia 1-8 1 1 2 0 2
Nauru 1-7 0 0 0
New Zealand 2-9 1 3 3 2 5 4 9
Niue 1-7 0 0 0
Palau 1-7 0 0 0
Papua New Guinea 1-8 0 0 0
Philippines 3-12 3 1 5 5 3 3 1 1 1 1 13 11 24
Republic of Korea 15-21 3 2 1 6 0 6
Samoa 1-7 0 0 0
Singapore 3-10 0 0 0
Solomon Islands 1-7 1 1 0 1
Tokelau* 1-7 0 0 0

18
EB
120/24 Add.1
Staff by grade and sex
P1 P2 P3 P4 P5 P6/D1 D2 Ungraded All professional
staff Country Range
M F M F M F M F M F M F M F M F M F Total
Tonga 1-7 0 0 0
Tuvalu 1-7 0 0 0
Vanuatu 1-7 0 0 0
Viet Nam 3-12 1 1 1 1 2
Total – Western Pacific Region 0 0 3 5 10 11 19 18 34 19 10 3 5 1 3 1 84 58 142
* Associate Member.
M – male, F – female.

19
EB
120/24 Add.1
TABLE 6. TOTAL STAFF IN THE PROFESSIONAL AND HIGHER CATEGORIES BY LOCATION OF ASSIGNMENT
AND REGION OF NATIONALITY AS AT 30 SEPTEMBER 2006
By location of assignment
Region of nationality
Africa The Americas South-East Asia Europe Eastern Mediterranean Western Pacific Total Location of assignment
No. % No. % No. % No. % No. % No. % No. %
Headquarters 82 9.6 185 21.7 43 5.9 408 47.9 33 3.9 100 11.8 851 100.0
Africa 249 86.2 17 5.9 2 0.7 18 6.2 2 0.7 1 0.3 289 100.0
The Americas 2 1.8 94 85.5 0 0.0 14 12.7 0 0.0 0 0.0 110 100.0
South-East Asia 3 2.4 17 13.8 60 48.8 34 27.6 1 0.8 8 6.5 123 100.0
Europe 0 0.0 12 9.4 2 1.6 109 85.8 0 0.0 4 3.2 127 100.0
Eastern Mediterranean 4 3.6 13 11.7 2 1.8 13 11.7 75 67.6 4 3.6 111 100.0
Western Pacific 3 2.5 26 21.5 6 4.9 41 33.9 0 0.0 45 37.2 121 100.0
Total 343 19.8 364 21.0 115 6.6 637 36.8 111 6.4 162 9.4 1 732 100.0
By region of nationality
Region of nationality
Africa The Americas South-East Asia Europe Eastern Mediterranean Western Pacific Total Location of assignment
No. % No. % No. % No. % No. % No. % No. %
Headquarters 82 23.9 185 50.8 43 37.5 408 64.1 33 29.7 100 61.7 851 49.1
Africa 249 72.5 17 4.7 2 1.7 18 2.8 2 1.8 1 0.6 289 16.7
The Americas 2 0.6 94 25.8 0 0.0 14 2.2 0 0.0 0 0.0 110 6.4
South-East Asia 3 0.9 17 4.7 60 52.2 34 5.3 1 0.9 8 4.9 123 7.3
Europe 0 0.0 12 3.3 2 1.7 109 17.1 0 0.0 4 2.5 127 6.0
Eastern Mediterranean 4 1.2 13 3.6 2 1.7 13 2.1 75 67.6 4 2.5 111 6.9
Western Pacific 3 0.9 26 7.1 6 5.2 41 6.4 0 0.0 45 27.8 121 7.2
Total 343 100.0 364 100.0 115 100.0 637 100.0 111 100.0 162 100.0 1 732 100.0

20
EB
120/24 Add.1
TABLE 7. STAFF BY AGE, SEX AND LOCATION AS AT 30 SEPTEMBER 2006
Professional staff
20-29 years 30-39 years 40-49 years 50-59 years ≥60 years Total Location
M F T M F T M F T M F T M F T M F T
Headquarters 0 9 9 60 81 141 163 138 301 243 128 371 23 6 29 489 362 851
Africa 0 1 1 11 7 18 64 37 101 129 31 160 6 3 9 210 79 289
The Americas 0 0 0 3 2 5 17 18 35 47 15 62 3 5 8 70 40 110
South-East Asia 0 0 0 3 6 9 21 12 33 51 21 72 6 3 9 81 42 123
Europe 0 1 1 10 8 18 25 24 49 39 19 58 1 0 1 75 52 127
Eastern Mediterranean 0 0 0 5 1 6 19 18 37 53 11 64 4 0 4 81 30 111
Western Pacific 0 0 0 8 4 12 31 10 41 52 11 63 4 1 5 95 26 121
Total 0 11 11 100 109 209 340 257 597 614 236 850 47 18 65 1 101 631 1 732
Percentage by bracket 0.0 100.0 100.0 47.8 52.2 100.0 57.0 43.0 100.0 72.2 27.8 100.0 72.3 27.7 100.0 63.6 36.4 100.0
Percentage of total 0.6 12.1 34.5 49.1 3.7 100.0
National professional officers
20-29 years 30-39 years 40-49 years 50-59 years ≥60 years Total Location
M F T M F T M F T M F T M F T M F T
Africa 0 1 1 9 4 13 55 32 87 63 25 88 3 2 5 130 64 194
The Americas 0 0 0 0 0 0 1 3 4 0 0 0 0 0 0 1 3 4
South-East Asia 0 0 0 2 1 3 14 2 16 13 0 13 2 0 2 31 3 34
Europe 0 0 0 10 7 17 7 8 15 2 3 5 0 0 0 19 18 37
Eastern Mediterranean 0 0 0 2 1 3 4 6 10 5 3 8 0 0 0 11 10 21
Western Pacific 0 0 0 0 2 2 3 2 5 3 5 8 0 0 0 6 9 15
Total 0 1 1 23 15 38 84 53 137 86 36 122 5 2 7 198 107 305
Percentage by bracket 0.0 100.0 100.0 60.5 39.5 100.0 61.3 38.7 100.0 70.5 29.5 100.0 71.4 28.6 100.0 64.9 35.1 100.0
Percentage of total 0.3 12.5 44.9 40.0 2.3 100.0

21
EB
120/24 Add.1
General service staff
20-29 years 30-39 years 40-49 years 50-59 years ≥60 years Total Location
M F T M F T M F T M F T M F T M F T
Headquarters 2 18 20 34 105 139 54 167 221 58 222 280 6 10 16 154 522 676
Africa 2 6 8 45 45 90 117 91 208 151 78 229 7 3 10 322 223 545
The Americas 1 1 2 4 10 14 5 25 30 2 33 35 1 1 2 13 70 83
South-East Asia 10 10 20 56 34 90 68 28 96 93 29 122 5 0 5 232 101 333
Europe 2 8 10 19 47 66 13 51 64 13 49 62 0 0 0 47 155 202
Eastern Mediterranean 4 21 25 35 69 104 51 57 108 39 37 76 0 0 0 129 184 313
Western Pacific 4 12 16 16 51 67 28 61 89 25 55 80 2 0 2 75 179 254
Total 25 76 101 209 361 570 336 480 816 381 503 884 21 14 35 972 1 434 2 406
Percentage by bracket 24.8 75.2 100.0 36.7 63.3 100.0 41.2 58.8 100.0 43.1 56.9 100.0 60.0 40.0 100.0 40.4 59.6 100.0
Percentage of total 4.2 23.7 33.9 36.7 1.5 100.0
M – male, F – female, T – total.

22
EB
120/24 Add.1
TABLE 8. STAFF BY GRADE AND AGE (ALL LOCATIONS) AS AT 30 SEPTEMBER 2006
Professional staff
20-29 years 30-39 years 40-49 years 50-59 years ≥60 years Total Grade
M F T M F T M F T M F T M F T M F T
Ungraded 0 0 0 0 0 0 4 2 6 7 2 9 4 2 6 15 6 21
D2 0 0 0 0 0 0 7 3 10 26 11 37 2 0 2 35 14 49
D1/P6 0 0 0 1 0 1 31 11 42 118 27 145 13 1 14 163 39 202
P5 0 0 0 14 8 22 135 96 231 288 97 385 17 7 24 454 208 662
P4 0 0 0 48 41 89 116 96 212 129 62 191 8 8 16 301 207 508
P3 0 4 4 25 35 60 34 33 67 33 28 61 3 0 3 95 100 195
P2 0 7 7 11 25 36 13 16 29 13 9 22 0 0 0 37 57 94
P1 0 0 0 1 0 1 0 0 0 0 0 0 0 0 0 1 0 1
Total 0 11 11 100 109 209 340 257 597 614 236 850 47 18 65 1 101 631 1 732
Percentage by bracket 0.0 100.0 100.0 47.8 52.2 100.0 57.0 43.0 100.0 72.2 27.8 100.0 72.3 27.7 100.0 63.6 36.4 100.0
Percentage of total 0.6 12.1 34.5 49.1 3.7 100.0
National professional officers
20-29 years 30-39 years 40-49 years 50-59 years ≥60 years Total Grade
M F T M F T M F T M F T M F T M F T
A 0 0 0 5 1 6 3 3 6 6 4 10 0 0 0 14 8 22
B 0 1 1 9 10 19 35 20 55 27 14 41 1 0 1 72 45 117
C 0 0 0 9 4 13 44 29 73 53 18 71 4 2 6 110 53 163
D 0 0 0 0 0 0 2 1 3 0 0 0 0 0 0 2 1 3
Total 0 1 1 23 15 38 84 53 137 86 36 122 5 2 7 198 107 305
Percentage by bracket 0.0 100.0 100.0 60.5 39.5 100.0 61.3 38.7 100.0 70.5 29.5 100.0 71.4 28.6 100.0 64.9 35.1 100.0
Percentage of total 0.3 12.5 44.9 40.0 2.3 100.0

23
EB
120/24 Add.1
General service staff
20-29 years 30-39 years 40-49 years 50-59 years ≥60 years Total Grade
M F T M F T M F T M F T M F T M F T
G7 2 0 2 14 9 23 39 41 80 50 78 128 2 0 2 107 128 235
G6 3 3 6 35 58 93 45 125 170 43 130 173 3 3 6 129 319 448
G5 7 21 28 44 154 198 42 185 227 69 205 274 2 9 11 164 574 738
G4 5 46 51 26 129 155 47 107 154 48 78 126 5 2 7 131 362 493
G3 3 6 9 27 10 37 75 17 92 70 9 79 2 0 2 177 42 219
G2 3 0 3 50 0 50 61 1 62 67 2 69 5 0 5 186 3 189
G1 2 0 2 13 1 14 27 4 31 34 1 35 2 0 2 78 6 84
Total 25 76 101 209 361 570 336 480 816 381 503 884 21 14 35 972 1 434 2 406
Percentage by bracket 24.8 75.2 100.0 36.7 63.3 100.0 41.2 58.8 100.0 43.1 56.9 100.0 60.0 40.0 100.0 40.4 59.6 100.0
Percentage of total 4.2 23.7 33.9 36.7 1.5 100.0
M – male, F – female, T – total.

24
EB
120/24 Add.1
TABLE 9. STAFF BY LENGTH OF SERVICE AS AT 30 SEPTEMBER 2006
Under 5 years 5-9 years 10-14 years 15-19 years 20-24 years 25-29 years ≥30 years All Location
P NPO GS T P NPO GS T P NPO GS T P NPO GS T P NPO GS T P NPO GS T P NPO GS T P NPO GS T
Headquarters 426 0 240 666 181 0 109 290 94 0 46 140 88 0 125 213 41 0 82 123 12 0 25 37 9 0 49 58 851 0 676 1 527
Africa 127 76 203 406 92 110 61 263 21 0 79 100 28 8 77 113 12 0 63 75 6 0 39 45 3 0 23 26 289 194 545 1 028
The Americas 58 3 27 88 31 0 25 56 12 0 11 23 7 0 6 13 1 1 9 11 0 0 3 3 1 0 2 3 110 4 83 197
South-East Asia 62 19 96 177 29 8 47 84 20 0 70 90 6 1 46 53 6 5 47 58 0 1 11 12 0 0 16 16 123 34 333 490
Europe 83 37 126 246 17 0 23 40 7 0 16 23 13 0 12 25 5 0 12 17 2 0 7 9 0 0 6 6 127 37 202 366
Eastern Mediterranean 44 14 161 219 39 3 45 87 13 1 34 48 9 0 33 42 5 1 22 28 0 2 14 16 1 0 4 5 111 21 313 445
Western Pacific 51 5 86 142 39 0 56 95 15 2 32 49 9 1 32 42 6 5 27 38 0 2 19 21 1 0 2 3 121 15 254 390
Total 851 154 939 1 944 428 121 366 915 182 3 288 473 160 10 331 501 76 12 262 350 20 5 118 143 15 0 102 117 1 732 305 2 406 4 443
Percentage by bracket 43.8 7.9 48.3 100.0 46.8 13.2 40.0 100.0 38.5 0.6 60.9 100.0 31.9 2.0 66.1 100.0 21.7 3.4 74.9 100.0 14.0 3.5 82.5 100.0 12.8 0.0 87.2 100.0 39.0 6.9 54.1 100.0
Percentage of total
43.8
20.6
10.6
11.3
7.9
3.2
2.6
100.0
P – professional, NPO – national professional officer, GS – general service, T – total.

25
EB
120/24 Add.1
TABLE 10. APPOINTMENTS DURING YEAR 2006 (UP TO 30 SEPTEMBER 2006)
New appointments Conversion of temporary contracts
Interagency transfers Total number of appointments
Location Category Total staff at 30 September
2006 No. of staff
% of total recruitment
% of women
No. of staff
% of total recruitment
% of women
No. of staff
% of total recruitment
% of women
No. of staff
% of women
P 851 30 43.5 42.9 32 46.4 52.9 7 10.1 28.6 69 46.1
NPO 0 0 0.0 0.0 0 0.0 0.0 0 0.0 0.0 0 0.0 Headquarters
GS 676 2 4.7 100.0 39 77.1 92.3 2 4.7 100.0 43 93.0
P 289 1 6.7 0.0 13 86.7 7.7 1 6.7 100.0 15 13.3
NPO 194 4 33.3 0.0 8 66.7 25.0 0 0.0 0.0 12 16.7 Africa
GS 545 2 2.9 100.0 67 81.2 28.4 0 0.0 0.0 69 30.5
P 110 0 0.0 0.0 1 14.3 0.0 6 85.7 0.0 7 0.0
NPO 4 0 0.0 0.0 1 100.0 100.0 0 0.0 0.0 1 0.0 The Americas
GS 83 0 0.0 0.0 0 0.0 0.0 1 100.0 100.0 1 100.0
P 123 10 66.7 40.0 5 33.3 20.0 0 0.0 0.0 15 33.3
NPO 34 1 50.0 0.0 1 50.0 100.0 0 0.0 0.0 2 50.0 South-East Asia
GS 333 2 10.5 0.0 17 89.5 35.3 0 0.0 0.0 19 31.6
P 127 5 45.5 40.0 5 45.5 80.0 1 9.1 0.0 11 54.5
NPO 37 1 50.0 0.0 1 50.0 100.0 0 0.0 0.0 2 0.0 Europe
GS 202 2 15.4 100.0 11 84.6 90.9 0 0.0 0.0 13 92.3
P 111 0 0.0 0.0 6 100.0 33.3 0 0.0 0.0 6 33.3
NPO 21 2 66.7 0.0 1 33.3 0.0 0 0.0 0.0 3 0.0 Eastern Mediterranean
GS 313 1 5.9 100.0 16 94.1 37.5 0 0.0 0.0 17 41.2
P 121 10 100.0 40.0 0 0.0 0.0 0 0.0 0.0 10 40.0
NPO 15 3 0.0 0.0 0 0.0 0.0 0 0.0 0.0 3 0.0 Western Pacific
GS 254 5 29.4 60.0 12 70.6 75.0 0 0.0 0.0 17 70.6
P 1 732 56 42.1 41.0 62 46.6 40.6 15 11.3 20.0 133 38.4
NPO 305 11 47.8 0.0 12 52.2 41.7 0 0.0 0.0 23 21.8
GS 2 406 14 7.8 71.4 162 90.5 53.1 3 1.7 100.0 179 55.3 Total
All 4 443 81 24.2 40.7 236 70.4 49.2 18 5.4 33.3 335 46.3
P – professional, NPO – national professional officer, GS – general service.

26
EB
120/24 Add.1
TABLE 11. STAFF RETIREMENT PROJECTIONS1
Staff due to retire
by 30 September 2007 by 30 September 2009 by 30 September 2011 by 30 September 2016 Location Category Total staff at 30 September 2006
No. % No. % No. % No. %
P 851 29 3.4 96 11.3 163 19.2 333 39.1 NPO 0 0 0.0 0 0.0 0 0.0 0 0.0 Headquarters GS 676 17 2.5 59 8.7 110 16.3 260 38.5
P 289 8 2.8 25 8.7 52 18.0 141 48.8 NPO 194 1 0.5 12 6.2 29 14.9 72 37.1 Africa GS 545 14 2.6 50 9.2 84 15.4 214 39.3
P 110 4 3.6 18 16.4 34 30.9 57 51.8 NPO 4 0 0.0 0 0.0 0 0.0 0 0.0 The Americas GS 83 4 4.8 10 12.0 20 24.1 35 42.2
P 123 6 4.9 17 13.8 35 28.5 72 58.5 NPO 34 1 2.9 3 8.8 7 20.6 13 38.2 South-East Asia GS 333 12 3.6 32 9.6 48 14.4 118 35.4
P 127 2 1.6 5 3.9 16 12.6 45 35.4 NPO 37 0 0.0 0 0.0 0 0.0 3 8.1 Europe GS 202 2 1.0 11 5.4 23 11.4 52 25.7
P 111 5 4.5 11 9.9 25 22.5 55 49.5 NPO 21 0 0.0 0 0.0 0 0.0 2 9.5 Eastern Mediterranean GS 313 4 1.3 13 4.2 26 8.3 62 19.8
P 121 4 3.3 14 11.6 29 24.0 56 46.3 NPO 15 1 6.7 2 13.3 6 40.0 8 53.3 Western Pacific GS 254 5 2.0 18 7.1 35 13.8 76 29.9
P 1 732 58 3.3 186 10.7 354 20.4 759 43.8 NPO 305 3 1.0 17 5.6 42 13.8 98 32.1 GS 2 406 58 2.4 193 8.0 346 14.4 817 34.0 Total
All 4 443 119 2.7 396 8.9 742 16.7 1 674 37.7
1 Figures are cumulative. For example, the total number of professional staff due to retire on 30 September 2009 (186) includes those scheduled to retire on 30 September 2007 (58).
P – professional, NPO – national professional officer, GS – general service.

EB
120/24 Add.1
27
TABLE 12. DISTRIBUTION OF OCCUPIED PROFESSIONAL AND HIGHER CATEGORY POSTS ACROSS MAIN OCCUPATIONAL GROUPS1
1 Professional, managerial and technical work Posts % Posts % 1.A. Administrative specialists 397 26.8 1.A. Administrative specialists 100.0 1.B. Architects, engineers 22 1.5 1.A. Administrative (general) 21 5.3 1.C. Archivists, curators, information specialists and librarians 14 0.9 1.A.01. Financial management specialists 46 11.6 1.D. Artists 1 0.1 1.A.02. Management and programme analysts 25 6.3 1.E. Economists 25 1.7 1.A.03. Building services administrators 11 2.8 1.F. Education specialists 13 0.9 1.A.04. Meetings services administrators 4 1.0 1.G. Jurists 11 0.7 1.A.05. Computer information systems specialists 49 12.3 1.H. Life scientists 76 5.1 1.A.06. Human resources management specialists 37 9.3 1.A.07. Printing services specialists 1 0.3 1.A.08. Public information specialists 30 7.6 1.A.09. Purchasing and contracting specialists 9 2.3 1.A.10. Representation and protocol specialists 25 6.3 1.A.11. Technical cooperation administrators 51 12.8 1.A.12. Administrative officers 76 19.1 1.A.21. Auditors 8 2.0 1.A.22. Hospital administrators 2 0.5 1.A.23. Records and documents administrators 2 0.5 1.I. Dental, nutrition, medical, nursing and veterinary
specialists
744
50.2 1.I. Dental, nutrition, medical, nursing and
veterinary specialists 100.0
1.J. Physical scientists 5 0.3 1.I. Medical specialists (general) 5 0.7 1.K. Sales and marketing specialists 1 0.1 1.I.01. Dentists 2 0.3 1.L. Social scientists 56 3.8 1.I.02. Dieticians and nutritionists 14 1.9 Posts % 1.M. Statisticians and mathematicians 18 1.2 1.I.03. Medical specialists 681 91.5 1.I.03. Medical specialists 100.0 1.N. Transportation specialists 2 0.1 1.I.04. Nursing specialists 11 1.5 1.I.03 Medical specialists 71 10.4 1.O. Writers, translators, interpreters 59 4.0 1.I.05. Opticians and optometrists 1 0.1 1.I.03.a. Anaesthesiologists 1 0.1 1.P. Professional, managerial and technical specialists for
which no job family exists
7
0.5 1.I.06. I.1.07.
Pharmacists Sanitarians (public health)
9 2
1.2 0.3
1.I.03.b. 1.I.03.d.
Epidemiologists General practitioners
116 2
17.0 0.3
1.R. 1.S.
Environmental specialists Relief specialists
15 14
1.0 0.9
1.I.08. 1.I.09
Veterinarians Rehabilitation specialists
8 1
1.1 0.1
1.I.03.e. Haematologists and blood transfer specialists 4 0.6
1.T. Electronic communications specialists 1 0.1 1.I.10. Health laboratory specialists 10 1.3 1.I.03.f. Neurologists 38 5.6 1.I.03.g. Family health specialists 3 0.4 1.I.03.h. Ophthalmologists 12 1.8 1.I.03.i. Immunologists 17 2.5 1.I.03.k. Noncommunicable disease
specialists 1 0.1
1.I.03.l. Geriatricians 12 1.8 1.I.03.m. Mental health specialists 253 37.2 1.I.03.n. Public health specialists 2 0.3 1.I.03.o. Radiologists 4 0.6 1.I.03.q. Traditional medicine specialists 138 20.3 1.l.03.s. Communicable disease
specialists
7
1.0 1.I.03.t. Occupational health specialists 0 0.0 1 Occupied posts only; refers to the requirements of the job, not the skills of the incumbent. Coding is according to the Common Classification of Occupational Groups, the occupational reference work of the United Nations system.
= =
=

28
EB
120/24 Add.1