human tolerance to acceleration loads generated in high
TRANSCRIPT
Number of words: 5888
Number of references: 16
Number of pages: 29
Number of tables: 2
Number of figures: 9
Number of appendices: 1
Human Tolerance To Acceleration Loads
Generated In High-Performance Helicopters
Barry S. Shender, Ph.D.
Naval Air Warfare Center Aircraft Division
Patuxent River, Maryland, US A, 20670-1906
Correspondence and address reprint requests to: Barry S. Shender, Ph.D., South Engineering
Center / Crew Systems Dept, NAWCAD, BLDG 2187 SUITE 2280, 48110 Shaw Road UNIT
5, Patuxent River, MD, USA, 20670-1906. Tel: 301-342-8881, Fax: 301-342-8876, e-mail:
ShenderB [email protected]
Running Head: Helicopter G-Tolerance
jji-iO QJJAMTI JjJSFBO^B 4 20000609 041

ABSTRACT
Background: The risk to helicopter aircrew of acceleration stress was assessed by investigating
the human physiologic response to transitions from -1 Gz (push) to +4.5 Gz (pull) loads.
Methods: 9 volunteers participated in a study conducted at the Veridian Operations Centrifuge
Facility in Warminster, PA. A one hr mission scenario consisting of nine helicopter maneuvers,
based on in-flight G measurements (push-pull mission, PPM), simulated both current (CM: -0.2
to +3.5 Gz) and projected future platform capabilities (FM: -1 Gz to +4.5 Gz). Additional
scenarios were run in which push transitions were limited to +1 Gz (GM). Measurements
included blood pressure, heart rate (HR), loss of vision, and subjective fatigue. Results: Visual
decrements were minimal during CM while muscular tensing was required to avoid blackout
during FM. Light loss typically occurred during the transition from -Gz to +Gz. Within the
scope of these tests, subjects tolerated the range of Gz-stresses associated with current USN
rotary wing platforms. When subjected to FM G-loads (typical of current USA platforms),
cardiovascular stress significantly increased, Gz tolerance dropped as much as 1.2 G, and HR
increased as much as 67 bpm. Cardiovascular changes were significantly greater during FM PPM
relative to GM. Four subjects reported Almost-Loss of Consciousness symptoms during FM.
Conclusions: While G-stress experienced by aircrew generated by current helicopters does not
appear to present a high risk, G awareness training is recommended to reduce risks to aircrew
exposed to G-loads generated by more aggressive helicopters. Future studies are required to
determine the impact of longer mission times and dehydration.
Keywords: Helicopters, G-tolerance, cardiovascular, A-LOC, flight simulation

INTRODUCTION
Current high-performance helicopters have the capability to generate and sustain
acceleration forces as high as +4 Gz. Some two-seat platforms also have the capability to
generate G-forces below 1 g. For example, the 1994-1995 edition of Jane's All the World's
Aircraft lists the U.S. Navy/U.S. Marine Corps AH-1W Super Cobra (range: +0.5 to +3.5 Gz),
the U.S. Army AH-64D Longbow Apache (range: -0.5 to +3.5 Gz), and the U.S. Army RAH-66
Comanche (range: -1.0 to +3.5 Gz). Table I lists the operational guideline for acceleration limits
(not airframe limits) of several military helicopters.
(TABLE I HERE)
While these G-levels are relatively low when compared to tactical aircraft and helicopters
cannot sustain G-loads for long periods of time (airspeed and rotor RPM bleed off), the nature of
rotary wing missions presents a potential danger. Helicopter missions are often flown at low
altitudes, e.g., 100 ft AGL. At that height, G-induced symptoms which may lead to confusion,
diminished visual field, or reduced situational or spatial awareness can have catastrophic
consequences.
A common problem in helicopter operations is heat stress associated with wearing
protective garments. +Gz-tolerance decreases by 8% when subjects are 1% dehydrated and by
16% when they are 3% dehydrated (1). Allan and Crossley (2) found that relaxed (no anti-G suit
or anti-G straining) G-tolerance was reduced by +0.9 Gz when mean aural temperature increased

by 1.3°C. Under these conditions, even the relatively low +Gz-loads generated in rotary flight
may present a safety hazard.
This hazard may be compounded during maneuvers which include transitions from
< 1 g (push) to > 1 g (pull) loads. During a push, blood shifts towards the head. The carotid
baroreceptors sense this shift and respond by decreasing heart rate (HR). In addition, vasomotor
tone may increase in order to restrict the headward shift (8). This relative bradycardia may delay
the onset of the cardiovascular compensatory response needed to tolerate a subsequent exposure
to a +Gz-load. It is postulated that the potential danger of the "push-pull effect" (PPE) is two-
fold: (1) the transition could lead to G-induced Loss of Consciousness (G-LOC); and (2) the
event may initiate Almost-Loss of Consciousness (A-LOC) symptoms, including confusion,
frustration, and/or uncontrollable muscle tremors without losing consciousness.
This phenomenon is not new. Early flight surgeon manuals warned of the dangers of
following -Gz with +Gz. Aerobatic flight maneuvers, such as the Vertical "8", incorporated
negative-to-positive G and pilots were lost when their aircraft "inexplicably" crashed during air
shows (3). In 1954, Von Beckh (4) found that, during a transition from 0 to +6.5 Gz, subjects
were disoriented, visual blackout lasted longer, and eye-hand coordination deteriorated more
than during solely +Gz exposures. In his 1958 study (5), nine subjects flew in a two seat
Lockheed F-94C (51 missions total) to determine the physiological reactions to +4 to +6.5 Gz
loads both preceded and succeeded by 35 to 45s of weightlessness. Of two subjects who
maintained vision during the control (+5 Gz) run, one blacked out at +4 Gz and the other lost
total vision at +3.5 and experienced G-LOC at +5 Gz. Three who did blackout during control

runs, blacked out at lower +Gz loads and shorter G durations. A 1992 centrifuge study (6),
indicated that a 2s -1 Gz exposure reduced relaxed +Gz-tolerance by +0.77 Gz. An in-flight
study (7) demonstrated that mean systolic BP (SBP) decreased after a transition from -2.5 to +4
Gz.
It is unknown whether the G-loads generated in a helicopter will produce the same effect as
in tactical aircraft. Note that helicopter aircrew are not trained to perform anti-G straining
maneuvers and their garments do not incorporate G-protection. Furthermore, PPE research has
focussed on study of the phenomenon as an isolated event, i.e., expose subjects to different -Gz
and +Gz levels, durations, and G-transition rates as discrete runs, not as part of mission scenario.
The relevant operational issue is not only if an individual push-pull maneuver presents a G-LOC
threat, but whether PPE contributes to decreased cardiovascular response over the course of an
entire mission. The goals of this study were to determine if: (1) PPE presents a physiologic threat
to helicopter aircrew by simulating mission scenarios which include current and projected
helicopter acceleration capabilities; and (2) the physiologic response changed due to the
cumulative effect of Gz exposure during these conditions. The study was conducted at the
Veridian Operations Human Centrifuge Facility in Warminster, Pennsylvania.
METHODS
Subjects
Two women (54.7 ± 0.4 kg body weight, 165.1 + 0.0 cm height, 34.5 ± 3.5 yr., 28.8 ± 0.4
cm eye-heart distance) and seven men (75.0 ± 9.9 kg body weight, 174.2 ± 4.8 cm height, 31.9 ±
4.1 yr., 28.9 ±2.1 cm eye-heart distance) volunteered for this study. (Eye-heart distance was
measured from the level of the aortic valve (third intercostal space) to the ectocanthus (9)).
Subject relaxed G-tolerance (no anti-G suits or anti-G straining) was 4.5 ± 0.7 Gz (females) and
4.2 ± 0.8 Gz (males). Subjects wore summer flight coveralls and no anti-G suit. Subject informed
consent was obtained in accordance with SECNAVINST 3900.38B and all pertinent Department
of Health and Human Services regulations.
Measurements
Subjects wore two sets of electrocardiographic leads (sternal and biaxillary) to monitor HR.
BP was recorded using a Finapres finger cuff device (Ohmeda Model 2300, Louisville, CO).
Estimates of head level BP were obtained by positioning the hand at shoulder level with the arm
supported in a custom designed sling. The distance between the finger cuff and ectocanthus was
recorded before and after each centrifuge insertion.
Subjects verbally reported visual field decrements by monitoring light emitting diodes
(LED's) placed in the centrifuge gondola at 15° increments from a central LED situated directly
in front of the subject. Visual endpoints were defined as 60° loss of peripheral vision (PLL) or
greater than 75% overall loss of vision. Subjects were instructed not to perform anti-G staining
maneuvers since helicopter aircrew are not taught to strain. However, since the natural response
to +Gz-stress is to tighten the muscles, subjects were instructed to tense their muscles and/or
grunt to "clear their lights." Subjects estimated fatigue and nausea levels throughout the insertion
using a modified Borg scale (10).
Acceleration Profiles
Push-Pull Mission (PPM)
During the first 25 min of each 60 min centrifuge insertion, the centrifuge was
programmed to simulate the G-loads and onset/offset rates consistent with current capabilities of
U.S. Navy aircraft (range: -0.2 to +3.5 Gz). This period was referred to as Current Mode (CM).
Following a 5 min rest, the maneuver sequence was repeated with the same onset/offset rates but
with G-loads scaled to represent the capabilities of future, more aggressive, platforms (range: -
1.0 to +4.5 Gz). This phase was called Future Mode (FM). To minimize the effects of motion
sickness during centrifuge push-pull transitions, the gondola was tilted back providing a constant
+1.5 Gx bias, a technique used successfully in previous push-pull studies (11). The acceleration
profiles were based on recordings of maneuvers taken from Apache, Black Hawk, and BK-117
aircraft. All maneuvers began from a base plateau of+1 Gz and are shown in figures 1 through 4.
(FIG. 1 AND 2 HERE)
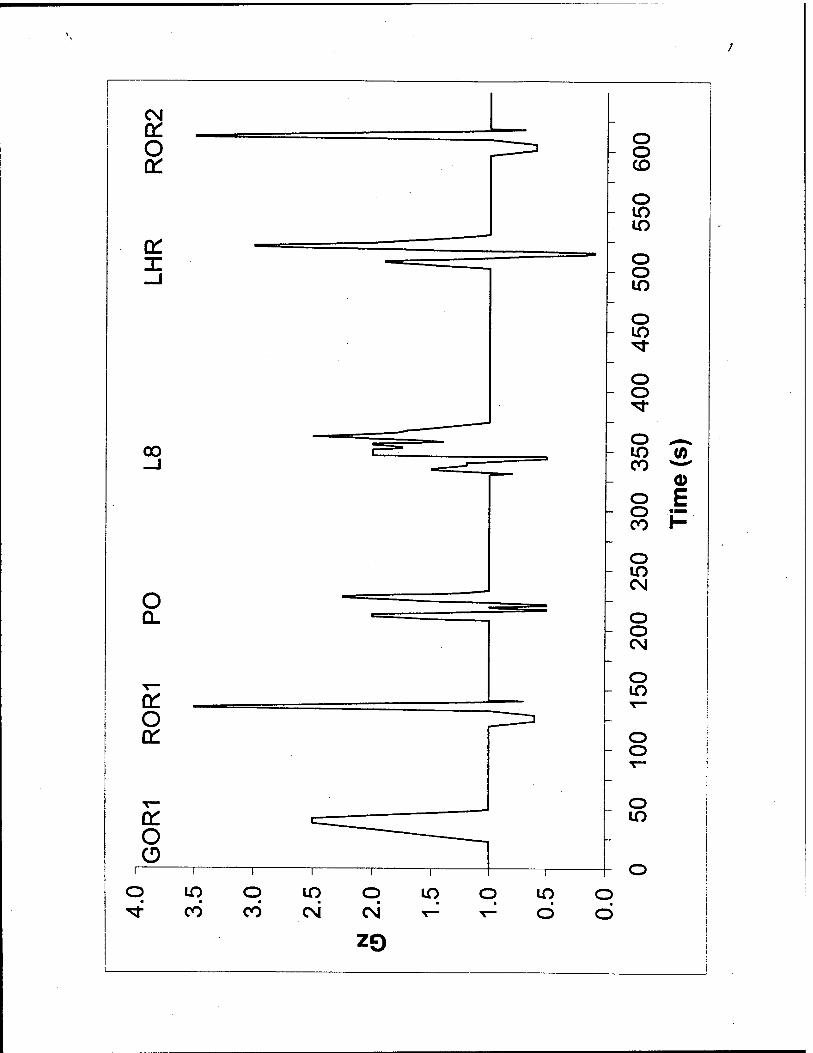
Gradual Onset Run (GOR) (Fig. 1) is a purely +Gz maneuver based on an Apache profile,
featuring a 0.1 g/s onset rate to a +2.5 Gz (FM: +4.5 Gz, Fig. 2) 5s plateau with a 0.2 g/s offset
rate. Subjects were exposed to GOR at the beginning and end of both CM and FM. (Overall
duration: CM: 34s, FM: 63s.)

Rapid Onset Run (ROR) (Fig. 1) is a push-pull maneuver based on an Apache profile. ROR
begins with a push at 0.1 g/s to a +0.6 Gz 6s plateau, followed by a 1.0 g/s rise to +1.0 Gz. Then
there is a pull at 1.25 g/s to a +3.5 Gz (FM: +4.5 Gz, Fig. 2) 2s plateau followed by a 0.56 g/sec
offset rate. There were three repetitions of ROR during each mode sequence (Overall duration:
CM and FM: 30s.)
Pushover (PO) (Fig. 1) is based on a pull-push-pull-push-pull BK-117 profile. During CM, the
sequence has two pushes to +0.5 Gz and a peak pull to +2.25 Gz. In the FM (Fig. 2), the pushes
reached -1 Gz and the maximum pull was +3.5 Gz. (Overall duration: CM: 28s, FM: 39s.)
"Modified" Lazy Eight (L8) (Fig. 1) is based on a BK-117 profile including a brief push, pull,
longer push, followed by a pull with 21s (42s FM, Fig. 2) of varying +Gz levels. The second
push reached +0.5 Gz (FM: -1 Gz) with a peak pull of+2.5 Gz (FM: +4.5 Gz). (Overall duration:
CM: 50s, FM: 68s.)
Low/High Rapid Maneuver (LHR) (Fig. 1) is a pull-push-pull Black Hawk maneuver. The
sequence is a 0.18 g/s rise to +1.9 Gz (FM: +3.0 Gz, Fig. 2), 0.34 g/s push to +0.1 Gz (FM: -1.0
Gz), and a 0.62 g/s pull to +3.0 Gz pull (FM: +4.5 Gz). (Overall duration: CM: 35s, FM: 61s.)
{FIG. 3 AND 4 HERE)
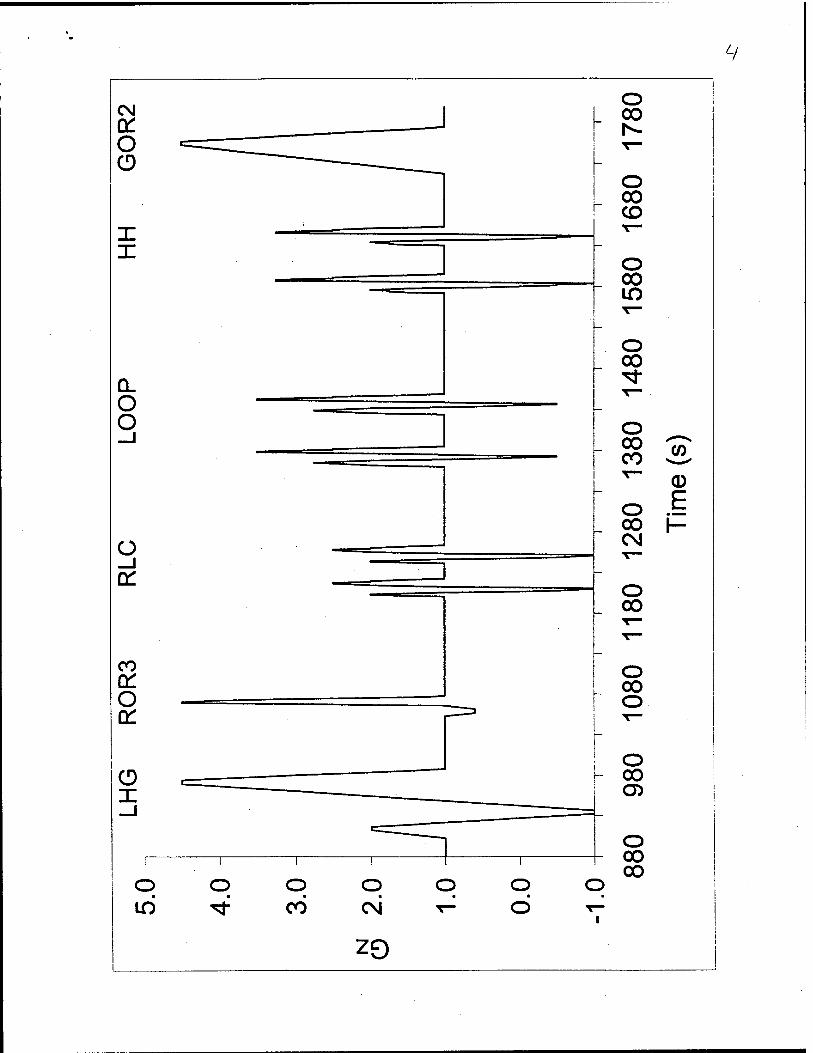
Low/High Gradual Maneuver (LHG) (Fig. 3) is an Apache pull-push-pull maneuver. This
sequence starts with a 0.1 g/s pull to +1.4 Gz (FM: +2.0 Gz, Fig. 4), 0.19 g/s push to +0.26 Gz
(FM: -1.0 Gz), second pull at 0.17 g/s to +2.81 Gz (FM: +4.5 Gz), then returning to base plateau
at 0.25 g/sec. (Overall duration: CM: 52s, FM: 93s.)
Rideeline Crossing (RLC) (Fig. 3) is a pull-push-pull BK-117 sequence derived from low-level
terrain following maneuvers. The minimum plateaus were -0.2 Gz (FM: -1.0 Gz, Fig. 4) and
peak loads were +1.75 Gz (FM: +2.5 Gz). Since RLC was a relatively short profile, it was
repeated twice with an 18s rest at +1 Gz between repetitions. (Overall duration: CM: 48s, FM:
66s.)
Loop (Fig. 3), also based on a BK-117 profile, is very similar to RLC. The push phases reach
+0.5 Gz (FM: -0.5 Gz, Fig. 4) while the peak pull is +2.5 Gz (FM: +3.5 Gz). Loop was also
repeated twice with 32s at +1 Gz between repetitions. (Overall duration: CM: 80s, FM: 92s.)
Hammerhead (HH) (Fig. 3), was the last of the BK-117 pull-push-pull maneuvers. It has a
variety of intermediate steps, but has a peak pull of+2.25 Gz (FM: +3.25 Gz, Fig. 4) and a push
of +0.25 Gz (FM: -1.0 Gz). HH was repeated twice with 32s at +1 Gz between maneuvers.
(Overall duration: CM: 80s, FM: 84s.)
. For both CM and FM, the sequence of maneuvers during an insertion was GOR1, ROR1,
PO, L8, LHR, ROR2, LHG, ROR3, two RLC's, two Loops, two HH's, and GOR2. The GOR
and ROR maneuvers were repeated to determine if the physiological response to these profiles
changed over time, thereby providing an index of the effects of cumulative G-stress.

10
+Gz MISSION (GM)
During GM, subjects experienced the same mission scenario outlined in PPM except that
all push transitions were fixed at +1.0 Gz for both CM and FM. The +Gx bias, timing, and
onset/offset rate transitions were identical. As an example, Fig. 5 shows the CM GM. Overall,
subjects were randomly exposed to two PPM and two GM insertions during one week.
Data Analysis
Light loss estimates were averaged for each mission type and differences determined using
repeated measures ANOVA (a = 0.05) (using subject as a random variable and light loss,
mission (PPM or GM), and maneuver as fixed variables) and source of those differences
assessed with a post-hoc Fisher's Least Squares Difference (LSD) Multiple-Comparison test
(Number Cruncher Statistical Systems 97, JL Hintze, Kaysville, Utah). (A student's t-test
indicated no gender differences.) Mean scores for fatigue and nausea were calculated for each
subject for each mission and mode and compared using Wilcoxon Signed-Rank Test for
Difference in Medians.
Given the within and between subjects variability in HR and BP during a given maneuver
(with each data point occurring anywhere from 0.36 to 0.82s), the data were first aligned with the
acceleration profiles. For example, each maneuver was segmented into a series of fiducial points,
such as the beginning of a push transition, the start and end of a plateau, etc. Then, BP data for
each subject were organized relative to those points in order to compare the responses for a given

11
maneuver and mission. In cases where HR was faster (i.e. more BP samples) between a given
pair of points during one mission than another (e.g., ROR PPM pull phase versus GM), pairs of
consecutive BP values were averaged (thereby equalizing the number of BP points for a given
epoch). In this fashion, BP responses at the same G level and time during a given maneuver
could be compared. To normalize the data, the change in SBP (ASBP) for each maneuver was
determined relative to a 10s average calculated during the rest phase immediately prior to that
maneuver. Repeated measures ANOVA (followed Fisher's LSD post-hoc test) was used to
determine if there were significant differences in ASBP based on mission (PPM versus GM),
mode (CM versus FM), and in the case of ROR and GOR, on succeeding repetitions of the same
profiles. To process the ANOVA, a factor was used to segment each portion of the maneuver, in
order to distinguish responses based on different G transitions (push or pull) within a given
maneuver. For example, CM ROR was segmented into 24 points based on the push phase
(3 points during the transition from +1 to +0.6 Gz, 4 points during the +0.6 Gz plateau, and
3 points during the return to +1 Gz), the pull phase (4 points during the rise to the +3.5 Gz
plateau and at its peak), the offset to +1 Gz (6 points), and during 10s of recovery (4 points at +1
Gz). In this manner, responses to G-stress were tested for differences in ASBP approximately
every second. HR analysis was performed in the same fashion as the BP data.
RESULTS
Subjective Measures (Light Loss, Fatigue, Nausea)

12
Virtually no light loss occurred during CM for GM and PPM, except during the ROR's.
PLL during ROR3 ranged from 30° to 10% to 40% overall gray. Subjects reported that light loss
occurred during the push to pull transition. No subjects required muscle tensing during these runs
to maintain vision.
Since there were no significant differences in PLL between the two PPM insertions or
between the two GM, mean reported light loss was analyzed (Table II). Overall, light loss was
significantly greater during PPM than GM (F = 5.94, p = 0.041). There was also an interaction
between type of mission and maneuver (F = 3.51, p - 0.002). To clarify the source of these
differences, additional ANOVA focussing on the individual maneuvers. Light loss was
significantly greater during the PPM PO and L8 as compared to the GM (F = 12.66, p = 0.007
and F = 8.89, p = 0.018, respectively), whereas light loss differences during GORs (relative to
mission mode or over time) or for LHR and LHG were not significant. While mean light loss
increased during each succeeding PPM ROR, the increases were not statistically significant.
(TABLE II HERE)
Subjects required some level of straining to maintain their vision during FM GOR, ROR,
LHR, and LHG maneuvers. The amount of effort varied between individuals, with the ROR,
LHR, and LHG maneuvers requiring the most. The two female subjects often used an effective
breathing technique similar to a Lamaze pattern, i.e., short exhaled puffs.

13
There were no significant differences in subjective fatigue or nausea ratings between the
two PPM insertions or between the two GM trials. While it was shown that subjective fatigue
and nausea ratings were statistically greater during FM versus CM (PPM: Z value = 3.86, p <
0.001; GM: Z value = 6.08, p < 0.001), as well as fatigue during CM PPM versus GM (Z value =
4.39, p < 0.001), the absolute rating values indicated that mean fatigue and nausea levels were
just "noticeable".
Cardiovascular System Response
Since there was minimal PLL during RLC, Loop, and HH, cardiovascular data analysis
excluded these maneuvers.
Current Mode ROR
The drop in ASBP during the pull phase of CM ROR increased with each succeeding
repetition of the ROR. Mean peak ASBP during PPM were -8.1 (ROR1), -11.0 (ROR2), and -
12.8 mmHg (ROR3) and -3.9 (ROR1), -6.6 (ROR2), and -7.8 mmHg (ROR3) during GM. ASBP
dropped faster over time from -2.4 to -4.4 mmHg/s (PPM) and -1.3 to -2.1 mmHg/s (GM)
between ROR1 to ROR3. There was a statistically significant difference in ASBP between PPM
and GM (F = 2.58, p < 0.001) and overall between ROR1 when compared to ROR2 and ROR3
(F = 22.82, p< 0.001).

14
Mean CM R0R1 AHR was slightly greater than ROR2 and ROR3 for both PPM and GM
(F = 3.54, p = 0.029). Subject pool mean maximum rise in AHR during PPM was 22.0 (ROR1),
20.1 (ROR2), and 19.8 bpm (ROR3) and 17.4 (ROR1), 18.7 (ROR2), and 16.5 bpm (ROR3)
during GM. While the decrease in AHR during the push phase was greater during PPM relative
to GM (F = 1.78, p = 0.013), the magnitude was quite small (mean AHR: PPM: -2.9 ± 2.0 bpm;
GM: -0.7 ±1.7 bpm). The overall change in HR between push minimums and pull maximums
during PPM were 29.3 (ROR1), 35.3 (ROR3), 31.1 bpm (ROR3) and for GM were 31.7 (ROR1),
28.6 (ROR2), 26.5 bpm (ROR3).
Future Mode ROR
Unlike the CM ROR, ASBP during the pull phase of FM ROR1 was greater than ROR2 and
ROR3. Mean peak changes during PPM were -26.2 (ROR1), -21.5 (ROR2), and -22.9 mmHg
(ROR3) and -19.5 (ROR1), -23.8 (ROR2), and -19.7 mmHg (ROR3) during GM. PPM ASBP
changed faster than GM, from -5.3 to -4.8 mmHg/s (PPM) and -3.5 to -4.4 mmHg/s (GM)
between ROR1 to ROR3. There was a significant difference in ASBP between PPM and GM (F
= 3.43, p < 0.001) during the pull phase and over time during ROR1 relative to ROR2 and ROR3
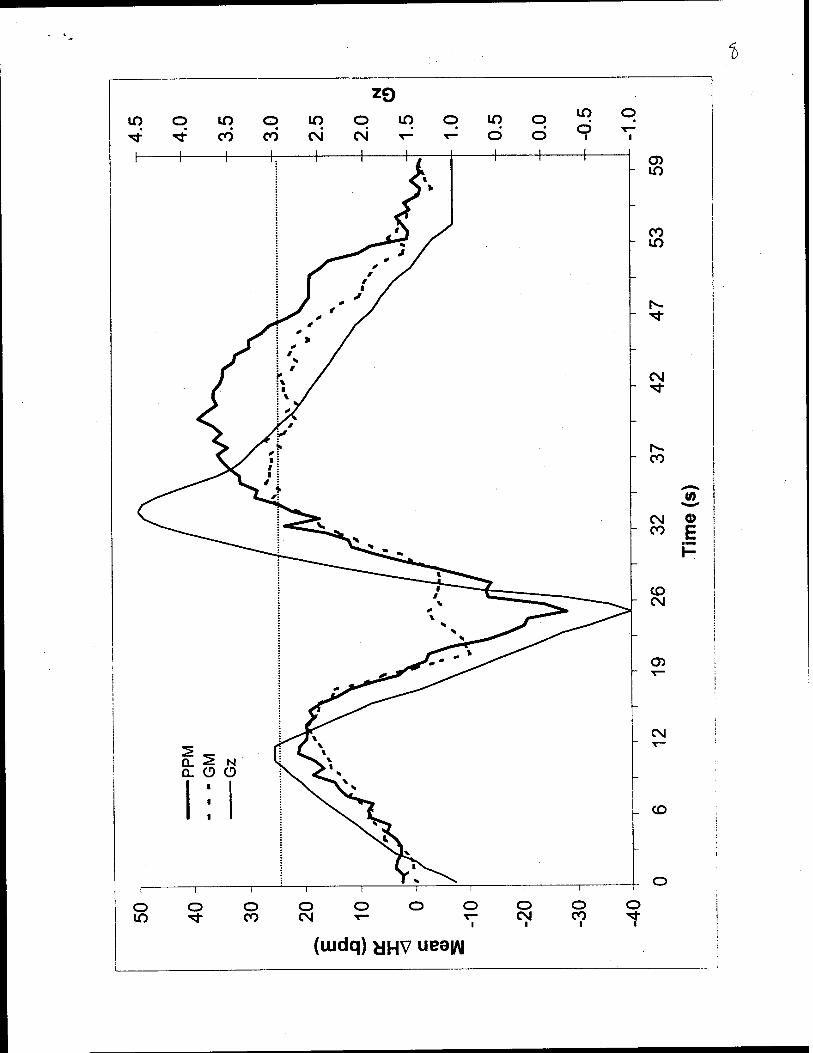
(F = 6.39, p = 0.002). Fig. 6 shows the difference between PPM and GM ROR1. The horizontal
dotted line indicates -22 mmHg which, according to the hydrostatic column theory of G
tolerance, corresponds to a 1 g drop in +Gz tolerance (12).
The overall increase in AHR was slightly less during ROR1 as compared to ROR2 and
ROR3 for both PPM and GM (F = 6.42, p = 0.002). Mean maximum HR increase during PPM

15
was 32.2 (R0R1), 35.4 (ROR2), and 34.9 bpm (ROR3) and 28.1 (ROR1), 32.4 (ROR2), and
28.3 bpm (ROR3) during GM. While the decrease in PPM push AHR was greater than GM (F =
2.01, p = 0.001), the magnitude was quite small (mean AHR: PPM: -3.1 ± 2.9 bpm; GM: 0.5 ±
1.8 bpm). Fig. 7 details the differences between PPM and GM ROR3. Increases in AHR above
25 bpm are indicated by the horizontal line.
Current Mode GOR
A GOR at the beginning and end of each mode segment was included to determine if (1)
the cardiovascular response to the second GOR after the intervening 10 profiles differed from the
first (presumably from fatigue) and (2) that response was different if the 10 profiles were PPM or
GM maneuvers. For both CM missions, while the decline in ASBP was greater during GOR2,
the drop was significant only during GM (F = 5.91, p = 0.015). However, the reduction in ASBP
were small (4.4 mmHg (PPM); 5.6 mmHg (GM)). Interestingly, SBP rose faster during the rise
to peak +Gz during GOR2 than GOR1 during both PPM (0.18 Vs. 0.10 mmHg/s (65%)) and GM
(0.29 Vs. 0.23 mmHg/s, (31%)). There were no statistical differences demonstrated when
comparing PPM Vs. GM ASBP or AHR. Peak AHR were 10.9 (PPM) and 12.4 bpm (GM).
Future Mode GOR
ASBP dropped further during GOR2 as compared to GOR1 for both PPM and GM (F =
112.72, p < 0.001). Furthermore, the decrease in ASBP during GM GOR2 was greater than
during PPM (F = 18.04, p < 0.001). The peak decrease in ASBP during GM was -12.2 (GOR1)

16
and -16.0 mmHg (GOR2) while during PPM it was -10.9 (GOR1) and -14.1 mmHg (GOR2).
The increase in AHR was greater during GOR2 Vs. GOR1 during both PPM and GM (F = 5.45,
p = 0.020), particularly during the +Gz peak, offset and recovery phases of the maneuver. Peak
AHR ranged from 26.7 (GOR1) to 37.7 bpm (GOR2) for PPM and 36.3 (GOR1) to 40.1 bpm
(GOR2) during GM. HR recovery rate decreased over time from -1.12 (GOR1) to -0.86 bpm/s
(GOR2) during PPM (24%) and -1.84 (GOR1) to -1.19 bpm/s (GOR2) during GM (35%).
Overall, AHR during GM was statistically greater than during PPM (F = 27.05, p < 0.001),
although the mean difference was only 2.6 ± 0.4 bpm.
Low/High Rapid Maneuvers
In the low/high maneuvers, the effect of transition rate during pull-push-pull maneuvers
were assessed. During the first pull SBP falls (HR rises), with the push SBP rapidly rises (HR
falls), and with the second pull SBP falls (HR accelerates), only to rise again with the offset from
the second peak. Overall, there were no significant differences based on type of CM mission for
LHR ASBP or AHR. For example, the peak decrease in ASBP was 7.3 mmHg for both PPM and
GM. Maximum and minimum AHR were similar for PPM and GM (PPM: +11.9 and -13.9 bpm;
GM: +9.3 and -13.5 bpm).
The peak decrease in FM ASBP was comparable (p > 0.05) between both missions (PPM: -
18.3 mmHg; GM: -21.4 mmHg), though the hyperemic response during recovery of SBP was
greater during PPM (10.4 mmHg) than GM (4.4 mmHg). However, the decrease in PPM AHR
during the push phase and the increase during the subsequent pull were significantly different

17
than GM (F = 3.12, p < 0.001). Minimum AHR during the push was -28.2 (PPM) and -10.3 bpm
(GM) and maximum AHR during the subsequent pull was +39.0 bpm (PPM) and +26.8 bpm
(GM). During the push phase, whereas GM AHR fell at -2.9 bpm/s then remained close to pre-
run levels (-3.7 ± 5.2 bpm) while at +1 Gz, PPM AHR dropped at -4.1 bpm/s, reaching a
minimum at -1 Gz (averaging -12.2 ± 10.1 bpm while under +1 Gz). Fig. 8 details the
differences between PPM and GM. Increases in AHR greater than 25 bpm are indicated above
the horizontal line.
Low/High Gradual Maneuvers
With slower G transition rates, LHG ASBP followed with same pattern as during the LHR.
The maximum decline in CM ASBP was similar (p > 0.05) for both missions (PPM: -8.8 mmHg;
GM: -9.8 mmHg). Maximum (during the second pull) and minimum (during the push phase) CM
AHR were comparable (p > 0.05) for PPM and GM (PPM: +16.1 and -14.8 bpm; GM: +14.9 and
-9.6 bpm). Throughout the push phase, the mean PPM AHR was -8.1 ± 5.4 bpm and -3.4 ± 3.6
bpm for GM.
While the overall decline in FM ASBP was greater during PPM, there were no statistical
differences between PPM and GM ASBP. The maximum decline in ASBP was similar for both
missions (PPM: -15.3 mmHg; GM: -14.7 mmHg). However, the decrease in PPM AHR during
the push phase was significantly greater than GM (F = 4.11, p < 0.001), reaching a minimum of
-25.8 bpm (PPM) and -10.0 bpm (GM). Note that PPM and GM AHR fell at the same rate (-2.1

18
bpm/s). Maximum AHR during the subsequent pull were comparable (PPM: +40.4 bpm; GM:
+39.3 bpm).
Pushover Maneuver
As with the other pull-push-pull type maneuvers, ASBP followed the general changes in
Gz-stress during the Pushover, with a slightly greater overall decline in ASBP during PPM.
There was no apparent effect of the modest pull between the two pushes in mean CM ASBP. No
statistical differences between PPM and GM ASBP or AHR were found. The maximum decline
in ASBP was slight for both missions (PPM: 4.2 mmHg; GM: 2.8 mmHg). Minimum AHR were
attained during the second push (PPM: -10.8 bpm; GM: -11.2 bpm) and peak AHR occurred
during the final pull (PPM: 10.6 bpm; GM: 7.8 bpm).
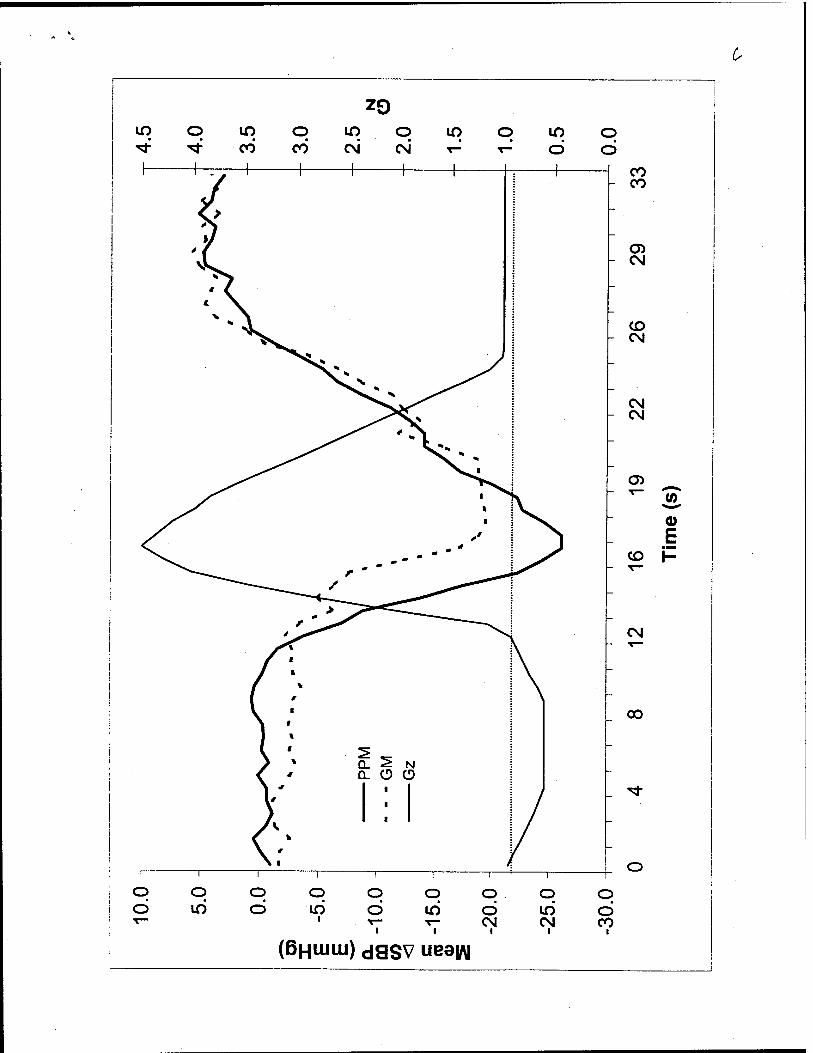
The drop in ASBP during FM PO was greater during PPM than GM (F = 1.62, p = 0.023).
These differences were attributed to responses during the transition between the push and second
pull phases of the maneuver and during recovery after the peak of the second push, as shown in
Fig. 9. The maximum decline in ASBP was -17.0 mmHg (PPM) and -15.9 mmHg (GM). ASBP
fell faster during PPM between the push and the second pull (0.99 mmHg/s) and took longer to
recover after the second pull (1.66 mmHg/s) than GM (0.83 mmHg/s and 2.07 mmHg/s,
respectively). Also during the push phases, the decrease in FM PPM AHR (-19.6 ± 2.9 bpm) was
significantly greater (F = 4.28, p < 0.001) than GM (-8.4 ±2.8 bpm). During the final pull, PPM
AHR reached 21.4 bpm at 4.1 bpm/s while GM AHR peaked at 17.9 bpm at 2.6 bpm/s.
19
Modified Lazy 8 Maneuver
The L8 maneuver featured a low +Gz pull, followed by a push and an extended higher +Gz
exposure. No statistical differences between CM PPM and GM ASBP or AHR were
demonstrated. Minimum (PPM: -4.9 mmHg; GM: -3.6 mmHg) and maximum (PPM:
0.94 mmHg; GM: 2.49 mmHg) ASBP were comparable. AHR range was slightly greater during
PPM (-11.5 < AHR < 8.7 bpm) than GM (-8.7 < AHR < 9.0 bpm).
During FM L8, the overall drop in ASBP was slightly greater during PPM (-14.9 mmHg)
than GM (-13.1 mmHg). There was a marginal difference between missions (p = 0.52), primarily
due to the rate of change in ASBP following the push phase (PPM: 2.20 mmHg/s; GM: 1.53
mmHg/s) and the subsequent rise in ASBP during the extended +Gz phase (PPM: 0.87 mmHg/s;
GM: 0.74 mmHg/s). FM AHR was significantly different between PPM and GM (F = 3.28, p <
0.001). This was based on the AHR during the push (PPM: -17.8 ± 6.1 bpm; GM: -3.1 ± 0.7
bpm) and AHR during the second of the +3.5 Gz plateaus after the push (PPM: 29.9 ± 2.1 bpm;
GM: 20.9 ±1.3 bpm).
Almost-Loss Of Consciousness (A-LOC)
There were four instances in which subjects reported A-LOC symptoms. During his second
PPM insert, one subject reported that he had a "harder time concentrating today." It was "harder
to remember the profile details after about 15 min into the insertion." It "was frustrating."
Another male subject reported that he "did not feel clearheaded" during his second PPM insert.

20
A third subject, during his first GM exposure with the FM Loop maneuver, stated that he had a
"warm feeling" accompanied by a "don't care attitude" which "came on suddenly." He reported
that he was "not paying attention." The feeling passed by the end of the insert. The final incident
occurred to a fourth subject during his first GM exposure to the FM ROR3 maneuver. He
reported being confused and "started to reach for the (stop the run) switch, but was unsure why"
he wanted to.
DISCUSSION
For an average male, mean SBP at heart level is 120 mmHg at 1 g. The heart must
overcome an approximately 30 cm column (22 mmHg hydrostatic pressure) for blood to reach
the head. For each 1 g increase in applied +Gz stress, head level pressure drops another 22
mmHg (12). Light loss symptoms appear at approximately 50 mmHg head-level BP (13).
Stauffer found that the onset of visual symptoms of 215 relaxed male subjects occurred at +3.7
Gz (14). In a study using tilt table exposures, Schellong defined the onset of orthostatic
hypotension as a ASBP of 21 mmHg (15). Therefore, given the acceleration levels employed in
this study, a decrease in ASBP measured at shoulder height of approximately 20 mmHg,
equivalent to about a 1 g loss in G-tolerance, is considered a significant.
In a study examining the HR response of 30 male pilots to GOR exposures (the standard
+Gz training profile used to maximally challenge the cardiovascular system), the threshold for
significant HR change was 25 bpm (16). Therefore, this benchmark was used to gauge
operationally significant changes in HR.

21
The methodology presented in this report represents the first systematic attempt to study
the cardiovascular response to PPE utilizing Gz-loads and transitions based on actual flight
maneuvers. ASBP and AHR observed were consistent with tactical in-flight measurements
reported by Prior (7). An analysis approach which identifies the cardiovascular response to
particular G transitions within a given maneuver also represents anew approach.
CM: Subjects experienced little light loss and did not need to strain to finish their CM runs.
Note that when light loss was reported, it typically occurred during the transition from push to
pull. However, modest decrements in visual field may become more significant when aircrew
wear helmet mounted displays. For individuals who experience an overall graying or decrease in
acuity rather than classic PLL, it is possible that viewing certain symbology, colors, or intensities
may be impaired.
Only during the ROR were there statistically significant differences in ASBP between PPM
and GM. Peak ASBP for all maneuvers were well below 20 rnmHg, reaching a maximum
decrease of 12.8 rnmHg during ROR3. It appeared that the cardiovascular system was
progressively taxed during the 25 min CM mission based on the significant reduction in ROR
ASBP over time.
Likewise, only the differences in AHR between ROR CM PPM and GM were statistically
significant. The maneuvers in which overall change in HR between push and pull phases were
physiologically significant were the ROR (PPM: 35.3 bpm; GM: 31.7 bpm) and the low/high
22
maneuvers (LHR: PPM = 25.8 bpm, GM = 22.8 bpm; LHG: PPM = 30.9 bpm, GM = 25.5 bpm).
The cardiovascular system did respond to the applied stress by increasing AHR more quickly
during PPM as compared to GM mission.
Given the relatively small change in SBP and minimal light loss, the cardiovascular
response to the relatively low CM Gz-loads, as indicated by AHR, is probably sufficient to
enable aircrew to tolerate these exposures. This would apply for relatively short missions for
aircrew who are sufficiently hydrated. However, given that differences in cardiovascular
response between PPM and GM were demonstrated and the apparent effect of time in the level of
response, it is possible that aircrew on longer missions may be at risk. Specific data would have
to be collected for longer exposures and include determining the effects of dehydration and the
impact of increased thermal burden associated with wearing impermeable protective garments.
FM: Loss of vision was considerably greater during the FM mission as compared to the
CM. Light loss during PPM was greater than GM and subjects needed to exert a marginally
greater level of muscular tensing to keep their vision clear, as well. Light loss was greatest
during the transition from push to pull, particularly during maneuvers featuring a 5.5 Gz
transition, such as the ROR and Low/High runs.
The decrease in SBP was significantly greater during PPM ROR and PO maneuvers when
compared to GM. These differences occurred during the relatively large magnitude +Gz pull
following the push phase in both maneuvers. Furthermore, as the time at G increased, the drop in
ASBP is also significantly greater, as was demonstrated by comparing GOR2 with GOR1 and

23
R0R2 and R0R3 with R0R1. During the ROR, peak declines in ASBP were above 20 mmHg
for both PPM and GM, indicating that G-tolerance declined by approximately 1 g. Overall, peak
drop in ASBP during maneuvers other than GOR ranged from -13.1 to -21.4 mmHg, a drop in G-
tolerance from about 0.6 to 1 g. The influence of G-transition rate was demonstrated by the
observation that the decline in ASBP during LHR was greater than during LHG. This is probably
because the slower rise during LHG allowed time to invoke a greater cardiovascular
compensatory response than during the LHR.
During the FM runs, PPM AHR was statistically greater than during GM, for ROR, LHR,
LHG, PO, and L8 maneuvers. AHR increased as time at G increased for both ROR and GOR
runs. The peak overall AHR were physiologically significant, as follows: LHR: 67.2 bpm (PPM),
37.0 bpm (GM); LHG: 66.4 bpm (PPM), 49.3 bpm (GM); PO: 44.0 bpm (PPM), 36.0 bpm
(GM); ROR: 46.5, 50.3, 52.6 bpm (PPM runs 1, 2, 3, respectively) and 49.9, 44.4, 50.1 bpm
(GM runs 1, 2, 3, respectively); and GOR: 38.7, 43.1 bpm (PPM runs 1, 2, respectively), and
45.9, 42.2 bpm (GM runs 1, 2, respectively).
Given the physiologic responses to the stresses developed during FM exposures (relatively
large decrease in SBP, significant increase in HR, loss of peripheral vision, incidences of
possible A-LOC symptoms, and the increased need for muscular tension), aircrew exposed to
Gz-loads developed by more aggressive platforms are at a greater risk than when flying
conventional helicopters. Furthermore, exposures to push-pull maneuvers may have a somewhat
greater risk than exposures to purely +Gz loads. Subjects noted that they felt a greater fatigue
after PPM as compared to GM. In some instances, subjects' PLL reached 90°. However, given

24
that all runs were completed without the need for performing anti-G straining maneuvers or with
the support afforded by anti-G suits, indicates that these types of exposures are tolerable within
the parameters set by this experiment. That is, an overall 60 min limit and exposure to the higher
loads during the last half hour by subjects who were presumably euhydrated.
The findings of this study have important implications in the fixed wing tactical community
as well. The significant changes in cardiovascular response, loss of visual field, and incidence of
A-LOC episodes at these relatively low G levels could be expected to increase during tactical
missions during which pulls may reach +7.5 to 9 Gz. In particular, the areas of helmet mounted
displays, aircrew protection, and tactics may benefit from these data.
CONCLUSIONS
Within the scope of these tests, subjects had little difficulty tolerating the range of
acceleration stresses associated with helicopters currently employed in the U.S. Navy inventory.
As helicopter performance increases in the range of-1 Gz to +4.5 Gz (within the capabilities of
current U.S. Army platforms), the associated cardiovascular stress significantly increases while
the ability to tolerate the G-loads decreases. Aircrew may be at increased risk during longer high
performance helicopter missions if aircrew are not given adequate training for this environment.
It is important to note that even at these relatively low acceleration loads and transition rates,
four separate instances of A-LOC occurred, two during PPM and two during GM. In each case,
subjects reported deficits in the ability to concentrate. As such, the potential for performance
degradation during rotary wing flight due to unprotected exposures to Gz-stress exists.

25
Based on the findings in this study, it seems prudent to recommend establishing a training
program for helicopter aircrew about the potential hazards of acceleration loads (including PPE),
such as the loss of vision, the need for muscular tensing/straining or breathing patterns to restore
vision, and the potential for A-LOC.
Future studies should investigate (1) the effects on physiological responses and cognitive
and psychomotor performance of cumulative G-stress during longer simulated missions based on
operational needs and (2) the effects of dehydration on ability to tolerate helicopter Gz-stress,
including the use of operational flight gear, and life support equipment, e.g. anti-exposure
garments, CBR protection, and body armor.
REFERENCES
1. Taliaferro EH, Wempen RR, White WJ. The Effects of Minimal Dehydration Upon Human
Tolerance to Positive Acceleration. Aerospace Med. 1965; 36:922-6.
2. Allan JR, Crossley RJ. Effect of Controlled Elevation of Body Temperature on Human
Tolerance to +Gz Acceleration. J. Appl. Physiol. 1972; 33:418-20.
3. Mohler SR. G Effects on the Pilot during Aerobatics. Washington DC:Federal Aviation
Administration; 1972. Report No.: FAA-AM-72-28: 1-19.

26
4. Von Beckh HJ. Experiments with Animals and Human Subjects Under Sub- and Zero-
Gravity Conditions during the Dive and Parabolic Flight. Aviation Med. 1954; 25:235-241.
5. Von Beckh HJ. Human Reactions during Flight to Acceleration Preceded by or Followed by
Weightlessness. Aerospace Med. 1959; 30:391-409.
6. Lehr A-K, Prior ARJ, Langewouters G, Ullrich B, Leipner H, Zollner S, Linder P, Pongratz
H, Dieterich HA, Theisen K. Previous Exposure to Negative Gz Reduces Relaxed +Gz
Tolerance. Aviat. Space Environ. Med. 1992; 63:405.
7. Prior ARJ, Adcock TR, McCarthy GW. In-flight Arterial Blood Pressure Changes during -Gz
to +Gz Maneuvering. Aviat. Space Environ. Med. 1993; 64:428.
8. Self DA, Hainsworth R, Krock LP, Christopher PAD, Latham RD. An Acute Animal Model
that Simulates the Hemodynamic Situations Present during +Gz Acceleration. Aviat. Space
Environ. Med. 1994; 65(5, Suppl.):A80-9.
9. Nelson JG. Hydrostatic Theory and G Protection Using Tilting Aircrew Seats. Aviat. Space
Environ. Med. 1987; 58:169-73.
10. Angel SM, Marley RJ, Stadtlander L. Perceived Exertion Scales: Toward Development of
Improved Verbal Anchors. Proceedings of 38th Annual Meeting Human Factors &
Ergonomics Soc; 1994 Oct 24-28; Nashville, TN.; 1994:626-30.

27
11. Wright H, Buick F. The +Gz-Tolerance Limits of the Push-Pull Phenomenon. Proceedings of
69th Annual Scientific Meeting of the Aerospace Medical Association; 1998 May 17-21;
Seattle, WA; p. 56.
12. Shender BS. Application of Rheoencephalography to Study Physiological Responses Under
Acceleration Stress. WarminsterrNaval Air Development Center; 1 Sep 1991. Report NADC-
91127-60.
13. Wood EH, Lambert EH. Objective Documentation and Monitoring of Human Gz Tolerance
When Unprotected and When Protected by Anti-G Suits or M-l Type Straining Maneuvers
Alone or in Combination. SAFE Journal. 1989; 19:39-48.
14. Stauffer FR. Acceleration Problems of Naval Air Training: I, Normal Variations in Tolerance
to Positive Radial Acceleration. Pensacola:USN School of Aviation Medicine; 20 Mar 1952
Report NM 001 059.02.09.
15. Schellong F. Regulationsprumng des Kreislaufes Darmstadt. Steinkopf; 1954.
16. Forster EM. Heart Rate Response of Aircrew during Recovery from Gradual Onset Rate +Gz
Exposures. Aviat. Space Environ. Med. 1994; 65:55-9.

28
APPENDIX
Key to acronyms used:
A-LOC: Almost-Loss of Consciousness
CM: Current Mode (simulation including exposures between -0.2 to +3.5 Gz)
FM: Future Mode (simulation including exposures between -1.0 to +4.5 Gz)
G-LOC: G-induced Loss of Consciousness
GM: +Gz Mission (simulation with push transitions = +1 Gz)
GOR: Gradual Onset Run
HH: Hammerhead Maneuver
HR: Heart Rate
L8: "Modified" Lazy Eight Maneuver
LHG: Low/High Gradual Maneuver
LHR: Low/High Rapid Maneuver
PPM: Push-Pull Mission (simulation including transitions < +1 Gz)
PLL: Loss of Peripheral Vision
PPE: Push-Pull Effect
PO: Pushover Maneuver
RLC: Ridgeline Crossing Maneuver
ROR: Rapid Onset Run
SBP: Mean Systolic Blood Pressure

29
ACKNOWLEDGMENTS
The author would like to thank LTC(P) John S. Crowley for his comments and for providing the
helicopter acceleration profiles; James B. Sheehy, Ph.D. and Estrella M. Forster, Ph.D. for their
sponsorship, encouragement and support; Mr. Dennis Kiefer, Mr. Leland Donnen, Mr. Dave
Bishoff, and Mr. L. Doug Waldman of Veridian Operations for their help with centrifuge
operations; and CDR David McGowan for providing the medical monitoring during this project.
We are also grateful to the volunteer test subjects for their invaluable assistance without which
this project would have been impossible. The opinion expressed in this article are the author's
and do not necessarily represent those of the U.S. Navy or the Department of Defense.
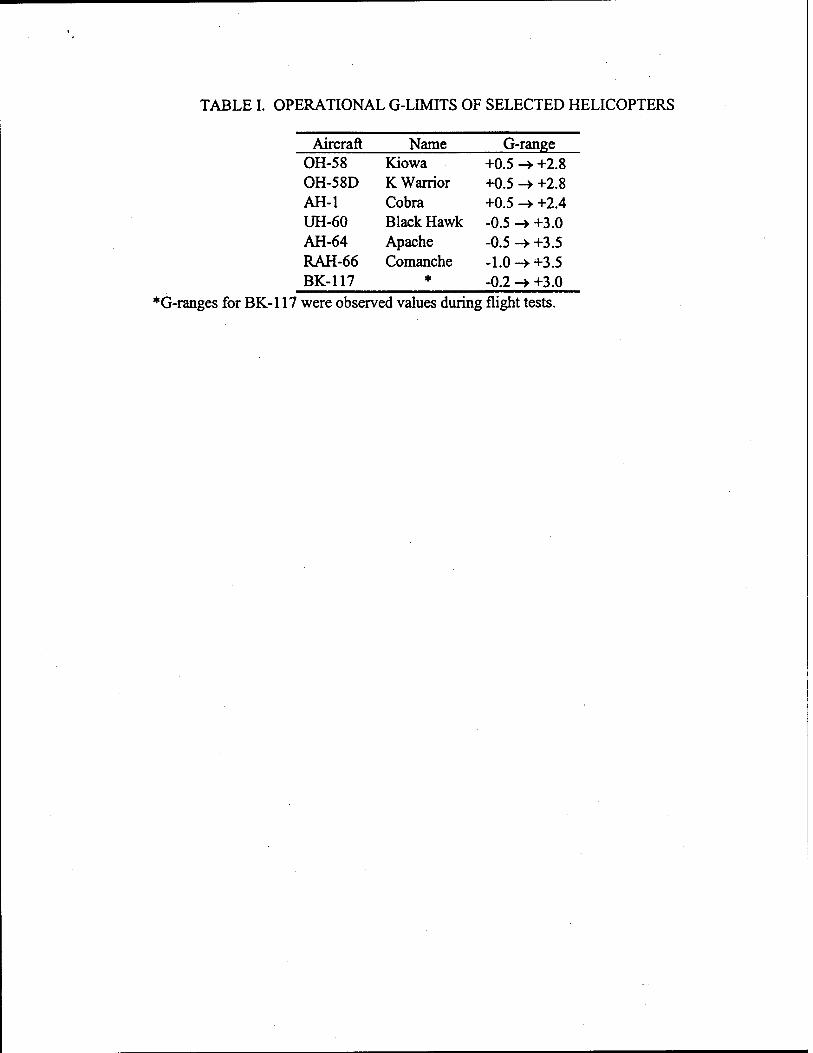
TABLE I. OPERATIONAL G-LIMITS OF SELECTED HELICOPTERS
Aircraft Name G-range OH-58 Kiowa +0.5 -► +2.8 OH-58D K Warrior +0.5 -> +2.8 AH-1 Cobra +0.5 -> +2.4 UH-60 Black Hawk -0.5 -)• +3.0 AH-64 Apache -0.5 -* +3.5 RAH-66 Comanche -1.0 -> +3.5 BK-117 * -0.2 -> +3.0
*G-ranges for BK-117 were observed values during flight tests.

TABLE II. PLL (DEG) DURING FM PPM AND GM (MEAN ± STANDARD DEVIATION AND MAXIMUM REPORTED). Maneuver Mean PLL (PPM) Mean PLL (GM) Max PLL (PPM) Max PLL (GM)
GOR1 26 ±17 22 ±26 53 68 ROR1 41 ±27 34 ±28 70 73
PO 14 ±17 0±0 45 0 L8 40 ±33 12 ±16 85 38
LHR 56 ±35 42 ±31 83 75 ROR2 48 ±31 48 ± 29 78 75 LHG 43 ±37 37 ±33 85 83
ROR3 50 ±31 42 ±29 90 75 RLC 1±2 0±0 5 0
LOOP 1±2 0±0 5 0 HH 2±7 1±2 20 5
GOR2 19 ±26 26 ±30 75 83
FIGURE CAPTIONS:
Fig. 1. Sequence of the first six maneuvers of the Push-Pull Mission during a Current
Mode centrifuge insertion.
Fig. 2. Sequence of the first six maneuvers of the Push-Pull Mission during a Future
Mode centrifuge insertion.
Fig. 3. Sequence of the last six maneuvers of the Push-Pull Mission during a Current
Mode centrifuge insertion.
Fig. 4. Sequence of the last six maneuvers of the Push-Pull Mission during a Future
Mode centrifuge insertion.
Fig. 5. Sequence of the -i-Gz-Mission maneuvers during a Current Mode centrifuge
insertion.
Fig. 6. Mean change in systolic blood pressure during the third ROR maneuver (ROR3)
during a Future Mode segment of the Push-Pull Mission (PPM) and +Gz-Mission (GM).
The Gz trace represents push-pull Gz-loads. A drop in ASBP of 22 mmHg (dotted line)
represents a 1 G reduction in G-tolerance.
Fig. 7. Mean change in heart rate during the third ROR maneuver (ROR3) during a
Future Mode segment of the Push-Pull Mission (PPM) and +Gz-Mission (GM). The Gz
trace represents push-pull Gz-loads. An increase in AHR of 25 bpm (dotted line) is
considered operationally significant.
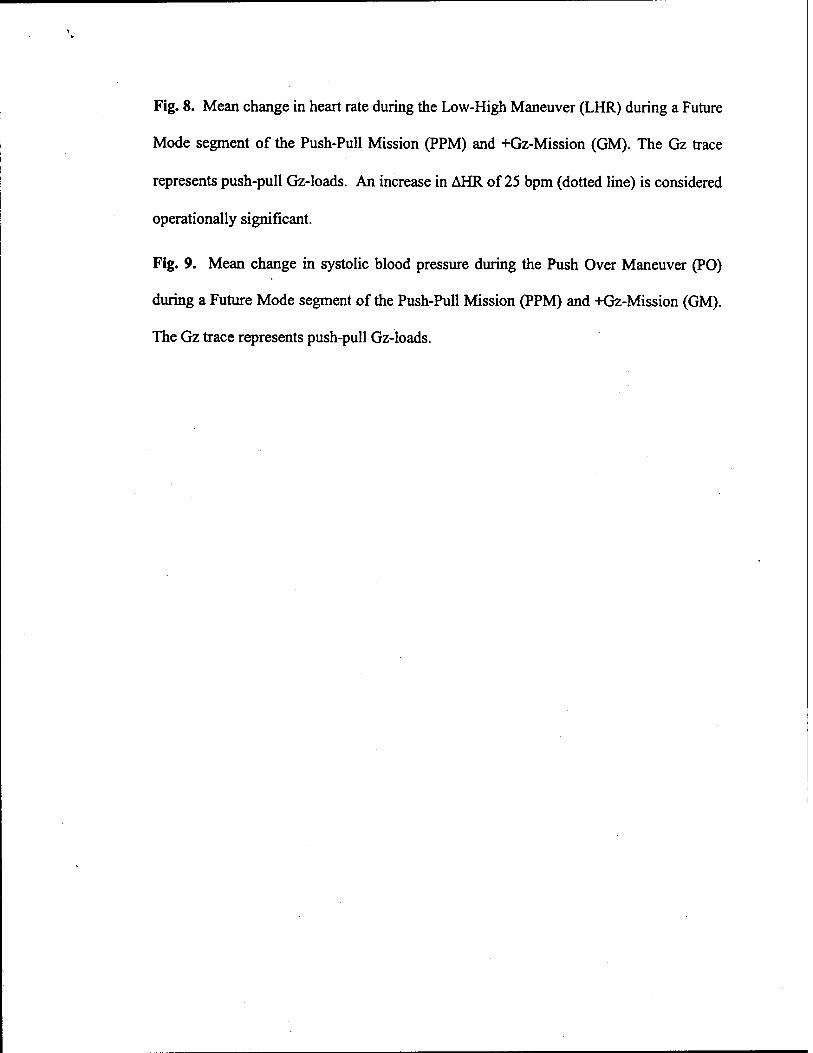
Fig. 8. Mean change in heart rate during the Low-High Maneuver (LHR) during a Future
Mode segment of the Push-Pull Mission (PPM) and +Gz-Mission (GM). The Gz trace
represents push-pull Gz-loads. An increase in AHR of 25 bpm (dotted line) is considered
operationally significant.
Fig. 9. Mean change in systolic blood pressure during the Push Over Maneuver (PO)
during a Future Mode segment of the Push-Pull Mission (PPM) and +Gz-Mission (GM).
The Gz trace represents push-pull Gz-loads.
1
1 <M rv o - o CD
O P3
01
o - to
in
-j
o - o io
o - in
CO
o - o
o - ID
CO
o - o CO
2 o E
■ MB
F=-
O Q_
o - io
CM
o - o CNJ
rr o
- LO
o - o I
o 01
Ul o CD
o " in
C====Z=:\
4.0
-
3.5
-
3.0
-
2.5
-
2.0
-
1.5
-
5 iq o - ö ö
20


)R3
RLC
LOO
P
H
H
GO
R2 J - o
CO
- LO
- o _ ^
CO
- LO CD
- o CO
v—
- LO _ T-
_ T—
- o _ ^ o
T"-
LO - CD
CO
o - CO
CO
LO
CO
o
Tim
e (s
)
u a:
CD X
1 1 !
O LO o ^t CO CO
1 1 1
LO O LO c\i csi r^
Z9
c 1 !
3 LO o u -doc
NT
->
6 1
</
o lO
o ■
o CO
o cvi
o o
o 00
O 00 CD
O 00
o 00
o 00 CO
o 00 CM
o 00
o 00 o
o 00
o 00 00
CD
E
ZQ

s
CO cc o en
CNJ CC o en.
o en
eg QL O CD
X X
GL O O _i
o on
1 in CM
CO CM
CM CM
_ O CM
_ CO
_ io
_ CO v—
_ CM
_ O
- 00
- h-
- in
- CO
- CM
- O
:> 6
Tim
e (m
in)
(!) X _J
X
oo _i
O Q.
en o CD
■
4.0
- i
CO
i i i
o in o co c\i CM
Z9
i
LO C
I
D io c - Ö c
£
(ßHtuui) dSSV ueeyy

ZO in o m o m o -^t ^t CO CO CM CM
in o in
o o CO
o CM
o CM
o Ö
CD h CM
CM CM
CO CO
CM
o> W
0) E
CD P
CM
CO
O CO
(uidq) HHV uee|/\|
%
(uidq) yHV ueeifl

1
(BHUIUJ) jaSV uea|/\|

REPORT DOCUMENTATION PAGE Form Approved
OMB No. 0704-0188 Public reporting burden for this collection of information is estimated to average 1 hour per response, including the time for reviewing instructions, searching existing data sources, gathering and maintaining the data needed, and completing and reviewing this collection of information. Send comments regarding this burden estimate or any other aspect of this collection of information, including suggestions for reducing this burden, to Department of Defense, Washington Headquarters Services, Directorate for Information Operations and Reports (0704-0188), 1215 Jefferson Davis Highway, Suite 1204, Arlington, VA 22202-4302. Respondents should be aware that notwithstanding any other provision of law, no person shall be subject to any penalty for faffing to comply with a collection of information if it does not display a currently valid OMB control number. PLEASE DO NOT RETURN YOUR FORM TO THE ABOVE
ADDRESS.
1. REPORT DATE 2. REPORT TYPE Professional Paper
4. TITLE AND SUBTITLE
Human Tolerance to Acceleration Loads Generated in High-Performance Helicopters
6. AUTHOR(S)
Barry Shender
7. PERFORMING ORGANIZATION NAME(S) AND ADDRESS(ES)
Naval Air Warfare Center Aircraft Division 22347 Cedar Point Road, Unit #6 Patuxent River, Maryland 20670-1161 9. SPONSORING/MONITORING AGENCY NAME(S) AND ADDRESS(ES)
Naval Air Systems Command 47123 Buse Road Unit IPT Patuxent River, Maryland 20670-1547
3. DATES COVERED
5a. CONTRACT NUMBER
5b. GRANT NUMBER
5c. PROGRAM ELEMENT NUMBER
5d. PROJECT NUMBER
5e. TASK NUMBER
5f. WORK UNIT NUMBER
8. PERFORMING ORGANIZATION REPORT NUMBER
10. SPONSOR/MONITOR'S ACRONYM(S)
11. SPONSOR/MONITOR'S REPORT NUMBER(S)
12. DISTRIBUTION/AVAILABILITY STATEMENT
Approved for public release; distribution is unlimited. 13. SUPPLEMENTARY NOTES
14. ABSTRACT
The risk to helicopter aircrew of acceleration stress was assessed by investigating the human physiologic response to transitions from -1 Gz (push) to +4.5 Gz (pull) loads. Nine volunteers participated in a study conducted at the Veridian Operations Centrifuge Facility in Warminster, PA. A 1-hr mission scenario consisting of nine helicopter maneuvers, based on in-flight G measurements (push-pull mission, PPM), simulated both current (CM: -0.2 to +3.5 Gz) and projected future platform capabilities (FM: -1 to +4.5 Gz). Measurements included blood pressure, heart rate (HR), loss of vision, and subjective fatigue. Visual decrements were minimal during CM while muscular tensing was required to avoid blackout during FM. Light loss typically occurred during the transition from -Gz to +Gz. Within the scope of these tests, subjects tolerated the range of Gz-stresses associated with current USN rotary wing platforms. When subjected to FM G-loads (typical of current USA platforms), cardiovascular stress significantly increased, Gz tolerance dropped as much as 1.2 G, and HR increased as much as 67 bpm. Cardiovascular changes were significantly greater during FM PPM relative to GM. Four subjects reported Almost-Loss of Consciousness symptoms during FM. While G-stress experienced by aircrew generated by current helicopters does not appear to present a high risk, G awareness training is recommended to reduce risks to aircrew exposed to G-loads generated by more aggressive helicopters. Future studies are required to determine the impact of longer mission times and dehydration.
15. SUBJECT TERMS
helicopter, G-tolerance, cardiovascular, A-LOC, flight simulation
16. SECURITY CLASSIFICATION OF:
a. REPORT
Unclassified
b. ABSTRACT
Unclassified
c. THIS PAGE
Unclassified
17. LIMITATION OF ABSTRACT
Unclassified
18. NUMBER OFPAGES
42
19a. NAME OF RESPONSIBLE PERSON Barry Shender 19b. TELEPHONE NUMBER (include area code) (301) 342-8881
Standard Form 298 (Rev. 8-98) Prescribed by ANSI Std. Z39-18
ß J10 QUALITY B3-0PEC3ED 4