humanitarian trends
DESCRIPTION
Humanitarian trends. April 2010. What does the programme do?. Map financial flows Provide access to no-spin data and information Encourage debate Provide global perspective beyond crisis. Donors. Is humanitarian aid from DAC donors going up or down?. Source: OECD DAC. - PowerPoint PPT PresentationTRANSCRIPT

Humanitarian trends
April 2010

What does the programme do?
• Map financial flows • Provide access to no-spin data and
information• Encourage debate• Provide global perspective beyond
crisis

Donors
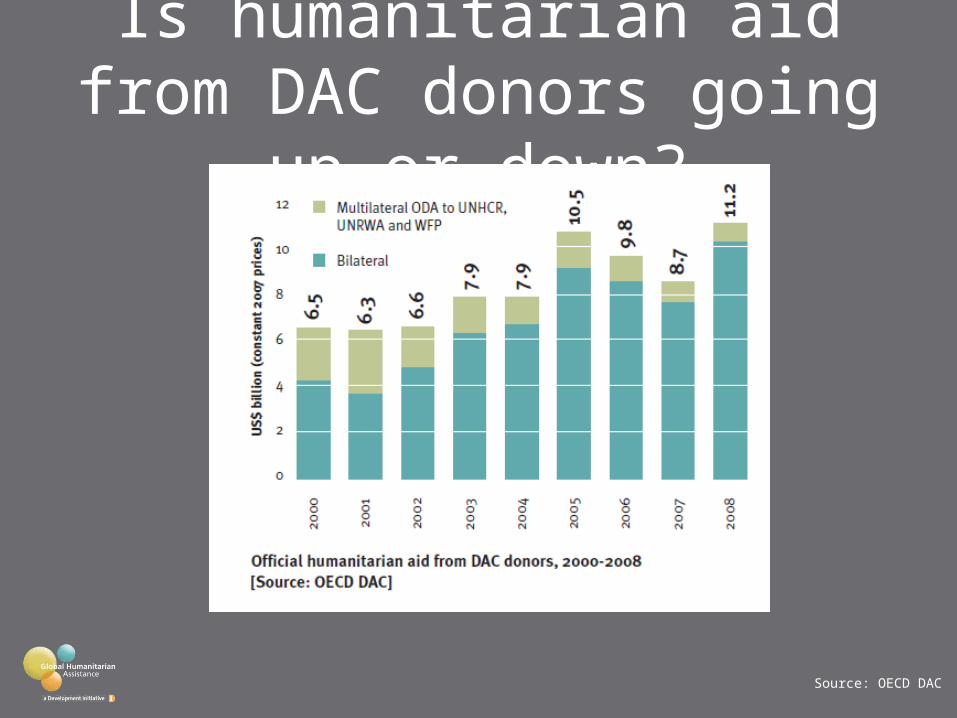
Is humanitarian aid from DAC donors going up or down?
Source: OECD DAC

How much ODA (ex debt relief) is ‘humanitarian’?
Source: OECD DAC

The United States remains the biggest humanitarian donor
Australia294m2.6%
Canada399m3.6%
Japan244m2.2%
New Zealand32m0.3% Norway
413m3.7%
Switzerland171m1.5%
United States4.3bn38.3%
EC and EU15 (DAC)5.3bn47.8%
Source: OECD DAC

DAC donor humanitarian aid in 2008
US$11.2bnTotal official humanitarian aid
9.3%Share of ODA spent on
humanitarian aid
US$9.5Spent by citizens on
humanitarian aid
0.05%Average share of gross
national income spent on humanitarian aid
28.7%Change in humanitarian
aid expenditure since 2007
Source: OECD DAC
From Japan, US$2 to Luxembourg, US$107
From Portugal ,US$25m, to US, US$4.3bn
From Japan and Portugal, 0.01%, to Luxembourg, 0.13%
From Japan, 3.5%, to Ireland, 17.8%
New Zealand’s fell by 20% , Japan’s increased by 110%
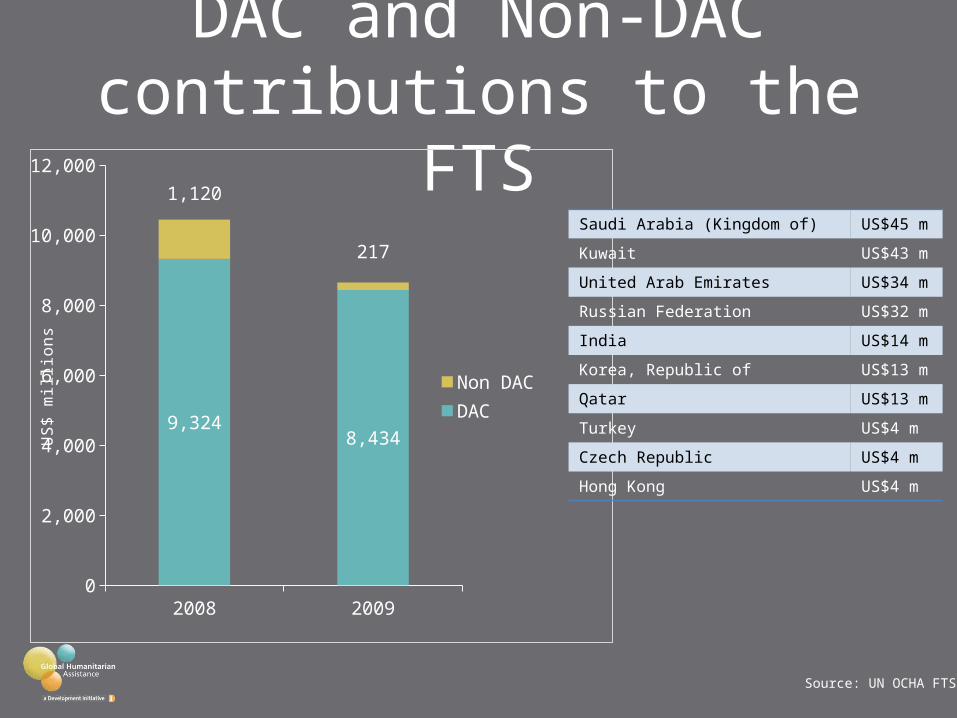
DAC and Non-DAC contributions to the FTS
2008 20090
2,000
4,000
6,000
8,000
10,000
12,000
9,324 8,434
1,120
217
Non DACDAC
US$
mill
ions
Source: UN OCHA FTS
Saudi Arabia (Kingdom of) US$45 m
Kuwait US$43 m
United Arab Emirates US$34 m
Russian Federation US$32 m
India US$14 m
Korea, Republic of US$13 m
Qatar US$13 m
Turkey US$4 m
Czech Republic US$4 m
Hong Kong US$4 m
Recipients:

CAP appeal funding requirements 2003-2010
Source: UN OCHA FTS
2003 2004 2005 2006 2007 2008 2009 2010
3,958
2,197
4,020 3,382 3,7195,082
6,315
2,444
1,263
1,221
1,9591,679 1,423
2,012
3,391
6,4155,220
3,417
5,979
5,061 5,142
7,095
9,706
8,859
Funding Unmet need Requirement
Source: OECD DAC

Top 10 recipients of non-DAC donor humanitarian assistance in 2009
Kenya
Philippines
Zimbabwe
DRC
Sri Lanka
Indonesia
Ethiopia
Afghanistan
Pakistan oPt
Other recip
ients0
10
20
30
40
50
60
70
80
90
100
2.6 2.6 4.0 5.3 5.4 7.3 7.6
20.9
37.3
92.0
15.9
US$
mill
ions
Source: UN OCHA FTS

Common humanitarian funds
Source: UN OCHA FTS

Recipients of CERF money
Total 2008: US$429m Total 2009: US$397m
Source: UN CERF
10%
7%
7%
6%
4%
4%
4%4%3%3%
48%
DRC
Ethiopia
Myanmar
Kenya
Pakistan
Afghanistan
Haiti
Sudan
Nepal
Sri Lanka
Others
15%
8%
7%
6%
6%
6%5%4%3%
3%
37%
Somalia
DRC
Zimbabwe
Kenya
Sudan
Sri Lanka
DPRK
Ethiopia
Philippines
Niger
Others

Regional Changes...
2000 2001 2002 2003 2004 2005 2006 2007 20080
1000
2000
3000
4000
5000
6000
7000
EuropeAfrica, N of SaharaAfrica, S of SaharaNorth & Central AmericaS. AmericaFar East AsiaSouth & Central AsiaMiddle EastOceaniaUS
$m co
mm
itted
/con
trib
uted

Agriculture & Food

The Issue of Data CategoriesSector DAC FTS
Food
Basic nutrition Social/welfare services Agro-industries
Rural development Food aid/Food security
programmes Emergency Food Aid
• Food distribution• Food-for-Work• Monitoring of food security / livelihoods / nutrition
• Support for logistics of bulk food (e.g. transport, port facilities)• Buffer stocks • School feeding
Agriculture
Agricultural policy and administrative management
Agricultural land resources Agrarian reform Agricultural development Food crop production Industrial crops/export
crops Livestock Agricultural alternative
development Livestock/veterinary
services Agricultural inputs
Agricultural extension Agricultural
education/training Agricultural research Agricultural services Plant and post-harvest
protection and pest control Agricultural financial
services Agricultural co-operatives Agricultural water
resources
• Livestock re-stocking• Seed / seedling / tuber propagation or diversification• Agricultural extension & training• Veterinary services• Pest control• Environmental management• Aquaculture4• Coordination / information / early warning• Agricultural water systems (irrigation, wells)
• Seeds & tools distribution (more broadly, provision of agricultural inputs, incl. fertiliser)
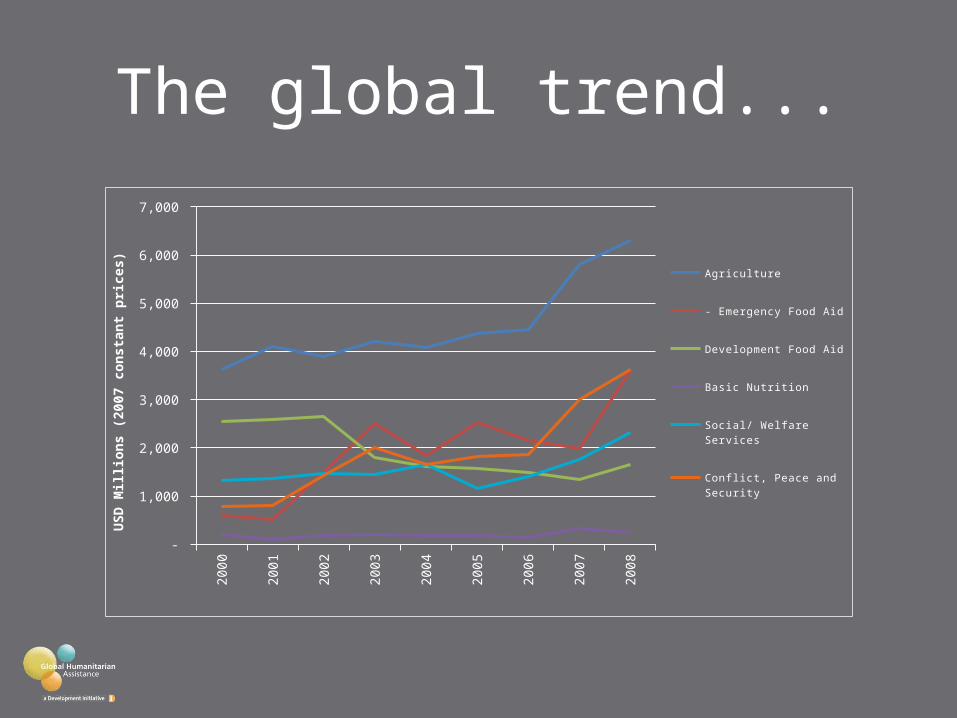
The global trend...
2000
2001
2002
2003
2004
2005
2006
2007
2008
-
1,000
2,000
3,000
4,000
5,000
6,000
7,000
Agriculture
- Emergency Food Aid
Development Food Aid
Basic Nutrition
Social/ Welfare Services
Conflict, Peace and SecurityUSD
Mill
ions
(200
7 co
nsta
nt p
rices
)

Countries receiving long-term humanitarian assistance..
2000
2001
2002
2003
2004
2005
2006
2007
2008
-
500
1,000
1,500
2,000
2,500
Agriculture
- Emergency Food Aid
Development Food Aid
Basic Nutrition
Social/ Welfare Services
Conflict, Peace and Security
USD
Mill
ions
(200
7 co
nsta
nt p
rices
)

Country aid profiles vary...
Sudan0%
10%
20%
30%
40%
50%
60%
70%
80%
90%
100%
19%
2%1%5%
8%
2%
62%
0%
Democratic Republic of Congo0%
10%
20%
30%
40%
50%
60%
70%
80%
90%
100%
38%
3%
5%
4%1%
17%
19%
0%
Somalia0%
10%
20%
30%
40%
50%
60%
70%
80%
90%
100%
20%
1%1%3%4%2%0%
67%
1%0%
Unallocated/ Unspecified
Refugees in Donor coun-tries
Support to NGOs
Administrative costs of Donors
Humanitarian Aid
Action relating to Debt
Commodity Aid
Conflict, Peace and Secu-rity
- Multi-Sector/ cross-cut-ting
- Production Sectors
- Economic Infrastructure and services
- Social Infrastructure and services

Sudan
2000 2001 2002 2003 2004 2005 2006 2007 2008 -
200,000,000
400,000,000
600,000,000
800,000,000
1,000,000,000
1,200,000,000
1,400,000,000
1,600,000,000
1,800,000,000
Water and Sanitation
Shelter and non-food items
Sector not yet specified
Safety and Security of Staff and Opera-tions
Protection/ Human Rights/ Rule of Law
Multi-sector
Mine Action
Health
Food
Education
Economic Recovery and Infrastructure
Coordination and Support Services
Agriculture
USD
(Cur
rent
Pric
es)
CAP Funding 2000 – 2008: • Agriculture: 42%
• Food: 81%

Somalia...
2000 2001 2002 2003 2004 2005 2006 2007 2008 -
100,000,000.00
200,000,000.00
300,000,000.00
400,000,000.00
500,000,000.00
600,000,000.00
700,000,000.00
Water and Sanitation
Shelter and non-food items
Sector not yet specified
Safety and Security of Staff and Operations
Protection/ Human Rights/ Rule of Law
Multi-sector
Mine Action
Health
Food
Education
Economic Recovery and Infrastruc-ture
Coordination and Support Services
Agriculture
USD
(Cur
rent
Pric
es)
CAP Funding 2000 – 2008: • Agriculture: 39%
• Food: 96%

2000 2001 2002 2003 2004 2005 2006 2007 20080
500
1000
1500
2000
2500
3000
3500
4000
4500
OceaniaMiddle EastSouth & Central AsiaFar East AsiaS. AmericaNorth & Central AmericaAfrica, S of SaharaAfrica, N of SaharaEurope
Food
HA
(US$
m)
27.2%
39.4%34.4%
41.9%
49.4%
41.3%
46.6%
44.9%
29.1%
Regional Food Aid
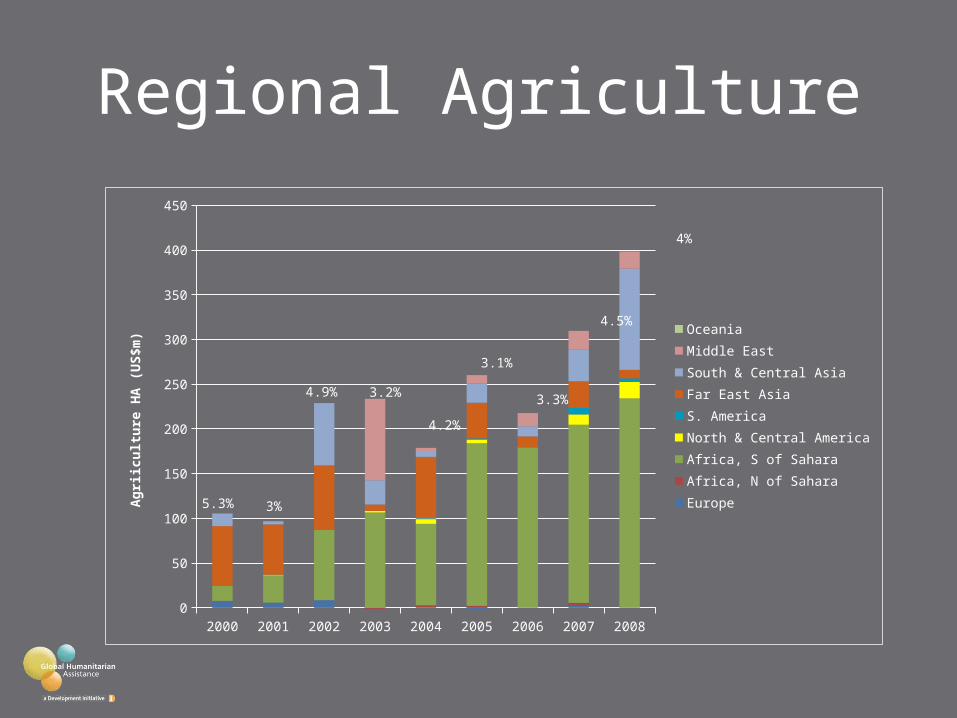
2000 2001 2002 2003 2004 2005 2006 2007 20080
50
100
150
200
250
300
350
400
450
OceaniaMiddle EastSouth & Central AsiaFar East AsiaS. AmericaNorth & Central AmericaAfrica, S of SaharaAfrica, N of SaharaEuropeAg
riicu
lture
HA
(US$
m)
3%
4.9% 3.2%
4.2%
3.1%
3.3%
4.5%
4%
5.3%
Regional Agriculture

Context & Concentrations
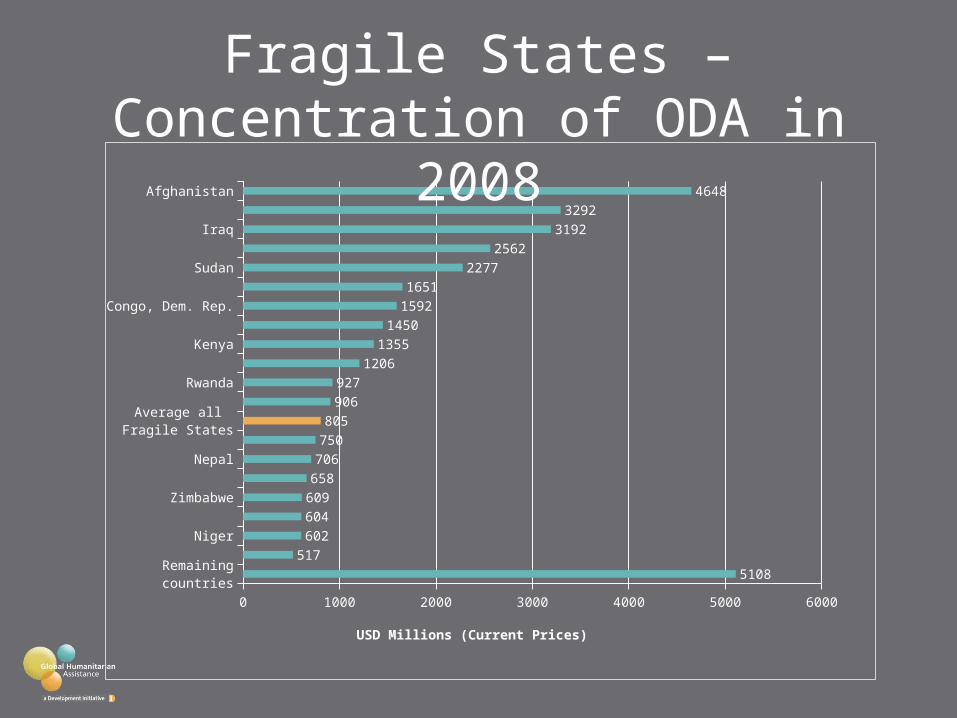
Remaining countriesMyanmar
NigerCote d'Ivoire
ZimbabweLiberiaNepal
SomaliaAverage all Fragile States
HaitiRwandaNigeriaKenya
PakistanCongo, Dem. Rep.
UgandaSudan
West Bank and GazaIraq
EthiopiaAfghanistan
0 1000 2000 3000 4000 5000 6000
5108517
602604609658706750805
906927
12061355
145015921651
22772562
31923292
4648
USD Millions (Current Prices)
Fragile States – Concentration of ODA in 2008

UN consolidated appeals 2000-2010
Source: UN OCHA FTS

We work to provide access to reliable, transparent and understandable information so that we can all work to ensure better outcomes for people affected by humanitarian crises.
Global Humanitarian Assistance is a Development Initiatives programme, funded by the governments of Canada, Denmark, the Netherlands, Sweden and the United Kingdom
Clarity CountsMAPPING FINANCIAL FLOWS
We work in detail to highlight relationships between and within financial flows, mapping out who spends what, and where, enabling donors, NGOs, governments and local communities to better respond to people in humanitarian need.
PROVIDING ACCESS TO NO-SPIN DATA & INFO
We provide no-spin analysis on financial flows, emphasising simplicity and clarity at all times, and work hard to make this complex world accessible. We help researchers, students and journalists to use and apply raw data, contributing to evidence-based policy making.
ENCOURAGING DEBATE
We build a broad network for transparency in humanitarian aid flows. We work hard to agree numbers and definitions so we can discuss the issues – not argue about the figures themselves.
PROVIDING PERSPECTIVE BEYOND CRISIS
Our work on humanitarian assistance is in the wider context of a global commitment to poverty reduction and interconnects with global, regional and national concerns such as climate change, financial crises, conflict and chronic poverty.
Name: Jan Kellett, Programme Leader
Email: [email protected]
Tel: +44 (0)1749 671343
Web: globalhumanitarianassistance.org
Global Humanitarian Assistance, Development Initiatives, Keward Court, Jocelyn Drive, Wells, Somerset, BA5 1DB, UK
Email: [email protected]