humboldt county entrepreneur annual survey: identifying key
TRANSCRIPT

1
Humboldt County Entrepreneur Annual Survey: Identifying Key Determinants of Small Business Success
Written by Erick Eschker, PhD and Jessica Lamb
Department of Economics, Humboldt State University
Summer, 2011 Updated September 6, 2012
Funding provided by the Humboldt County Workforce Investment Board

2
Investigators Erick Eschker, PhD. Professor of Economics, Humboldt State University and Director, Humboldt Economic Index. Gregg Gold, PhD. Associate Professor of Psychology, Humboldt State University. Jessica Lamb B.A. Economics from Humboldt State University. Esperanza Alcazar Psychology Masters student at Humboldt State University. Jenna Barry Psychology Masters student at Humboldt State University. Erik Federas Psychology Masters student at Humboldt State University. Jessica Robinson Psychology Masters student at Humboldt State University.

3
Acknowledgements This project was generously funded by Humboldt County Workforce Investment Board. We are especially grateful to Jacqueline Debets, Executive Director, for her support and help for this project. She provided feedback from herself and local economic developers for our questionnaire. Dr. Gregg Gold provided expert direction with designing the survey method and organizing the student surveyors. Those students were Esperanza Alcazar, Erik Federas, and Jessica Robinson. This team of surveyors did a fantastic job and obtained a very high return rate. Samanthia Carns, Deputy Clerk at the Humboldt County Recorder’s Office, was very helpful in retrieving the fictitious business name data. Jenna Barry transformed the data into an Excel spreadsheet. We would also like to thank Jan Mueller from the Department of Economics for her logistical assistance with the project and Keelye Wilson from the HSU Sponsored Programs Foundation for her help. Finally, many thanks to the local entrepreneurs who were willing to share their sensitive business information. Without their help and support this project would not have been possible.

4
Table of Contents Investigators ........................................................................................................................................................ 2 Acknowledgements ............................................................................................................................................ 3 Introduction ........................................................................................................................................................ 6 Project Development ........................................................................................................................................ 6 Survey Administration ....................................................................................................................................... 7 Database Setup ................................................................................................................................................... 8 Future Survey Editions ..................................................................................................................................... 8 Survey Return ..................................................................................................................................................... 8 Data Summary .................................................................................................................................................... 9 Correlations with Measures of Success ......................................................................................................... 15 Conclusion ........................................................................................................................................................ 16 Appendix 1: Further Reading on Entrepreneurship ................................................................................... 17
5
Table of Figures
Figure 1. Entrepreneur Race/Ethnicity .......................................................................................................... 9 Figure 2. Entrepreneur Year of Birth ........................................................................................................... 10 Figure 3. Entrepreneur Level of Education ................................................................................................. 10 Figure 4. Activity Immediately Before Starting Business ........................................................................... 11 Figure 5. Legal Organization of Business ..................................................................................................... 12 Figure 6. Business Startup Cost ..................................................................................................................... 12 Figure 7. Source of Business Funding Over the Last Year........................................................................ 13 Figure 8. Change in Employees Over the Last Year .................................................................................. 13 Figure 9. Sources of Business Advice ........................................................................................................... 14 Figure 10. Forms of Assistance Received From Business Development Organization(s) ................... 14 Figure 11. Percentage of Sales Outside Humboldt County ....................................................................... 15
6
Introduction Entrepreneurs are often believed to be the driving force behind local economic growth, especially in rural communities. Their efforts must be properly supported in order to ensure the health and resiliency of the local economy and community. This study of entrepreneurship was instituted to identify characteristics of business success specific to Humboldt County’s unique economic climate. The results are aggregated and analyzed to pinpoint the most helpful ways to advise new business owners, target economic development services, and develop policies favorable to small businesses. The initial survey conducted this year is meant to record key characteristics of the business cohort that started between 2008 and 2010. These characteristics include factors such as: industry type, owner demographics, years of experience, start-up costs, funding sources, initial profits, number of employees, networking ties, sources of advice, and economic development assistance. We plan for this survey to continue in the future and we plan will design and carry out a shorter annual survey of the same cohort of businesses in order to track changes in number of employees, profits, funding sources, and perceptions of growth. Analysis of the trends in data, especially after about 5 years, will point out factors lead to greater success – defined in this instance as overall growth, more employment, higher profits, and business survival. The hope is to establish a rapport with the businesses so they will continue to provide survey responses in the future and potentially allow us to survey them if they go out of business to understand why they were not successful and what could have helped them to succeed.
Project Development This first phase of the project involved problem formulation, survey development, establishing survey administrations methods, and creating a database of businesses started in 2010. After receiving survey responses we entered them into a database, analyzed data, and wrote a report of findings for the Department of Economics and the Humboldt County Workforce Investment Board. A literature review was conducted to determine the best design in terms of which questions to ask to target possible determinants of success, and the best methods of survey administration to receive a high percentage of responses, and obtain useful primary data. Survey questions were developed from a combination of practical experience in survey design and administration obtained from the investigators’ work on a study titled “Rural Ethnic Entrepreneurship in Mendocino County.” We also researched journal articles reporting the best characteristics leading to business success, considered the impact of economic principles on entrepreneurial motivation and business longevity, and consulted with area economic development agencies. See Appendix 1 for further reading. Particular attention was given to developing questions about the basic economic indicators of initial capital investment, employment growth, profit margin, and corporate structure. Also, more sociological impacts on business survival such as network connections, educational background, industry experience, and inter-business relations were included in the questions. We wanted the information to be useful to economic development agencies and government entities concerned with small business. The Humboldt County Workforce Investment Board and other area agencies were contacted to see what types of questions were helpful to them. In order to start a comprehensive database of businesses recently we pulled the records of all fictitious business name Statements filed with the Humboldt County Recorder in 2010. FBNs contain

7
information about the name(s) of the owner(s), name of the business, a contact address and date of filing. After organizing the data in an Excel spreadsheet and consolidating multiple records from the same business (either from multiple filings or multiple owners) we ended up with a total of 797 unique business names. Initially, the goal was to only accept data from businesses that started in 2010, but the survey returns resulted in businesses that were started in a variety of years, even up to 20 years ago. Owners can delay filing an FBN until a few years later or must re-file in five years after the records expire. Thus, not all businesses that filed in 2010 were started in 2010. In order to have a greater sample, we defined a ‘new’ business as any business that the owner indicated was started in 2008, 2009, or 2010. Businesses started in these years share the trait of being created during the harsh business climate of the 2007-09 recession. For purposes of data consistency and simplicity, just the 2008-2010 cohort of businesses will be followed through time. Down the line, a new cohort of businesses may be brought on to widen the pool of respondents if the response rate drops or failure rate increases.
Survey Administration Methods
Based on literature review recommendations as well as best use of available funds, the survey was conducted exclusively by mail. We included a monetary enticement in each envelope to encourage participation. The “Law of Reciprocity” states that people are moved to respond when a small amount of money is included with the survey. Though such a method means sending out a lot of money that will not be returned, the purpose was to increase our response rate at a lower cost than paying for the time it would take student assistants to conduct in-person surveys. Our response rate for completed, returned surveys was one out of three, which is very high. First, time was spent looking for a phone number for each business and those that had one were called to let them know to watch for the survey in the mail. Phone contact is the next best thing after face-to-face contact to increase response rate. Then, each business (regardless of phone contact or not) was sent an envelope containing a cover letter explaining the research project and intended use of results, a survey, a self-addressed and stamped envelope, as well as $4 monetary compensation. We requested return address service from the Post Office, which meant that any undeliverable letters were returned to us and efforts were made to find a correct address. After waiting two weeks from the initial mailing, businesses that we had not received a return envelope from were sent a second envelope with all the same things as the first, except monetary compensation. Lastly, second phone contact was made to only non-responsive subjects shortly after the second mailing to give a friendly reminder about completing the survey. Any business that did not respond, or was not able to respond because the mailing did not reach them during this first round of surveys will be taken out of the database since we will be simplifying the survey in the future and will not have a record of their base characteristics or demographics to build upon. Once our final survey methods were decided upon, we were required to submit a statement of project intent to the “Humboldt State University Institutional Review Board for the Protection of Human Subjects” to get approval of our survey questions, methods, and obtain an exemption from each business having to fill out a waiver form in order to use their data. We were granted an exemption on the grounds that human subjects could not be identified and that disclosure of responses would not put the subject as risk.

8
Database Setup Microsoft Excel was chosen as the platform to store and analyze the data because the majority of people are familiar with its functions so it is easily passed on to future survey staff. Each FBN filing was given a unique identification number in order to make responses anonymous when working through data analysis and reporting results. In the spreadsheet a column was created for each question with a standardized numerical input depending on the type of question. In the future, new rows can be added below each FBN to add on additional data to be aggregated with the previous year. There was an “Other” option on a number of questions that allowed entrepreneurs to explain any condition not included in the potential responses. The four open-ended questions including those about economics growth or decline and the main challenges were transcribed as written by the entrepreneur.
Future Survey Editions This project was established as a “legacy project” which is a component of the Senior Capstone class required by the Humboldt State University Department of Economics, with the intent that it would become a project available for future capstone students to continue. The hope is that each year a student or ideally students will express an interest in re-administering the survey, analyzing data, and creating an annual report of findings. A key goal of this continued survey is to develop a trust and rapport with the entrepreneurs so they are willing to trust us with tracking their business, recognize the arrival of the annual survey, and understand the importance of their contributions. An important element of establishing trust is continuity and reliability. Continued undertaking of this project by Capstone students will generate a database that will be able to be analyzed for trends in business success and failure. The second year of continuing the entrepreneur project will require that the student develop a new, shorter, and simpler annual survey to be administered for the rest of the project lifetime as well as creating a timeline/deadline chart to help guide the work of future undertakers of the project to completion. The new survey will not need to include unchanging parameters such as owner demographics or start-up information but may instead want to expand into other areas because the initial year of “trust” between HSU and the entrepreneur has been established. Examples of future questions include asking if the owner for their email address, would they prefer to take the survey online, or if they are actively looking to expand their business. A third year of survey design could include designing a survey of entrepreneurs who have gone out of business since the survey began and identifying those businesses for individual contact. Again, the goal of an annual survey is to establish credibility with the entrepreneur so they will potentially disclose information about why their business failed.
Survey Return
Overall, the study resulted in a return rate of 33% from 266 completed surveys. These 159 businesses, as well as any that return surveys before next year’s study, will make up the 2008-2010 cohort to be followed through time.

9
Data Summary
Overall Respondent Summary A majority of Humboldt County entrepreneurs, 86%, identified themselves as white. The largest number of entrepreneurs were born between 1970-1979, the next most common result was 1950-1959. Males comprised 55% of entrepreneur respondents, and females made up 45%. The most frequent ‘highest level of education’ attained by entrepreneurs was a college degree at 27%, followed closely by 26% having completed at least some college.
Figure 1. Entrepreneur Race/Ethnicity
86%
3%
1%3% 1% 6%
Entrepreneur Race/Ethnicity
White
Asian
Black
Native American/Alaska Native
Native Hawaiian/Pacific Islander
Other
0
10
20
30
40
50
60
70
80
Up to 1949 1950-1959 1960-1969 1970-1979 1980-1989 1990+
Entrepreneur Year of Birth

10
Figure 2. Entrepreneur Year of Birth
Figure 3. Entrepreneur Level of Education
The average business owner has lived in the local area for 24.3 years. California-born entrepreneurs
represent a majority at 55%; internationally born entrepreneurs follow with just 6%. Most owners
were either employed or self-employed before starting their new business. And nearly 60% of the
businesses were the owner(s) first company.
Approximately 27% of business owners listed themselves as a member of business networking
groups – the most frequently identified groups were the North Coast Small Business Development
Center and the Chamber of Commerce. Forty-one percent reported that one or more members of
their family owned a business, and family helped 38% of owners start their business.
01020304050607080
Entrepreneur Level of Education

11
Figure 4. Activity Immediately Before Starting Business
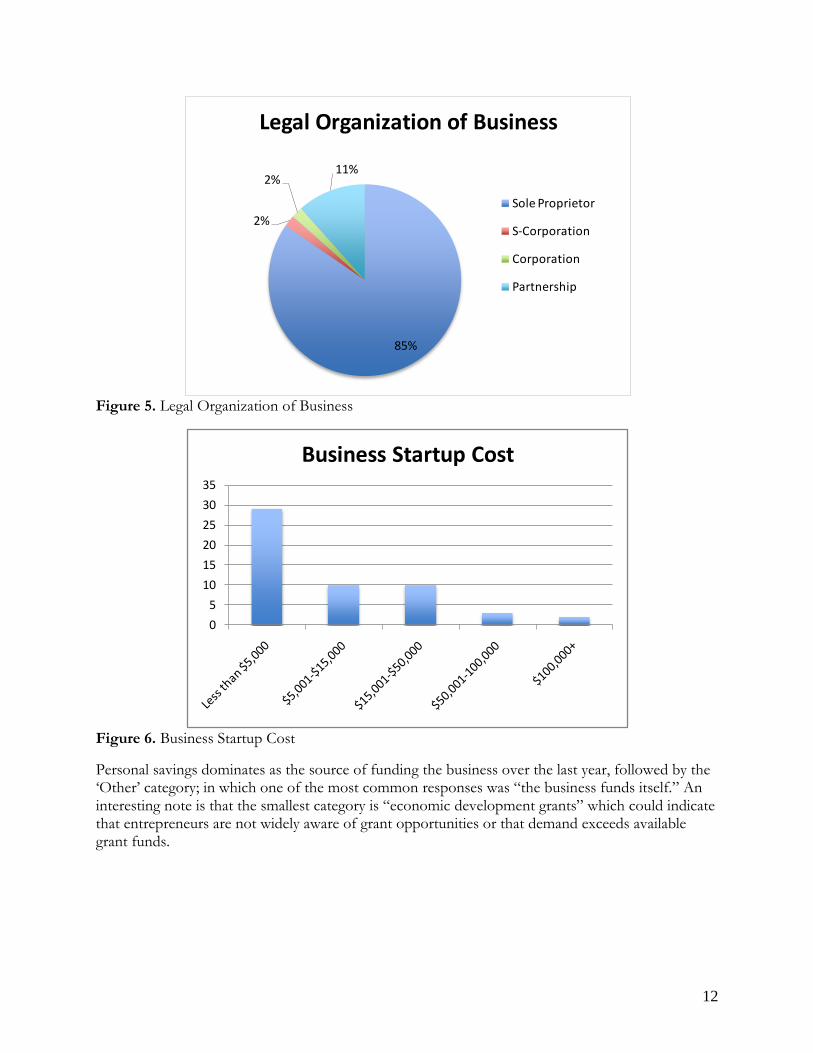
Profitable Business Summary Out of the survey returns, 54 (or 20%) of the businesses reported a profit. The average amount of revenue was $129,649. The average reported profit was $38,803, yet when excluding the highest and lowest numbers the adjusted profit is $26,706. There was an average of 1.3 owners for each business, with 73% of owners present at the business every day. Eighty-five percent of companies are sole-proprietorships, keeping with the one owner trend.
About 44% of entrepreneurs had a business plan before starting, as well as an average of 9 years experience in a field related to the business’ industry. The bulk of companies had a startup cost of less than $5,000 as shown on the chart below, which may indicate that the majority of businesses launch on a smaller scale.
020406080
100120140
Immediately Before Starting Business
12
Figure 5. Legal Organization of Business
Figure 6. Business Startup Cost
Personal savings dominates as the source of funding the business over the last year, followed by the ‘Other’ category; in which one of the most common responses was “the business funds itself.” An interesting note is that the smallest category is “economic development grants” which could indicate that entrepreneurs are not widely aware of grant opportunities or that demand exceeds available grant funds.
85%
2%
2%11%
Legal Organization of Business
Sole Proprietor
S-Corporation
Corporation
Partnership
0
5
10
15
20
25
30
35
Business Startup Cost

13
Figure 7. Source of Business Funding Over the Last Year
Employment growth is one of our main economic indicators of business growth and success. Profitable businesses have an average of 1.98 employees (compared to 3.98 for all respondents). Being that we are mainly following businesses in their first year, 65% did not expand employment. However, 33% indicated an increase in employees, which is an interesting finding considering the prevalence of ‘economic downturn’ in survey responses.
Figure 8. Change in Employees Over the Last Year
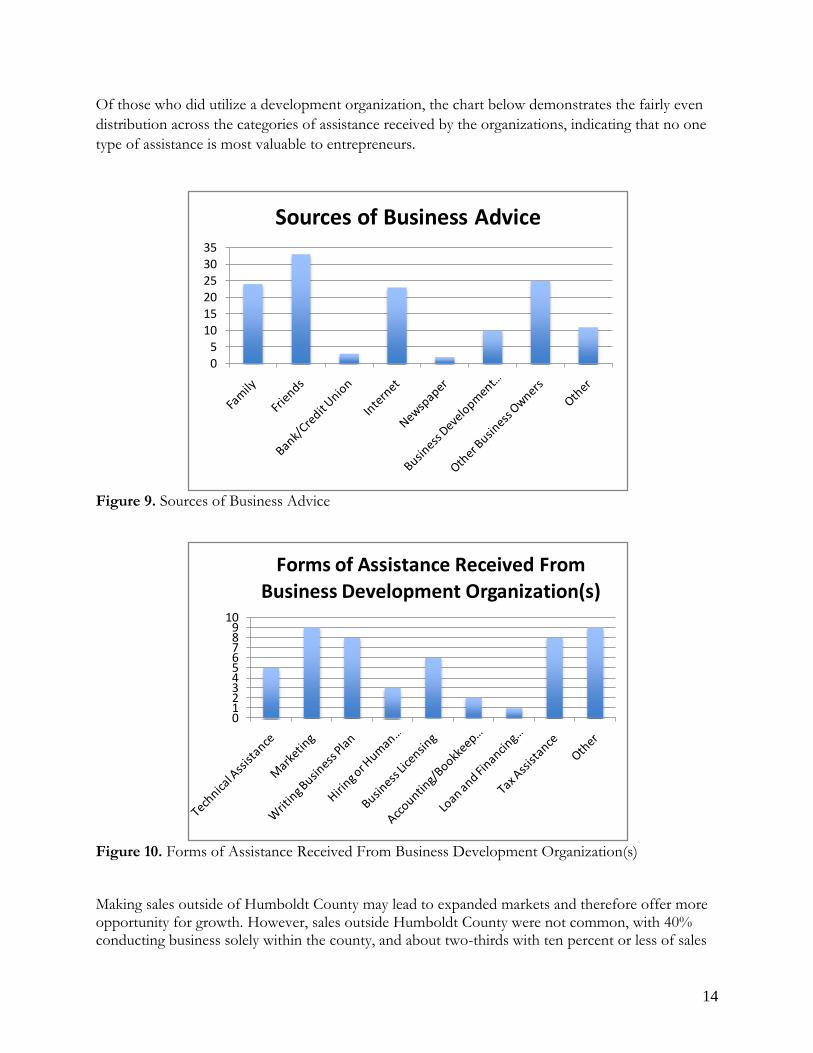
When asked where they sought advice, owner’s responses were concentrated in a variety of
categories including family, friends, the Internet, other business owners, and accountants (from the
‘Other’ response). Business development organization advice ranks below 5 other categories as a
source for advice, which could be higher considering the breadth of services offered at such agencies.
05
10152025303540
Source of Business Funding Over The Last Year
Decrease2%
No Change65%
Increase33%
Change in Employees Over The Last
Year
14
Of those who did utilize a development organization, the chart below demonstrates the fairly even
distribution across the categories of assistance received by the organizations, indicating that no one
type of assistance is most valuable to entrepreneurs.
Figure 9. Sources of Business Advice
Figure 10. Forms of Assistance Received From Business Development Organization(s)
Making sales outside of Humboldt County may lead to expanded markets and therefore offer more opportunity for growth. However, sales outside Humboldt County were not common, with 40% conducting business solely within the county, and about two-thirds with ten percent or less of sales
05
101520253035
Sources of Business Advice
0123456789
10
Forms of Assistance Received From
Business Development Organization(s)

15
outside the county. Fifty-four percent of businesses advertise, and ‘word of mouth’ advertising was frequently cited as a reason for business growth over the last year.
Figure 11. Percentage of Sales Outside Humboldt County
Correlations with Measures of Success We next ask what factors are correlated with business success. Our measure of success is whether or not the owner reported a positive profit last year, and whether or not the number of employees increased over the last year. The four factors we consider are: 1) whether or not the owner is a member of business networking group, 2) whether or not the owner had a business plan, 3) the portion of sales that are to people outside of Humboldt County, and 4) whether or not this was the first business that the owner started. We expect membership is business networking groups and having a business plan to be correlated with greater business success. Businesses that have more sales outside of the County are “export-oriented,” but the anticipated effect on success is not certain. We also expect first time owners to be less successful due to lack of experience. We carried out a Chi-squared test to see if groups that are separated according to these factors have more or less business success. For example, we look at the number of profitable and unprofitable businesses with owners in a business networking group and ask if that is different from what we would expect if there were no differences. For this analysis we will look at only completed returns for this analysis. It should be stressed that these finding only reveal correlation and not causation. When looking at profitability, the reported p-values for the Chi-squared test are Member of Business Network (0.70=70% level), Business Plan (0.30), Sales Outside (0.31), and First Business (0.11). Thus, owners split along these dimensions do not report significant differences in profitability over the last year, although first business owners are very close to being significant at the 10 percent level. When we look at the increase in the number of employees, the reported p-values for the Chi-squared test are Member of Business Network Group (0.06), Business Plan (0.14), Sales Outside
40%
25%
21%
14%
Percentage of Sales Outside Humboldt County
0%
1-10%
11-50%
51-100%

16
(0.51), and First Business (0.004). These differences are more pronounced. Being a member of a business networking group is associated with more likelihood that employees will increase. Surprisingly, our sample tells us that being a first time business owner is more correlated with an increase in employees. Perhaps first time entrepreneurs are clustered in industries that have done relatively well over the past year. Since we are looking at new businesses, positive profits may not be in abundance, and businesses may still be relying primarily on labor from owner-operators. In a few years time, we expect there to be more variation in these measures of business success. Thus, it is important to continue to track this cohort of businesses in the future. More data from future years of collection also will be helpful in developing models and using methods that go beyond these simple tests in order to test for correlation and causation.
Conclusion This project created and implemented a survey of Humboldt County entrepreneurs, defined as owners who filed a fictitious business name statement with the County in 2010. The goal was to get a snapshot of owner and business characteristics and to correlate those with measures of business success. We also asked open-ended questions of entrepreneurs to reveal their perceptions of the challenges that they face in the local economic environment. The survey response rate was very high, with one-third of almost 800 businesses sending back a survey. Many of the entrepreneurs were eager to share their story with us. Business conditions continue to be challenging coming out of the 2007-09 recession and it must be remembered that these data are on new businesses. Still, one in five owners reported a positive profit, and one in three hired more employees over the last year. Most entrepreneurs headed small sole-proprietorships, which needed less than $5,000 in start up funds, did not hire employees, and had little if no sales outside of Humboldt County. They went to friends, other business owners, family and the Internet for advice. When they visited a business development agency, they got help with marketing, writing a business plan, and preparing taxes. We find evidence that being a member of a business networking group is associated with more business success, and, somewhat surprisingly, that first time business owners appear to be more successful than their peers with more entrepreneur experience. We expect to continue this as an annual survey of the 2010 cohort of entrepreneurs in the future. Data collected over more years will allow us to more precisely pinpoint which factors are associated with business success and will allow business development agencies to better target their support for businesses.

17
Appendix 1: Further Reading on Entrepreneurship Bates, Timothy. "Entrepreneur Human Capital Inputs and Small Business Longevity." Review of Economics and Statistics 72.4 (1990): 551-59. Www.jstor.org. Web. 5 Mar. 2011. Casson, Mark. The Entrepreneur: an Economic Theory. Cheltenham, UK: Edward Elgar, 2003. Print. Dabson, Brian. "Supporting Rural Entrepreneurship." Youth Build. Web. 8 Mar. 2011. <www.youthbuild.org/atf/cf/%257B22B5F680-2AF9-4ED2-B948- 40C4B32E6198%257D/Supporting%2520Rural%2520Entrepreneurship%2520(2001).pdf>. Felsenthal, Mark. "What Happened To Entrepreneurship During The Recession?" The Huffington Post, 5 Apr. 2011. 05 Apr. 2011.<http://www.huffingtonpost.com/2011/04/05/the-recessions-effect-on-_n_843679.html>. Fox, Richard. "Mail Survey Response Rate - A Meta-Analysis of Selected Techniques for Inducing Response." Public Opinion Quarterly 52.4 (1988): 467-91. Poq.oxfordjournals.org. Oxford Journals, 14 Mar. 2011. Web. Francis, Yammarino J. "Understanding Mail Survey Response Behavior." Public Opinion Quarterly 55.4 (1991): 613-39. Print. Jo, Hyungrae, and Jinjoe Lee. "The Relationship between an Entrepreneur's Background and Performance in a New Venture." Technovation 16.4 (1996): 161-71. Print. Steinberg, Sheila, Steinberg, Steven, Eschker, Erick, Keeble, Sarah, and Jason Barnes “Rural Ethnic Entrepreneurship in Mendocino County,” May, 2010 <www.humboldt.edu/ccrp/sites/ccrp/files/publications/Ford_FINAL%20%282%29.pdf>. Tigges, Leann M., and Gary P. Green. "Small Business Success Among Men- and Women- Owned Firms in Rural Areas." Rural Sociology 59.2 (1994): 289-310. Print.