hurricane nicole · september when it encountered strong southwesterly shear associated with a...
TRANSCRIPT

NATIONAL HURRICANE CENTER TROPICAL CYCLONE REPORT
HURRICANE NICOLE (AL152016) 4 – 18 October 2016
Todd B. Kimberlain and Andrew S. Latto National Hurricane Center
10 April 20171
HURRICANE NICOLE AT PEAK INTENSITY AT 0545 UTC 13 OCTOBER, SOUTHWEST OF BERMUDA. IMAGE COURTESY OF
NAVAL RESEARCH LABORATORY, MONTEREY.
Nicole formed nearly midway between Bermuda and Puerto Rico, and rapidly
intensified to hurricane strength before abruptly weakening. Nicole then made a cyclonic loop over several days but gradually turned northward and accelerated northeastward, intensifying into a category 4 hurricane (on the Saffir-Simpson Hurricane Wind Scale). Nicole struck Bermuda, producing category 2 hurricane conditions there, after which baroclinic forcing caused Nicole to become a large cyclone with hybrid characteristics over the North Atlantic.
1 Original report date 15 February 2017. Updated 10 April 2017 to correct the time-averaging period of the Commissioner’s Point wind observation, the attribution of the damage estimate on Bermuda, and to include ship report data.

Hurricane Nicole 2
Hurricane Nicole 4 – 18 OCTOBER 2016
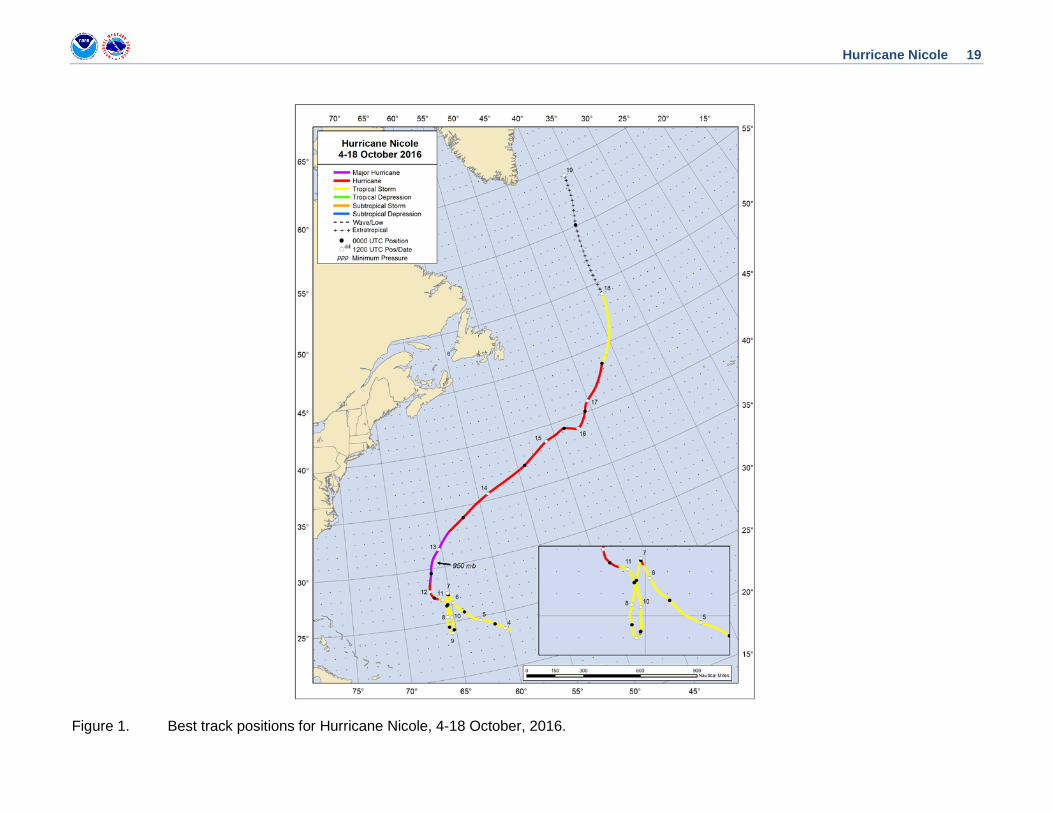
SYNOPTIC HISTORY A tropical wave emerged from the west coast of Africa on 25 September and moved across the eastern and central tropical Atlantic over the next several days while the wave was producing disorganized deep convection. The system had begun to show some signs of organization by 30 September when it encountered strong southwesterly shear associated with a middle- to upper-tropospheric cyclone over the subtropical east-central Atlantic. The strong shear inhibited any further development until a portion of the wave fractured and moved northwestward, placing it in a lighter-shear and more-diffluent environment on the northern side of the upper-level low by 2 October. Deep convection associated with the disturbance became organized into a smaller, quasi-circular mass, and a mid-level cyclonic circulation became evident in satellite imagery late that same day. Low-cloud lines on 3 October suggested the development of an elongated surface circulation, and an 0144 UTC ASCAT pass on 4 October showed that the system had tropical-storm-force winds. The circulation became sufficiently well-defined to mark the formation of a tropical storm around 0600 UTC that day about 460 n mi northeast of San Juan, Puerto Rico. The “best track” chart of Nicole’s path is given in Fig. 1, with the wind and pressure histories shown in Figs. 2 and 3, respectively. The best track positions and intensities are listed in Table 12.
Nicole moved northwestward along the southwestern edge of a low- to mid-level subtropical ridge on 4 and 5 October under very strong northwesterly shear. However, this shear was confined to a narrow layer at the top of the troposphere in association with the outflow of Hurricane Matthew, and Nicole managed to strengthen slightly while producing occasional bursts of deep convection. Nicole entered a col region on 6 October, and its motion came to a halt later that day. As the shear diminished, Nicole’s cloud pattern became better organized and more compact, and a period of rapid intensification began at 1200 UTC that day; the small tropical cyclone is estimated to have reached an intensity of 90 kt around 0000 UTC 7 October while centered about 285 n mi south of Bermuda. The intensification was abruptly interrupted, however, when a shortwave trough diving southeastward from the northeastern United States into the central Atlantic impinged on the cyclone’s circulation around this time, and produced a deeper layer of northerly shear. Nicole weakened as rapidly as it had strengthened, and the cyclone became a tropical storm by 1200 UTC 7 October.
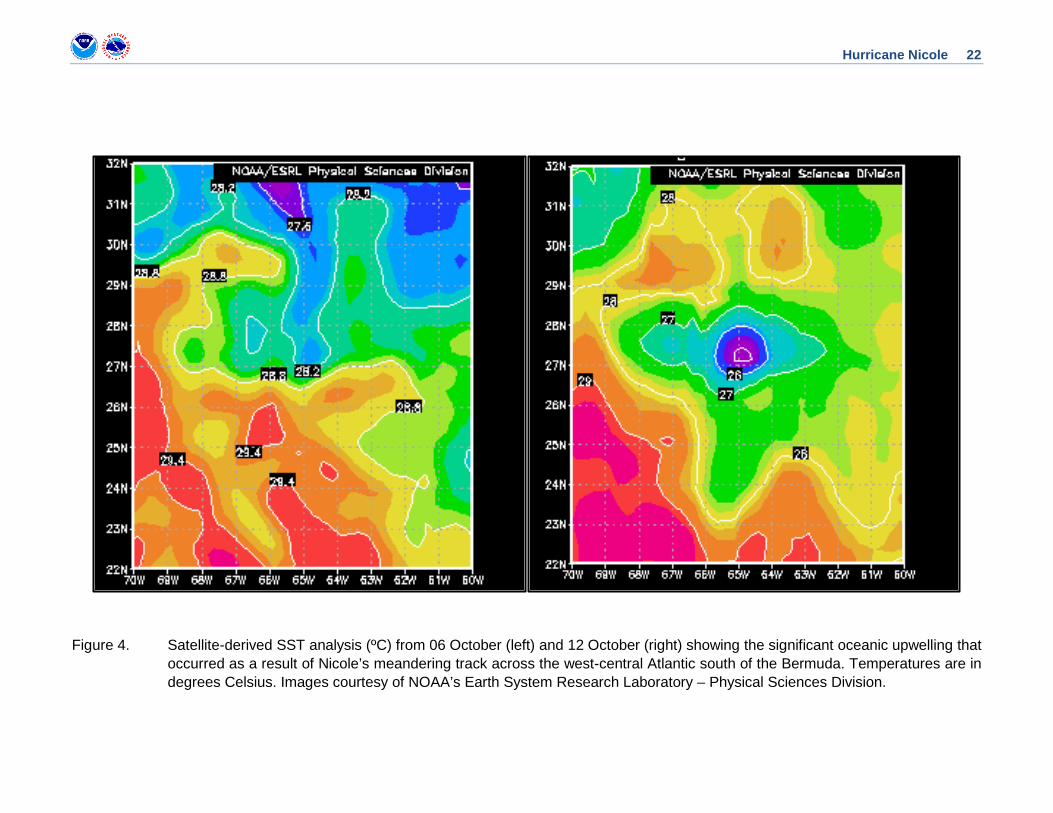
Over the next couple of days, the shortwave trough introduced dry mid- to upper-level air into Nicole’s circulation and that, along with continued northerly shear, inhibited intensification while a blocking high to the north of Nicole nudged the tropical cyclone slowly southward. A lobe of vorticity also fractured from the trough and wrapped around Nicole’s circulation. The cyclone’s circulation had expanded by late on 9 October, perhaps due to this interaction with the mid-latitude trough, and Nicole’s slow motion and larger wind field induced a broad region of oceanic upwelling. When the mid-level high slid from the north to the northeast of Nicole on 10 October, 2 A digital record of the complete best track, including wind radii, can be found on line at ftp://ftp.nhc.noaa.gov/atcf. Data for the current year’s storms are located in the btk directory, while previous years’ data are located in the archive directory.
Hurricane Nicole 3
a slow northward and north-northwestward motion commenced, which caused Nicole to move back over its previous track, producing even greater upwelling (Figure 4), with sea surface temperatures (SSTs) decreasing by 2º to 4ºC. The cooler waters, along with unfavorable atmospheric conditions, continued to impede intensification until Nicole moved away from the affected region by early on 11 October. Nicole reached hurricane intensity between 1200 and 1800 UTC 11 October while centered a few hundred n mi south-southwest of Bermuda. The shear decreased further while the cyclone was moving over record high sea surface SSTs of 29º to 30º C waters for that time of the year over the west-central Atlantic, and a microwave pass from around 1200 UTC that day showed a closed low-level ring of convection, typically a harbinger of rapid intensification. Indeed, Nicole rapidly strengthened into a major hurricane about 24 h later, while centered about 260 n mi south-southwest of Bermuda, and reached a peak intensity of 120 kt around 0600 UTC 13 October, when it was about 120 n mi southwest of the island.
Nicole then accelerated north-northeastward to northeastward as it approached Bermuda on 13 October, ahead of a mid-latitude trough moving through the northeastern United States. Nicole’s circulation had acquired a noticeable tilt by the time it passed over the island between 1400 and 1500 UTC in response to a sudden increase in southwesterly shear (Figure 5), and as a result, Nicole weakened below major hurricane strength by 1800 UTC that day. Deep-layer southwesterly 850—200-mb shear increased to about 50 kt in association with the trough while abundant dry air was wrapping around the circulation. Both of these factors caused the hurricane to rapidly weaken, and Nicole lost all of its central convection by around 0600 UTC 14 October. A negatively tilted shortwave trough, the second in a series, was nearing the cyclone from the northwest later that day, and the base of the trough fractured to the west of Nicole, merging with the tropical cyclone the following day. Baroclinic forcing associated with this feature resulted in profound structural changes to Nicole during the next 24 h to 48 h that resulted in Nicole’s acquiring some of the characteristics of a subtropical cyclone while it was centered several hundred n miles south of Newfoundland. A comma-shaped area of shallow-to-moderate convection developed on 15 October as the trough interaction caused Nicole to re-intensify, with a 1252 UTC 15 October ASCAT pass suggesting peak winds of about 75 kt. The cyclone’s wind field nearly doubled in size from 14 to 16 October, including its radius of maximum winds (RMW), which increased from around 40 to 65 n mi. Further discussion of Nicole’s structural evolution is presented in the next section.
The influence of the trough on Nicole began to diminish later on 15 October, and a ragged eye surrounded by disorganized shallow convection appeared the next day. Nicole turned east-northeastward to eastward while its forward speed decreased when the trough moved away and left it in a region of weak steering in the mid-latitude westerly flow. By 17 October, a large and well-defined eye had formed within a circular and relatively symmetric central dense overcast while centered about 500 n mi southeast of Cape Race, Newfoundland, indicating that Nicole had regained some of the tropical cyclone characteristics it had previously lost. Another trough moving through Atlantic Canada that day caused Nicole to accelerate northeastward, which brought it over progressively colder waters and into a cooler air mass, causing extratropical transition to begin. Nicole weakened to a tropical storm at 0000 UTC 18 October and became extratropical 6 h later while moving north-northeastward with increasing forward speed. The cyclone was absorbed by a larger extratropical storm forming over the far North Atlantic the next day several hundred n mi southeast of Greenland.
METEOROLOGICAL STATISTICS

Hurricane Nicole 4
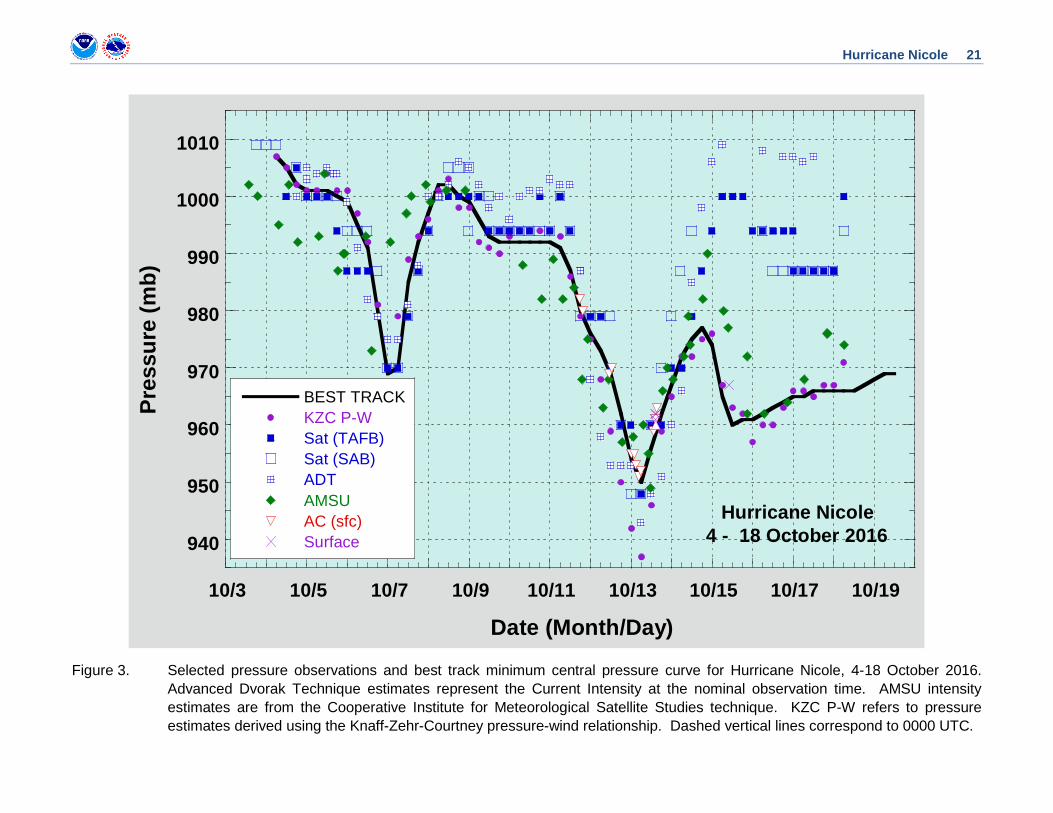
Observations in Nicole (Figs. 2 and 3) include subjective satellite-based Dvorak technique intensity estimates from the Tropical Analysis and Forecast Branch (TAFB) and the Satellite Analysis Branch (SAB), and objective Advanced Dvorak Technique (ADT) estimates from the Cooperative Institute for Meteorological Satellite Studies/University of Wisconsin-Madison. Observations also include flight-level, stepped frequency microwave radiometer (SFMR), and dropwindsonde observations from five flights of the 53rd Weather Reconnaissance Squadron of the U. S. Air Force Reserve Command. Data and imagery from NOAA polar-orbiting satellites including the Advanced Microwave Sounding Unit (AMSU), the NASA Global Precipitation Mission (GPM), the European Space Agency’s Advanced Scatterometer (ASCAT), and Defense Meteorological Satellite Program (DMSP) satellites, among others, were also useful in constructing the best track of Nicole.
Ship reports of winds of tropical storm force associated with Nicole are given in Table 3. Selected surface observations from Bermuda are given in Table 4.
Nicole’s estimated maximum intensity of 120 kt at 0600 UTC 13 October is based on a peak SFMR value of 118 kt at 0249 UTC.
Nicole’s northwestern eyewall passed over Bermuda on the morning of 13 October, generally producing category 1 hurricane conditions across the island; isolated areas observed sustained winds of category 2 strength. Figure 6 shows hourly radar imagery around the time Nicole struck Bermuda. A maximum 10-min mean wind of 76 kt was measured at Pearl Island in the west-central part of the island. The application of a gust factor to this wind observation suggests a peak 1-min wind of 84 kt (Harper 2009). A maximum 2-min wind of 72 kt was measured at the official site at the Bermuda Airport (TXKF). A maximum 1-min wind of 87 kt with gusts to 111 kt was measured atop Commissioner’s Point at an elevation of about 46 m, yielding a peak wind of 77 kt at 10 m (although the siting of the Commissioner’s Point observations makes its representativeness uncertain). The anemometer measuring these winds is not the same instrument present during the passages of Hurricanes Fay and Gonzalo two years before.
The lowest observed pressure on Bermuda was 960.2 mb at 1354 UTC on Pearl Island, located well west of Nicole’s wind center. Elsewhere, a 962.1 mb minimum pressure was measured at 1441 UTC at the L.F. Wade International Airport in Hamilton. There were several other reports of minimum pressures between 961 and 964 mb within about 20 to 30 minutes of this observation over the central and northeastern portions of the island. The winds at these sites backed from easterly and northeasterly before the storm to north or northwest after a relative lull inside the western part of the eye (Figure 7). However, the winds never backed to the southwest or south after the cyclone passed over Bermuda, indicating that Nicole’s wind center remained just to the east. Nicole is counted as a hurricane strike on Bermuda since the island was within the hurricane’s strike circle3. Figure 8 shows an image from an Air Force Hurricane Hunter aircraft inside the eye of Nicole as it passed over Bermuda.
The highest storm surge was 3.72 ft (1.13 m) measured by a NOAA tide gauge at St. George at 1630 UTC 13 October, but it occurred at low tide. The highest water was 1.28 ft (0.39
3 A circle of 125 n mi diameter, centered 125 n mi to the right of the hurricane center (looking in the direction of motion). This circle is meant to depict the typical extent of hurricane-force winds which are approximately 75 n mi to the right and 50 n mi to the left of the center.
Hurricane Nicole 5
m) above MHHW at 2148 UTC the same day, which suggests a maximum inundation of about a foot.
Very heavy rainfall occurred on Bermuda during Nicole’s passage, with much of it falling during a 6- to 12-h period. Rainfall accumulations of 6 to 9 inches were common, with some of the storm totals among the greatest measured on Bermuda in a tropical cyclone. Interestingly, a precipitable water value of 2.94 inches was derived from a sounding released in the eye of the cyclone, the highest precipitable water in Bermuda’s limited climatological data base that begins in 1973.
Long-period swells associated with the extensive wind field of Nicole propagated radially from the cyclone during its intensification phase as a subtropical cyclone to the southeast of Atlantic Canada, reaching coastal areas from Europe and Africa, the northern Caribbean Islands, and North America. No significant impacts from these swells was reported, however.
Operationally, Nicole was assessed to be a hurricane south of Atlantic Canada, even though it exhibited characteristics of a subtropical cyclone on 15 and 16 October. GOES-R Proving Ground Meteosat-10 Air Mass satellite imagery showed that the onset of these hybrid-storm characteristics coincided with a distinct ribbon of stratospheric air, or a tropopause fold, associated with the tail of the negatively titled trough wrapping around the south side of Nicole’s circulation (Figure 9), beginning late on 14 October. The cyclone’s satellite presentation took on the appearance of an extratropical storm on 15 October, with a well-defined baroclinic leaf and a trailing cold front seen in conventional satellite imagery. However, there was no evidence that the front was connected to the cyclone’s center or associated with the cyclone’s maximum winds. Figure 10 shows the evolution of Nicole’s cloud pattern around this time. Nicole’s interaction with the trough was coincident with a large expansion of the cyclone’s wind field, and an approximate doubling of the radius of maximum winds, at a time when the cyclone was maintaining only shallow to moderate convection. These characteristics suggest that baroclinic forcing was largely responsible for the intensification that occurred during this time. Florida State University phase space diagrams (not shown) and AMSU overpasses (Figure 11) indicate that, while Nicole’s warm core briefly weakened on 14 October due to strong shear, it became reinvigorated within 24 h due to the trough interaction. The cyclone’s center also remained embedded in a moist and relatively warm stream of air over anomalously warm SSTs. Nicole’s evolution resembles the development of an extratropical warm seclusion during the extratropical transition of a tropical cyclone as described in Molinari et al. (1995) and Hart et al. (2006), although the transition appears to have aborted early on 16 October. The spatial scale of the trough interacting with Nicole was of the same size of the tropical cyclone, and this match in scale can result in this type of outcome (Hart et al. 2006). Despite the effects of the trough interaction on the cyclone’s structure, Nicole’s status as a tropical cyclone is retained through this period since it maintained its warm core.
CASUALTY AND DAMAGE STATISTICS Nicole caused widespread damage on Bermuda. However, media accounts suggest that the damage was not severe, likely because of the short duration of strong winds and the well-constructed infrastructure on the island. The cyclone snapped trees, toppled power lines, peeled off roofs and flooded homes and businesses. In addition, large waves damaged and broke boats from their moorings and also contributed to road damage around the island. There were no reports

Hurricane Nicole 6
of casualties associated with Nicole. Insurance industry sources estimate total insured losses of $15 million, which matches preliminary qualitative accounts from the Bermuda Meteorological Service suggesting that the damage was less severe than that from Hurricanes Fay and Gonzalo of 2014.
FORECAST AND WARNING CRITIQUE
Nicole’s genesis was poorly forecast. Table 2 provides the number of hours in advance of formation associated with the NHC Tropical Weather Outlook (TWO) forecast in each likelihood category. Although the wave from which Nicole developed was introduced in the TWO 72 h prior to genesis, the genesis probabilities were not raised to the medium category (>40%) until 18 h before tropical cyclone formation. They were only raised to the high category (>60%) after genesis is estimated to have occurred in post-analysis. It was assumed that the high-shear environment in which Nicole’s precursor disturbance was embedded would make tropical cyclone formation unlikely. The GFS supported this line of thinking by showing at most a weak trough, and this feature was shown to weaken with time. Only 24 h prior to genesis did GFS solutions begin to indicate a possible tropical cyclone. Interestingly, the ECMWF model showed genesis occurring as much as four days before tropical cyclone formation.
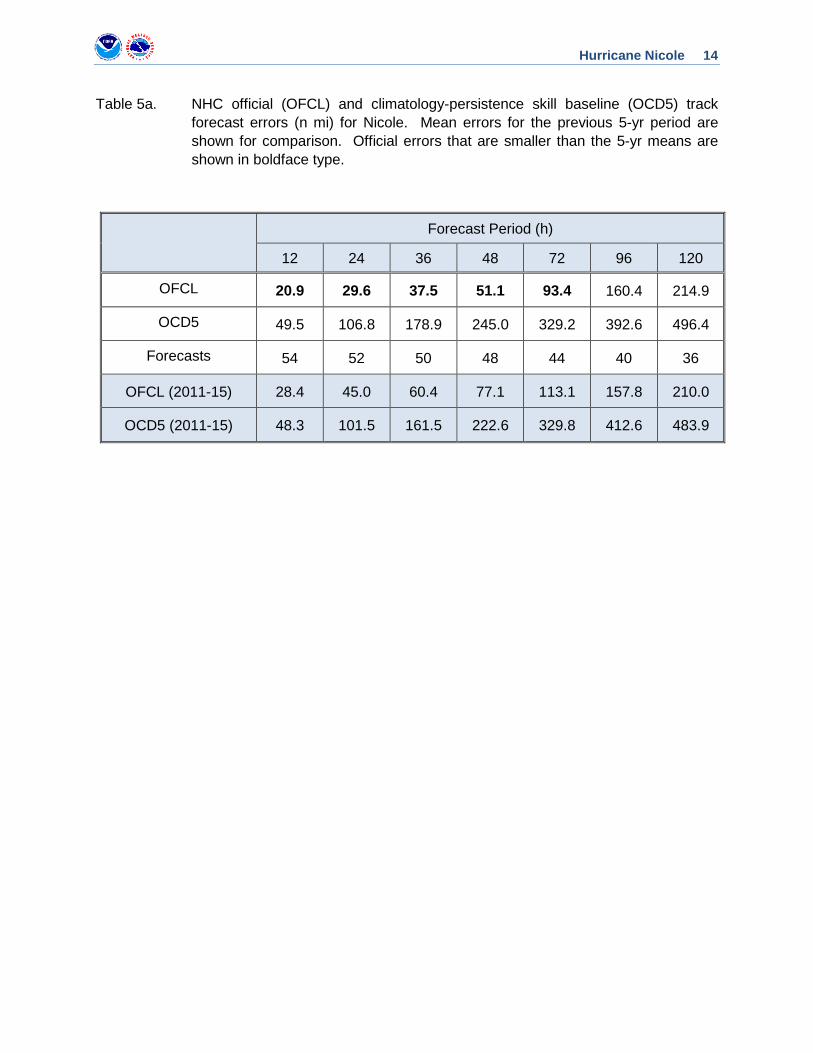
A verification of NHC official track forecasts for Nicole is given in Table 5a. Official forecast track errors were lower than the mean official errors for the previous 5-yr period through 72 h but were greater than these averages at 96 h and 120 h. Early forecasts anticipated that Nicole would move farther north and east before beginning a cyclonic loop, which resulted in several poor extended-range forecasts. A second group of large extended-range forecast errors occurred 11 and 12 October, when official forecasts erringly showed Nicole moving northeastward instead of east-northeastward. A homogeneous comparison of the official track errors with selected guidance models is given in Table 5b. The NOAA Corrected Consensus (HCCA) had an outstanding performance, beating all of the guidance and the official forecast. The Florida State Superensemble (FSSE) also had a good showing, as did the multi-model consensus (TVCA) and TCVX.
A verification of NHC official intensity forecasts for Nicole is given in Table 6a. Official forecast intensity errors were greater than the mean official errors for the previous 5-yr period through 36 h and again at 120 h. In the 48 h to 96 h time frame, however, the official forecasts outperformed the 5-year mean. The greater-than-average intensity forecast errors in the short range were almost entirely related to the failure to predict Nicole’s two periods of rapid intensification. A homogeneous comparison of the official intensity errors with selected guidance models is given in Table 6b. The only model that overall outperformed the official forecast was GHMI, although not at all forecast times. The intensity consensus aids and FSSE generally performed a little better in the 24 h to 36 h range than the official forecast, and CTCI performed well at 96 h and 120 h.
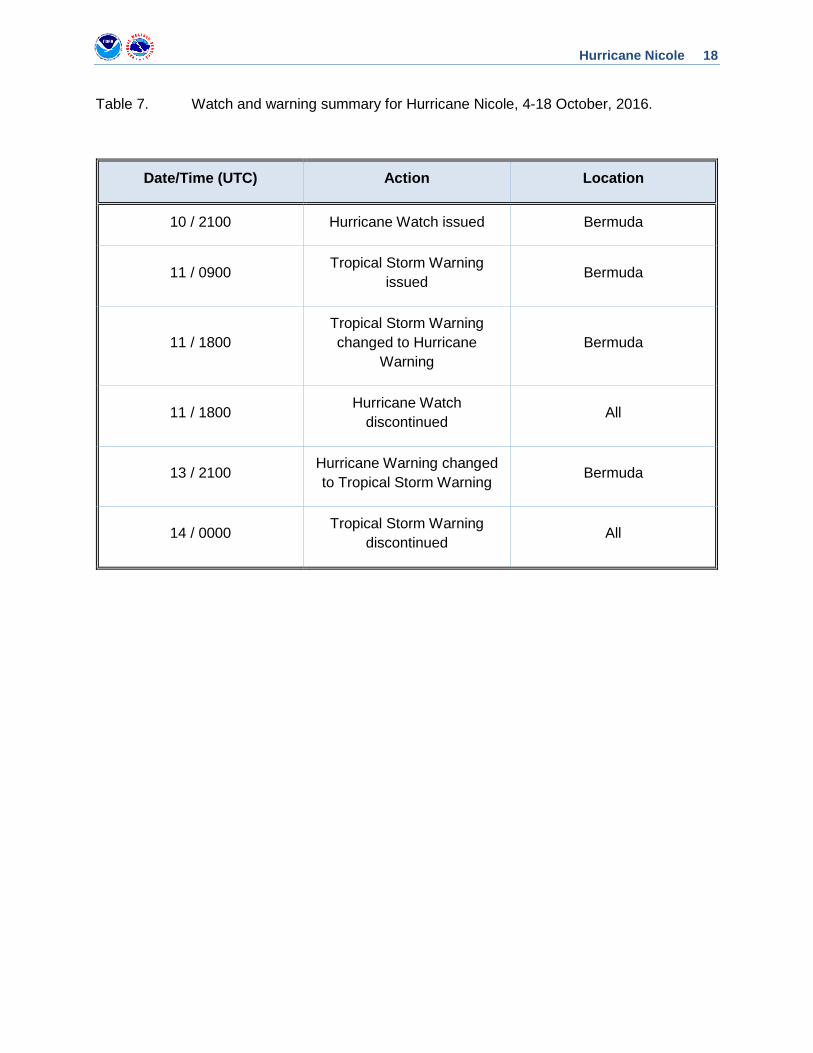
Watches and warnings associated with Nicole are given in Table 7. A hurricane watch was issued by the Bermuda Weather Service a little more than 60 h before the first tropical-storm-force winds began to affect the island, with a hurricane warning issued about 42 h before.
Hurricane Nicole 7
ACKNOWLEDGEMENTS
Thanks are extended to James Dodgson and Ian Currie of the Bermuda Weather Service for providing data and other information about impacts in Bermuda. Mike Folmer from the University of Maryland/ESSIC/CICS is recognized for providing GOES-R Proving Ground satellite imagery critical to the post-analysis of Nicole’s evolution over the North Atlantic, and Michael Brennan is thanked for retrieving these data for display. Several discussions with Dr. Robert Hart at the Florida State University and Dr. Lance Bosart at the State University of New York at Albany were useful in analyzing Nicole’s complex evolution after passing Bermuda.
REFERENCES Harper, B.A., J.D. Kepert, and J.D. Ginger, 2009: Guidelines for converting between
various wind averaging periods in tropical cyclone conditions. World Meteorological Organization, 52 pp.
Hart, R.E., J. L. Evans, and C. Evans, 2006: Synoptic composites of the extratropical transition life cyclone of North Atlantic tropical cyclones determining post-transition evolution. Mon. Wea. Rev., 134, 553-578.
Molinari, J., S. Skubis, and D. Vollaro, 1995: External influences on hurricane intensity, Part III. Potential vorticity structure. J. Atmos. Sci, 52, 3593-3606.

Hurricane Nicole 8
Table 1. Best track for Hurricane Nicole, 4 -18 October 2016
Date/Time (UTC)
Latitude (°N)
Longitude (°W)
Pressure (mb)
Wind Speed (kt) Stage
04 / 0600 23.2 59.8 1007 35 tropical storm
04 / 1200 23.5 60.3 1005 40 "
04 / 1800 23.8 60.7 1002 45 "
05 / 0000 24.1 61.2 1001 45 "
05 / 0600 24.4 61.7 1001 45 "
05 / 1200 24.7 62.5 1001 45 "
05 / 1800 25.1 63.3 1000 50 "
06 / 0000 25.7 63.9 999 50 "
06 / 0600 26.2 64.5 995 55 "
06 / 1200 26.7 64.8 991 60 "
06 / 1800 27.3 65.1 980 75 hurricane
07 / 0000 27.5 65.2 969 90 "
07 / 0600 27.6 65.2 970 75 "
07 / 1200 27.6 65.2 985 60 tropical storm
07 / 1800 27.2 65.3 992 55 "
08 / 0000 26.6 65.4 997 50 "
08 / 0600 26.0 65.5 1002 40 "
08 / 1200 25.5 65.6 1002 40 "
08 / 1800 25.0 65.7 1000 45 "
09 / 0000 24.6 65.6 999 45 "
09 / 0600 24.1 65.5 996 55 "
09 / 1200 24.0 65.4 993 55 "
09 / 1800 24.1 65.3 992 55 "
10 / 0000 24.3 65.2 992 50 "
10 / 0600 24.8 65.2 992 50 "
10 / 1200 25.4 65.2 992 50 "
10 / 1800 26.0 65.3 992 50 "
11 / 0000 26.5 65.5 992 50 "
11 / 0600 26.8 65.6 991 50 "
11 / 1200 27.1 65.8 987 60 "
11 / 1800 27.2 66.2 980 70 hurricane

Hurricane Nicole 9
Date/Time (UTC)
Latitude (°N)
Longitude (°W)
Pressure (mb)
Wind Speed (kt) Stage
12 / 0000 27.4 66.6 976 75 "
12 / 0600 27.6 66.8 973 85 "
12 / 1200 28.0 66.9 969 95 "
12 / 1800 28.7 66.8 962 105 "
13 / 0000 29.6 66.5 954 115 "
13 / 0600 30.6 66.2 950 120 "
13 / 1200 31.6 65.3 956 110 "
13 / 1500 32.3 64.7 959 105 "
13 / 1800 33.0 63.9 962 95 "
14 / 0000 34.0 62.1 967 85 "
14 / 0600 34.9 60.5 972 75 "
14 / 1200 35.6 58.9 975 70 "
14 / 1800 36.4 56.5 977 65 "
15 / 0000 37.2 54.2 974 65 "
15 / 0600 38.0 52.6 965 75 "
15 / 1200 38.7 51.1 960 75 "
15 / 1800 39.0 49.8 961 75 "
16 / 0000 39.3 48.7 961 75 "
16 / 0600 39.1 48.0 962 70 "
16 / 1200 38.9 47.2 963 70 "
16 / 1800 39.4 46.4 964 65 "
17 / 0000 40.1 45.8 965 65 "
17 / 0600 40.6 45.5 965 65 "
17 / 1200 40.9 45.1 966 65 "
17 / 1800 41.8 43.6 966 65 "
18 / 0000 43.5 41.9 966 60 tropical storm
18 / 0600 45.6 39.7 966 55 "
18 / 1200 49.0 38.5 966 55 extratropical
18 / 1800 53.0 38.5 967 50 "
19 / 0000 55.1 38.0 968 50 "
19 / 0600 57.0 37.0 969 50 "
19 / 1200 59.0 36.5 969 50 "
19 / 1800 absorbed

Hurricane Nicole 10
Date/Time (UTC)
Latitude (°N)
Longitude (°W)
Pressure (mb)
Wind Speed (kt) Stage
13 / 0600 30.6 66.2 950 120 minimum pressure and maximum winds

Hurricane Nicole 11
Table 2. Number of hours in advance of formation associated with the first NHC Tropical Weather Outlook forecast in the indicated likelihood category. Note that the timings for the “Low” category do not include forecasts of a 0% chance of genesis.
Hours Before Genesis
48-Hour Outlook 120-Hour Outlook
Low (<40%) 72 72
Medium (40%-60%) 18 18
High (>60%) - -
Table 3. Selected ship reports with winds of at least 34 kt for Hurricane Nicole, 4 – 18 October 2016.
Date/Time (UTC)
Ship call sign
Latitude
(°N)
Longitude
(°W) Wind
dir/speed (kt) Pressure
(mb)
11 / 0600 V7SX3 33.4 65.4 050 / 35 1015.2
11 / 1700 C6FT7 32.9 64.6 060 / 50 1015.1
11 / 1800 C6FT7 33.1 64.7 060 / 50 1016.0
11 / 1900 C6FT7 33.3 64.8 050 / 50 1016.0
14 / 0600 TCTX2 37.9 60.4 050 / 35 1010.0
Table 4. Selected surface observations for Hurricane Nicole, 4 – 18 October 2016.

Hurricane Nicole 12
Location and Elevation (m)
Minimum Sea Level Pressure
Maximum Surface Wind Speed
Total rain (in) Date/
time (UTC)
Press. (mb)
Date/ time
(UTC)a Sustained
(kt)b Gust (kt)
Bermuda L.F. Wade International Airport (15.2 m) (TXKF) (32.36N 64.68W)
13/1441 962.1 13/1354 72c 91 6.77
Commissioner’s Point (45.7 m) (32.329134N 64.832203W)
13/1341 87d 111
Harbour Radio (St. George’s) (88.4 m) (32.3803N 64.6825W)
13/1425 964.0 13/1625 82 103
Heliport (12.2 m) (32.358851N 64.704443W) 13/1614 64 89
Pearl Island (8 m) (32.291771, -64.837222) 13/1354 960.2 76 103
Cedarvale South (36 m) (VP9NI)
(32.299548, -64.760306) 13/1419 961.3 8.96
Weather Underground Smith’s Parish (42.6 m) (ISMITHSP2) (32.319N 64.743W)
13/1440 961.4
Chaingate Hill Devonshire (35 m) (IDEVONSH3) (32.307N 64.749W)
13/1435 962.1
Gilbert Hill Smith’s Parish (59.4 m) (ISMITHSP3) (32.311N 64.739W)
13/1432 961.1
Southhampton (ISOUTHAM86) 13/1424 971.3 13/1606 46 63 7.82
Hamilton (VP9NI) 13/1424 961.6 7.40 Bermuda Esso Pier (BEPB6) 13/1442 962.4 13/1400 50 58
Tucker’s Town (IHAMILT03) (32.326, -64.705)
13/1425 963.7 13/1348 31 47
Hinson Hall (ISAINTDA7) (32.323, -64.739)
13/1440 964.1
a Date/time is for sustained wind when both sustained and gust are listed. b Except as noted, sustained wind averaging periods for Bermuda official sites are 10 min; Weather Underground
sites have sustained wind averaging periods of 1 min.

Hurricane Nicole 13
c 2-min mean wind speed
d 1-min mean wind speed
Hurricane Nicole 14
Table 5a. NHC official (OFCL) and climatology-persistence skill baseline (OCD5) track forecast errors (n mi) for Nicole. Mean errors for the previous 5-yr period are shown for comparison. Official errors that are smaller than the 5-yr means are shown in boldface type.
Forecast Period (h)
12 24 36 48 72 96 120
OFCL 20.9 29.6 37.5 51.1 93.4 160.4 214.9
OCD5 49.5 106.8 178.9 245.0 329.2 392.6 496.4
Forecasts 54 52 50 48 44 40 36
OFCL (2011-15) 28.4 45.0 60.4 77.1 113.1 157.8 210.0
OCD5 (2011-15) 48.3 101.5 161.5 222.6 329.8 412.6 483.9

Hurricane Nicole 15
Table 5b. Homogeneous comparison of selected track forecast guidance models (in n mi) for Nicole. Errors smaller than the NHC official forecast are shown in boldface type. The number of official forecasts shown here will generally be smaller than that shown in Table 4a due to the homogeneity requirement.
Model ID Forecast Period (h)
12 24 36 48 72 96 120
OFCL 17.1 25.5 35.3 47.2 89.8 155.3 202.5
OCD5 42.8 101.7 170.8 234.7 324.7 366.2 433.1
GFSI 20.0 28.5 37.1 47.1 106.7 181.2 262.7
GHMI 18.8 32.6 47.7 70.9 144.4 212.2 321.0
HWFI 20.8 30.2 42.2 58.5 105.8 201.3 340.2
EGRI 20.2 30.8 43.7 59.5 111.8 207.7 315.9
EMXI 19.3 33.7 54.7 74.5 123.6 170.0 233.0
CMCI 27.7 44.3 62.2 83.2 151.8 217.0 288.5
NVGI 27.1 49.4 71.3 99.0 160.7 241.5 336.5
CTCI 20.7 35.0 47.6 69.2 115.0 168.6 254.2
GFNI 22.0 43.1 67.3 93.0 166.8 282.8 377.0
AEMI 21.5 34.8 47.8 62.4 125.1 197.1 242.0
HCCA 16.3 23.1 31.7 42.4 78.8 136.1 184.5
FSSE 17.9 24.2 31.2 43.0 75.5 138.4 207.4
TVCX 16.4 24.7 33.7 44.0 77.2 138.2 211.2
GFEX 18.2 29.1 41.7 54.0 96.5 152.4 212.0
TVCA 17.0 23.6 32.2 42.2 77.1 146.1 223.1
BAMS 61.4 126.4 188.5 252.1 361.2 467.9 624.8
BAMM 33.5 65.5 92.0 111.9 161.3 237.1 321.4
BAMD 51.4 100.6 150.6 191.4 276.4 387.2 502.7
Forecasts 40 40 40 40 37 35 28

Hurricane Nicole 16
Table 6a. NHC official (OFCL) and climatology-persistence skill baseline (OCD5) intensity forecast errors (kt) for Nicole. Mean errors for the previous 5-yr period are shown for comparison. Official errors that are smaller than the 5-yr means are shown in boldface type.
Forecast Period (h)
12 24 36 48 72 96 120
OFCL 7.1 10.8 12.6 12.2 11.9 14.3 17.4
OCD5 9.8 14.8 18.7 18.7 18.5 18.6 19.3
Forecasts 54 52 50 48 44 40 36
OFCL (2011-15) 6.2 9.4 11.5 13.3 14.6 14.6 15.8
OCD5 (2011-15) 7.3 10.8 13.3 15.3 17.7 17.8 17.6

Hurricane Nicole 17
Table 6b. Homogeneous comparison of selected intensity forecast guidance models (in kt) for Hurricane Nicole. Errors smaller than the NHC official forecast are shown in boldface type. The number of official forecasts shown here will generally be smaller than that shown in Table 5a due to the homogeneity requirement.
Model ID Forecast Period (h)
12 24 36 48 72 96 120
OFCL 8.4 12.0 14.0 12.4 11.8 14.3 16.7
OCD5 10.4 15.5 19.9 19.0 19.1 19.0 20.2
HWFI 10.6 13.4 16.0 18.0 16.3 15.4 17.2
GHMI 9.4 11.4 12.2 12.3 12.5 13.3 13.9
DSHP 8.9 11.8 15.0 15.0 13.2 15.6 18.5
LGEM 9.6 13.9 17.7 18.4 18.7 25.2 32.4
ICON 9.0 11.7 14.1 14.3 13.1 14.9 18.5
IVCN 9.0 11.5 13.4 13.6 12.9 14.2 16.9
GFNI 10.8 13.4 14.7 14.2 17.7 21.2 27.7
CTCI 9.8 13.3 14.0 16.0 14.4 13.2 12.5
GFSI 10.9 15.3 18.1 18.6 17.7 19.6 19.8
EMXI 10.8 16.4 19.3 20.1 20.3 20.7 20.1
FSSE 8.6 10.2 12.1 13.4 15.0 19.3 24.9
HCCA 9.0 11.9 14.3 15.1 14.8 17.5 22.2
Forecasts 41 41 41 41 38 37 33
Hurricane Nicole 18
Table 7. Watch and warning summary for Hurricane Nicole, 4-18 October, 2016.
Date/Time (UTC) Action Location
10 / 2100 Hurricane Watch issued Bermuda
11 / 0900 Tropical Storm Warning issued Bermuda
11 / 1800 Tropical Storm Warning changed to Hurricane
Warning Bermuda
11 / 1800 Hurricane Watch discontinued All
13 / 2100 Hurricane Warning changed to Tropical Storm Warning Bermuda
14 / 0000 Tropical Storm Warning discontinued All
Hurricane Nicole 19
Figure 1. Best track positions for Hurricane Nicole, 4-18 October, 2016.

Hurricane Nicole 20
Figure 2. Selected wind observations and best track maximum sustained surface wind speed curve for Hurricane Nicole, 4-18 October 2016. Aircraft observations have been adjusted for elevation using 90%, 80%, and 80% adjustment factors for observations from 700 mb, 850 mb, and 1500 ft, respectively. Dropwindsonde observations include actual 10 m winds (sfc), as well as surface estimates derived from the mean wind over the lowest 150 m of the wind sounding (LLM). Advanced Dvorak Technique estimates represent the Current Intensity at the nominal observation time. AMSU intensity estimates are from the Cooperative Institute for Meteorological Satellite Studies technique. Dashed vertical lines correspond to 0000 UTC.
2030405060708090
100110120130140150160
10/3 10/5 10/7 10/9 10/11 10/13 10/15 10/17 10/19
BEST TRACKSat (TAFB)Sat (SAB)ADTAC (sfc)AC (flt->sfc)AC (DVK P->W)ScatterometerDrop (sfc)Drop (LLM xtrp)AMSU
Win
d Sp
eed
(kt)
Date (Month/Day)
Hurricane Nicole4 - 18 October 2016
Hurricane Nicole 21
Figure 3. Selected pressure observations and best track minimum central pressure curve for Hurricane Nicole, 4-18 October 2016. Advanced Dvorak Technique estimates represent the Current Intensity at the nominal observation time. AMSU intensity estimates are from the Cooperative Institute for Meteorological Satellite Studies technique. KZC P-W refers to pressure estimates derived using the Knaff-Zehr-Courtney pressure-wind relationship. Dashed vertical lines correspond to 0000 UTC.
940
950
960
970
980
990
1000
1010
10/3 10/5 10/7 10/9 10/11 10/13 10/15 10/17 10/19
BEST TRACKKZC P-WSat (TAFB)Sat (SAB)ADTAMSUAC (sfc)Surface
Pres
sure
(mb)
Date (Month/Day)
Hurricane Nicole4 - 18 October 2016
Hurricane Nicole 22
Figure 4. Satellite-derived SST analysis (ºC) from 06 October (left) and 12 October (right) showing the significant oceanic upwelling that occurred as a result of Nicole’s meandering track across the west-central Atlantic south of the Bermuda. Temperatures are in degrees Celsius. Images courtesy of NOAA’s Earth System Research Laboratory – Physical Sciences Division.

Hurricane Nicole 23
Figure 5. Series of 85- and 91-GHz microwave images showing the evolution of Nicole’s cloud pattern as it approached and passed Bermuda from 12 to 13 October. Images courtesy of the Naval Research Lab in Monterrey.

Hurricane Nicole 24
Figure 6. Series of hourly radar images showing the eye of Hurricane Nicole passing over Bermuda on 13 October. The red cross in each image marks the radar site. Images courtesy of the Bermuda Weather Service.

Hurricane Nicole 25
Figure 7. Trace showing wind gusts in kt (red) and wind direction (green), on the eastern end of the runway at the L.F. Wade International Airport, Bermuda, on 13 October. Image courtesy of Bermuda Weather Service.

Hurricane Nicole 26
Figure 8. The eye of Hurricane Nicole passing over Bermuda, as seen from a WC-130J Hurricane Hunter aircraft of the U.S. Air Force Reserve 53rd Weather Reconnaissance Squadron. Photo courtesy of Leesa Forelich.

Hurricane Nicole 27
Figure 9. GOES-R Proving Ground RGB air mass satellite imagery at 6-hourly time intervals from 1515 UTC 14 October through 2115 UTC 15 October (from top-left to bottom-right). Regions of red correspond to very dry mid- to upper-level air, likely of stratospheric origin. Regions of blue represent relatively cold or dry air, while green indicates warm or moist areas. Imagery courtesy of NASA’s Short-term Prediction Research and Transition Center (SPoRT).

Hurricane Nicole 28
Figure 10. Series of visible GOES-E satellite images showing the transformation of Hurricane Nicole into a subtropical cyclone over the North Atlantic, followed to a transition back to a hurricane. Images are as follows: (a) 1245 UTC 14 October, (b) 1845 14 October, (c) 1245 UTC 15 October, (d) 1845 UTC 15 October, (e) 1245 UTC 16 October, (f) 1845 UTC 16 October, (g) 1245 UTC 17 October, and (h) 1845 UTC 17 October.
a b c d
e
f
g
h

Hurricane Nicole 29
Figure 11. Series of AMSU cross sections over Hurricane Nicole from 14 to 16 October 2016: a) 0741 UTC 14 October, b) 2111 UTC 14 October, c) 2047 UTC 15 October, d) 0639 UTC 16 October, and e) 2029 UTC 16 October. Images courtesy of UW-CIMSS.
a
b
c
d
e