hvdc transmission senior capstone projectpdx.edu/power-lab/sites/ · 2013-09-03 · hvdc...
TRANSCRIPT

HVDC Transmission PSU-ECE POWER Engineers
0
HVDC Transmission Senior Capstone Project
Portland State University
Maseeh College of Engineering & Computer Science
Department of Electrical & Computer Engineering
Crystal Eppinger
Andrew Gao
Christopher Kulink
Brandon Valentine
Nicole Zimmerman
June 3rd, 2013

HVDC Transmission PSU-ECE POWER Engineers
1
Table of Contents
Introduction ...........................................................................................................................5
Line Commutated Converters ............................................................................................... 6
Line Commutated Converters Introduction ......................................................................... 6 12 Pulse Configuration of Thyristor Valves ............................................................................7
DC Voltage Components .................................................................................................................. 9
Inverter Operation ........................................................................................................................... 10
Commutation Failure ...................................................................................................................... 10
Harmonic Elimination .......................................................................................................... 11 AC Harmonics ................................................................................................................................... 11
DC Harmonics .................................................................................................................................. 14
Bipolar Configuration .......................................................................................................... 14 Reactive Power Support ....................................................................................................... 15
STATCOMs ....................................................................................................................................... 16
Static Var Compensators ................................................................................................................. 16
Synchronous Compensators ........................................................................................................... 17
Converter Control ................................................................................................................ 17 Firing Angle and Tapchanger Control ........................................................................................... 18
Reliability .............................................................................................................................20 Protection .............................................................................................................................20 Capacitor Commutated Converters ..................................................................................... 21 Conclusion ............................................................................................................................ 22 Line Commutated Converters References ........................................................................... 23 Voltage Source Converters ................................................................................................... 25
Voltage Source Converters Introduction ............................................................................. 25 VSCs ...................................................................................................................................... 25 IGBTs .................................................................................................................................... 26 Control Systems.................................................................................................................... 29 STATCOMs ............................................................................................................................ 32 Protection ............................................................................................................................. 32 Black Start ............................................................................................................................ 34 Cooling ................................................................................................................................. 35 HVDC configurations ........................................................................................................... 36
Monopole......................................................................................................................................... 36
Bipole ............................................................................................................................................... 36

HVDC Transmission PSU-ECE POWER Engineers
2
Homopole .........................................................................................................................................37
Back-to-back ....................................................................................................................................37
Multi-terminal ................................................................................................................................. 38
Advantages ........................................................................................................................... 38 Disadvantages ...................................................................................................................... 39 Past and Current VSC Projects ............................................................................................. 39 Operational Information ..................................................................................................... 41 Conclusion ............................................................................................................................ 42 Voltage Source Converter References .................................................................................. 42 Transmission ........................................................................................................................ 43
Transmission Introduction .................................................................................................. 43 Line Design .......................................................................................................................... 46
Bipolar vs. Monopolar .................................................................................................................... 46
Clearances ........................................................................................................................................ 47
Right of Way .................................................................................................................................... 49
Earth Electrodes ................................................................................................................... 50 Introduction to Earth Electrodes................................................................................................... 50
Design Considerations of Ground Electrodes ............................................................................... 51
Physical Configurations of Ground Electrodes ............................................................................ 52
Electrolytic Corrosion ..................................................................................................................... 54
Touch/Step Potential .......................................................................................................................55
Other Issues due to Earth Electrodes .............................................................................................55
Insulation ............................................................................................................................. 58 Insulator Materials .......................................................................................................................... 59
Leakage distances ........................................................................................................................... 60
Temporary Overvoltages and Lightning Performance ................................................................. 61
Flashover Performance and Contamination ................................................................................. 62
Flashover Performance at High Altitudes..................................................................................... 65
Corona ................................................................................................................................. 68 Introduction to Corona Discharge ................................................................................................ 68
Consequences of Corona ................................................................................................................ 70

HVDC Transmission PSU-ECE POWER Engineers
3
Corona and Audible Noise .............................................................................................................. 71
Field Effects of HVDC Transmission .................................................................................... 73 Introduction to E&M Fields ............................................................................................................73
Introduction to Electric & Magnetic Fields ...................................................................................73
The Effects of Electric Fields .......................................................................................................... 74
Radio Interference Generated by Electric Fields .......................................................................... 75
Transmission References ..................................................................................................... 77 Wind Power Plants .............................................................................................................. 80
Wind Power Plants Introduction ........................................................................................ 80 Traditional Power Generation vs. Wind Power Generation ............................................... 80 General Wind Turbine Topics .............................................................................................. 82
Wind Turbine Size .......................................................................................................................... 82
Square-Cubed Law .......................................................................................................................... 83
Betz’s Limit ...................................................................................................................................... 83
Cut-In, Rated Output and Cut-Out Speeds .................................................................................. 83
Power Control ................................................................................................................................. 84
Materials .......................................................................................................................................... 85
Wind Turbine Generator Types ........................................................................................... 86 Squirrel Cage Induction Generator (Type 1) ................................................................................. 86
Wound Rotor Induction Generator (Type 2) ............................................................................... 87
Doubly-Fed Induction Generator (Type 3) ................................................................................... 88
Full Conversion (Type 4) ................................................................................................................ 90
Synchronous Generator (Type 5).................................................................................................... 91
Collection System ................................................................................................................. 92 Feeder Topology.............................................................................................................................. 92
Turbine Step-Up Transformer ....................................................................................................... 94
System Stability .................................................................................................................... 95 Flicker .............................................................................................................................................. 95
Low Voltage Ride-Through ............................................................................................................ 96

HVDC Transmission PSU-ECE POWER Engineers
4
Short Circuit Behavior .................................................................................................................... 96
Control Interactions ............................................................................................................. 97 Reactive Power and Power Factor ................................................................................................. 97
Static VAR Compensators .............................................................................................................. 98
STATCOMs ...................................................................................................................................... 98
Conclusion ........................................................................................................................... 99 Wind Power Plants References ........................................................................................... 99 System Modeling ................................................................................................................ 102
System Modeling Introduction .......................................................................................... 102 Wind Turbine Modeling ..................................................................................................... 102 Modeling Requirements .................................................................................................... 103 Modeling Methodology ...................................................................................................... 104 HVDC Modeling.................................................................................................................. 106 Interaction Studies ............................................................................................................. 106 Fault Analysis ..................................................................................................................... 108 Conclusion .......................................................................................................................... 109

HVDC Transmission PSU-ECE POWER Engineers
5
Introduction
High Voltage Direct Current (HVDC) transmission is the optimal choice for moving power over
long distances due to lower transmission line costs, decreased right of way, and lower power
losses than for equivalent AC lines. Since wind generation is often located far from load centers,
HVDC is the ideal choice. Not only is direct current transmission chosen for economic reasons it
is also advantageous when interconnecting asynchronous systems, bypassing network congestion,
and increasing power flow through constricted transmission corridors without negative impacts
on reliability. This paper offers a brief introduction to the various system components of an
HVDC system and the inner workings of a wind power plant, as well as a case study of a proposed
3200MW, ±600KV intertie.
Most common HVDC systems utilize line-commutated converters (LCCs) as a means of
rectification. While they are the most frequently used choice for large power systems they are not
without their problems. This paper addresses both the advantages and disadvantages of this
mature converter technology. In contrast, voltage source converters (VSCs) are a relatively new
technology that is gaining popularity, especially in off-shore wind farms and other underground
cable installations. AC and DC transmission differs due to fundamental differences in the signal
being carried on the line. The relatively static electric field generated by a DC transmission line
creates different local conditions than that of an AC line, requiring new considerations in regards
to design operation, and the environment. These and other issues related to transmission are
discussed. Due to the ever increasing demand for power and the growing concern surrounding
carbon-based fuels, alternative means of generation are being pursued. One scheme that has seen
large growth is wind power generation. This paper discusses collection system topologies,
generator types and control interactions of wind generation. Finally, a case study which analyzes
various interconnect scenarios is presented. Each model, created in PowerWorld, represents a
potential solution.
By no means is this a comprehensive overview of HVDC topics. However, it offers the reader a
basic understanding of the significant matters associated with direct current transmission.

HVDC Transmission PSU-ECE POWER Engineers
6
Line Commutated Converters
Line Commutated Converters Introduction
Line Commutated Converters have been in use since the 1972, Canada-Eel River project; a 320
MW converter station which connects to the 230KV AC systems of Hydro-Quebec and NB Power
[1]. They are the conversion technology of choice for over 100 HVDC projects and are utilized in
the largest power transmission projects in the world such as the 2010, Xiangjiaba-Shanghai HVDC
system; a 6400 MW, ±800KV system that stretches over 1200 miles [2].
These highly reliable converters use thyristors; which are bipolar, switching devices that are
configured into elements named valves. They are most commonly constructed of two 3-phase
Graetz bridge rectifiers connected in series to form a 12-pulse bridge. Each 12-pulse bridge
contains 12 thyristors and a valve is built from as many elements as necessary to achieve the
desired voltage. A 12 pulse bridge will result in 12 switching operations per cycle and generate
harmonics of both 12n and 12n±1.
The term line-commutated refers to the line voltage of the AC system that the converter is
connected to which creates the commutations from one valve pair to the next. LCCs cannot
operate without a relatively strong, synchronous voltage source. They are considered to be
current-source converters because they behave as such on the AC side, injecting both harmonics
and grid frequencies. LCCs are constant current devices and as a result the current direction
cannot be changed. The only way to change the power flow is to reverse the polarity of the voltage
at the DC stations.
LCCs are incredibly reliable and their documented losses are now as low as .6 to .75% [3]. The
individual failure rates within a converter station are only 1-2 thyristors per year [4]. However,
they are not without their drawbacks. Areas of concern are reactive power consumption,
sensitivity to connected AC networks, harmonics generation and susceptibility to commutation
failures all of which are discussed in the following sections.

HVDC Transmission PSU-ECE POWER Engineers
7
12 Pulse Configuration of Thyristor Valves
The basic building block for HVDC conversion is a thryristor, a bipolar switching device which
functions similarly to a diode. Like a diode, it permits current flow in only one direction.
However the thyristor has an additional input, called the “gate” which acts as a supplementary
means of control. To turn on, the thyristor requires a positive forward voltage (positive potential
at the anode with respect to cathode) as well as a pulse present at the gate terminal. It will
continue to conduct as long as the there is a positive forward voltage. The thyristor will turn off
when the current goes to zero; which occurs each cycle in a line-commutated converter system.
When power flows from the AC side to DC side the valve is referred to as a rectifier. When it
flows from DC to AC, it is called an inverter. The term valve itself is used to describe a
series/parallel combination of thyristors. It is preserved from the days when mercury-arc valves
were used in rectification.
Figure 1.1 Simplified Twelve Pulse Converter Bridge Diagram [5]
Two valves are connected to the phase terminals; one is connected to the anode and the other to
the cathode. As the AC sinusoidal wave oscillates, the anode of one valve pair becomes forward-

HVDC Transmission PSU-ECE POWER Engineers
8
biased and begins to conduct. When the anode is no longer positive with respect to the cathode it
will stop conducting. The proceeding phase voltage will then become positive and the following
valve pair will be forward-biased and thus begin conducting current. The valves will continue to
act as switches, each successive conducting pair operating throughout the oscillation of the
associated AC network sine wave. Each valve will carry the full value of the current for one third
of each cycle and two valves will always be conducting in series. The end result of this process is a
“DC” output voltage with a ripple.
Figure 1.2 Switching Pattern of a Six Pulse Current [5]
If the two bridges have an applied voltage with a 30° phase difference between them it will
decrease the variation between the applied AC voltage and the average DC voltage as well as
reduce the harmonics produced by the converter. This phase difference is easily introduced by

HVDC Transmission PSU-ECE POWER Engineers
9
connecting one bridge through a wye connected transformer and the second bridge through a
delta connected transformer.
DC Voltage Components
The addition of the wye-delta connected converter transformer contributes a commutating
reactance, called . When current commutates from one valve to the next it cannot do so
instantaneously. This is because some of the current from the previously conducting valve is
flowing in the inductance of the transformer when the successive valve begins operation. As a
result there is an overlap period.
The period of time between when the previously conducting valve turns off and the conducting
valve turns on is called the overlap period, µ and it is expressed in units of degrees. There are four
types of overlap modes: single, double, triple, and quadruple. If the overlap angle is less than 30°
than it is considered in single overlap mode and commutation in the upper half of the bridge
completes prior to commutation in the lower half. Double overlap mode describes a phenomenon
in which commutations simultaneously occur and three or four valves may be conducting at a
given time. The table below provides information on the triple and quadruple overlap modes.
Figure 1.3 Operating Modes of Thyristor Valves [5]
The amplitude of the DC voltage can be controlled by adjusting the firing angle. The “firing” or
“trigger” angle refers to the time delay from which the voltage across a valve becomes positive and
the thyristors are turned on and begin conducting. The firing angle is commonly referred to as α,
and is expressed in units of degrees. As the firing angle increases the DC voltage decreases. An
angle of 90° will result in a DC voltage of zero amplitude and an angle of 0° will result in the

HVDC Transmission PSU-ECE POWER Engineers
10
maximum DC voltage. Firing angle control regulates the DC voltages of both ends of the HVDC
system in order to obtain the desired power transfer.
All of the previously discussed components associated with the thyristor based valve contribute to
the amplitude of the DC voltage. The output voltage can be mathematically described as a
relationship between the commutating reactance, firing angle, direct current and line voltage by
[5]:
(
)
Where:
= the line to line input voltage of the AC system
= firing angle of the thyristor
= the commutating reactance
= the direct current
Inverter Operation
In inverter operation the firing angle exceeds 90° and is more commonly known as the extinction
angle. The extinction angle, , refers to the time after the overlap period when the recently
extinguished valve becomes positive again. It is expressed mathematically as [4]:
During inverter operation the voltage at the terminals will be negative. This poses a problem since
current cannot change direction in a thyristor. Consequently, inverter operation requires a
separate current source for power flow to occur.
Commutation Failure
If two valves that are connected to identical phases conduct current at the same time a short
occurs in the circuit. This happens when a valve in one half of the bridge fails to turn off
completely. It will begin conducting again and current will cease to commutate to the successive
valve. A commutation failure refers to the short circuit that ensues when the valve in the opposite

HVDC Transmission PSU-ECE POWER Engineers
11
half of the bridge that is connected to the same phase begins conducting. Commutation failures
require control action.
Figure 1.4 Commutation Failure Circuit Diagram [5]
Harmonic Elimination
Harmonics are of great concern in the HVDC converter stations and the converters are just one
cause of harmonic distortion. Other contributors to harmonic distortion are rectifiers, drives,
lighting, power equipment and large industrial loads. Effects of harmonic distortion are not
limited to but can include the overloading of capacitor banks, overheating of electrical machines,
and interference with both electronic and telecommunication systems. These effects are of grave
concern primarily on the AC side due to its delivery to consumers. A filters purpose is two-fold: to
reduce the harmonic distortion as a result of the 12-pulse converters and to supply reactive power.
AC Harmonics
Harmonics present in the converter station are generally:
This is due to the 12 pulse bridge configuration of the thyristor valves and the 12 switching
operations per cycle. Consequently, the harmonics of concern when designing filters for the AC
side are the 11th, 13th, 23rd, 25th, 35th, 37th, 47th, and 49th [6].

HVDC Transmission PSU-ECE POWER Engineers
12
There are four commonly used AC filter types: the single-tuned band-pass filter, high pass filter,
double-tuned band-pass filter and the C-type filter. Most commonly the filters are passive but on
rare occasion an active filter will be used.
A single-tuned filter, also referred to as a band pass filter is
generally used for the 11th and the 13th order harmonics. It is
referred to as “tuned” because it is designed to attenuate for a
specific frequency rather than a range. Characteristics
associated with this filter type are a high Q factor and as a
result low damping. These filters consist of a series RLC circuit
with a small resistance. Both the losses and maintenance
associated with this circuit are low.
Figure 1.5 One possible variation of a Single-tuned Filter, designed with parallel capacitance [5]
The double-tuned filter is generally tuned to
the 12th, 24th and the 36th harmonics. Double-
tuned filters function like two single-tuned
filters. They consist of a single tuned filter in
series with the parallel combination of a RLC
circuit. They have lower losses than single
tuned filters, reduce the number of high
voltage capacitors needed and help to
decrease the number of filters necessary
since they are tuned to attenuate multiple
harmonics.
Figure 1.6 Double-tuned Filter [5]

HVDC Transmission PSU-ECE POWER Engineers
13
A broadband filter (high pass filter) is used
for all higher order harmonics from the 23rd
on. These filters have a low Q factor and
high damping. The circuit which
characterizes this filter is a capacitor in
series with a parallel combination of an
inductor and resistor. This circuit can
attenuate over a wide spectrum of harmonics
and is low maintenance but has higher losses
than tuned filters.
Figure 1.7 High Pass Filter [5]
Finally, the C-type filter is used for all low
order filtering, such as the 3rd, 5th, and the 7th
harmonic. This filter consists of a capacitor
in series with a parallel combination of a
series capacitor / inductor and a resistor.
The C-type filter achieves its dampening by
forcing currents with higher than
fundamental harmonics to travel through
the resistor. As a result losses associated with
the fundamental frequency remain low.
Figure 1.8 C-type Filter [5]
The requirements for filter design on the AC side are the reactive power needs and the calculated
harmonic currents. The reactive power needs of the converter station also determine the size of
the filter banks.

HVDC Transmission PSU-ECE POWER Engineers
14
DC Harmonics
There is still concern of the effects of harmonics on the DC side, primarily interference with the
telecommunication systems [5]. Harmonics on the DC side are generally described as:
Therefore the harmonics of concern are the 12th, 24th, 36th and 48th. Filters commonly used are the
double-tuned filter for the 12th and 24th harmonic and the triple-tuned filter, tuned to the 12th, 24th
and 36th harmonic. The triple tuned filter is a parallel combination of a single-tuned filter and two
doubly-tuned filters.
Figure 1.9 Triple-tuned Filter [5]
The information required to design filters on
the DC side are the harmonic voltages which
are injected into the line, the performance
and the requirements for different operating
conditions. The harmonic voltages can be
found at each point on the line with the
knowledge of the DC line impedance and the
station equipment impedance. The
performance requirements can be found
with the sum of the harmonic currents and
the telecommunications interference. The
operating conditions include general bipolar
operation but also must account for possible
monopole operation with ground return.
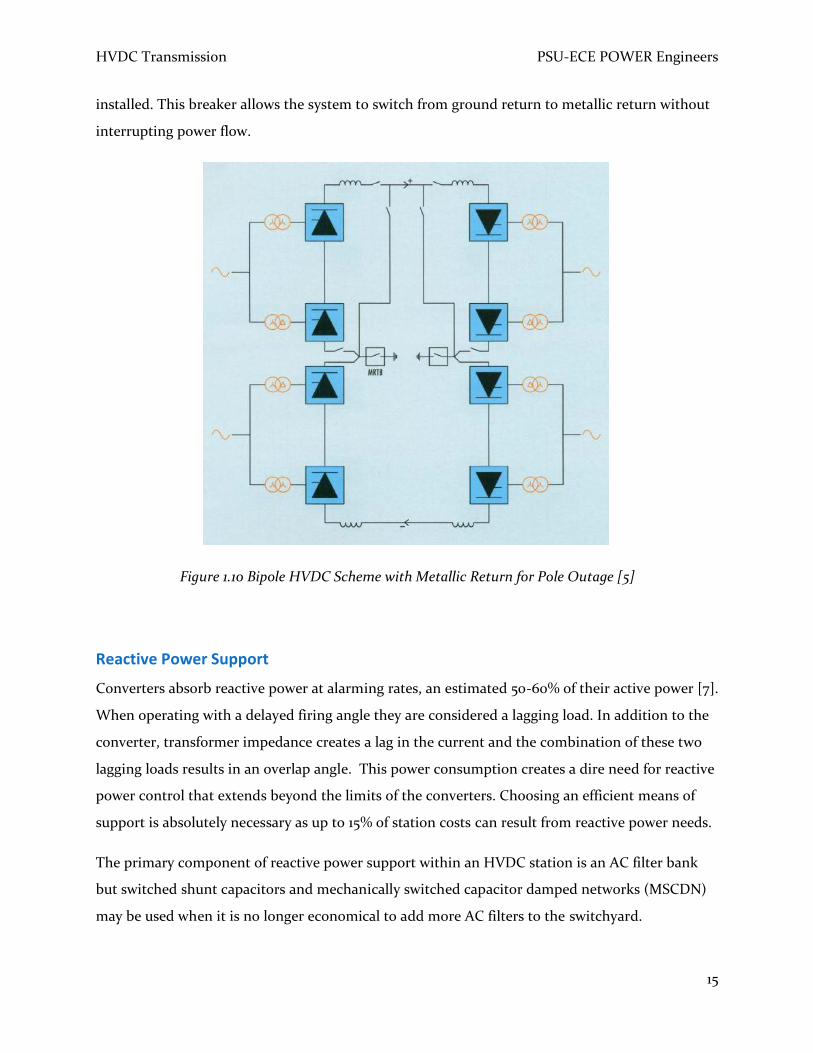
Bipolar Configuration
Bipolar operation refers to two poles, independent of one another, each operating with its own
converter. It utilizes two conductors of opposing polarity. The primary advantage of this
configuration is its ability to operate as a monopolar scheme in the event of an outage. To prevent
any substantial time using ground return a metallic return transfer breaker (MRTB) can be
HVDC Transmission PSU-ECE POWER Engineers
15
installed. This breaker allows the system to switch from ground return to metallic return without
interrupting power flow.
Figure 1.10 Bipole HVDC Scheme with Metallic Return for Pole Outage [5]
Reactive Power Support
Converters absorb reactive power at alarming rates, an estimated 50-60% of their active power [7].
When operating with a delayed firing angle they are considered a lagging load. In addition to the
converter, transformer impedance creates a lag in the current and the combination of these two
lagging loads results in an overlap angle. This power consumption creates a dire need for reactive
power control that extends beyond the limits of the converters. Choosing an efficient means of
support is absolutely necessary as up to 15% of station costs can result from reactive power needs.
The primary component of reactive power support within an HVDC station is an AC filter bank
but switched shunt capacitors and mechanically switched capacitor damped networks (MSCDN)
may be used when it is no longer economical to add more AC filters to the switchyard.

HVDC Transmission PSU-ECE POWER Engineers
16
Unfortunately, these two means of reactive support can only supply capacitive power. Shunt
capacitors are tuned to a specific frequency to avoid additional harmonics within the system.
STATCOMs
Static Synchronous Compensators (STATCOMs) are a fast-acting means of reactive power
support. A STATCOM uses a power electronic converter to generate a sine wave that can lead or
lag the AC system waveform. This allows reactive power to be generated or absorbed.
STATCOMs use voltage source converter (VSC) technology and their voltage source is a DC
capacitor. STATCOMs absorb reactive power when the voltage terminals of the VSC are lower
than the AC system and generate reactive power when the voltage amplitude of the VSC is higher
than the AC systems. STATCOMs have a quick response time due to the fast switching
capabilities of the insulated gate bipolar transistors (IGBTs) of the VSC and they are less
susceptible to a reduction of capacitive output during undervoltages [8]. They are considered
part of the Flexible AC Transmission System, also known as FACTS. IEEE defines FACTS as "a
power electronic based system and other static equipment that provide control of one or more AC
transmission system parameters to enhance controllability and increase power transfer capability”
[9].
Figure 1.11 STATCOM Circuit [10]
Static Var Compensators
Static Var Compensators, referred to as SVCs are power electronic devices that provide reactive
power. SVCs consist of a thyristor controlled reactor and a fixed capacitor. These two
components combined provide the versatility of delivering reactive power that ranges from fully
capacitive to fully inductive. The reactor controls the AC current flow and consequently the
impedance as seen from the AC side. The fixed capacitor provides an optional leading source of

HVDC Transmission PSU-ECE POWER Engineers
17
reactive power. SVCs are not a source of fast power control and their power output is greatly
affected by undervoltages [11]. While they do not contribute to the common harmonics associated
with converters they do produce their own harmonic currents and as a result may require
additional filtering. SVCs are also part of the FACT family of devices.
Figure 1.12 Static Var Compensator Circuit [12]
Synchronous Compensators
Synchronous Compensators are machines that are connected to the AC system to provide energy
losses but have no mechanical power input. The shaft of a synchronous compensator remains
unconnected and it is allowed to spin freely. While their installation and operation are similar to
synchronous motors their primary function is not the conversion of mechanical power to
electrical power. Their purpose is to absorb or generate reactive power which can be
continuously adjusted with ease. They are generally rated for between 20-200 Mvar [13]. They
have the added advantage of being temporary energy storage and are not affected by the systems
harmonics and can even absorb harmonics themselves.
Converter Control
HVDC systems are very complex and thus require a means of control at either operating terminal.
The primary duties of an effective control system are to control the power flow between the
terminals, stabilize the AC systems in the event of DC operational issues and to protect the
equipment in the event of a fault. The typical hierarchy of a DC control system consists of a
dispatch center which communicates power needs to the terminals. The terminal then acts as a

HVDC Transmission PSU-ECE POWER Engineers
18
“master controller” coordinating the functions between the two terminals. Additionally, each
terminal will also have local controllers [7].
Figure 1.13 Block Diagram of DC Control System [7]
Extending beyond its primary functions a DC control system must also:
Limit the maximum DC current to less than 1.2 p.u. for any substantial period of time. This
is to prevent any permanent damage to the thyristor valves.
Maintain a maximum DC voltage to prevent losses.
Minimize reactive power consumption by coordinating the firing angle.
Firing Angle and Tapchanger Control
To limit the DC current, the converters have two primary means of control: the firing angle and
the converter transformer on-load tapchanger. The firing angle is the time delay from when the
voltage across a valve becomes positive and the point that it starts to conduct. As the firing angle
increases the DC voltage decreases. Firing angle is used to control the DC voltage on both ends
and to maintain a desired level of power. In practice, the firing angle never operates at 0° or above
180° [5]. Varying the firing angle is the only quick means of control and can occur within one-half
cycle [7].
HVDC Transmission PSU-ECE POWER Engineers
19
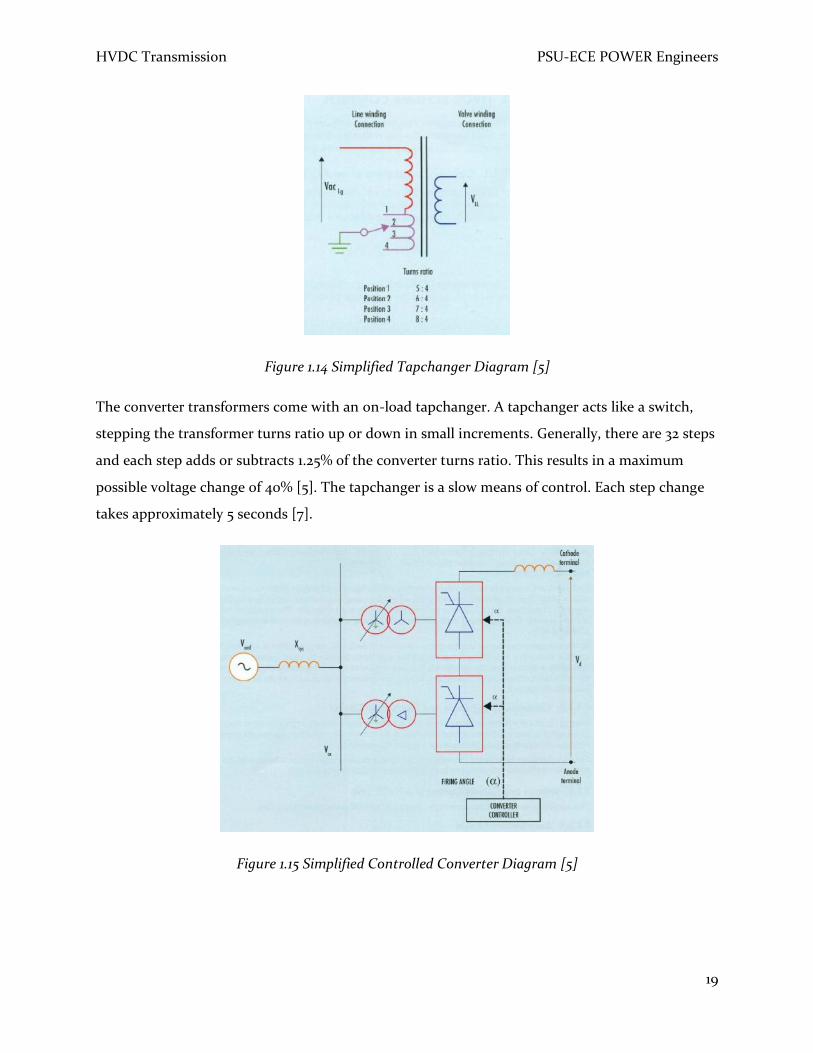
Figure 1.14 Simplified Tapchanger Diagram [5]
The converter transformers come with an on-load tapchanger. A tapchanger acts like a switch,
stepping the transformer turns ratio up or down in small increments. Generally, there are 32 steps
and each step adds or subtracts 1.25% of the converter turns ratio. This results in a maximum
possible voltage change of 40% [5]. The tapchanger is a slow means of control. Each step change
takes approximately 5 seconds [7].
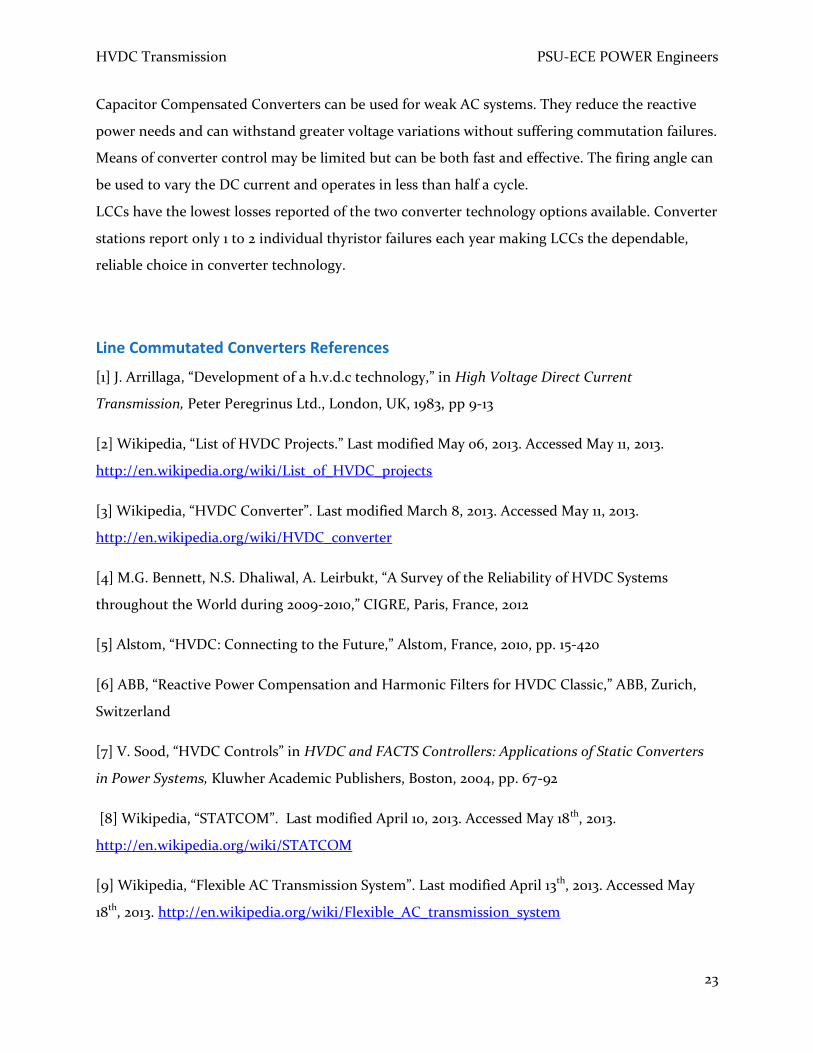
Figure 1.15 Simplified Controlled Converter Diagram [5]

HVDC Transmission PSU-ECE POWER Engineers
20
Most converter stations utilize both the converter transformer tapchanger and the firing angle as
a means of control. The tapchanger is used as a course means of control for steady state
adjustments. The firing angle is used as a means of quickly responding to changing load demands.
Reliability
Overall reliability as categorized by CIGRE involves the annual data collection and reporting of a
HVDC systems “maximum continuous transmission capacity, energy availability, energy
utilization and energy unavailability” [4]. Energy availability is the total possible energy available
for transmission in the HVDC system and energy utilized is the total energy that was transmitted.
As reported in the 2009-2010 CIGRE Survey of Reliability: energy availability varies from 84.1% to
99.6% and the energy utilized can swing from 0 -89%. Reported forced outages range from 0-
8.44%, although 85% of the HVDC systems reported forced outages of less than 1% per year.
The cause of a forced outage can be related back to a specific type of converter station equipment
such as the converter transformers. Many reported that none of the outages could be traced back
to the valves with an average being 1.8 valve failures per year. Individual thyristor failure rates are
below 0.5%. The most commonly occurring equipment failures were linked to “AC and auxiliary
equipment”, most specifically the converter transformers. In fact eliminating the transformer
failures decreased average system outages from 3.1% to 0.65%.
Protection
The general principles for establishing adequate protection for an HVDC system are no different
than an AC system. It is customary to use overlapping zones and when applicable, redundancy to
provide a reliable, selective and speedy protection scheme. In the event of a bipolar transmission
system protection zones are doubled to ensure independence between the two poles. DC
protection not only consists of digital protective relays but can also have incorporated converter
regulation and control functions. Using the converters as a part of the protection scheme can help
prevent full shut down and aid in restoring full operation more quickly.

HVDC Transmission PSU-ECE POWER Engineers
21
To clear a short circuit in the rectifier bridge the converter group must be shut off as soon as
possible to avoid excessive damage of the thyristor valves. Differential protection is used to detect
any shorts that do not cause typical short circuit current values and to detect faults on the DC
side that occur from the reactors or filter switchyard. A delay is used to avoid oversensitivity and
allow for spikes of current when the DC voltage varies and on the AC side as well to protect the
AC filteryard, capacitor banks and transformers.
Beyond the typical protection scheme HVDC systems require special protection functions for the
cases of misfires and commutation failures. Misfires occur when the gate pulse of a thyristor valve
ceases to fire. This can result in overvoltages of dangerously high values. The suggested action to
prevent these misfires is to filter out the network associated frequency components of the DC
voltage. Commutation failures occur when the current in one valve fails to transfer to the next.
Bridge differential protection can be used to quickly detect commutation failures by detecting the
difference between the transformer currents in the phases.
Capacitor Commutated Converters
LCCs are not without their concerns especially when dealing with a weak AC system. Among the
primary concerns are the reactive power requirements and the expensive AC filter switchyard that
is required to counter-effect the production of harmonics. A capacitor commutated converter
(CCC) can be used to remedy these concerns. A CCC is built by inserting a series capacitor
between the leakage impedance of the transformer and the main valve. The capacitor solves two
primary issues associated with the LCC: the reactive power demand as a result of the leakage
impedance and it “provides a forced commutation facility to the main valve” [14].
Figure 1.16 Capacitor Commutated Converter Circuit Diagram [14]
HVDC Transmission PSU-ECE POWER Engineers
22
Sizing the capacitor is of great concern because a capacitor that is too large will be not only be
costly, but may result in overvoltages and also over-compensate for the reactive power resulting
in the draw of a leading current from the AC side. A capacitor that is too small will not
compensate for the leakage inductance and result in a lagging current.
Unlike an LCC, the voltage across the capacitor is proportional to the DC current and when both
rise the DC voltage also rises. This results in a positive inverter impedance characteristic allowing
it to function in a weak AC system. CCCs can also withstand drops in the AC voltage, up to 15-20%
of the nominal voltage without suffering a commutation failure.
The CCCs capacitor impedance when compared to the leakage impedance of the commutating
transformer reduces the short circuit currents to that 2-3 times less than a LCC. The overlap angle
is also decreased and as a result “switching voltage stresses and losses are reduced” [14].
A CCC provides reactive compensation so the need for switchable shunt capacitor banks is
eliminated. The AC filter requirements are also minimized. “Typically, the AC filters provide less
than 15% of total converter reactive power demand as compared to about 55% for a LCC” [14].
Filters are only necessary to deal with harmonics of the system as opposed to LCCs where
additional filters may be required for reactive power support. By reducing the number of filters
necessary it also reduces the space required for an AC switchyard at the converter station.
The primary drawback of the CCC is the increased cost and maintenance. However, they may be
the best solution when dealing with a weak AC system.
Conclusion
The primary concerns associated with LCCs are the reactive power support needed, harmonic
generation from the converters, AC system sensitivity and a limited means of control. After 40
years of reliable use in the largest HVDC projects in the world all of these issues have been
addressed and solutions for each have been implemented, tested and proven to be a reliable fix.
AC filter switchyards are implemented as a means of dealing with the generated harmonics of the
converter. They also provide much of the reactive support necessary for the converters.
Additional reactive support can be provided by the means of a number of devices within the
FACTS family such as the STACOM or a Static Var compensator.
HVDC Transmission PSU-ECE POWER Engineers
23
Capacitor Compensated Converters can be used for weak AC systems. They reduce the reactive
power needs and can withstand greater voltage variations without suffering commutation failures.
Means of converter control may be limited but can be both fast and effective. The firing angle can
be used to vary the DC current and operates in less than half a cycle.
LCCs have the lowest losses reported of the two converter technology options available. Converter
stations report only 1 to 2 individual thyristor failures each year making LCCs the dependable,
reliable choice in converter technology.
Line Commutated Converters References
[1] J. Arrillaga, “Development of a h.v.d.c technology,” in High Voltage Direct Current
Transmission, Peter Peregrinus Ltd., London, UK, 1983, pp 9-13
[2] Wikipedia, “List of HVDC Projects.” Last modified May 06, 2013. Accessed May 11, 2013.
http://en.wikipedia.org/wiki/List_of_HVDC_projects
[3] Wikipedia, “HVDC Converter”. Last modified March 8, 2013. Accessed May 11, 2013.
http://en.wikipedia.org/wiki/HVDC_converter
[4] M.G. Bennett, N.S. Dhaliwal, A. Leirbukt, “A Survey of the Reliability of HVDC Systems
throughout the World during 2009-2010,” CIGRE, Paris, France, 2012
[5] Alstom, “HVDC: Connecting to the Future,” Alstom, France, 2010, pp. 15-420
[6] ABB, “Reactive Power Compensation and Harmonic Filters for HVDC Classic,” ABB, Zurich,
Switzerland
[7] V. Sood, “HVDC Controls” in HVDC and FACTS Controllers: Applications of Static Converters
in Power Systems, Kluwher Academic Publishers, Boston, 2004, pp. 67-92
[8] Wikipedia, “STATCOM”. Last modified April 10, 2013. Accessed May 18th, 2013.
http://en.wikipedia.org/wiki/STATCOM
[9] Wikipedia, “Flexible AC Transmission System”. Last modified April 13th, 2013. Accessed May
18th, 2013. http://en.wikipedia.org/wiki/Flexible_AC_transmission_system

HVDC Transmission PSU-ECE POWER Engineers
24
[10] Dayhim Farafan Co., “PRESS: STATCOM”. Accessed May 18th, 2013.
http://www.dayhim.com/default.aspx?id=30
[11] Wikipedia, “Static Var Compensator”. Last modified April 18th, 2013. Accessed May 11th, 2013.
http://en.wikipedia.org/wiki/Static_VAR_compensator
[12] Mathworks, “Documentation Center: Static Var Compensator (phasor Type)”. Accessed May
18th, 2013.
http://www.mathworks.com/help/physmod/powersys/ref/staticvarcompensatorphasortype.html
[13] Wikipedia, “Synchronous Condenser”. Last modified May 3rd, 2013. Accessed May 11th, 2013.
http://en.wikipedia.org/wiki/Synchronous_condenser
[14] V. Sood, “Capacitor Commutated Converters for HVDC Systems” in HVDC and FACTS
Controllers: Applications of Static Converters in Power Systems, Kluwher Academic Publishers,
Boston, 2004, pp. 117-121

HVDC Transmission PSU-ECE POWER Engineers
25
Voltage Source Converters
Voltage Source Converters Introduction
Voltage source converter (VSC) technology is relatively new to the power market. It debuted in
1997 and has come a long way over the past 16 years on the market. Since then it has evolved from
300 A to 1.8kA transmission. This advancement in power transmission is limited by current
technology using insulated-gate bipolar transistor (IGBT). By using IGBTs the system’s response is
incredibly faster and able to start from 0 volts or “Black Start” without the need of an alternative
power source on startup. The other benefit of VSCs is the amount of real estate needed for the
system. Size is reduced by 50-60% when compared to LCC’s. VSC also have the ability to provide
great VAR support. This technology provides a great benefit for grids that are weak or passive,
since it provides independent control of active and reactive. This section should provide you with
basic information about voltage source converters.
VSCs
VSC technology is specifically designed for moving High Voltage Direct Current (HVDC) based on
using voltage source converters with insulated-gate bipolar transistors (IGBT). IGBTs are large
semiconductors that used as a switch to invert and rectify power. Previously, VSCs used to be
based on two or three level switching technology for alternating the voltage levels to the AC
terminal. Because the number of switching was so lo several hundred semiconductors were
needed on each converter arm, they were connected in series and had to switch simultaneously in
order to ensure uniform voltage. Below is a picture showing the differences of the three topologies
including what is used today.

HVDC Transmission PSU-ECE POWER Engineers
26
Figure 2.1 VSC topologies. [1]
IGBTs
This is a three terminal semiconductor that is primarily used as an electronic switch for electric
circuits. It switches electric power at a fast rate and is highly efficient, low power losses around 1%
and no harmonics. It is design to synthesize complex waveforms with pulse width modulation
(PWM).
Figure 2.2 Introduction to HVDC VSC Alstom source.

HVDC Transmission PSU-ECE POWER Engineers
27
(PWM is a technique for controlling analog circuits with a processor’s digital output. It is able to
control the power supplied to form a sine like waveform. Though it is not a perfect wave, with
combinaiton of multi level converters, a more sine like wave pattern willl emerge without the
addition of noise to the line.)
It combines simple gate-drive characteristics of MOSFETs with a high-current and low-
saturation-voltage capability of bipolar transistor by combing an isolated gate FET of the control
input, and a bipolar power transistor as a switch, in a signal device. They consist of many devices
in parallel and can have very high current handling capabilities up to 1.8kA; they are also capable
of handling up to 6kV. The other plus is IGBTs produce a low frequency; this is ideal for power
transmission because we do not have to add harmonic filters to the system.
Figure 2.3 is a three level converterprincipal circuit diagram for one phase. Each diode symbol in
reality represents over 150 IGBT modules. This is taken from the Murraylink layout for example. [4]
Main advantages of the IGBT are:
Very low on–state voltage drop due to conductivity modulation and a superior on-state
current density.
Low driving power and simple drive circuit due to the input MOS gate structure.
It can be easily controlled as compared to current controlled devices in high voltage and
high current applications. It also has superior current conduction capability compared
with the bipolar transistor.
Provides excellent forward and reverse blocking capabilities.
AC voltage contains harmonic components, caused by the switching of the IGBTs. The harmonics
need to be limited in order to prevent them from interfering with system equipment or radio and

HVDC Transmission PSU-ECE POWER Engineers
28
telecommunication signals. High-pass filters must be installed in order to prevent these
occurrences. Phase reactors are used in controlling the active and reactive power and help reduce
the harmonic noise caused by the IGBTs.
IGBTs can be connected in parallel [5]; this would be the same for VSC converter stations. It is
possible to achieve a higher power rating to be somewhat comparable to LCCs. The difficult
portion of this is the IGBTs must turn on and off every time simultaneously. This is critical to the
current balancing in the parallel connection. To accomplish this you would need an external
component that they would connect to.
In order to convert from AC to DC, the system uses multilevel switching so that it can take the DC
waveform and convert it to a modulated sine wave. This is done by the same technology as used
in telecommunications. By utilizing the IGBTs there is low switching frequencies, which
illuminate the need for harmonic filters and help provide low system losses. [1] MMC technology
is a multilevel converter that consists of six converter arms, within the arms; there are several
power modules and one converter reactor connected in series. Power modules consist of two
IGBTs and a capacitor. There are three separate states that enable power conversion. The first
stage is having both IGBTs in the off state. If a power failure were to occur, all modules will have
their IGBTs switches off. This is to allow current to flow from the positive DC pole in the direction
of the AC terminal to charge the capacitor. When power flows in the opposite direction, D2 diode
bypasses the capacitor. Normally during operation of the system this case does not occur, only in
the event of something failing would you see this state.

HVDC Transmission PSU-ECE POWER Engineers
29
Figure 2.4: *Capacitor .
Second state is the “Capacitor-On” state, IGBT1 will be energized which will charge the Capacitor,
IGBT2 is switched off. The voltage stored in the capacitor is applied to the terminals of the power
module. Current will either flow through D1 to charge the capacitor or through D2 to discharge it.
Third state is the “Capacitor-Off” state in which IGBT2 will be energized and ensures that zero
voltage is applied to the terminals of the power module. The Capacitors provide an energy buffer
to keep the power balance during transients and limit the voltage ripple.
Control Systems
Depending on the manufacturer there are a few different types of control systems readily available
on the market today. Direct Power Control (DPC) is based on the instantaneous active and
reactive power control loops. There are no internal current control loops and no pulse width
modulator block; this is due to the converter switching states that are selected by a switching
table based on the instantaneous errors between the commanded and estimated values of active
and reactive power. This system is not common today due to the need for quick IGBT switching
for frequency controlling.
Vector control method is another system that uses modeling of three phase systems by using axis
transformations (d-q transformation). This system utilizes PWM converters for obtaining

HVDC Transmission PSU-ECE POWER Engineers
30
independent control of the active and reactive powers. One of the most advantageous
characteristics of vector control is that vectors of ac currents and voltages occur as constants in
steady state. By using PI controllers, static errors in the control system can be eliminated.
D-Q transformation is transforming a three-phase system to a two-phase - coordinate system,
and then transforming the - system to the d-q coordinate system.
Figure 2.5 Axes for vector control.
The d-q reference frame is rotating at synchronous speed ω with respect to α-β.
Figure 2.6 Voltage conversion process.

HVDC Transmission PSU-ECE POWER Engineers
31
The object is to regulate the dc voltage and maintaining the balance between the incoming ac
voltage and the outgoing dc power. The voltage equations in d-q synchronous references are
provided.
(
)
(
)
For the output side
The power balance relationship between the ac and dc
( )
The voltage vector is defined to the d-axis direction, and then virtual grid flux vector can be
assumed to be acting along the q-axis. With this alignment the instantaneous real and reactive
power injected into or absorbed from the ac system is:
The transformation into rotating d-q coordinate system oriented with respect to the grid voltage
vector. This leads to a split of the main current in two parts. One part determines the
contribution which gives the required power flow into the DC bus; the other part defines the
reactive power condition. The angle between the α-axis of the α-β frame and d-axis of the d-q
frame is used for transformation between the α-β frame and d-q frame. The angular position of
the voltage vector is given by,
HVDC Transmission PSU-ECE POWER Engineers
32
Where Vβ and Vα are components of voltage in stationary two axis reference frame, α-β. The
instantaneous phase angle of the grid voltage is needed for independent control of active and
reactive power.
STATCOMs
It is a static synchronous compensator that regulates the system voltage. For example; if the
terminal voltage of the DC end is greater than the AC voltage, it will generate reactive current.
When the DC voltage is lower that the AC voltage it will absorb reactive power. Unlike a thyristor
based static VAR compensator, STATCOM has the ability to control the output current
independently of the AC system voltage.
This system is used in voltage source converters to synthesize a voltage waveform of variable
magnitude with respect to the system voltage. It offers both reactive power absorption and
production capability. It allows for a faster response and improves overall power quality, which
greatly improved when using PWM to control the system. It is very helpful in mitigating flicker
from disturbances caused by customers that require a high power demand, such as steel mills and
other large manufacturing plants. STATCOM has the ability to increase the power transfer
capability where limited by post-contingency voltage criteria or under voltage loss of load
probability. They are designed to keep the normal operating point within the middle of a dynamic
range. After a disturbance the reactive power production will be decreased. This in turns limits
the voltage output on the system.
Protection
DC protection can be achieved by using AC circuit breakers on the AC system. This strategy can
be applied to VSC systems, using AC circuit breakers creates fast acting DC switches. The switches
are only used to isolate lines and cannot break load or fault current. Each VSC will receive current
measurements from their respective DC switches. When a fault occurs all of the AC circuit
breakers associated with the system will trip. Each VSC must determine which one of its switches
is open. This is done by measuring the magnitude and direction of the current through each
switch. The switch that will be selected is the one with the largest positive fault current. A “hand

HVDC Transmission PSU-ECE POWER Engineers
33
shaking” method defines positive as out of the node and negative into the node. When a fault
occurs on a Line, VSC receives current measurements on that line. The system can then route
power to another portion of the grid until the fault is cleared, then switch back to the line that
had the original fault.
DC protection utilizes IGBT-CB and fast acting DC switches. The IGBT-CBs can be placed at the
terminals of each VSC or at the end of each line. The voltage of the capacitors will be monitored
as well as the current through each line. When the current exceeds the maximum set point and
the voltage begins to rapidly discharge the respective IGBT will begin to block and the fast acting
DC switch will open once the fault is extinguished. This type of protection is advantageous
because it isolates the individual lines without interrupting the entire network. This is true when
each line has its own IGBT-CB. While this is a more effective method of protection, it is the most
expensive option with further challenges. IGBT-CB cannot begin to block when a fault is detected
on the positive line because two or more lines split from the positive or negative node. Since all
lines that are connected to a particular node will feed fault on any other line connected to the
same node, the faulted line must be detected. Three different methods to achieve this are large
current change, rise time, and oscillation pattern.
The large current change method determines which lines are faulted by comparing the current
magnitude of all lines feeding the fault. The line with the largest current change in a given time
will be chosen as the faulted line. When a fault is detected, each VSC will measure the rise time of
the current in their respective lines. The line with the fastest rise time will be identified as the
faulted line. The oscillation pattern method looks for wide pulses without a change in polarity.
This identifies the faulted line.
If a short circuit event were to occur between the DC terminals, the current will rise in excess of a
predetermined threshold value in the converter arms. The IGBTs will switch off in a few
microseconds in order to prevent current reaching a critical level. Since current flows from the
three phase AC side, the only way this type of fault can be cleared properly is by opening the AC
circuit breaker. This will cause a slight interruption in service; however the VSC can handle the
removal of power in order to clear a fault since they do not need a backup system to operate.

HVDC Transmission PSU-ECE POWER Engineers
34
Figure 2.7 Example of a line-to-line fault.
IGBTs have a low surge current threshold capability. If a fault occurs and the diode receives a high
amount of current, a press-pack thyristor is connected in parallel to the affected diode and is fired
in the event of a DC line-to-line fault. This is installed to prevent the damage of the diodes which
have been known to overheat and cause an explosion in their case. This can potentially damage
other IGBTs or cause harm to others if in close contact.
Figure 2.8 Sectional view of a multichip press-pack with common pole-pieces.
Black Start
In the event of a fault, or the beginning of spring when wind turbines come back online, VSCs
have the ability of going online without the need of an external power source. For example,

HVDC Transmission PSU-ECE POWER Engineers
35
external power sources are usually diesel powered generators that provide power to start larger
generators in order to provide the system with enough megawatts to enable the substation to
come back online. VSCs however are not limited by this process of waiting for the generators to
kick on for the substation to be ready when the fault or event has been cleared. Instead a simply
battery is enabled in order to save the information of reference points for preparing the system to
come back online.
The great thing about VSCs is the fact that you do not need to have annual testing on equipment,
like you would for LCCs, because there are no mechanical components that could potentially fail.
VSCs have the ability to control the incoming voltage which can range from 0 to 1.1 p.u.[3] They
are able to control voltage dips when starting large motors and over voltage due to self-excitation
phenomenon associated with energizing high voltage AC lines, and the ability to provide on
demand frequency control. The sequence of switching certain loads and generation is no longer as
critical as in a traditional initialization process. To accomplish this VSC have the ability to provide
a soft start sequence for major power system equipment. This is to help limit the inrush current
and transient voltage and harmonics on the system. It will enable a faster process for bringing a
system online without putting further stress on the systems components, such as transformers,
breakers, etc.
During the system restore process, the AC voltage reference is established by a pre-determined
magnitude, phase angle and frequency. Since this information is saved in the event of a fault, the
system knows when to fire the system up at the correct phase angle as soon as the fault has been
cleared and power is restored. This is a significant factor when connecting two grids together. If it
was not synchronized correctly, it has the potential to damage other system generators and the
IGBTs themselves.
Cooling
In order to successfully transfer the rated power we need to keep our IGBTs at a cool constant
temperature. To accomplish this IGBTs are mounted on aluminum heat sinks that can hold up to
four devices. The IGBTs are cooled on one side by a large coolant system. The system is comprised
of two pumps, one to be running at all times and the other for a backup system if the first pump
fails. This is to ensure there is no interruption in service. It’s designed to deliver coolant at a

HVDC Transmission PSU-ECE POWER Engineers
36
constant rate of 10
(2.64
) to the heat sinks. The coolant is comprised mostly of water and
glycol and a few non-listed additives, to reduce the freezing point of coolant well below 0ºC.
Electrical conductivity of the coolant is critical to the operation of the IGBT valves. Coolant is
flowing constantly through a resin bed de-ionizer in order to maintain the conductivity of the
coolant to be extremely low. This is to help prevent leakage currents in the coolant from effecting
other equipment and maintaining a safe work area for substation personal. Bypass valves are in
place to prevent very low temperature coolant from entering the IGBT valves at startup. This
helps to prevent the risk of condensation on the valve surfaces.
HVDC configurations
There are several ways in which a converter station can be laid out in order to deliver the desired
output. Some are intended on long distance delivery while others are intended for joining weak
grids to stronger ones or different frequency grids together, such as a 50 Hz to a 60 Hz. Listed
below are several methods for converter station layout.
Monopole
Two converters are connected by a single line and a positive or negative DC voltage is applied.
There is only one insulated transmission conductor; ground is applied for a return instead of
adding another line. This method can be used for a short amount of time; this is to prevent
corrosion of underground equipment.
Figure 2.9 Monopole configuration.
Bipole
Two converters are connected by two lines, supplying both positive and negative DC voltage
respectively. The two poles can be operated independently if both neutrals are grounded and in
the event of a fault it can run on one line to provide power to the grid until the fault is cleared.

HVDC Transmission PSU-ECE POWER Engineers
37
Figure 2.10 Bipole configuration.
Homopole
Two or more conductors have negative polarity and are operated with a ground or metallic return.
This configuration is run in parallel to reduce insulation cost.
Figure 2.11 Homopole configuration.
Back-to-back
Designed for connecting two adjacent asynchronous AC systems. Two converter stations are
located at the same site so there is no need for transmission lines. This is great when joining two
AC networks that have conflicting frequencies or conflicting phase shifts from older networks to
newer networks. Tres Amigas for example; located along the border of Texas and New Mexico, is a
substation that features this topology. It goal is combining the Eastern and Western
interconnection to the Texas interconnection for a more stable system.

HVDC Transmission PSU-ECE POWER Engineers
38
Figure 2.12 Back-to-back configuration.
Multi-terminal
Three or more stations are separated and interconnected through transmission lines or cables.
The system can run in either parallel or series.
Figure 2.13 Parallel configuration and series configuration.
For many HVDC systems the most common configuration and preferred choice is a bipolar
configuration. This is simply because it can transmit in either direction on either line, including a
return to ground in the event one side goes down due to a fault.
Advantages
VSC converters have many advantages for HVDC operation. It provides independent control of
active and reactive power with less equipment. This is achieved by controlling the switching of
the IGBTs. When power demand begins to spike, VSCs are able to control the system
instantaneously based on demand needs. Such power disturbances are limited, such as flickering
and harmonics.
Communications between the substations are not dependent on one another since both sides
operate independently. They can also provide multi-terminal support for DC grids; this would be
designed for city centers if power distribution would be changing from AC to DC. Transient over
voltages can be counteracted by fast reactive power responses. Thus stability margins are
enhanced because of reactive power support. VSC are not limited to the amount of power being

HVDC Transmission PSU-ECE POWER Engineers
39
supplied to the converter station. Meaning as long as some power is being delivered, it is able to
transfer it to the grid.
Full range of reactive power can be utilized. Active power transfer can be quickly changed in
either direction without any filter switching or converter blocking. The amount of real estate
required for the project is extremely less when compared to LCCs, which is why more projects are
being started in heavily populated cities and off shore wind farms. It helps with the daily
maintenance routine for the substation and the ability to swap out failed components relatively
easier and in a timelier fashion. During initial construction is would be ideal, instead of building
the entire project at once, you could split it up into three sections, each rated for 1000MW.
Whereas LCCs would need to construct the entire converter station during the first phase.
Disadvantages
Currently VSCs are not able to supply the desired amount of power for the proposed project. They
are rated for around 1.2kMW. It has a higher loss rate when compared to LCCs. Best case scenario
in a controlled environment is about 1% loss, although on average it is around 1.7% loss per
station. The reliability for a 30 year service life has not been proven, due to it being extremely new
converter technology.
Past and Current VSC Projects Table 2.1 lists some VSC projects in operation or under construction. From this table we see that
VSC is an extremely new technology that has been in use for only 16 years. This is about half of
the life span for normally rated power equipment. When compared to LCC, which has a 30+ year
proven track record. Currently the only known project to be close to the specifications laid out for
Trans West project is Inelfe. This is the largest VSC system in the world today; it will supply 2000
MW of power from France to Spain. The system is comprised of four VSC converters, two on
either end that are capable of handling 1000MW of power. This is due to the fact that currently
VSC technology is limited up to 1.2kMW. The pressing factor for VSC limitation is the present
state of IGBT capabilities. However theoretically you could run VSCs in parallel on both sides in
order to supply the amount of power required, if it is greater than 1.2k MW[6].

HVDC Transmission PSU-ECE POWER Engineers
40
Transmission
Station Location #1
Transmission Station
location #2
Cable
length
(km)
Overhead
Line (km)
Voltage
(kV)
Power
(MW) Year
Sweden - Hellsjön Sweden - Grängesberg 10 180 3 1997
Australia -
Mullumbimby Australia - Bungalora 59 80 180 2000
USA -Eagle Pass, TX USA - Eagle Pass, TX 15.9 36 2000
Denmark -
Tjæreborg Denmark - Tjæreborg 4.3 9 7
2000
USA - New Haven,
CT USA - Shoreham Long Island 40 150 330
2002
Australia - Red Cliffs Australia - Berri 177 ±150 220 2002
Norway - Kollsnes Norway - Offshore platform 70 60 80 2004
Estonia - Harku Finland - Espoo 105 105 350 2006
Germany - Diele Germany - Borkum 2 platform 203 150 400 2009
Norway - Lista
Norway - Valhall, Offshore
platform 292 150 78
2009
USA - Pittsburg, CA USA - San Francisco, CA 85 200 400 2010
Namibia - Gerus Namibia - Zambezi 970 350 300 2010
Germany - Diele
Germany - BorWin Beta
platform 200 300 800
2012
Germany - Heede Germany - DolWin Alpha
165 320 800 2013

HVDC Transmission PSU-ECE POWER Engineers
41
platform
Germany - Büttel
Germany - HelWin Alpha
platform 130 250 576
2013
Germany - Büttel
Germany - SylWin Alpha
platform 205 320 864
2014
France - Baixas Spain - Santa Llogaia 60 ±320 2000 2014
USA - Saint Ignace,
MI USA - Saint Ignace, MI 70 200
2014
Table 2.1 Existing and under construction VSC projects.
Operational Information
This information is to give some insight into substations dilemmas and unforeseen challenges. It
wil also be for examining the first encountered problem at the Cross Sound Cable substation,
located in Westborough, MA. It is an underground VSC system that is composed of two remotely
controlled converter stations. From 2003 to 2009 they averaged around 1.16% for forced outages.
In 2003 it was due to a failure in an overheated IGBT, 2006 there was issues with the software for
converter protections this cause IGBTs to fail. In 2009 human error was to blame for forced
outages when a maintenance worker crashed a lift into a 200kv bus bar. During the first three
years of operation they lost 77 IGBTs. This is nearly three times the amount of the last four years
of operation in which they only lost 28[2].
This site utilizes a total of 2,916 IGBTs at each station. They are laid out in stacks and are designed
to be a fail-safe as a short circuit. This site was the first to use second generation technology of
IGBTs, at the time the increase in DC operating voltage cause some unforeseen faults. Planning
for these events is tough to consider when the technology is so relatively new.

HVDC Transmission PSU-ECE POWER Engineers
42
Conclusion
If the project is to support an insufficient system or if the demand on the commercial side
increases VSC will be the proper choice. They provide an excellent VAR support and are able to
conform to demand. They operate independently and are on the verge of becoming more
competitive when compared to LCC. The size of the layout being an estimated 60% smaller than
LCC it makes VSC slightly more attractive. These are the main key points for choosing VSCs.
While the only downside for this system is the upfront cost and their limited on power transfer
and have higher losses than LCCs.
Voltage Source Converter References
[1] M. Davies, M. Dommaschk, J. Dorn, J. Lang, D. Retzmann, D. Soerangr “HVDC PLUS – Basics
and principle of operation”, Available FTP www.siemens.com/energy/hvdcplus
[2,4] S.Dodds, B.Railing K.Akman, B.Jacobson, T.Worzyk, B.Nillson , “HVDC VSC (HVDC light)
transmission – operating experiences” Cigre, 21,rue d’Artois, F75008 Paris, 2010
[3] Yiing Jiang-Hafner, Hugo Duchen, Michael Karlsson, Leif Ronstrom, Bernt Abrahamsson,”
HVDC with VSC a powerful standby black start facility” IEEE PES T&D conference, Chicago, IL,
USA, 2008
[5]Andreas Volke, Michael Hornkamp,”Connecting IGBT modules in parallel and in series”, in
Infineon IGBT Modules Technologies, Driver and Application, 2nd edition, Germany 2012, Chapter 8,
pp 324-344
[6] B.Jacobson, (2013, Feb 18.) VSC Technology [Online]. Available
email [email protected]
HVDC with Voltage Source Converters – A Powerful Standby Black Start Facility, Ying Jiang-
Hafner, Hugo Duchen, Michael Karlsson, Leif Ronstrom, Bernt Abrahamsson

HVDC Transmission PSU-ECE POWER Engineers
43
Transmission
Transmission Introduction
Since its conception in the late nineteenth century, alternating current has been the primary form
of transmitting high voltage electricity from one location to another. However, a gradual increase
in the demand for reliable power has also necessitated an increase in supply. With this increase in
electrical capacity within the grid, the fallacies of alternating current systems have come into
consideration when designing new transmission lines.
With the creation of the mercury arc valve in the 1950’s, it became possible to convert alternating
current to direct current for transportation purposes, and then back to alternating current for
distribution and consumption. As mercury valve technology evolved, solid-state components
made an entrance into the scene of high voltage transmission. The introduction of thyristor valves
and insulated-gate bipolar transistors have allowed for the improvement in signal control,
harmonic noise elimination, and reduction of converter station footprints. These changes,
alongside continual technological advancements, have allowed HVDC to become a viable option
in long-distance transmission schemes.
Due to the fundamental dynamics of an alternating current system, there will be both resistive
and reactive losses under normal operation. While factors such as weather and ambient
temperature may affect losses, it may be defined primarily as a function of the voltage, current,
and the impedance of the line. As a result of the steady-state behavior of a direct current line,
there will only be resistive losses during normal operation. However, it should be noted that
reactive losses are still present within the converter stations. The benefits of lower losses can be
seen in Figure 3.1 below. The principle of higher voltage, lower current to reduce losses holds true
between both AC and DC lines. However, it can be observed that the losses within the DC lines
will be considerably lower than that of the HVAC line.

HVDC Transmission PSU-ECE POWER Engineers
44
Figure 3.1 Loss Comparison between HVDC and HVAC Lines per Distance. [1]
The cost of materials in the form of conductors and tower steel also come into consideration
when comparing the costs and benefits of a DC line. Since a DC line will typically have one or two
poles instead of the three phases present on an AC line, the cost of aluminum conductor will be
significantly lower in the case of the former. A lower minimum design strength of supporting
towers is a direct result of this reduced conductor count, which brings down the cost of a DC line.
Another resultant benefit of reduced poles (and smaller towers) is that the required right of way
becomes narrower, further decreasing the cost of the transmission line.
One major factor that affects the viability of a DC line is the cost of the converter station on both
ends of the line. The converter stations required to convert AC-DC-AC represent a significant
portion of the cost of the system. In Figure 3.2, it is shown that the high principle cost of the
converter station is offset by the reduced cost of materials and losses as the proposed line grows
in length. It is expected that the minimum “break-even” distance will continue to fall as
development in solid-state voltage sourced converters progresses.
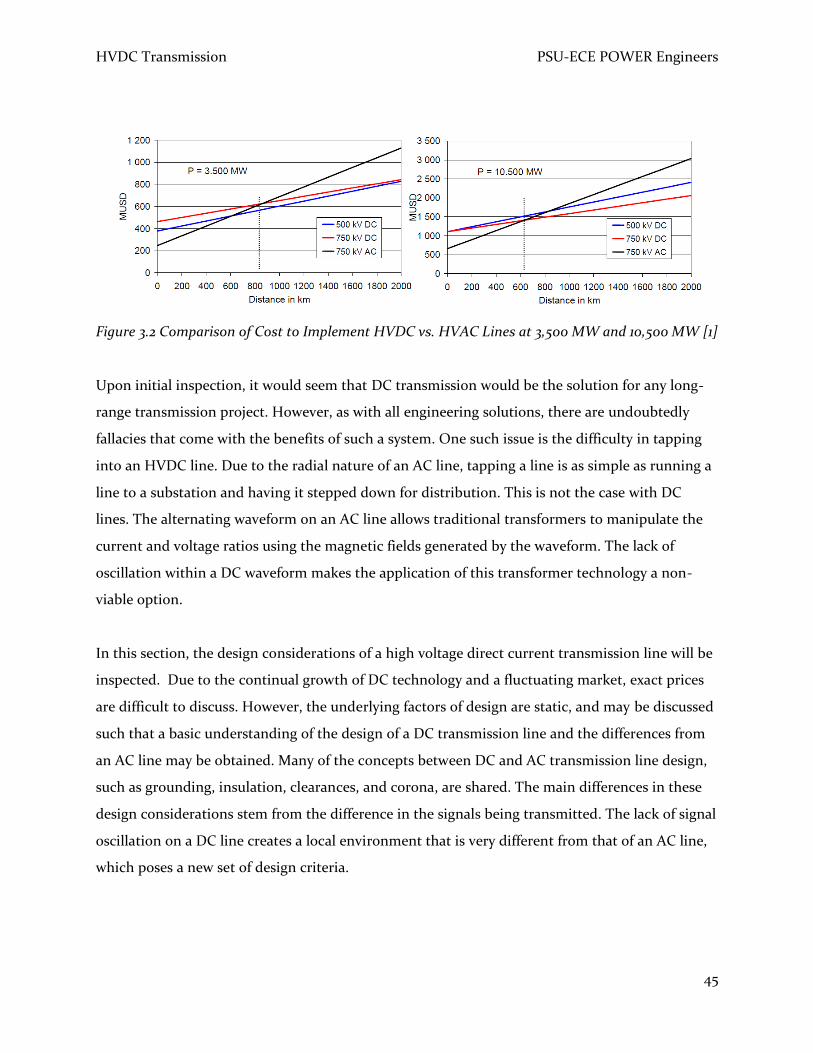
HVDC Transmission PSU-ECE POWER Engineers
45
Figure 3.2 Comparison of Cost to Implement HVDC vs. HVAC Lines at 3,500 MW and 10,500 MW [1]
Upon initial inspection, it would seem that DC transmission would be the solution for any long-
range transmission project. However, as with all engineering solutions, there are undoubtedly
fallacies that come with the benefits of such a system. One such issue is the difficulty in tapping
into an HVDC line. Due to the radial nature of an AC line, tapping a line is as simple as running a
line to a substation and having it stepped down for distribution. This is not the case with DC
lines. The alternating waveform on an AC line allows traditional transformers to manipulate the
current and voltage ratios using the magnetic fields generated by the waveform. The lack of
oscillation within a DC waveform makes the application of this transformer technology a non-
viable option.
In this section, the design considerations of a high voltage direct current transmission line will be
inspected. Due to the continual growth of DC technology and a fluctuating market, exact prices
are difficult to discuss. However, the underlying factors of design are static, and may be discussed
such that a basic understanding of the design of a DC transmission line and the differences from
an AC line may be obtained. Many of the concepts between DC and AC transmission line design,
such as grounding, insulation, clearances, and corona, are shared. The main differences in these
design considerations stem from the difference in the signals being transmitted. The lack of signal
oscillation on a DC line creates a local environment that is very different from that of an AC line,
which poses a new set of design criteria.

HVDC Transmission PSU-ECE POWER Engineers
46
Line Design
Bipolar vs. Monopolar
In regards to physical line design, there are a few different configurations to be implemented.
Bipolar and monopolar configurations are the most common, while homopolar and tripole
configurations also exist. The basic HVDC scheme is the monopolar configuration, which involves
a fixed polarity on each end of the line. This single potential across the line creates current flow
from the positive terminal to the negative terminal, and requires a ground electrode or metallic
return for the flow of neutral current. This configuration is simple, but lacks robustness in the
sense that maintenance or a fault condition on the line would result in cessation of power
transmission.
A line with bipolar configuration is essentially two monopolar systems tied back to back. One line
will have a positive potential with respect to a common node, while the other will have a negative
potential. This configuration increases the amount of power that may be transmitted between the
two terminals with minimal impact on right of way and clearances. Furthermore, a bipolar
configured line may operate under monopole mode while one line is experiencing an outage. The
amount of power transmitted is then limited by regulations on ground current flow and physical
line design. In Figure 3.3, two common monopolar and bipolar configurations may be viewed.
Figure 3.3 Monopolar and Bipolar HVDC Schemes in Ground and Metallic Return Configurations

HVDC Transmission PSU-ECE POWER Engineers
47
Although bipolar configurations are the most prevalent, some projects are implemented in
monopolar configuration. The similarities between monopolar and bipolar configurations allows
bipolar projects to be constructed as a monopole as an intermediate step. Since most lines
implemented are bipolar lines, this will be the main focus of this section.
Clearances
It is imperative that adequate line-to-line, line-to-tower, and line-to-ground distances are
maintained to ensure public safety and reliable operation. The importance of these clearances is
defined by the overvoltage conditions of a line, and is a function of gap spacing. The areas of
interest include normal operation, switching-surges, contamination, variance of weather
conditions (i.e. lightning and wind), and maintenance.
In AC lines, overvoltages result from switching operations: line energization, line reclosing, load
rejection, fault application, fault clearing, and reactive load switching. The intrinsic nature of
HVDC control schemes allows for smooth control of line voltage [2]. This allows for the issues of
fault clearing, line reclosing, and reactive load switching to be dealt with on the terminal-ends of
the system. The remaining issue of lightning strikes is remedied in part by overhead shield wires,
while contamination is addressed by appropriately sizing insulator strings. Strategic placement of
grounded shield wires on transmission structures create envelopes of protection for the live
conductors underneath.
To maintain these mandatory clearances, the designer of a HVDC line must consider two criteria:
line-to-structure for the positive pole and conductor swing due to an established contingency
basis. Clearances, as per EPRI, range from 0.7m to 1.9m for +300kV to +800kV respectively.
On the subject of switching surges, the equation given for a fifty year contingency is dependent
on gap distance and a static gap factor [2].
Where:
V50 is the insulation critical flashover voltage (50% probability) in kV
d is the gap distance in meters
k is the gap factor;

HVDC Transmission PSU-ECE POWER Engineers
48
k = 1.15 for conductor to plane
k = 1.3 for conductor-structure under
k = 1.35 for conductor – structure (lateral or above)
k = 1.4 for conductor – guy wires
k = 1.5 for conductor to cross-arms with insulator strings
With the distance from conductor to structure established, the spacing between poles must also
be considered. Depending on the type of insulator used, the equation to determine the minimum
spacing between poles may vary. For I-string conductors, we find that the minimum pole spacing
is given by the following relationship between conductor bundling, insulator string length,
insulator swing angle, and tower width [2].
( ( )
Where:
dmin is the operating voltage or switching surge clearance
(
)
A is the sub conductor spacing.
N is the number of sub conductors in the bundle
L is the insulator string length
θ is the swing angle for the wind speed
w is the tower width at conductor level and varies from 1.2 to 2.5 for voltages from ±300-±800KV
If V-strings are implemented instead, it would be found that there would no longer be a swing
angle, as the insulator configuration would prevent lateral motion in the presence of wind. As
such, the minimum pole spacing would become a function of only the V-string length and tower
width [2].
( )

HVDC Transmission PSU-ECE POWER Engineers
49
Where:
L is the length of the V-string.
w is the tower width at conductor level and varies from 1.2 to 2.5 for voltages from ±300-±800KV
In determining the tower height of a line, we find that is a function of the conductor sag under
operating conditions. Conductor sag is directly related to ambient temperature, line current and
local weather conditions. The current flow within the line, along with the physical and electrical
properties of the physical conductor, must be considered in the design process of the
transmission line. This is to ensure that appropriate tower and conductor heights are chosen to
prevent violation of regional transmission regulations.
Right of Way
Another area of interest for the design of transmission lines in general is right of way. Right of
way is defined as the strip of land that a transmission line passes through. Right of way is
dependent on the total tower width and insulator swing under high-wind conditions. In Figure
3.4, we can see that HVDC lines require a smaller right of way for equivalent amounts of power.
This results from the presence of two poles, rather than three phases on the structure. With the
total clearances of an HVDC line notably smaller than that of an AC line, the strip of land that
must be cleared for installation of a DC transmission line is substantially reduced. A typical right
of way for a +600kV line would range from 66m to 70m [2]. Other factors that may affect the right
of way of a particular line are radio interference levels and audible noise levels.
Figure 3.4 Comparison of Typical Transmission Line Structures for Approximately 2000MW.
[Siemens]

HVDC Transmission PSU-ECE POWER Engineers
50
The two main configurations of HVDC transmission are monpolar and bipolar lines. Monopolar
lines involve fixed polarities at each end and result in power flow in only one direction. While this
implementation is less costly than a bipolar line, the trade-off is in reliability and operational
flexibility. On the other hand, bipolar lines are more costly but offer superior operation in case of
pole outages. Since reliability is of the utmost importance in electrical transmission, bipolar
schemes are often favored over the simpler monopolar design.
When determining the physical configuration of a DC transmission line, it is mandatory to ensure
that proper clearances (line-line, line-tower, and line-ground) are maintained. Factors such as
local terrain and weather, regional regulations, nominal line voltage act as important constraints
when establishing these clearances. These main ideas behind physical line design are
interchangeable between AC and DC systems. The main discrepancy between the two modes of
transmission lies in the fact that DC lines require only two poles, whereas AC lines require three
phases. The benefit of running only two poles is that the supporting structure’s footprint may
become much smaller, resulting in a smaller transmission corridor.
Earth Electrodes
Introduction to Earth Electrodes
A monopole configuration is the simplest HVDC transmission scheme to implement. This
configuration may offer a low cost solution for some transmission projects. Since there is only a
single pole raised to a high potential, current must flow in the opposite direction through some
other medium. In the case of a monopole, it is necessary to have either a metallic return, in the
form of a secondary conductor, or an “earth return”, where the neutral current of the system is
injected into the low-resistance ground (or ocean) over a large area. This source of neutral current
is then connected by a metallic conductor to the terminal substation. While there are examples of
monopole systems with earth return operating around the world, environmental regulations and
the impacts of current flow on buried metallic objects such as pipelines and foundations make
this type of implementation less appealing. In an ideal bipolar system, current of equal magnitude
but opposite polarity will travel in each respective pole. Although this is not the case in practice,
the neutral current present within a bipolar system will undoubtedly be less than that of a
monopolar system.
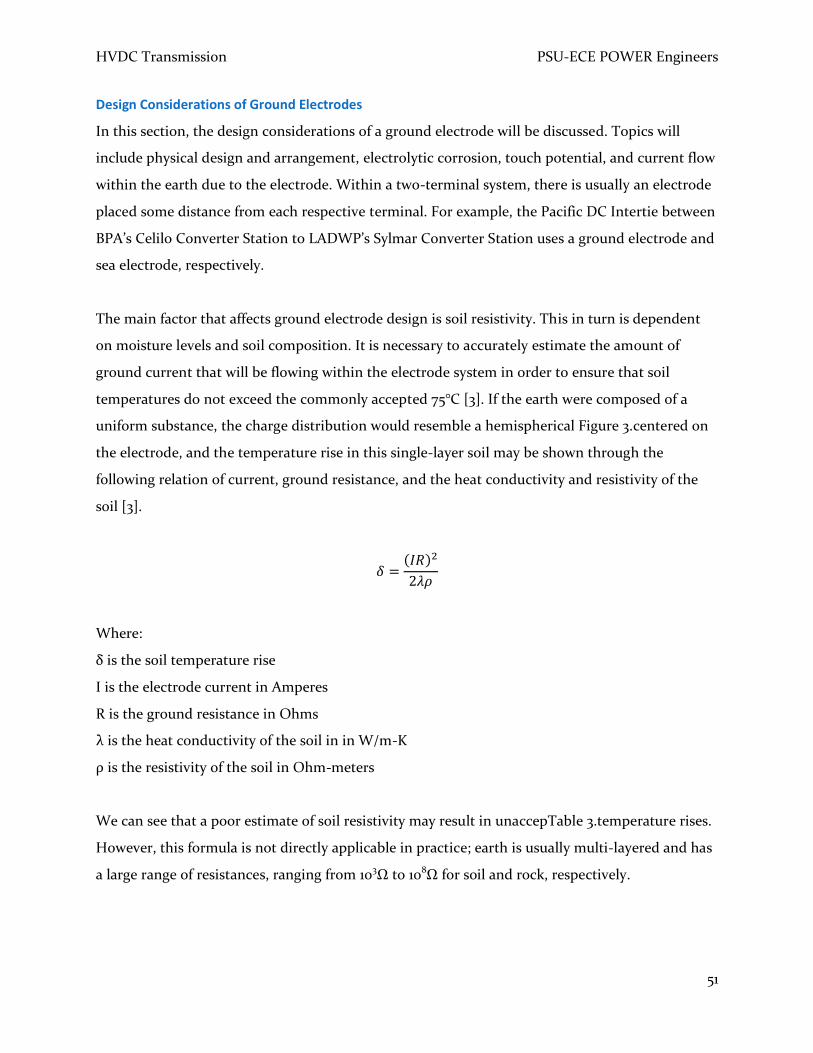
HVDC Transmission PSU-ECE POWER Engineers
51
Design Considerations of Ground Electrodes
In this section, the design considerations of a ground electrode will be discussed. Topics will
include physical design and arrangement, electrolytic corrosion, touch potential, and current flow
within the earth due to the electrode. Within a two-terminal system, there is usually an electrode
placed some distance from each respective terminal. For example, the Pacific DC Intertie between
BPA’s Celilo Converter Station to LADWP’s Sylmar Converter Station uses a ground electrode and
sea electrode, respectively.
The main factor that affects ground electrode design is soil resistivity. This in turn is dependent
on moisture levels and soil composition. It is necessary to accurately estimate the amount of
ground current that will be flowing within the electrode system in order to ensure that soil
temperatures do not exceed the commonly accepted 75°C [3]. If the earth were composed of a
uniform substance, the charge distribution would resemble a hemispherical Figure 3.centered on
the electrode, and the temperature rise in this single-layer soil may be shown through the
following relation of current, ground resistance, and the heat conductivity and resistivity of the
soil [3].
( )
Where:
δ is the soil temperature rise
I is the electrode current in Amperes
R is the ground resistance in Ohms
λ is the heat conductivity of the soil in in W/m-K
ρ is the resistivity of the soil in Ohm-meters
We can see that a poor estimate of soil resistivity may result in unaccepTable 3.temperature rises.
However, this formula is not directly applicable in practice; earth is usually multi-layered and has
a large range of resistances, ranging from 103Ω to 108Ω for soil and rock, respectively.

HVDC Transmission PSU-ECE POWER Engineers
52
It is also found that the resistivity of the earth is largely a function of the local moisture levels.
This means that the temperature rise in an electrode site will vary on the present level of moisture
within the soil and time since last rainfall. If the temperature of the soil rises too much during
electrode operation, high power losses will result from excessive soil drying.
Physical Configurations of Ground Electrodes
Land-based electrodes are usually configured as rings, stars, horizontal linearly, or vertical linearly
(deep hole). Simple version of ring and star configurations may be observed in Figure 3.5. Ring,
star, and horizontally linear land-based electrodes have conductors buried within a few meters of
the surface. Examples of ring electrodes would be Itaipu’s earth electrodes, with radii around
0.5km. Star electrodes have six rays that radiate out from the center of the electrode. This
configuration uses more conductor than ring electrodes, but the inner and outer parts of the rays
do not distribute current equally. The inner portion of the star distributes less current than the
outer, and is an inefficient use of conductor. Due to their large size in nature, these horizontally
configured electrodes must be placed some distance away from the terminal substation.
Figure 3.5 Ring (left) and Star (right) Earth Electrode Configurations. [3]
In contrast, deep-hole electrodes are less restricted by space. They are buried straight into the
ground and can be placed within close proximity of the terminal substation. The Baltic Cable
HVDC Link employs this configuration. Horizontal and vertically configured land-based
electrodes must be designed for the mechanical stresses caused by high winds and pressure,
respectively. As a result of being embedded within soil, land-based electrodes are all subject to
soil dry-out.
Sea-based electrodes are preferable to land electrodes because the benefits of current dissipation
may be achieved without as much concern of thermal factors such as soil drying. They may be

HVDC Transmission PSU-ECE POWER Engineers
53
configured either horizontally or vertically. The design criteria for sea-based electrodes are sea
bed currents and ice. Soil dry-out and other thermal stresses are not of significant concern. The
Sylmar side of the Pacific DC intertie uses the Pacific Ocean its earth return.
Pond and shore electrodes are alternatives when the sea is unavailable for practical
implementation. The design criteria for these electrodes are similar to that of sea electrodes;
heavy waves and ice are of major concern. Due to the geographical restrictions of water-based
electrodes, sea, pond, and shore-based electrodes are mostly used for submarine HVDC links.
Equations for the resistances of ring, vertical linear, and horizontal linear configurations are given
below [4]. Due to the fairly large nature of these electrodes, we can see that the resistance is
actually fairly small. The calculation of a star electrode is more in-depth, as it must consider
electrical coupling between the arms.
Ring Electrode:
(
)
Horizontal Linear:
(
)
Vertical Linear:
(
)
Where:
Re is the electrode ground resistance in Ohms
ρ is the resistivity of the soil in Ohm-meters
D is the diameter of the ring in meters
I is the total length of the conductor in meters
b is equal to , in meters
d is the diameter of the conductor in meters
h is the burial depth of the center conductor in meters

HVDC Transmission PSU-ECE POWER Engineers
54
Electrolytic Corrosion
The design of an earth electrode must consider the direction of current flow during operation. A
byproduct of this current flow is electrolytic corrosion. Electrolytic corrosion is the loss of ferrous
matter from a buried structure due to the flow of current. Depending on the respective terminal
end of each electrode, one will be considered a cathode and the other the anode. Since current
enters the cathode, it is usually unaffected by corrosion. On the other hand, protection for the
anode must be considered during the design of the electrode, especially if it is expected to
function as an anode for a significant period of time. “Corrosion of alternating current cause
about 1% as much corrosion as direct current of equal rms value [5].” Other affected structures
range from underground power interconnections, communications lines, gas pipes, oil pipes,
docks, structure foundations, and the electrode itself. The mass lost may be described as a
function of time and current [2].
∫
Where:
m is the mass of the element removed in kg.
n is the number of electrons transferred in half reaction.
F is Faraday’s constant = 96.485 C mol-1.
t2 and t1being final and initial times in seconds.
M is the average atomic mass of material.
i is the current in Amperes.
To put this into perspective, subjecting an iron electrode to 1000 Adc for one year would result in
a 9125kg loss of material [2]. This side-effect of prolonged operation of a monopole system is
clearly unacceptable. As a comparison point, a bipolar system with a 5 Adc unbalance will net a
loss of 45.625kg of iron. In both of these examples, the material losses are unacceptable.
This issue may be remedied through cathodic protection; the electrode may be backfilled with
petroleum coke. Petroleum coke is a byproduct of the petroleum process and has an average
resistivity of 0.3Ω-m. If good contact is made between the iron and coke, current will tend to flow
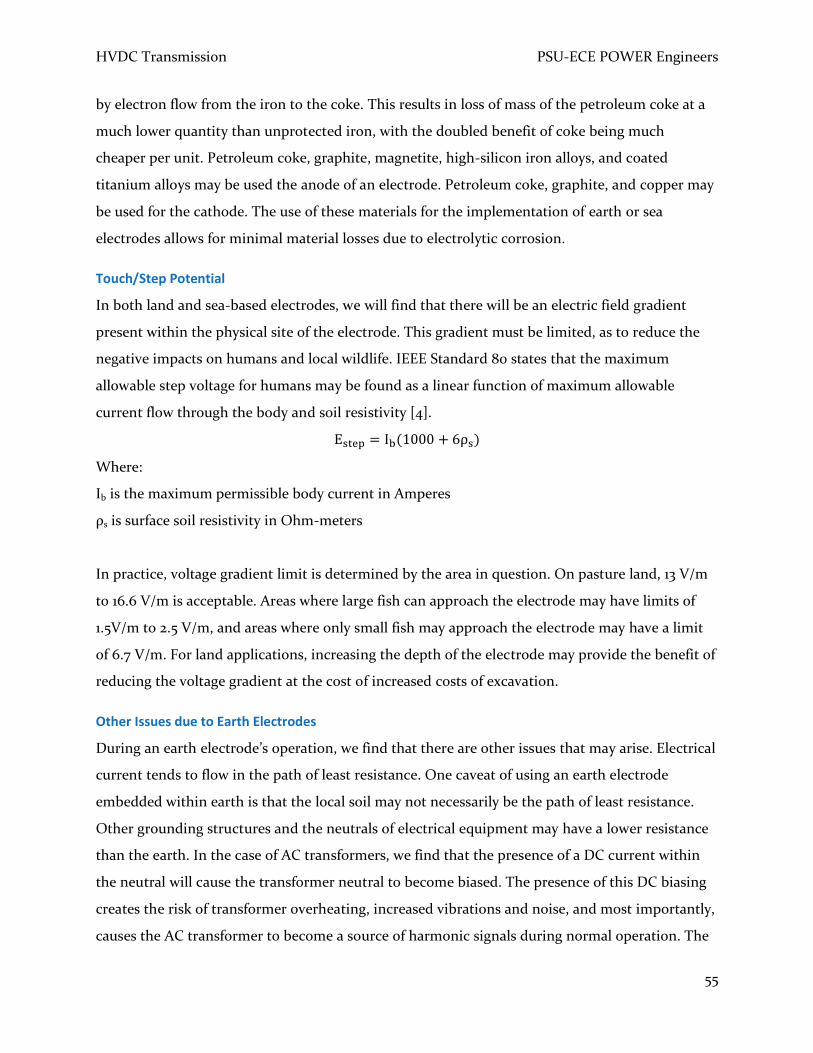
HVDC Transmission PSU-ECE POWER Engineers
55
by electron flow from the iron to the coke. This results in loss of mass of the petroleum coke at a
much lower quantity than unprotected iron, with the doubled benefit of coke being much
cheaper per unit. Petroleum coke, graphite, magnetite, high-silicon iron alloys, and coated
titanium alloys may be used the anode of an electrode. Petroleum coke, graphite, and copper may
be used for the cathode. The use of these materials for the implementation of earth or sea
electrodes allows for minimal material losses due to electrolytic corrosion.
Touch/Step Potential
In both land and sea-based electrodes, we will find that there will be an electric field gradient
present within the physical site of the electrode. This gradient must be limited, as to reduce the
negative impacts on humans and local wildlife. IEEE Standard 80 states that the maximum
allowable step voltage for humans may be found as a linear function of maximum allowable
current flow through the body and soil resistivity [4].
( )
Where:
Ib is the maximum permissible body current in Amperes
ρs is surface soil resistivity in Ohm-meters
In practice, voltage gradient limit is determined by the area in question. On pasture land, 13 V/m
to 16.6 V/m is acceptable. Areas where large fish can approach the electrode may have limits of
1.5V/m to 2.5 V/m, and areas where only small fish may approach the electrode may have a limit
of 6.7 V/m. For land applications, increasing the depth of the electrode may provide the benefit of
reducing the voltage gradient at the cost of increased costs of excavation.
Other Issues due to Earth Electrodes
During an earth electrode’s operation, we find that there are other issues that may arise. Electrical
current tends to flow in the path of least resistance. One caveat of using an earth electrode
embedded within earth is that the local soil may not necessarily be the path of least resistance.
Other grounding structures and the neutrals of electrical equipment may have a lower resistance
than the earth. In the case of AC transformers, we find that the presence of a DC current within
the neutral will cause the transformer neutral to become biased. The presence of this DC biasing
creates the risk of transformer overheating, increased vibrations and noise, and most importantly,
causes the AC transformer to become a source of harmonic signals during normal operation. The

HVDC Transmission PSU-ECE POWER Engineers
56
harmonics are generated within the transformer due to the imbalances within the magnetizing
forces caused by the DC bias. DC biases in transformer neutrals will also result in reactive power
losses within the AC system. Solutions to this problem require modifications to the AC systems in
question.
Three common solutions are to 1) use a series resistor in the neutral of the transformer, 2) add a
series capacitor on the AC line, and 3) to add a series capacitor in the neutral of the transformer.
Options 1 and 2 are non-optimal due to the cost of implementation. In Option 1, we find that the
required resistor would be too large to be economical. It would also have effects on the pre-
established protection equipment within the AC system, requiring even more modifications and
cost. In the case of Option 2, we find that it may sufficiently reduce the amount of neutral current
in the transformer. However, it is difficult and expensive to implement series capacitors on HVAC
lines. Furthermore, the presence autotransformers on the line cause the implemented capacitor to
be effective on only one tap.
Option 3 has been tested at Dayawan and Lingao nuclear power stations in China, and has been
found to be the most effective and economical [6]. The scheme involves placing a low impedance
capacitor in series with the neutral of the transformer, with a bypass in parallel with the capacitor.
The reasoning behind the bypass is to reduce the cost and special presence of the larger capacitor
required to handle larger transients in the event of a fault. Figure 3.6 shows a depiction of how
this series capacitor and bypass would be implemented. In the event of a fault, the bypass switch
would close, causing current to be shunted to ground through itself rather than potentially
overloading the capacitor. Once the fault has been cleared, the initial position shown below will
be re-established.
Figure 3.6 Series Capacitor Implementation to Restrain Neutral Current in Transformer. [6]

HVDC Transmission PSU-ECE POWER Engineers
57
As a result of uneven current distribution between the live conductor and earth electrode are not
equal, there will be uneven magnetic field distribution in the areas of the electrode and line. The
result of this is that field, if strong enough, may cause compass deviations. This may be of
problems in shallow sea-based electrodes, or within close proximity of the land-based electrode.
Another issue that arises from earth electrode operation is the generation of chlorine gas and
hydrogen. This is primarily an issue in seawater implementations, and when the electrode is
operating as the anode of the system. The gas produced at the electrode is a function of the
current and mass of the element. While the gas is poisonous to humans, it has been found that
the presence of chlorine is a good deterrent for life around the electrode [2]. Furthermore, a
majority of the gas is carried away by the seawater. The generation of gasses is not of major
concern, but should not be neglected during the design of the electrode.
Earth electrodes are an important component for HVDC transmission schemes. While grounding
schemes are implemented for protection purposes in AC systems, earth electrodes of HVDC
systems are designed for both normal and emergency operation. However, the side-effects of
continuous operation are less than desirable, and preventative measures must be implemented to
mitigate the potential damage caused by current flow within the electrode area. These reasons are
another advantage that bipolar schemes have over monopolar schemes- although more expensive,
a bipolar scheme will be able to serve more power, more consistently simply because of the fact
that it will have a very small amount of neutral current. The earth electrode in a bipolar system
will only be used in during pole failure or maintenance. A monopole system’s electrode will
constantly have the total magnitude of the line current flowing through the electrode, requiring
extensive cathodic protection of the anode.
Other issues that arise from the implementation of an earth electrode are soil temperature rise,
step potential, adverse effects in substation transformer neutrals, gas generation, and compass
deviations. These effects make the implementation of earth electrodes more desirable in locations
that are further from populated areas and important infrastructure.

HVDC Transmission PSU-ECE POWER Engineers
58
Insulation
Typically, insulators may be classified as external or internal insulation. External insulation is
exposed to weather conditions and contamination, whereas internal insulation is protected from
these conditions. Examples of each type of insulation would be the air surrounding a suspension
insulator and oil within a transformer, respectively. Insulation may also be classified as self-
restoring and non-self-restoring. This is defined by the insulator’s intrinsic ability to regain its
dielectric capabilities after a disruptive discharge. Air would be classified as a self-restoring
insulator, while paper insulation within a transformer would be non-self-restoring.
Suspension insulators are the connecting point between load bearing structures and the
electrically charged lines. Under normal operations, these insulators bear physical load from the
suspended conductors and also serve in establishing a self-restoring, external air insulator
between the supporting structure and the line. As manufacturers take care of strength testing
within their own design processes, electrical properties of insulating materials will be discussed in
this section. Although HVAC and HVDC insulators both serve the same purpose of maintaining
dielectric gaps from line-line, line-tower, and line-ground, the differences in their electrical
operation cause some discrepancies in line insulator design. One major difference between the
two modes of transmission is that HVAC line insulators are coordinated with switching
overvoltage and lightning events as the main design criteria, whereas HVDC insulator
coordination also must consider contamination buildup due to the unique aspects of HVDC
fields.
While conventional AC lines have three phases that oscillate at a set frequency, DC lines are held
at a set level during steady-state operation. The result of this is that the electric field around an
AC line will also oscillate as a function of time, whereas the field around a DC line will be
constant. Furthermore, the DC line has two poles that do not change in polarity, creating a
constant, relatively static environment around each pole. The issue that this poses is one of
uncertainty. As an example, the Itaipu +600kV transmission system was only finished in the late
1980s. Although there is research done on the subject of insulator design, much information is
also gathered through field implementations. These two combined sources of data allows for a
much more comprehensive understanding of design. However, HVDC projects are relatively
“new”, and as such, are lacking the extensive research that is available in their AC counterparts.

HVDC Transmission PSU-ECE POWER Engineers
59
Insulator Materials
Over the past two decades, it has been found that it is necessary to incorporate specific features in
DC insulator specifications to prevent premature degradations and ensure good performance over
time [7]. Typical materials used in insulator design are glass, ceramic, and composite polymer.
Although the IEC 61325 standard [8] has outlined design considerations for glass and ceramic
insulators, there lacks an equivalent standard for composite polymer insulators under HVDC
implementations. IEC 61325 discusses the resistivity of ceramic and glass through ionic migration
and thermal runaway. These two properties may be described through the effect caused by the
persistence of a unidirectional current flowing through the insulator bell. This current traveling
through the dielectric can generate some depletion of the atomic structure of the material,
reducing the material’s electrical and/or thermo mechanical and electromechanical properties [7].
The resultant effect of thermal runaway and ionic migration failure is insulator puncture or
shattering. The main cause for these current are impurities within the structure of the insulator,
such as sodium. In fact, thermal runaway studies have shown that the electrical resistances of
glass insulators will decrease from hundreds of MΩ to tens of MΩ for temperatures of 90°C to
120°, respectively [8]. As a result, it is important for the manufacturer of glass and ceramic
insulator bells to maintain a high quality of materials and thus, dielectric resistivity. Dielectric
purity is also the main limiting factor in ceramic and glass type insulator bells.
Although composite polymer insulators have not been in service as long as their ceramic and glass
counterparts, there has been a fair amount of testing through application. A major benefit of
utilizing composite polymer insulators on HVDC lines is that the composite may secrete
hydrophobic oils that encapsulate contamination particles and repel water. The result of this
passive flashover prevention makes composite polymer insulator strings increasingly attractive for
HVDC applications.
Other factors that come into consideration are local contamination levels. Under the field of a DC
line, it is found that airborne particles become attracted to the line and insulators. This continual
buildup of contamination on insulators may result in severe structural and electrical degradation
of the metal fittings of the insulators. In general, the positive pole of the line is considered for
aging and degradation conditions. The resulting corrosion could potentially cause insulator
failure, line drops, and adverse effects on leakage currents and flashover performance, particularly

HVDC Transmission PSU-ECE POWER Engineers
60
on the positive pole of the line. In Figure 3.7 below, we can observe the comparison of insulator
pins from Itaipu’s +600kV transmission system after 20 years of service. It is clear that corrosion is
much more prevalent on the unprotected surface. The addition of a protective zinc sleeve on the
pin has significantly reduced corrosion over the operational lifespan of the component.
Figure 3.7 Pin Corrosion as a Result of Contamination from Itaipu +600kV Bipole. Zinc Coating
(bottom right) and No Coating (bottom center). [7]
Leakage distances
Leakage distance may be defined as the shortest distance separating two conductors as measured
along an insulating surface. In the application of suspension insulators, this distance is formed by
the contour and sheds of the insulator. The unit for leakage distance is distance per kV, or
mm/kV. As local pollutant levels (dirt, smog, salt) increase, this leakage distance will have to
increase to reduce leakage currents and potential flashovers.
In AC insulators, the effective leakage distance may be calculated directly by the physical
dimensions of the insulator. This is because flashover arcs tend to travel along the surface of the
insulator string. However, in DC applications, flashovers tend to extend away from the insulator.
This creates a condition in which the physical leakage distance of the insulator may not be fully
utilized in the event of a flashover, requiring larger leakage distances and/or specialized shed
design. Table 3.1 shows how the recommended leakage distances for ceramic and porcelain HVDC
insulators increase significantly for varying levels of local contamination. It may also be noted
that a much longer leakage distance must be used for HVDC lines in comparison to HVAC lines.

HVDC Transmission PSU-ECE POWER Engineers
61
Contamination
severity
(mg/cm2)
Very Light
< 0.005
Light
0.005 – 0.02
Moderate
0.02 – 0.05
Heavy
> 0.05
HVDC Leakage
Distance (cm/kV) 2.0-2.5 2.5-3.2 3.2-4.0 4.0-7.0
HVAC Leakage
Distance
(cm/KV)
1.6 2.0 2.5 3.1
Table 3.1 Suggested Leakage Distances for AC and DC Insulators Under Contamination. [17]
Temporary Overvoltages and Lightning Performance
As per ANSI C92.1 and IEC Publication 72, the definition of an overvoltage is any transitory
voltage between phase and ground or between phases with a crest value higher than the crest value
of maximum system voltage [8]. An overvoltage may be characterized by insulator failure and/or
disruptive electrical discharge. The magnitude of these overvoltages varies on the operating
condition of the line and also the parameters of the initial event. Under operation, a line may
experience overvoltages as temporary overvoltages, switching overvoltages, and lightning
overvoltages. Events such as faults, changes in load, and open conductors may be classified as
temporary overvoltages, and typically do not exceed much higher than 2.0 p.u. Line energization,
line reclosing, fault occurrence, and changes in system reactance fall under the category of
switching overvoltages. Finally, lightning overvoltages are caused by the contact of lightning
strokes to the line. In the context of an HVDC system, it is found that the magnitudes of transient
events such as switching are limited by controls on the terminal ends of the system. This leaves
mostly lightning strikes and other weather events such as contamination as major concerns in
insulator design.
Lightning strikes are extremely short duration, high voltage and current events caused by
ionization of air. These events are of the highest concern when coordinating insulation for DC
lines. In comparison, AC lines are primarily concerned with switching surges. In the Figure 3.8, we
can see the increase of insulation requirements as altitude increases. It can be observed that
insulation coordination for lightning strikes is more dependent than for switching surges and

HVDC Transmission PSU-ECE POWER Engineers
62
contamination flashovers. Furthermore, the implementation of overhead shield wires act as an
effective way of deflecting lightning strikes to live conductors.
Figure 3.8 Comparison of Insulator Requirements as a Function of Altitude. [1]
Flashover Performance and Contamination
The voltage at which an insulator is able to sustain a dielectric gap across its length is called the
withstand voltage, or VW. The test process of establishing the withstand voltage is to apply a
voltage across the insulator in question. Although the value of VW is a quantifiable value and the
results of the test are binary, it has been found that the results of a repeated test may vary. For
example, one may find that at an overvoltage event may occur at a voltage lower than one initial
trial’s established VW. Furthermore, they might continue on to find that an overvoltage did not
occur at a voltage higher than VW. Due to this unreliability in results, overvoltage events must be
defined in statistical terms.
Other important properties of an insulator are its critical flashover voltage, critical withstand
voltage, and leakage distance. Critical flashover voltage (CFO) represents the voltage at which
there is a 50 percent probability of a flashover occurring on a particular insulator. Critical
withstand voltage (CWS) is defined as the value found when subtracting three standard
deviations from the critical flashover value. As per BPA’s experiments [10], this distribution
assumes a normal or Gaussian distribution, and represents a 0.13 percent probability of flashover.

HVDC Transmission PSU-ECE POWER Engineers
63
Flashover occurs under conditions in which electrical stresses surpass the dielectric barrier
formed by the insulator. DC systems are much more susceptible to flashover occurrences due to
the lack of current zeros, and the line's persistent electrical field. Through experimental evidence,
it is found that the addition of contamination – dirt, grime, dust, salt, etc., will tend to reduce the
critical flashover voltage level for insulator strings. Contaminants are attracted to the insulator
through three primary forces: gravity, weather, and electric field, with wind being the major factor
in contamination deposition. With the exception of conductive contaminants such as metal oxide
and petroleum coke, typical contaminants will not cause flashovers when dry. Typically, there are
three conditions from which a flashover may occur [11]:
a) When an insulator is wetted after being energized at normal working voltage for a long time.
b) When a wet polluted insulator has just been energized at its normal working voltage.
c) When a wet polluted insulator is subjected to a transient voltage.
The common issue with these conditions is the presence of moisture. The presence of
contamination will allow for moisture to adhere to the insulator’s surface, creating areas of low
resistance. This allows current flow, and thus, power dissipation in the form of heat, to occur on
the normally non-conducting surface of the insulator. As the wetted areas begin to dry out and
dry regions are formed along the surface, the local resistance in highly energized areas of the
insulator will increase. Noting Ohm’s Law and P = I2R, we find that the power dissipation per unit
area will increase with the resistance. The result of this drying action results in sparking across
the dry insulating bands of the insulator, until the width of the dry bands becomes too large for
the voltage potential to spark across. In the event that the electrical stress is sufficiently high to
jump across the length of the entire insulator, a flashover will occur. This process will repeat until
another flashover occurs, the insulator dries to a state where the voltage can no longer create a
spark, or the contaminants are washed away and the activity driven by the uneven voltage
gradient and leakage currents across the insulator fades away. Through empirical evidence, it has
been found that the contamination distribution on an insulator string is typically uneven. The
effects of rain washing, wind, and the presence of an electric field leave more contamination
towards the line-end of the insulator string, and less towards the tower-end.

HVDC Transmission PSU-ECE POWER Engineers
64
Due to the unpredictable nature of contamination distribution, researchers have developed
Equivalent Salt Deposit Density, or ESDD, as the standard way of measuring and testing
contamination on an insulator. However, it should be considered that live conditions may only be
replicated to a certain extent. In practice, it has been found that the BPA’s standard testing for
HVDC insulators include constant and variable voltage testing. Artificial contamination, such as
kaolin, sodium chloride, Bentonite, and calcium chloride, may then be applied in four ways [10]:
The specimen is dipped in a premixed slurry.
The contaminant is flowed over the insulator specimen.
The specimen is sprayed with either a wet or dry contaminant.
The contamination is deposited through the medium of a fog.
Two other factors that affect the flashover performance of insulators are insulator profile and
altitude. Insulator profile is an important aspect of insulator design because an effective profile
may decrease the likelihood of a flashover occurrence. While an AC arc propagates from one
underrib tip to another adjacent to the insulator surface, a DC arc is found to follow shorter paths
through the air [12]. The result of this property of DC arcs is that effective creepage length of the
insulator may be much shorter than the actual creepage length. The experimental results to a
study on effective insulator creepage length will show that the effective creepage length of an
HVDC insulator can be estimated in the formula shown below. It can be seen that the effective
creepage length of an insulator under DC conditions shrinks in comparison to the physical
creepage length as underrib complexity increases.
( )
Where:
Seff is the effective leakage length
S is the arc formed by the underrib of the insulator in centimeters
k is a constant dependent on the radius of the shed and contamination density
w is the distance between the peaks of each underrib in centimeters
d is the height of the underrib in centimeters
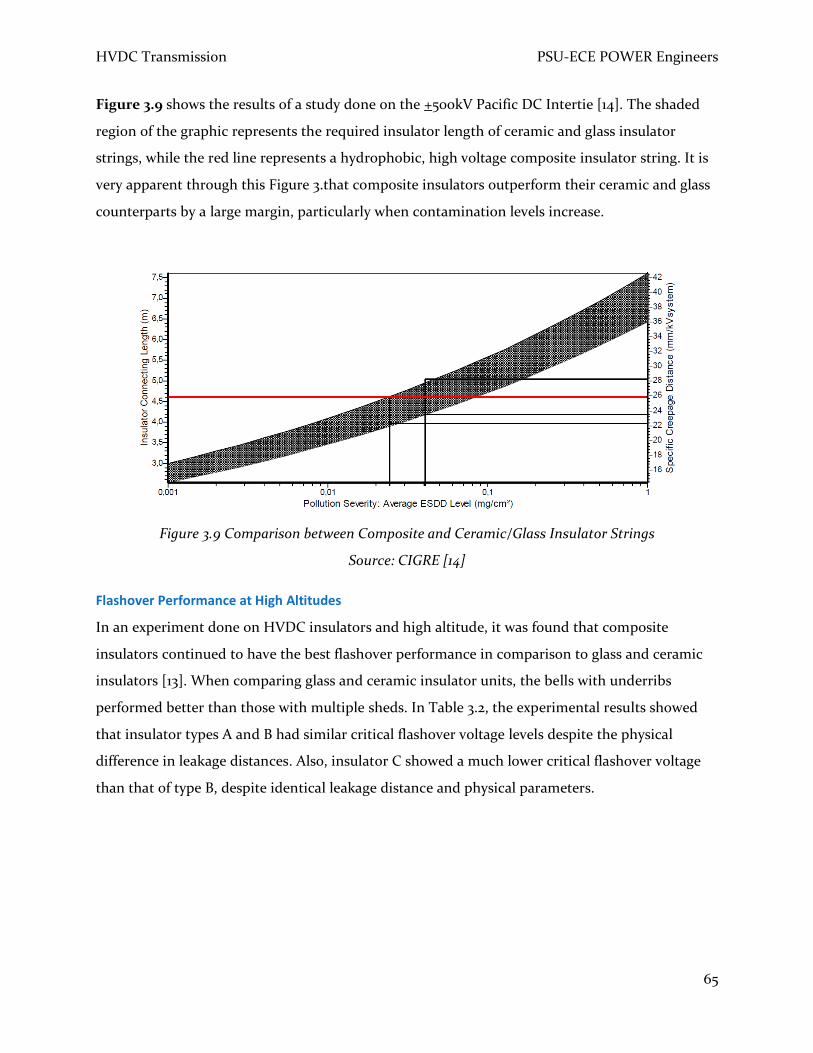
HVDC Transmission PSU-ECE POWER Engineers
65
Figure 3.9 shows the results of a study done on the +500kV Pacific DC Intertie [14]. The shaded
region of the graphic represents the required insulator length of ceramic and glass insulator
strings, while the red line represents a hydrophobic, high voltage composite insulator string. It is
very apparent through this Figure 3.that composite insulators outperform their ceramic and glass
counterparts by a large margin, particularly when contamination levels increase.
Figure 3.9 Comparison between Composite and Ceramic/Glass Insulator Strings
Source: CIGRE [14]
Flashover Performance at High Altitudes
In an experiment done on HVDC insulators and high altitude, it was found that composite
insulators continued to have the best flashover performance in comparison to glass and ceramic
insulators [13]. When comparing glass and ceramic insulator units, the bells with underribs
performed better than those with multiple sheds. In Table 3.2, the experimental results showed
that insulator types A and B had similar critical flashover voltage levels despite the physical
difference in leakage distances. Also, insulator C showed a much lower critical flashover voltage
than that of type B, despite identical leakage distance and physical parameters.

HVDC Transmission PSU-ECE POWER Engineers
66
Type Insulator Leakage Distance L.
(mm)
Unit Spacing
H. (mm)
Diameter of shell D.
(mm)
A
545 170 320
B 635 195 400
C 635 195 400
Table 3.2 Comparison of physical properties of insulator types A, B, and C. [13]
Furthermore, the experiment showed that an increase in altitude will cause the DC arcs to extend
more easily from the insulator surface in comparison to sea level. The result of this chance in arc
behavior results in a lower critical flashover voltage. In Table 3.3, we can see the differences in
critical flashover levels for ceramic bells operating at sea level and an altitude of 2000m for
different contamination levels. Through this set of data, we can see that altitude has a definite
effect of lowering the critical flashover levels of the ceramic bells in question.
SDD
mg/cm2
CFO (kV) Percent
Difference (%) 0 meter 2000 meter
0.03 15.89 13.99 12
0.05 11.25 9.94 12
0.10 8.52 8.05 6
0.15 7.17 6.53 9
Table 3.3 Comparison of flashover voltage at sea level and 2000m at varying contamination levels.
[13]
To compare the performance of glass and ceramic insulators, the glass bells shown in Table 3.4
were used. Figure 3.10 shows the comparison of flashover performance for insulator types B, C, D,
and E. It can be observed that the ceramic bell with underribs performed the best for the given
test parameter, despite the fact that it did not have the largest leakage distance. The poorest
performing insulator was specimen D, the smallest leakage distance and unit diameter. The
results of this comparison show that flashover performance of DC insulators depends on shed

HVDC Transmission PSU-ECE POWER Engineers
67
profile and shell diameter as well as physical leakage distance. The result of an increase in leakage
distance may not result in a proportional, linear increase in flashover levels.
Type Insulator Leakage Distance L.
(mm)
Unit Spacing
H. (mm)
Diameter of shell D.
(mm)
D
620 240 360
E 710 195 380
Table 3.4 Comparison of physical properties of insulator types D and E. [13]
Figure 3.10 Flashover Performance Comparison of Ceramic and Glass Insulator Types B, C, D & E.
[13]
When comparing composite polymer insulators, it was found that leakage distance had the same
principle behavior as in ceramic and glass insulator units. An increase in the leakage distance
resulted in improved, but non-linear flashover performance. The difference with composite and
their ceramic/glass counterparts is that profiles may be shaped more freely. The shed diameter,
shed spacing, and shed inclination angles of composite insulators may be altered to achieve
optimal flashover performance. Due to this flexibility in design, and natural hydrophobicity of the
composite material, these insulators continue to show superior flashover performance to their
ceramic and glass counterparts in high-altitude environments.

HVDC Transmission PSU-ECE POWER Engineers
68
In this section, a basis of insulator design considerations as well as lightning and flashover
performance has been presented. However, it should be made clear that the flashover
phenomenon is still not completely understood. While there is continual growth of empirical data
and formulas in insulator design for various environments, there are too many variables to
provide a straight-cut solution for every application. The research done in AC systems cannot be
directly applied to DC systems, as the fundamental operation of each mode of transmission is
different. The variance in testing procedures and lack of standards amongst researchers and
utilities creates an inconsistent atmosphere to develop in. Contamination is unpredictable and
varies from region to region, and may even show great variance within the span of the line. This
further complicates the issue of insulator design, and means that special considerations must be
taken into account for every line.
Corona
Introduction to Corona Discharge
By IEEE definition, corona is “a luminous discharge due to ionization of the air surrounding a
conductor caused by a voltage gradient exceeding a certain critical value.” Although corona is an
issue that must be dealt with in both AC and DC lines, the fundamental difference between the
two lies in the presence and lack of oscillation of the signal, respectively. During a corona event
on an AC line, we find that the ions are always attracted back towards the conductor, whereas
ions with the same polarity as the conductor on a DC line will be able to continually repel away.
The result of this is that AC corona is fairly local to the conductor, while the free charges may
extend much farther on a DC line.
It is important to note that there are two zones around a conductor when considering corona.
The ionization zone is found immediately around the conductor, about three orders of magnitude
smaller than the conductor-to-ground zone. In the event of corona, the high electric field present
on the line causes particles to collide with surrounding air molecules. If the particles are moving
with sufficient force, we find that air molecules become stripped of electrons, which in turn
become attracted to the positive pole or repelled from the negative pole of the line. Through this
movement, a cascading effect occurs where more air molecules lose electrons, and the process
continues. This results in ionization of the surrounding air, resulting in corona. The voltage on

HVDC Transmission PSU-ECE POWER Engineers
69
the line resulting in corona is known as the maximum conductor surface gradient, with units
kV/cm. Highest voltage gradients are found on sharp edges of surfaces, such as imperfections or
damaged areas of conductors. Furthermore, it should be noted that “appreciable corona power
losses do not begin at the critical onset voltage, but occurs only when the critical gradient for air
breakdown extends outward an appreciable distance from the conductor surface” [10].
For a bundled conductor configuration, the average and maximum surface conductor gradients
may be calculated by the Markt and Mengele method [2].
(
√(
)
)
( )
Where:
V is the voltage applied to the conductors in kV
R is the bundle radius in centimeters (see Line Design)
r is the sub-conductor radius in centimeters
H is the conductor height in centimeters
S is the pole spacing in centimeters
We can see that the average conductor surface gradient Ea is decreased with the number of
conductors in the bundle. Similarly, the maximum conductor surface gradient is increased with
additional conductors within the bundle. However, with economic costs in mind, more
conductors than necessary are not desirable in practice.

HVDC Transmission PSU-ECE POWER Engineers
70
Consequences of Corona
The major side effects of corona discharges are corona losses, radio interference, and audible
noise. The factors that affect corona are weather- rain, wind, snow, etc, and line parameters such
as conductor spacing. From BPA’s studies, we can see that losses for equivalent maximum
conductor surface gradients increase drastically from fair-weather to rain-weather. “Mean rain-
weather losses are 2 to 4 times the mean fair-weather losses, and short-term losses, such as during
heavy rain, may be 10 times the mean fair-weather losses. In contrast, ac rain-weather losses may
be as much as 50 times the fair-weather losses [10].” This trend continues for fog/snow and also
with wind. To summarize BPA’s findings, maximum corona losses result from rain, with slightly
lower losses in fog, and the twice the fair-weather losses in snowy conditions. In Figure 3.11, the
relationship between weather and corona losses for AC and DC systems may be observed.
Figure 3.11 Comparison of EHVAC and HVDC Corona Losses as a Function of Altitude and Weather.
[2]
Due to weather and other environmental factors such as contamination buildup being out of the
designer’s control, it is difficult to calculate an absolute value of corona loss on the line in
question. Instead, it is possible to estimate an approximate value of corona loss using the
parameters that are known for the line using empirical relationships between line voltage,
maximum voltage gradient, conductor height, pole separation, and conductor sizing [15].
(
)
(
)
(
)
(
)
(
)
and

HVDC Transmission PSU-ECE POWER Engineers
71
(
)
(
)
(
)
(
)
(
)
Where:
P are power losses by corona in dB above 1kW/km
P0,fair is 2.9dB and P0,foul is 11dB
V is the nominal line voltage in kV
g is the maximum gradient on the subconductor’s surface in kV/cm
H is the average height of the conductor above the ground in m
D is the distance between the poles in m
d is the subconductor’s diameter
The constants for the formula are g0 = 25kV/cm, d0 = 30.5mm, n0 = 3, D0 = 15m, H0 = 15m
Corona and Audible Noise
A portion of the energy lost during a corona discharge is acoustic energy in the form of crackling,
sizzling, or hissing. Audible noise falls within the range of human hearing, with frequencies of 20
Hz to 10 kHz [16].The major concern of audible noise is public annoyance. As with radio
interference, audible noise is primarily generated from the positive pole of the line. In Table 3.5,
the relationship between bundle sizing and the required right of way required by audible noise is
shown. It can be observed that the implementation of more subconductors within each pole’s
bundle will tend to decrease the AN output, which in turn reduces the required right of way for
the line. Consequently, smaller conductors will require that the right of way be wider than with
larger conductors.

HVDC Transmission PSU-ECE POWER Engineers
72
kV Conductor
Bundle Size MCM
Audible Noise
Right of Way
+600 3
2,515 52
2,167 62
1,780 78
+600 4
2,515 16
1,780 30
1,113 60
+600 5
2,515 16
1,780 16
798 44
Table 3.5 Right of Way for Variable Conductor Sizes and Bundle Size. [17]
The main differences between audible noise generated on a DC line versus that of an AC line is
that the former will tend to decrease during foul weather, while the latter will tend to increase.
Through empirical and experimental data, CIGRE has found that AN may be calculated with the
following formula for fair-weather conditions [17]. It can be observed that an increase in the
number of subconductors will have a positive effect in reducing the total audible noise generated
by the line. It is generally desired to have audible noise of 55dB or below at the edge of the
transmission line’s right of way.
( ) ( ) ( ) ( )
Where:
n is the number of subconductors
g is the maximum bundle gradient in kV/cm
d is the conductor diameter in centimeters
D is the radial distance from the positive pole in meters
k = 25.6 for n > 0 and k = 0 for n = 1,2
q is the altitude in meters

HVDC Transmission PSU-ECE POWER Engineers
73
AN0 = -100.62 for n >2 and AN0 = -93.4 for n = 1,2
In this section, DC corona events were briefly introduced. Corona discharges may generate radio
interference, audible noise, and result in power losses within the system. Corona discharges may
be reduced by the implementation of corona rings, which reduce the amount of sharp surfaces in
the system. However, it is not possible to completely eliminate corona. While corona losses are
certainly quantifiable, radio interference and audible noise during fair-weather conditions may be
of higher concern during line design. This is due to corona losses being much lower on a DC line
than that of an AC line.
In general, the basic mechanics of corona is understood. However, the interaction between the
electric fields and ions generated by an energized line and their effects on corona is not. Although
general rule-of-thumb statements have been presented in this section, there is much left to
understand and study on the topic of corona phenomena.
Field Effects of HVDC Transmission
Introduction to E&M Fields
In the design of transmission lines, the presence of electric and magnetic fields generated by
current flow through conductors must be considered. The major factors that affect field effects
are corona events, voltage and current levels, weather conditions, and the geometric arrangement
of the conductors and poles. The major difference between this section and the preceding
sections is that field effects are primarily a function of line parameters, and not the main focus of
line design criteria. It is important to establish dimensions of the line such that adverse effects do
not arise. The main issues that arise from the presence of these fields are public perception, touch
potentials, and interference.
Introduction to Electric & Magnetic Fields
The electric fields generated by a DC transmission line differ from that of an AC line because
current lacks the capacitive component present in an AC line. The capacitive coupling that is
produced by the AC line allows for currents to be induced in nearby objects. In contrast, the

HVDC Transmission PSU-ECE POWER Engineers
74
electric coupling within a DC line is resistive. The absence of this capacitive component creates
some difficulty in comparing DC and AC fields- measurements of magnitude a less-than-optimal
since, they one parameter does not entirely describe the effects of the field.
In regards to magnetic fields, it is important to note that the Earth itself generates a magnetic
field. Magnetic fields generated by the line may add to the Earth’s, and may potentially cause local
interference with bird migration, compasses, and other navigation equipment. The magnetic field
at the surface of the Earth is between 30-70μT. For a +500kV DC line, it is found that the magnetic
field generated is lower than 50μT. In general, HVDC lines generate magnetic fields with
magnitudes of less than 70μT, and are not of major concern during the design process.
The Effects of Electric Fields
For a human of 1.73m in height, BPA found that 3μA was experienced while standing directly
under a 4 x 30.5mm conductor line operating at +600kV. In Table 3.6, a comparison of the
interaction of current in humans between AC and DC lines is shown. It can be observed that even
underneath a +600kV DC line, no perception threshold was broken. Also, notice how there is a
significantly higher threshold for direct current for each criterion.
Current in Milliamperes
Direct Current 60 Hz rms
Men Women Men Women
No sensation on hand. 1.0 0.6 0.4 0.3
Slight tingling. “Threshold of Perception”
level. 5.2 3.5 1.1 0.7
Shock; uncomforTable 3.but not painful;
muscular control not lost. 9.0 6.0 1.8 1.2
Painful shock; muscular control not lost.
“Safe Let-Go” level for 99.5% of persons
tested.
62 41 9.0 6.0
Table 3.6 Physiological Effects and Thresholds for Body Currents and Shock Currents. [9]

HVDC Transmission PSU-ECE POWER Engineers
75
Although the field effects generated by HVDC lines have not been shown to have adverse effects
on organic life, the negative perception of them still stands. The solution to this problem is to
ensure that the right of way is wide enough to prevent the perception of strong physiological
effects. Through BPA’s research, “enough data was acquired to show that annoyance shocks from
objects adjacent to a dc line similar to the Test Line will rarely reach the “uncomfortable shock”
level, and that under most conditions, “perception” energy levels will rarely be attained [10].”
Another physical concern of electric fields is the buildup of charge on objects such as fences,
vehicles, and other metallic objects. Over a nine month study, BPA found that a barbed wire
fence, 17m away from the projection of the conductor, needed to be 20km long to store a charge
of 41mA, the “Safe Let-Go” level for women for direct current. For a metallic panel 30m from the
line to reach the 5.2mA perception level, the panel would need to have an area of 23,600m2, which
is highly unlikely in such close proximity of a HVDC line [10].
Concerns in regard to vehicles are twofold. The first being risk of shock, and the second being
potential fuel ignition. Vehicles with rubber tires may be simplified as a resistance with a
capacitance. When placing a vehicle on a grounding pad with the tires still attached, a test vehicle
was found to have 50MOhm of resistance to earth. Even so, the result was a mere “uncomfortable
shock”. In practice, vehicles should be properly grounded when in proximity of a live line.
Through experimentation, “the voltage attained by a person at ground level under or near a
+600kV line would seldom exceed 1.5kV, an energy level of 0.112 mJ or about 10% of the ignition
level [10].” Also, it was found that voltage on a vehicle with direct contact with the earth never
exceeded 1kV or a 1 mJ of stored energy. From these results, BPA deemed fuel ignition to be
highly improbable under natural conditions.
Radio Interference Generated by Electric Fields
Radio interference (RI) is the major effect caused by the fields generated by an HVDC
transmission line. Corona discharges are the main attributor to radio interference. Radio
Interference is usually measured from the positive pole of the line, as the negative pole generates
RI at about 6dB lower. The magnitude of RI may be characterized as inversely proportional to the
square of the distance from the pole up to 50m, and then inversely proportional to the distance
from the pole for distances greater than 50m. In Figure 3.12, this relationship between RI and
distance on the positive pole of a +750kV line may be observed. Average fair weather RI for

HVDC Transmission PSU-ECE POWER Engineers
76
bipolar HVDC lines may be described by the equation below. We can see that the radio
interference generated by an HVDC line is a function of maximum bundle gradient, conductor
size, distance, altitude, and the frequency in question [17].
(
) (
) ( ) (
)
Where:
RI is the radio interference level measured at a distance D from the positive pole in dB above
1uV/m
g is the maximum bundle gradient in kV/cm
d is the conductor diameter in centimeters
f is the frequency in Megahertz
D is the radial distance from positive pole in meters
q is the altitude in meters
g0 = 25.6kV/cm and d0 = 4.62cm
Figure 3.12 Lateral Profile of Radio Interference vs. Distance. [18]
An established method of measuring RI and whether it is within accepTable 3.limits is through its
Signal-to-Noise Ratio (SNR) [10].
HVDC Transmission PSU-ECE POWER Engineers
77
or (
)
The frequency band that is of interest for RI studies is 500 kHz through 1.7 MHz. These
frequencies represent the radio band used in AM broadcasting. Noting that accepTable 3.radio
interference is purely subjective, BPA found that a tolerable SNR was about 10:1. This means that
the signal must be 20dB above the radio interference generated by the line at the receiving
antenna. In comparison to AC lines, it appears that DC systems have a lower threshold for
accepTable 3.interference- accepTable 3.SNR for the former range from 15:1 to 25:1.
In general, DC radio interference is lower in humid weather than it is in clear weather. The
opposite is true in AC systems – RI is typically enhanced during foul weather in comparison to fair
weather. Radio noise is typically increased by wind, particularly when the direction is from the
negative pole to the positive pole. DC RI also tends to increase with temperature, whereas there
have been no trends observed between RI and variations of altitude.
Although it is important to consider every aspect of a project, we find that adverse effects from
electric and magnetic fields are more of an annoyance than limiting design criteria. Physiological
threats such as charge buildup require impractical or already un-safe conditions to be present in
close proximity of the live line. Radio interference is more difficult to gauge, as it is judged on a
subjective scale. However, established SNR levels point to this issue to not be of much concern;
the noisy signal generated by a HVDC line will tend to degrade quickly from the conductor, but
must retain a high magnitude with respect to the signal wave that it is interfering. The side effects
of these fields, even in close proximity to a HVDC line, prove to be relatively safe, and can be dealt
with by picking an adequately sized right of way.
Transmission References
[1] L. Weimers, “Bulk power transmission at extra high voltages, a coimparioson between
transmission lines for HVDC at voltages about 600kV DC and 800 kV AC”, ABB Power
Technologies, ABB.

HVDC Transmission PSU-ECE POWER Engineers
78
[2] “DC Transmission Circuits”, Alstom, HVDC Connecting to the Future, 2011.
[3] J. Ma, F. P. Dawalibi, W. Ruan, “Design Considerations of HVDC Grounding Electrodes”,
Transmission and Distribution Conference & Exhibition: Asia and Pacific, IEEE/PES, 2005, pp. 1-6.
[4] W. Ruan et al., “Performance of HVDC Ground Electrode in Various Soil Structures”,
PowerCon International Conference, 2002, vol. 2, pp. 962-968.
[5] E. W. Kimbark, “Direct Current Transmission”, New York: Wiley, 1971.
[6] Z. Yi-ying et al., “Studying on Measures of Restraining DC Current through Transformer
Neutrals”, Transmission and Distribution Conference & Exhibition: Asia and Pacific, IEEE/PES,
2005, pp. 1-7.
[7] J.M George, Z. Lodi, “Design and selection criteria for HVDC overhead transmission lines
insulators”, Conference on Power Systems, CIGRÉ, 2009, #189.
[8] V. Muralidhara et al., “Study of Thermal-runaway tests on insulators subjected to DC
voltages”, Interational Conference on High Voltage Engineering and Application, CPRI, 2008.
[9] “Transmission Line Reference Book, 345kV and Above”, 2nd edition, Palo Alto, EPRI, 1982.
[10] H. L. Hill et al., “Transmission line reference book, HVDC to +600kv: based on HVDC
Transmission Research Project RP 104”, Palo Alto, EPRI and BPA, 1976.
[11] P. J. Lamberth, “Effect of pollution on high-voltage outdoor insulators”, vol. 118, no. 9, IEEE
Proceedings, IEEE, 1971, pp. 1107-1130.
[12] T. C. Cheng, H. I. M. Nour,”A Study on the Profile of HVDC Insulators”, vol. 24 no. 1,
Transactions on Electrical Insulation, IEEE, 1980, pp. 113-117.
[13] F. Zhang et al., “Experimental Investigation on Outdoor Insulation for DC Transmission Line
at High Altitudes”, vol. 25, no. 1, Transactions of Power Delivery, IEEE, pp 351-357.
[14] J. Seifert, “Housing and Creepage Design of existing HVDC insulator installations”, 36 WG 11,
CIGRE.
[15] U. Corbellini, P. Pelacchi, “Corona losses in HVdc Bipolar Lines”, vol. 11, no. 3, Transactions on
Power Delivery, IEEE, 1996, pp. 1475-1481.

HVDC Transmission PSU-ECE POWER Engineers
79
[16] R.M. Morris et al,. “The Corona and Radio Interference Performance of the Nelson River
HVDC Transmission Lines”, vol. PAS-98, no. 6, Transactions on Power Apparatus and Systems,
IEEE, 1979, pp. 1924-1936.
[17] “Impacts of HVDC Lines on the Economics of HVDC Projects”, Task Force JWG-B2/B4/C1.17,
CIGRE, 2007.
[18] P. S. Maruvada, et al. “Corona Performance of a conductor bundle for bipolar HVDC
transmission at +750kV”, vol. PAS-96, no. 6, Transactions of Power Apparatus and Systems, IEEE,
1977, pp. 1872-1881.

HVDC Transmission PSU-ECE POWER Engineers
80
Wind Power Plants
Wind Power Plants Introduction
Wind power generation is the most rapidly growing technology for renewable power generation
[1]. However, wind power plants (WPPs) vary greatly from their traditional power generation
counterparts like hydro, nuclear, and coal generation plants. Beyond the issues of social,
economic, and environmental impacts, which will not be covered in this paper, there are certain
technical challenges that present themselves.
First, the differences between traditional power generation versus wind power generation, and the
associated technical difficulties, will be described. General wind turbine topics such as size and
descriptions of the various generator types that are currently available, including the advantages
and disadvantage of each, will follow. Design concerns of the collector system, including feeder
topology and transformer topics, are described in the next section. Then, system stability and
control interactions will round out the information presented regarding WPPs.
Traditional Power Generation vs. Wind Power Generation
Traditional power generation schemes are tried and true and leave room for very few surprises. In
stark contrast, WPPs have many problems with low voltage ride-through, harmonic distortion,
power system stability, and reactive power control, which require greater efforts on the part of
planners and operators in the areas of technology and decision-making. Other fundamental
differences in reliability, cost, and regulations further complicate WPP installation.
Hydro, nuclear, and coal plants are well-known for their reliability. They produce consistent,
quality, base-load power. The reliability issues with wind generation include a non-constant
prime mover (i.e. wind), wind turbine generators that are under constant development so they
have not been tested over the long-term for wear and tear and reliability, and adverse effects on
the local and larger grids created by WPP.
One of the topics of concern is the highly volatile costs associated with wind generation. This is
due to factors such as [2]:

HVDC Transmission PSU-ECE POWER Engineers
81
Shortages of turbines and components. This is a direct result of the dramatic recent
growth of the wind industry in the United States and Europe. Supply chains are hard-
pressed to keep up with the ever increasing demand.
The weakening U.S. dollar relative to the euro. Since many major turbine components are
imported from Europe and there are fewer component manufacturers in the U.S. the cost
in U.S. dollars remains relatively high.
A significant rise in material costs, such as steel and copper, over the last few years. Also,
there has been a marked increase in the cost of transportation fuels over the last few
years.
Unpredictable government incentives. For example, the Production Tax Credit has been
on-again, off-again. This causes uncertainty which hinders investment in new turbine
production facilities and encourages hurried and expensive production, transportation,
and installation of projects when the tax credit is available.
Unpredictable demand for wind turbines. When tax credits are available there are surges
in demand for wind generators. This prompts manufacturers to meet the demand by
cutting corners when producing the machines, e.g. lower quality lamination techniques.
This causes an increase in down time and repair costs to WPPs.
The connection agreements outlined for traditional generation plants, including rules governing
planning, metering, communications, and protection & control, are well-defined. In contrast, the
regulations defined for interconnections for wind energy have, historically, been somewhat of a
moving target. Innovation in the wind generation sector has been driven by the need to keep up
with complicated interconnection agreements and technical requirements for large wind plants
such as low voltage ride-through capabilities, power factor design criteria, and control & data
acquisition capability. These stipulations can prove to be onerous for the potential WPP owners
and operators.

HVDC Transmission PSU-ECE POWER Engineers
82
General Wind Turbine Topics
Wind Turbine Size
The question on many people’s minds regarding wind turbine size is, “How big will wind turbines
be?” The 1MW threshold was passed in 1995. Currently, there are projects underway for offshore
wind turbines that plan to top the 20MW rating. [3] Figure 4.1 below depicts the size evolution of
wind turbines over time and compares the growing rotor diameters to the wingspan of an airbus
A380, which has a wingspan of 80m. Also, it can be noted, that wind velocities increase at higher
altitudes. This drives increases in wind turbine height.
Figure 4.1 Size evolutions of wind turbines over time. [4]
There are a few main drivers of continued wind turbine scaling. One of the reasons is because cost
is directly associated to the number of towers that have to be erected. While larger capacity units
are more expensive, a reduction in the amount of towers relative to MWs of installed capacity
equates to a cost savings. Larger turbines can also use land and wind more effectively than their
smaller counterparts. In the public funding of wind energy, size tends to be regarded as a metric
of technological progress.

HVDC Transmission PSU-ECE POWER Engineers
83
Square-Cubed Law
The energy produced by a wind turbine system is proportional to the swept area of the rotor and
therefore the square root of the rotor diameter. Costs for the materials for the system are
proportional to the volume of the mass of the material in the system, and therefore the diameter
cubed. This relationship is known as the square-cube law. It implies that for the wind turbine
alone, excluding capital and infrastructure costs associated with the wind farm, the cost per unit
capacity increases linearly with wind turbine scale. There are variations to this rule when
considering actual manufacturing processes and detailed modeling of systems, but it generally
holds true.
Betz’s Limit
In 1919 physicist Albert Betz showed that the hypothetical limit of wind energy extraction by a
machine is limited to 16/27 (59.3%) of the kinetic energy of the wind to be captured due to the
fundamental laws of conservation of energy and mass. Known as Betz’s limit, modern wind
turbines may reach 70-80% of this theoretical limit allowing over 40% of the total kinetic wind
energy to be captured. [5]
Cut-In, Rated Output and Cut-Out Speeds
The power output from a wind turbine varies with steady wind speed. At very low speeds there is
insufficient torque exerted on the blades to make them rotate. The speed at which the wind must
blow in order to cause the blades to first rotate is referred to as the cut-in speed. This is
commonly between 3 and 4 meters per second. [6] As the wind speed rises above the cut-in speed
the power output from the machine rises. However, there is a limit to this increase. At between 12
and 17 m/s the output reaches the electrical limit that the generator is capable of. This is the rated
power output of the machine. As the speed of the wind increases above the rated power output of
the machine, at some point, there is risk of damage to the rotor. As a result, power control
regulations, as described below, are employed. This state of operation is known as the cut-out
speed. Figure 4.2 below illustrates these wind speeds versus power output.

HVDC Transmission PSU-ECE POWER Engineers
84
Figure 4.2 Wind turbine power output variations with steady speed wind [6]
Power Control
As mentioned previously, there are various wind speeds at which the turbine produces power and
at which it ceases to operate in order to not become damaged. In order to control wind
speed/power interactions two main methods are employed.
Stalling is a power regulation method designed to protect both the generator and the mechanical
structures of the turbine during high wind speeds. Power production decreases with wind speed
above a certain value. This is a passive power regulation scheme where the blades are designed to
perform worse, in terms of energy extraction, in high wind speeds to protect the turbine. [7]
Pitch regulation works by increasing or decreasing the angle of attack formed by the angle of the
blade to the wind. This is an active control type where the rotor blades are turned about their
vertical axis. When the wind speed is not higher than that for rated power output the blade
incidence stays near the angle of 0. This captures the maximum amount of energy from the wind.
However, when the wind is above rated speed the pitch control mechanism changes the blade
incidence so that the output power of the generator is within the allowed range. Figure 4.3 below
illustrates the power output versus wind speed difference between pitch-regulated and stall-
regulated systems.

HVDC Transmission PSU-ECE POWER Engineers
85
Figure 4.3 Power output difference between pitch-regulated and stall-regulated turbines. [7]
Besides one being active and one passive, the main difference between these control methods is
the fact that pitch regulated turbines have the capability to capture maximum power from the
wind all the way up to cut-out speed while stall controlled systems taper off in power output
before full cut out. Pitch control systems have the ability to capture more power at very high wind
speeds.
Materials
Of greatest concern in turbine material selection is the issue of fatigue. Materials can withstand
great loads when applied once, but when a load is applied, removed, and applied again this can
cause fatigue damage. Since the force of the wind is applied and reapplied over and over this topic
must be taken into consideration. The loads that contribute to wind fatigue, including wind
shear, yaw error, yaw motion, gravity, stochastic loads from turbulence, and wind gusts all
contribute to component fatigue. These can vary widely depending on the location and the
environment in which the turbine is installed. However, this value can be quantified and utilized
in the selection of materials for a particular installation.
Two of the most important materials used in wind turbines are steel and composites, the primary
material used in blade construction. The composites typically comprise fiberglass, carbon fibers,

HVDC Transmission PSU-ECE POWER Engineers
86
or wood mixed together with a matrix of polyester or epoxy. Other common materials include
copper (electrical components) and concrete for the base of the turbine structure.
Wind Turbine Generator Types
Squirrel Cage Induction Generator (Type 1)
The internal construction of squirrel cage induction generators (SCIGs) consists of a cylinder
mounted on a shaft with conductive bars set into grooves and connected at both ends by rings,
forming a cage-like shape; hence their name. The field windings in the stator of an induction
motor set up a rotating magnetic field. The relative motion between this field and the rotor
induces electric current in the conductive bars. In turn, these currents lengthwise in the
conductors react with the magnetic field of the motor to produce force acting at a tangential to
the rotor, resulting in torque to turn the shaft. In effect the rotor is carried around with the
magnetic field, but at a slightly slower rate of rotation. The difference in speed is called slip and
increases with load. [8] SCIGs are connected directly to the step up transformer. The turbine
speed is (nearly) fixed to the electrical grid’s frequency. Real power is generated when the turbine
shaft rotates faster that the electrical grid frequency, creating negative slip. While there is a bit of
slip that causes variability in the generator’s output, SCIGs generally operate at or very close to
rated speed. These turbines consume reactive power for their excitation field. Because of this
there are compensating capacitors between the generator and the grid to control the power
factor.
The reactive power consumed by these machines for its excitation field is a major drawback. Also,
these machines can draw extremely large currents when starting. To mitigate this effect a soft-
starter scheme, which effectively limits inrush current, is employed. These generators are not
commonly used anymore except in small generation applications.

HVDC Transmission PSU-ECE POWER Engineers
87
Figure 4.4 Squirrel-cage induction generator. [9]
Wound Rotor Induction Generator (Type 2)
The wound-rotor induction generator (WRIG) or asynchronous generator operates similarly to
the SCIGs described above as they mechanically turn their rotor faster than the synchronous
speed, creating negative slip. The stator flux rotation is faster than the rotor rotation. This causes
the stator flux to induce rotor currents, which create a rotor flux with magnetic polarity opposite
the stator. In this way, the rotor is dragged along behind the stator flux. The stator flux induces
currents in the rotor, but since the opposing rotor flux is now cutting the stator coils, an active
current is produced in stator coils, sending power to the electrical grid. [10]Full rated power of the
generator is reached at very small slip values, typically 3%. Meaning, with a synchronous speed of
1800 rpm, full output power is produced at 1860 rpm.
Like SCIGs, WRIGs are connected directly to the wind turbine generator (WTG) step-up
transformer. However, they also include a variable resistor in the rotor circuit. These are either
mounted externally or on the rotor directly. The latter eliminates the need for slip rings. The
variable resistors can control the rotor currents so as to keep constant power even during rapidly
changing wind conditions. The resistors allow some ability to control the speed in order to
accomplish the best energy capture.

HVDC Transmission PSU-ECE POWER Engineers
88
Figure 4.5 Induction generator. [9]
By adding resistance to the rotor circuit higher slip can be achieved and higher speed ranges. This
allows some ability to control the speed by wind variations of up to 10% and achieve the best
energy capture. Also, this offers some self-protective torque control that decreases the mechanical
stresses on the machine.
Because these generators must be excited by a leading voltage they are not capable of black-
starting should the whole plant be shut down for any reason. In order to restore generation of
power they must rely on the external electric power transmission network. Like SCIGs, they are
normally not used in large power generation situations anymore.
Doubly-Fed Induction Generator (Type 3)
Due to their low cost and versatility, doubly-fed induction generators (DFIGs) dominate the wind
power market today. DFIGs are three-phase wound-rotor induction machines that feed AC
currents into both the stator and rotor windings. The machine operates like a synchronous
generator whose speed (i.e. the speed at which the shaft must rotate to generate power at the AC
power network frequency) can be varied by adjusting the frequency of the AC currents fed into
the rotor windings. This is to say that the magnetic field passing through the generator windings
not only turns due to the generator rotation, but also due to the AC currents fed into the rotor
windings. Thus, the frequency of the alternating voltage produced by the stator windings is
determined by both the speed of the rotor as well as the frequency of the AC currents being fed
into the rotor windings. When the magnetic fields of the rotor’s windings turn in the same
direction as the generator rotor, the rotational speed of the rotor and speed of the magnetic field
add up. Conversely, when the magnetic field of the rotor windings turns in the opposite direction

HVDC Transmission PSU-ECE POWER Engineers
89
as the generator rotor the speed of the rotor and speed of the magnetic field subtract from each
other. It is in this way that the frequency of the voltages induced across the stator windings of the
generator can be controlled. The operation of DFIGs allows them to be directly connected to the
AC power network as the frequency produced by the stator is in synch with the network.
Figure 4.6 Double-fed induction generator. [11]
The primary advantage of DFIGs is the ability to allow the amplitude and frequency of their
output voltages to be maintained at a constant value, no matter the speed of the wind blowing.
This is why they can be directly connected to the AC power network. DFIGs also have the ability
to control power factor by adjusting the amount of reactive power exchanged between the
generator and the AC power grid while still keeping the power electronics in the wind turbine at a
moderate size. Also, in these variable-speed wind turbines, the speed of the rotor is allowed to
vary as the wind speed varies. This means wind gusts won’t cause as great of stresses on the
mechanical components such as the gear box and the rotor as their fixed-speed counterparts.
One disadvantage of the DFIG configuration is the complex power conversion circuitry required.
Also, the slip-rings on the wound-rotor induction machine require periodic maintenance. While
the DFIG requires two AC-DC converters, like the full-converter scheme (see below), these

HVDC Transmission PSU-ECE POWER Engineers
90
converters are significantly smaller than the synchronous converters. DFIGs only convert
approximately 30% (as opposed to 100% in the full-converter scheme) of the nominal generator
output power to be exchanged between the rotor and stator and the AC network, so the power
electronics are considerably smaller.
Full Conversion (Type 4)
Type four generators are direct drive generators that achieve variable speed operation by
connecting the generator to the grid through an AC-DC-AC converter. The generator type can be
synchronous, permanent magnet, or induction; the permanent magnet version being somewhat
cost-prohibitive due to the current high demand for rare-earth metals. Also, it has been
discovered that the permanent magnets tend to become demagnetized by the powerful magnetic
fields inside of a generator.
Figure 4.7 Full-conversion wind turbine generator. [11]
Since wind as a prime mover is a variable speed source an indirect grid connection, or full
converter scheme, is used to connect the generator to the AC grid. In this way it is possible to run
the turbine at varying rotational speed, generating variable frequencies from the stator. Since AC
current with a variable frequency is not suitable for the grid an AC-DC-AC conversion scheme is
used. First, the variable frequency AC power is rectified to DC with the use of thyristors or large
power transistors. Then, the fluctuating direct current is converted to alternating current of the
same frequency as the grid using a pulse-width modulated (PWM) or thyristor inverter. Initially,
the current that comes out of an inverter looks very little like the smooth current of the grid.
However, these rectangular-shapes waves can be, mostly, smoothed out by using capacitors in an
AC filter mechanism.

HVDC Transmission PSU-ECE POWER Engineers
91
One advantage of this type of grid connection is that gusts of wind can be allowed to turn the
rotor faster. This excess rotational energy can be stored in the rotor. This requires an intelligent
control strategy in order to reduce peak torque (causing wear on the gearbox and generator) and
reduction of fatigue loads on the tower and rotor blades. Another advantage of the full converter
scheme is that, with the use of power electronics, the reactive power to the grid can be controlled.
This can greatly improve the power quality to the grid, especially weak ones. This is also why this
is often the generator type of choice for areas with strict grid regulations. There has been research
regarding the production advantages connected to the ability to run the machines at optimal
rotational speed, however, the economic advantage seems to be so small that it can hardly be
taken into account when making decisions regarding generator types.
The main disadvantage of indirect grid connection is cost. The need of a rectifier and two
inverters, one to control the stator current and one to generate the output current, can be costly.
However, the price for solid-state power electronics continues to decline. The other disadvantage
is the energy lost in the AC-DC-AC conversion process of the full rated power of the machine and
the fact that, even with the use of power electronics, harmonic distortions may still be introduced
into the grid.
Synchronous Generator (Type 5)
Synchronous WTGs consist of a variable-speed drive train connected to a torque/speed converter
coupled with a synchronous generator. The torque/speed converter changes the variable speed of
the rotor shaft to a constant output speed. The closely coupled synchronous generator, operating
at a fixed speed (corresponding to grid frequency), can then be connected directly to the grid
through a synchronizing circuit breaker. The synchronous generator can be designed for any
desired speed (typically 4 or 6 pole) and voltage.

HVDC Transmission PSU-ECE POWER Engineers
92
Figure 4.8 Synchronous wind turbine generator. [9]
Since a synchronous generator is employed in these Type 5 machines an automatic voltage
regulator is typically needed. These devices can be programmed to control reactive power, power
factor, and voltage. Again, this can be very advantageous when connected to a weak local grid or a
grid with extremely tight regulations.
Collection System
Wind WPP collector systems have many things in common with traditional utility electric
systems. However, there are also characteristics unique to these systems that require special
attention. Many of the considerations are driven by cost and reliability.
Feeder Topology
Feeder topology, or collection system layout, is unique to each WPP installation and can vary
widely based on factors such as turbine placement, terrain, reliability, landowner requirements,
economics, and expected climactic conditions for the location. [12] Turbine locations and the
point of interconnection (POI), where the WPP feeds into the electrical grid, are the primary
factors in determining the feeder layout. The collector substation can be directly connected to the
POI unless the POI is located far from the WPP, in which case a transmission line may be
required.
Most WPPs built in North America have radial feeder configurations with a system voltage of
34.5kV because distribution transformers of this rating are readily available for purchase. Turbines

HVDC Transmission PSU-ECE POWER Engineers
93
are connected in a “daisy-chain” fashion outward from the substation to the furthest turbine.
Figure 4.9 below illustrates a typical collector circuit. The feeders are commonly underground,
but overhead lines may also be built. Each feeder sting may also have branch strings connected by
sectionalizing cabinets or junction boxes. These have separable connectors which allow a feeder
sting to be isolated for maintenance or repair while allowing the remaining wind turbines to stay
in operation. One alternative to sectionalizing cabinets are pad-mounted switches that can more
easily isolate a feeder for maintenance or troubleshooting. However, the increased cost needs to
be weighed against the expected frequency of operation.
Figure 4.9 A Typical collector circuit. [12]
The number of WTGs connected to an individual feeder string is limited by conductor ampacity.
In addition, the total number of collector circuits is limited by the size of the substation
transformer at the collector substation. Underground feeders are generally limited to 25-30MW
per string due to soil thermal conditions and practical cable sizes. Parallel conductors may be
combined at the collector substation circuit breaker in order the increase the number of WTGs on
a feeder.
HVDC Transmission PSU-ECE POWER Engineers
94
Overhead conductors can carry more power than comparable underground conductors, typically
up to 40-50MW per sting, but will have higher losses associated with them. Overhead conductors
typically have more outages than underground circuits but the outages will usually be shorter in
duration. If a feeder sting experiences a failure, the entire generating capacity of that string is lost
until it can be repaired. The aforementioned sectionalizing cabinets can help to isolate the
damage and allow some portion of the WTGs to be returned to service more quickly.
Turbine Step-Up Transformer
For wind turbines of the MW size a step-up transformer is needed for each WTG. Pad-mounted
three-phase distribution transformers are commonly used for WTG step-up transformers. While
transformers are sometimes located in the nacelle or on platforms in the tower these will be of
varying proprietary design since they are provided by the manufacturer. Many WTG
manufacturers specify delta (MV)-grounded-wye (LV) connections for wind turbine step-up
transformers. This is intended to provide isolation of the WTG from the zero-sequence behavior
of the collector feeder; e.g. a phase voltage rise during ground faults. Grounded wye-wye
transformers are more commonly used for utility load-serving applications, and are thus more
widely available. These transformers are a commodity and meet the required function at
minimum cost.
Pad mounted transformers are usually protected by internal fuses. Due to the short-circuit
current available in most wind applications, current-limiting fuses are usually needed. These fuses
are either coordinated with expulsion fuses, or full-range current-limiting fuses are applied. LV
molded-case circuit breakers are sometimes installed inside the transformer secondary
compartment to provide coordinated protection through to the end of the secondary cables and
may help in reducing arc-flash levels. Attention should be given to the ambient temperature for
the mounting location, based on the molded case circuit breaker specifications. An internal MV
oil switch, typically referred to as a load break oil rotary switch, is commonly specified to allow
isolation of the transformer and permit continued operation of other WTGs further down the
line.
Transformer primary terminals can either be live-front bushings, or separable connector (“elbow”)
bushings. There are two types of elbows: load-break elbows, which are rated up to 200A load
current, and dead-break elbows rated up to 600A. Load-break elbows allow the transformer
connections to be opened “live” under load current conditions, using a hot-stick. To operate the

HVDC Transmission PSU-ECE POWER Engineers
95
600A elbow connections the circuit must be de-energized. When elbow bushings are applied, it is
common to specify a feed-through configuration, which provides two bushings for each phase,
and an internal connection between each pair of bushings. This allows both the substation-side
and remote-end side cables in a daisy-chain radial configuration to connect directly to the
transformer without junction boxes. Where there is a number of wind turbines connected in a
radial string, the 200A capability of load-break elbows is a significant restriction. Also, many wind
plant operators do not have hot-stick-trained technicians on their permanent maintenance crews.
It is common practice to select transformers with a standard kVA rating, as listed in IEEE’s
C57.12.24 standard, which is at least as large as the kVA rating of the WTG. This is extremely
conservative in applications due to the cyclical loading of the WTG step-up transformers. It is
common practice in utility load-serving transformer applications to intentionally select a
transformer rating less than the minimum load, thus subjecting the transformer to limited-
duration overloads. The loss-of-life of a transformer due to loading is a cumulative function of the
temperatures to which the windings are exposed, and the winding temperature. IEEE C57.91
specifies transformer thermal modeling and aging functions that can be used to determine a
transformer kVA rating that provides adequate service life for the particular WPP application;
both loading cycles, and the contemporaneous ambient temperature conditions.
System Stability
Flicker
Flicker is a voltage control issue that directly relates to wind turbines because wind is a constantly
fluctuating prime mover. In constant-speed turbines (Types 1 and 2) prime mover fluctuations are
directly translated into output power fluctuations because there is no buffer between mechanical
output and electrical output. [1] This can cause fluctuations that cause unwanted grid voltage
fluctuations. These can be especially troublesome to weak grids. However, in variable-speed wind
turbines (Types 3 and 4) wind speed fluctuations are not directly translated to output power
fluctuations. The rotor inertia and power converter schemes act as energy buffers.

HVDC Transmission PSU-ECE POWER Engineers
96
Low Voltage Ride-Through
Low voltage ride-through (LVRT), or fault ride-through, capabilities during periods of low grid
voltage are an important factor in the selection of WTGs for a WPP project. In systems where
there are many distributed generators subject to low-voltage disconnect, like WPPs, there is the
possibility to create a chain reaction which will take the entire set of generators down. This can
occur when there is a voltage dip that causes one of the generators to disconnect from the grid.
This disconnection causes further voltage drop which then causes another generator to trip
creating a cascading failure. A full-cascading failure could cause unreasonable stress on a weak AC
grid. FERC order 661-A calls for WPP to ride-through a three-phase fault on the high side of the
substation transformer for up to 9 cycles [13]. Type 1 WTGs may require a central reactive power
compensation system in order to meet the FERC standard. Most Type 2, 3, and 4 WTGs
manufactured today meet the requirements of the order. Since Type 5 synchronous generators are
so similar to standard grid-connected generators their LVTR capabilities are well-known. In order
to meet FERC requirements the turbine control system, excitation system, and protection systems
are coordinated for each specific site.
Short Circuit Behavior
The short circuit behavior of WTG generators depends on the type. The short circuit current
behavior of the induction-type WTGs is the same as for induction motors. The initial current
contribution to a three-phase fault can be modeled as the sum of the generator’s subtransient
reactance and the system impedance from the machine terminals to the fault [14]. Generally, the
current that is added to the fault by the generator extinguishes as the rotor flux collapses. This is
unless there is some sort of reactance maintaining the generator excitation. For unbalanced faults
both the positive and negative reactances are considered to be equal. WTGs are normally
ungrounded so they do not usually feed fault current from the ground. Generally, studies of WPPs
model many WTGs as one equivalent generator. This is also the case for short circuit modeling.
The rating is equal to the sum of the WTGs in the plant in series with an equivalent impedance
representing the plant generator transformers, collector cables, and substation transformers. For
DFIGs, if during the fault, the rotor power controller remains active, the stator current is limited
to 1.1 to 2.5 p.u. of the machine rated current. However, if the rotor circuit fails the DFIG
contributes currents as high as 5 to 6 p.u.

HVDC Transmission PSU-ECE POWER Engineers
97
For full-conversion generators the fault currents will be limited to just slightly above rated
current. Due to the sensitive power electronics in the power converter controls it is necessary to
protect the power semiconductor switches. This is done through the highly controllable pulse-
width modulation at the heart of the full-converters. Type 4 WTGs short-circuit currents can vary
greatly because of differences between manufacturers proprietary control designs.
Type 5 generators exhibit typical synchronous generator behavior during grid short circuits.
Current contributions can be calculated based on machine constants available from the
manufacturer. Typically, generator fault current contribution can range from 4 to more times
rated current for close-in bolted three-phase faults. For single-line to ground faults it can range
from nearly zero amps, when the generator neutral is ungrounded, to more than the three-phase
bolted level.
Control Interactions
To build up the electromagnetic fields needed for power generation reactive power is drawn from
the grid. In wind power this poses a particular challenge; because of changing wind speeds wind
turbines cannot generate electrical power at a constant rate. If a substantial amount of reactive
power has to be drawn, as in the case of a black start-up of the WPP, it can have adverse effects on
the AC system or even cause an outage. Reactive power capabilities in WTGs are especially
important since most grid codes require reactive power capability at the POI to be between ±5%.
[5] Also, without reactive power compensation, the integration of wind power in a network may
cause voltage collapse in the system and under-voltage tripping of wind power generators.
Reactive Power and Power Factor
Type 1 and 2 generators typically use power factor correction capacitors (PFCCs) to maintain
reactive power at a specified amount. [9] When a full-load compensation scheme is used the
PFCCs are sized for unity to slightly lagging power factor. The PFCCs are typically multiple stages
of capacitors that are switched by a low-voltage contactor. Type 3 WTGs have reactive power
capabilities of 0.95 lagging to 0.90 leading at the terminals of the machines. Some of these
machines can deliver reactive power even when and no real power in being generated. Type 4
WTGs offer full control of the effective power factor over a wide range of voltages. These
machines can also deliver reactive power when the machine is not operating mechanically. Type 5

HVDC Transmission PSU-ECE POWER Engineers
98
WTGs typically offer a range of 0.9 leading to 0.9 lagging power factor. At outputs below rated
power, the reactive power output is only limited by rotor and stator heating, stability concerns,
and local voltage conditions. Like some Type 3 and 4 WTGs the machine may be operated as a
synchronous condenser, with adjustable reactive power output. This could prove to be especially
useful where the WPP is connected to weak grids.
Static VAR Compensators
Static compensation like PFCCs, may be unable to prevent voltage collapse at the POI, however,
dynamic reactive power compensation using static VAR compensators (SVC) is successful in
maintaining acceptable voltage levels where the WPP is connected to the AC power transmission
network. [15] SVCs have the ability to provide voltage support at the POI either by supplying or
absorbing reactive power. They are a part of the flexible AC transmission system (FACTS) family,
known for regulating voltage and stabilizing systems. SVCs are automated impedance matching
devices that bring the transmission system closer to unity power factor. When the WPP is
consuming reactive power the SVC’s capacitor banks are automatically switched in, thus
providing a higher system voltage. The main advantage of SVCs over simple mechanically-
switched compensation schemes is their near-instantaneous response to changes in the system
voltage.
STATCOMs
A static synchronous compensator, or STATCOM, is a regulating device based on a power
electronics voltage-source converter. It can also be implemented to maintain appropriate voltage
regulation at the POI to the AC system. It acts as either a source or sink of reactive power to the
AC network. It is also a part of the FACTS family of devices. The STATCOM is a voltage source
with variable amplitude. If the amplitude is set to a higher value than the grid voltage the
STATCOM injects reactive power into the grid. Inversely, if its amplitude is lower than the grid
voltage it absorbs reactive power. One of the main advantages of STATCOMS is their continuous
and dynamic voltage control, which allows them to continuously control reactive power levels.
Because of their design, they also have very fast response time. The maximum available reactive
power from a STATCOM is proportional to the voltage so, consequently, the available reactive
power decreases more slowly for STATCOMs than for SVCs when the system voltage decreases.

HVDC Transmission PSU-ECE POWER Engineers
99
Conclusion
It can be seen that many parameters affecting cost, efficiency, and reliability of a WPP must be
taken into consideration when the system is designed. Through careful analysis of each proposed
wind turbine project the optimal cost per megawatt can be obtained. As more of these
installations age we will be able to better analyze the long-term effects that a stochastic resource
such as wind has on the various system components. Until that time we will continue to modify
our design processes as new information and innovations become available.
DFIGs would be the optimal choice for the installation that is being considered. They offer
flexibility in reactive power support so they do not need to use the existing AC system for reactive
compensation. Since we are tied to a relatively “weak” AC system, in this case, this is of special
importance in our WTG selection. DFIGs are tied directly to the existing AC system and only
convert approximately 30% of their full power for the VSC on the rotor. This means that the
power electronics are small and less expensive than their full-conversion counterparts. This also
means that there will be less power losses than when compared to a full-conversion generator
scheme. DFIGs are the best compromise between technical specifications and cost.
Wind Power Plants References
[1] Sllotweg, J.G., and W.L. Kling. "Is the Answer Blowing in the Wind?." IEEE Power & Energy
Magazine, November 2003, pp.26-33.
[2] U.S, Department of Energy, . Wind Power in America's Future 20% Wind Energy by 2030.
Mineola, New York: Dover Publications, Inc., 2010.
[3] Jamieson, Peter. Innovation in Wind Turbine Design. Chicester: Wiley, 2011.
http://orbis.eblib.com.proxy.lib.pdx.edu/patron/FullRecord.aspx?p=697600 (accessed April 20,
2013)
[4] Brana, Isaac. "Adopt a Wind Turbine." Last modified August 13, 2010. Accessed May 18, 2013.
http://isaacbrana.wordpress.com/2010/07/13/adopt-a-wind-turbine/.
[5] Wikipedia, "Wind turbine design." Last modified May 12, 2013. Accessed May 18, 2013.
http://en.wikipedia.org/wiki/Wind_turbine_design.

HVDC Transmission PSU-ECE POWER Engineers
100
[6] WINDPOWER Program, "Wind turbine power output variation with steady wind speed."
Accessed May 18, 2013. http://www.wind-power-program.com/turbine_characteristics.htm.
[7] WindSim, "What is the difference between Pitch-regulated and Stall-regulated WECGs?." Last
modified 2013. Accessed May 26, 2013.
http://user.windsim.com/pdf.php?cat=18&id=85&artlang=en.
[8] Wikipedia, "Squirrel-cage rotor." Last modified May 08, 2013. Accessed May 18, 2013.
http://en.wikipedia.org/wiki/Squirrel-cage_rotor.
[9]Camm, E.H.; Behnke, M.R.; Bolado, O.; Bollen, M.; Bradt, M.; Brooks, C.; Dilling, W.; Edds, M.;
Hejdak, W. J.; Houseman, D.; Klein, S.; Li, F.; Li, J.; Maibach, P.; Nicolai, T.; Patino, J.; Pasupulati,
S.V.; Samaan, N.; Saylors, S.; Siebert, T.; Smith, T.; Starke, M.; Walling, R., "Characteristics of wind
turbine generators for wind power plants," Power & Energy Society General Meeting, 2009. PES '09.
IEEE , vol., no., pp.1,5, 26-30 July 2009
[10] Wikipedia, "Induction Generator." Last modified May 03, 2013. Accessed May 18, 2013.
http://en.wikipedia.org/wiki/Induction_generatorhttp://en.wikipedia.org/wiki/Induction_generat
or.
[11] Lab-Volt, "Principles of Doubly-Fed Induction Generators (DFIG)." Last modified 2011.
Accessed April 20, 2013. http://www.labvolt.com/downloads/download/86376_F0.pdf.
[12] Camm, E.H.; Behnke, M.R.; Bolado, O.; Bollen, M.; Bradt, M.; Brooks, C.; Dilling, W.; Edds,
M.; Hejdak, W. J.; Houseman, D.; Klein, S.; Li, F.; Li, J.; Maibach, P.; Nicolai, T.; Patino, J.;
Pasupulati, S.V.; Samaan, N.; Saylors, S.; Siebert, T.; Smith, T.; Starke, M.; Walling, R., "Wind
power plant collector system design considerations: IEEE PES wind plant collector system design
working group," Power & Energy Society General Meeting, 2009. PES '09. IEEE , vol., no., pp.1,7, 26-
30 July 2009
[13] FERC Order no. 661-A, "Interconnection for Wind Energy,” Docket
No. RM05-4-001, December 2005.
[14] Walling, Reigh A., and Michael L. Reichard. General Electric, "Short Circuit Behavior of Wind
Turbine Generators ." Accessed May 11, 2013. http://www.pes-psrc.org/c/C17/Short Circuit
Behavior of Wind Turbine Generators.pdf.

HVDC Transmission PSU-ECE POWER Engineers
101
[15] Narimani, M.; Varma, R.K., "Application of Static Var Compensator (SVC) with fuzzy
controller for grid integration of wind farm," Electrical and Computer Engineering (CCECE), 2010
23rd Canadian Conference on , vol., no., pp.1,6, 2-5 May 2010

HVDC Transmission PSU-ECE POWER Engineers
102
System Modeling
System Modeling Introduction
The purpose of this modeling section is to investigate the impact of a DC connection between the
south-central Wyoming region and load centers in Southern California and Las Vegas. This
interconnection is being researched because of a proposal for the construction of wind generation
in Wyoming and the need to send that power to load centers in Nevada and Southern California.
This section will explore the effects of building an HVDC link between the existing systems in
Wyoming and California using freely available power flow analysis software. For this purpose, the
PowerWorld simulator software will be used. The required system data and control system data
required to run a transient simulation is not freely available, and in many cases proprietary, which
makes a transient study outside the scope of this paper. Studies of many specific contingencies
become useless without access to a full-topology Western Electricity Coordinating Council
(WECC) base case. Therefore, the objective of this model will be to study the impact on existing
systems in providing reactive support to the DC transmission line.
Wind Turbine Modeling
As mentioned in the preceding Wind Generation section, a wind power plant is a collection of
many wind turbines, and that they are each feeding onto a collector system through step up
transformers at the base of each turbine. When high level modeling is considered, the modeling
of each individual generator and transformer provides no great advantage over an aggregate
model, and could potentially complicate any troubleshooting effort should an issue arise with the
model. For this reason a consolidated model is used where all the generators in the generation
site are modeled as a single generator, and all of the collection transformers at the base of the
turbines are modeled as a single transformer.
Within the bounds of using freely available power flow software, the free version of PowerWorld
simulator limits the user to 40 busses. The aggregate model of a wind plant requires 4 busses, one
for the generator, another for the step up transformer, a third for the collector cable, and a fourth
for the transmission to the point of interconnection (POI). Because the typical size of a single site
is 50-200MW, and we are looking to model the addition of 3100MW of wind generation into the

HVDC Transmission PSU-ECE POWER Engineers
103
Wyoming region the maximum allotted busses of the software would be exceeded by the wind
generation alone. It is for this reason that we will not model the entire collection system. The
wind generation will need to be modeled as several wind plants with their respective collection
transformers, but without the collection line or transmission line to the POI. An example of this
configuration can be seen in Figure 1. The model data for the wind generation and collector
transformers is from the Dodge Junction wind site outside of Walla Walla Washington. These
generator/transformer wind plant models will be connected directly to the converter station
because the proposed wind capacity would overload the lines of the existing system which defeats
a major design criterion to minimize effects on existing systems.
Figure 5.1 3100 MW of Wind Generation
Modeling Requirements
In modeling the DC interconnection between south-central Wyoming, on the northern end and
the Southern California/Las Vegas region, on the southern end, the two systems are
characteristically very different. The southern region is what is called a “stiff” grid, this region has
many 500kV lines which are heavily looped and many voltage control devices such as shunt

HVDC Transmission PSU-ECE POWER Engineers
104
capacitors/reactors and SVC’s. This means that the bus voltages in the region do not vary widely
due to power flow, generation profile, or small to medium changes in system topology.
The northern region operates in a very different manner than the southern region. This region
has no 500kV lines, and relatively few voltage control devices. This is why the northern region
can be termed a “weak” grid, because the bus voltages are prone to swings as a result to changes
in power flow or system topology. These swings are undesirable because they can result in
voltages which are outside of specifications, and can shift the system along the power voltage
(PV) curve towards a voltage stability limit. Additionally, there is a large baseline generation
facility, Jim Bridger, adjacent to our modeling region which acts as the source for the existing
power flow through our model. Jim Bridger and this existing flow are important to model in
order to study what effect additional flows will have on the northern system.
Modeling Methodology
Modeling the “stiffness” of the southern region is accomplished by utilizing the generator model
with a negative generation. This will act as a load and will be used to maintain bus voltage by
allowing the negative generators to have an almost unlimited reactive capability. To further
construct the behavior of the region, the 500kV and 230kV loops between the busses that
immediately connect to the southern HVDC converter system are modeled. The looped nature of
the southern system provides a “stiff” voltage characteristic by allowing multiple paths for power
flow. This will result in lower equivalent impedance and subsequently less voltage drop for a
given transmission of power. In maintaining a realistic voltage profile, the 1.0pu regulated busses
with the negative generators will be the 230kV busses in the model because in the load center
region, lower voltages denote proximity to actual load. For modeling purposes this can be
dangerous. The power flow analysis requires each region to behave as independent islands, both
with their own slack busses. If our only modeled generators are at the 230kV busses, then when
the island slack picked up any load that was not transferred through the HVDC connection its
power would flow through the lowest impedance paths (500kV lines). This would cause the
500kV busses to have a lower per unit voltage than the 230kV busses, which is not the physical
case (think of voltage drop across a line from source to load). For this reason a single negative
generator will regulate one 500kV at 1.1pu in order to maintain an appropriate voltage schedules

HVDC Transmission PSU-ECE POWER Engineers
105
at both the 500kV and 230kV levels. This will not be required for the VSC based system, as the
converter station will be able to regulate the 500kV system as seen below in Figure 2.
Figure 5.2 The VSC based model of the Southern region
The northern terminal of the HVDC link connects to a string of 230kV busses extending from Jim
Bridger to Miners substation in Wyoming as shown modeled below in Figure 3. This section of
the grid strings out eastward with only a few, mostly radial, lines branching off of it. The lines
that branch off of it will be replaced with loads equal to the power flows from the 2015 WECC
heavy summer planning case. This will establish a baseline flow across the existing 230kV system
and an excellent representation of the system for us to connect our HVDC line and wind
generation.

HVDC Transmission PSU-ECE POWER Engineers
106
Figure 5.3
HVDC Modeling
Two models will be built for both the LCC and VSC based converter technologies. We will use the
included PowerWorld LCC model to implement the LCC based line. The standard way to
implement a VSC connection in a steady state power flow simulation is to create a negative
generator on the sending terminal, and a positive generator on the receiving end. This will allow
the generated power in the northern region to be consumed by the negative generator at the
converter station and the corresponding power to be “generated” at the generator on the southern
terminal. The two generators will be given a large reactive capability in order to model the VSC’s
ability to regulate AC bus voltage.
Interaction Studies
The goal of studying these models is to quantify the way in which the HVDC link between the
northern and southern regions affects the existing system in the northern region. The effect on
the southern region is not studied because of the “stiff” characteristics of the region, and it has
been modeled in such a way to stay relatively consistent through the entire range of desired
HVDC power flows.
For the study of the LCC a near infinite reactive source modeled as a generator with zero power
capability and a large reactive capability is added to the northern converter bus to represent one
of the several compensation devices being considered (SVC, Statcom, or Synchronous
Condenser). Allowing this unit an infinite capacity to source and sink VARs will give us an “ideal”
value of local (to the converter station) VAR support which minimizes impact on the existing
system. From that value we can limit the compensation device until we reach the bounds of
allowable voltage on the converter bus; in this situation .92pu to 1.1pu was selected as the bounds
being outside the standard ±5% with the goal of approaching a voltage stability limit. This will

HVDC Transmission PSU-ECE POWER Engineers
107
give us an absolute minimum value for reactive compensation. The study was performed at DC
flows ranging from 100MW to 3100MW. Ideal and minimum reactive compensation was found
and is summarized in figure 4 which plots the ideal and minimum values against the range of
studied HVDC flows.
Figure 5.4 Minimum and ideal reactive compensation
The interaction study for the VSC-based system operates in much the same way, except that since
the VSC can source and sink VARs into the system, a compensation device will not be required on
the northern terminus. Flows will be simulated as a negative generation on the northern end, and
a positive generation of 94% of the sending power on the southern end to simulate a conservative
6% loss. Both generators will be given free range to provide or consume VARs. The VARs
provided or consumed will be recorded to be used toward specifying the VAR injection capability
for the VSC system being considered. This study was performed through a range of DC flow levels
from 100MW to 3100MW. The resulting VAR support on both the northern and southern
terminals is displayed below in figures 5 and 6. These plots show the reactive support provided by
the VSC converter at each DC flow level studied for each converter terminal.
-200
0
200
400
600
800
1000
1200
1400
1600
1800
0 1000 2000 3000 4000
MV
AR
DC Flow (MW)
Ideal and Minimum Support vs. DC Flow
Ideal Support
Minimum Support

HVDC Transmission PSU-ECE POWER Engineers
108
Figure 5.5 Reactive support provided by VSC at the northern converter
Figure 5.6 Reactive support provided by VSC at the southern converter
Fault Analysis
A final test is to check the fault characteristic of the model. Typically a DC system’s ability to
“ride through” a fault is tested through a transient analysis. Because the required dynamic data
for the transient behavior of an HVDC system is not freely available, we will conduct a steady
state fault analysis on a line in the northern region. The selected line to fault was the Latham-
-140
-120
-100
-80
-60
-40
-20
0
0 500 1000 1500 2000 2500 3000 3500
MV
AR
Su
pp
lie
d
MW (Sending)
Northern MW sent Vs. MVAR Supplied
-300
-250
-200
-150
-100
-50
0
0 500 1000 1500 2000 2500 3000 3500
MV
AR
S S
up
pli
ed
MW (Receiving)
Southern MW sent vs. MVAR Supplied

HVDC Transmission PSU-ECE POWER Engineers
109
Converter 230kV line as requested during a meeting with POWER Engineers. This test was
performed with 1400MW flowing across the LCC DC line, with the converter compensation device
limited to 200MVAR. It was found that a balanced 3 phase fault at 50% of the Latham-Converter
line drew a fault current of 3544.21A or 14.119pu. This is relative to a pre fault flow of 127.42A at the
Latham end of the line. While one end of the fault was fed by the existing AC system, the other
end was fed by wind generation, and any effects on the DC line are not reported the PowerWorld
fault analysis tool. For this reason, it is unfortunate that with the tools available, a more
comprehensive fault analysis of the DC system is not possible.
Conclusion
The modeling of this proposed HVDC link served two purposes: to demonstrate the difference
between LCC and VSC systems in regards to reactive compensation and to establish preliminary
specification values for reactive compensation in both the LCC and the VSC cases. For the LCC
the minimum and ideal compensation required was 626MVAR to 1612MVAR, and in the VSC
study, the northern terminal required up 124MVAR while the southern terminal required up to
265MVAR. At this point it should be noted that because the southern system was modeled only
for stiffness in voltage characteristic, that any reactive support values for this region do not reflect
the existence of other local voltage support schemes. In summary, the LCC system requires more
reactive support, but is a more established technology available at lower cost while the VSC
system actually acts to support the local AC system, but is a newer technology with a premium
price to prove it.