hydro one inc. management’s report · hydro one inc. management’s report 1 the consolidated...
TRANSCRIPT
HYDRO ONE INC. MANAGEMENT’S REPORT
1
The Consolidated Financial Statements, Management’s Discussion and Analysis (MD&A) and related financial information have been prepared by the management of Hydro One Inc. (Hydro One or the Company). Management is responsible for the integrity, consistency and reliability of all such information presented. The Consolidated Financial Statements have been prepared in accordance with United States Generally Accepted Accounting Principles and applicable securities legislation. The MD&A has been prepared in accordance with National Instrument 51-102. The preparation of the Consolidated Financial Statements and information in the MD&A involves the use of estimates and assumptions based on management’s judgment, particularly when transactions affecting the current accounting period cannot be finalized with certainty until future periods. Estimates and assumptions are based on historical experience, current conditions and various other assumptions believed to be reasonable in the circumstances, with critical analysis of the significant accounting policies followed by the Company as described in Note 2 to the Consolidated Financial Statements. The preparation of the Consolidated Financial Statements and the MD&A includes information regarding the estimated impact of future events and transactions. The MD&A also includes information regarding sources of liquidity and capital resources, operating trends, risks and uncertainties. Actual results in the future may differ materially from the present assessment of this information because future events and circumstances may not occur as expected. The Consolidated Financial Statements and MD&A have been properly prepared within reasonable limits of materiality and in light of information up to February 11, 2015. Management is responsible for establishing and maintaining adequate internal control over financial reporting for the Company. In meeting its responsibility for the reliability of financial information, management maintains and relies on a comprehensive system of internal control and internal audit. The system of internal control includes a written corporate conduct policy; implementation of a risk management framework; effective segregation of duties and delegation of authorities; and sound and conservative accounting policies that are regularly reviewed. This structure is designed to provide reasonable assurance that assets are safeguarded and that reliable information is available on a timely basis. In addition, management has assessed the design and operating effectiveness of the Company’s internal control over financial reporting in accordance with the criteria set forth in Internal Control – Integrated Framework (2013), issued by the Committee of Sponsoring Organizations of the Treadway Commission. Based on this assessment, management concluded that the Company maintained effective internal control over financial reporting as of December 31, 2014. The effectiveness of these internal controls is reported to the Audit, Finance and Pension Investment Committee of the Hydro One Board of Directors, as required. The Consolidated Financial Statements have been audited by KPMG LLP, independent external auditors appointed by the Shareholder. The external auditors’ responsibility is to express their opinion on whether the Consolidated Financial Statements are fairly presented in accordance with United States Generally Accepted Accounting Principles. The Independent Auditors’ Report outlines the scope of their examination and their opinion. The Hydro One Board of Directors, through its Audit, Finance and Pension Investment Committee, is responsible for ensuring that management fulfills its responsibilities for financial reporting and internal controls. The Audit, Finance and Pension Investment Committee of Hydro One met periodically with management, the internal auditors and the external auditors to satisfy itself that each group had properly discharged its respective responsibility and to review the Consolidated Financial Statements before recommending approval by the Board of Directors. The external auditors had direct and full access to the Audit, Finance and Pension Investment Committee, with and without the presence of management, to discuss their audit findings, if any. The President and Chief Executive Officer and the Chief Financial Officer (Acting) have certified Hydro One’s annual Consolidated Financial Statements and annual MD&A, related disclosure controls and procedures and the design and effectiveness of related internal controls over financial reporting. On behalf of Hydro One Inc.’s management:
Carmine Marcello Ali R. Suleman President and Chief Executive Officer Chief Financial Officer (Acting)
HYDRO ONE INC. INDEPENDENT AUDITORS’ REPORT
2
To the Shareholder of Hydro One Inc. We have audited the accompanying Consolidated Financial Statements of Hydro One Inc., which comprise the consolidated balance sheets as at December 31, 2014 and December 31, 2013, the consolidated statements of operations and comprehensive income, changes in equity and cash flows for the years then ended, and notes, comprising a summary of significant accounting policies and other explanatory information. Management’s Responsibility for the Consolidated Financial Statements Management is responsible for the preparation and fair presentation of these Consolidated Financial Statements in accordance with United States Generally Accepted Accounting Principles, and for such internal control as management determines is necessary to enable the preparation of Consolidated Financial Statements that are free from material misstatement, whether due to fraud or error. Auditors’ Responsibility Our responsibility is to express an opinion on these Consolidated Financial Statements based on our audits. We conducted our audits in accordance with Canadian generally accepted auditing standards. Those standards require that we comply with ethical requirements and plan and perform the audit to obtain reasonable assurance about whether the Consolidated Financial Statements are free from material misstatement. An audit involves performing procedures to obtain audit evidence about the amounts and disclosures in the Consolidated Financial Statements. The procedures selected depend on our judgment, including the assessment of the risks of material misstatement of the Consolidated Financial Statements, whether due to fraud or error. In making those risk assessments, we consider internal control relevant to the entity’s preparation and fair presentation of the Consolidated Financial Statements in order to design audit procedures that are appropriate in the circumstances, but not for the purpose of expressing an opinion on the effectiveness of the entity’s internal control. An audit also includes evaluating the appropriateness of accounting policies used and the reasonableness of accounting estimates made by management, as well as evaluating the overall presentation of the Consolidated Financial Statements. We believe that the audit evidence we have obtained in our audits is sufficient and appropriate to provide a basis for our audit opinion. Opinion In our opinion, the Consolidated Financial Statements present fairly, in all material respects, the consolidated financial position of Hydro One Inc. as at December 31, 2014 and December 31, 2013, and its consolidated results of operations and its consolidated cash flows for the years then ended in accordance with United States Generally Accepted Accounting Principles. Chartered Professional Accountants, Licensed Public Accountants Toronto, Canada February 11, 2015
HYDRO ONE INC. CONSOLIDATED STATEMENTS OF OPERATIONS AND COMPREHENSIVE INCOME For the years ended December 31, 2014 and 2013
3
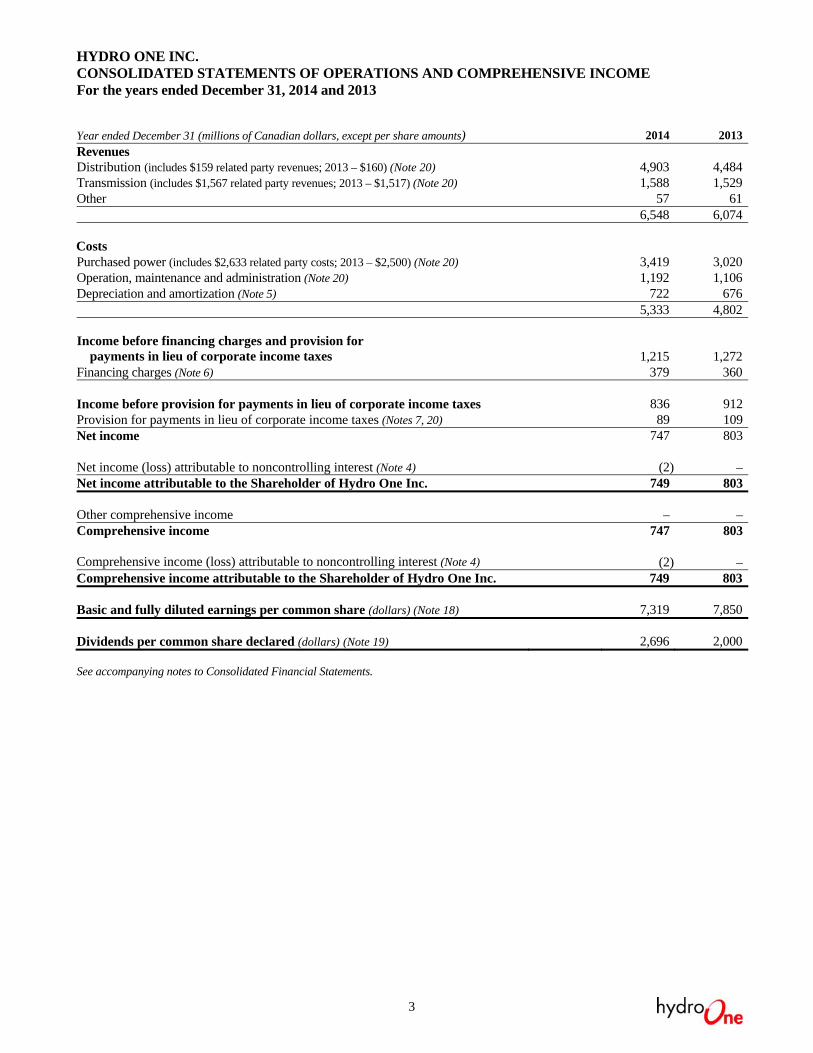
Year ended December 31 (millions of Canadian dollars, except per share amounts) 2014 2013
Revenues Distribution (includes $159 related party revenues; 2013 – $160) (Note 20) 4,903 4,484Transmission (includes $1,567 related party revenues; 2013 – $1,517) (Note 20) 1,588 1,529Other 57 61 6,548 6,074 Costs Purchased power (includes $2,633 related party costs; 2013 – $2,500) (Note 20) 3,419 3,020Operation, maintenance and administration (Note 20) 1,192 1,106Depreciation and amortization (Note 5) 722 676
5,333 4,802
Income before financing charges and provision for payments in lieu of corporate income taxes 1,215 1,272
Financing charges (Note 6) 379 360
Income before provision for payments in lieu of corporate income taxes 836 912Provision for payments in lieu of corporate income taxes (Notes 7, 20) 89 109Net income 747 803 Net income (loss) attributable to noncontrolling interest (Note 4) (2) –Net income attributable to the Shareholder of Hydro One Inc. 749 803 Other comprehensive income – –Comprehensive income 747 803 Comprehensive income (loss) attributable to noncontrolling interest (Note 4) (2) –Comprehensive income attributable to the Shareholder of Hydro One Inc. 749 803 Basic and fully diluted earnings per common share (dollars) (Note 18) 7,319 7,850 Dividends per common share declared (dollars) (Note 19) 2,696 2,000 See accompanying notes to Consolidated Financial Statements.
HYDRO ONE INC. CONSOLIDATED BALANCE SHEETS At December 31, 2014 and 2013
4
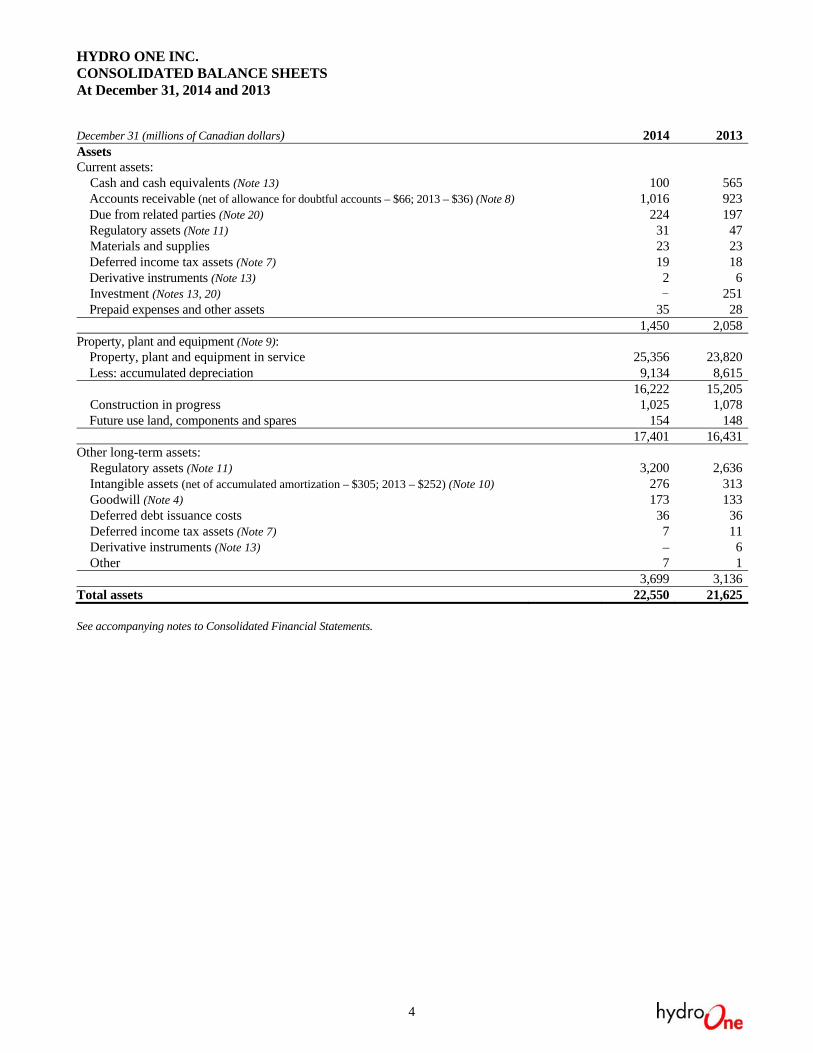
December 31 (millions of Canadian dollars) 2014 2013Assets Current assets: Cash and cash equivalents (Note 13) 100 565 Accounts receivable (net of allowance for doubtful accounts – $66; 2013 – $36) (Note 8) 1,016 923 Due from related parties (Note 20) 224 197 Regulatory assets (Note 11) 31 47 Materials and supplies 23 23 Deferred income tax assets (Note 7) 19 18 Derivative instruments (Note 13) 2 6 Investment (Notes 13, 20) – 251 Prepaid expenses and other assets 35 28 1,450 2,058Property, plant and equipment (Note 9): Property, plant and equipment in service 25,356 23,820 Less: accumulated depreciation 9,134 8,615
16,222 15,205 Construction in progress 1,025 1,078 Future use land, components and spares 154 148 17,401 16,431Other long-term assets: Regulatory assets (Note 11) 3,200 2,636 Intangible assets (net of accumulated amortization – $305; 2013 – $252) (Note 10) 276 313 Goodwill (Note 4) 173 133 Deferred debt issuance costs 36 36 Deferred income tax assets (Note 7) 7 11 Derivative instruments (Note 13) – 6 Other 7 1 3,699 3,136Total assets 22,550 21,625 See accompanying notes to Consolidated Financial Statements.
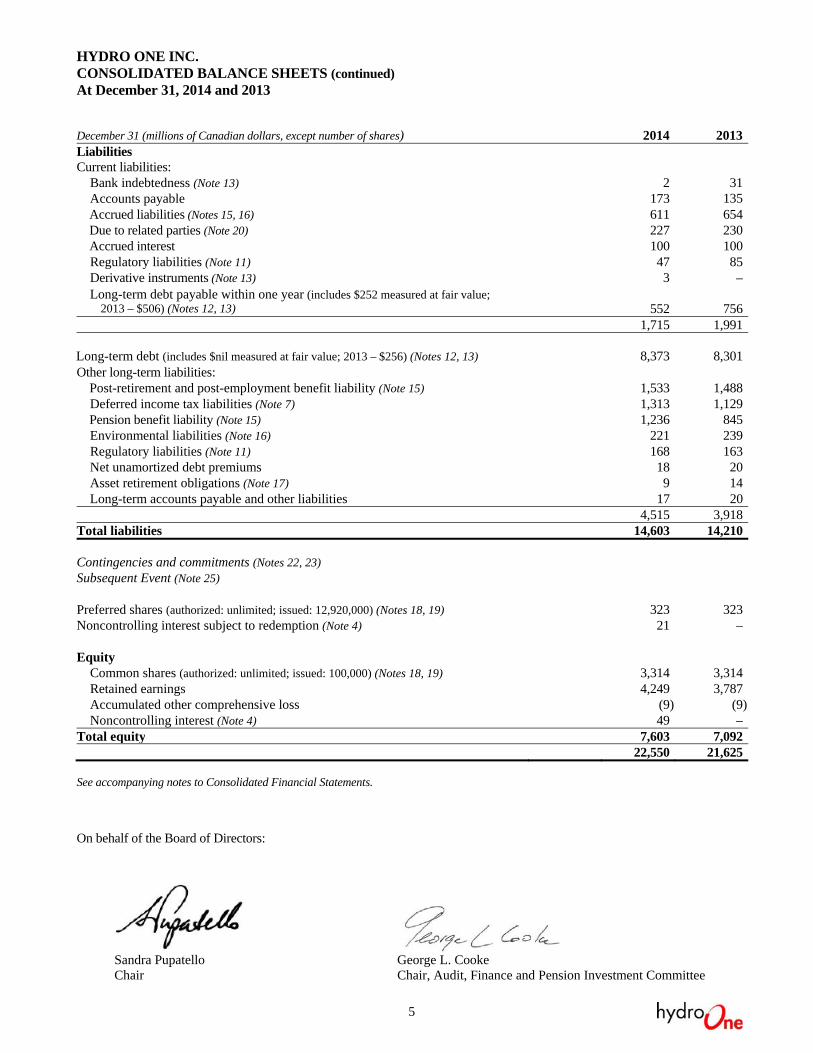
HYDRO ONE INC. CONSOLIDATED BALANCE SHEETS (continued) At December 31, 2014 and 2013
5
December 31 (millions of Canadian dollars, except number of shares) 2014 2013Liabilities Current liabilities: Bank indebtedness (Note 13) 2 31 Accounts payable 173 135 Accrued liabilities (Notes 15, 16) 611 654 Due to related parties (Note 20) 227 230 Accrued interest 100 100 Regulatory liabilities (Note 11) 47 85 Derivative instruments (Note 13) 3 – Long-term debt payable within one year (includes $252 measured at fair value; 2013 – $506) (Notes 12, 13)
552 756 1,715 1,991 Long-term debt (includes $nil measured at fair value; 2013 – $256) (Notes 12, 13) 8,373 8,301Other long-term liabilities: Post-retirement and post-employment benefit liability (Note 15) 1,533 1,488 Deferred income tax liabilities (Note 7) 1,313 1,129 Pension benefit liability (Note 15) 1,236 845 Environmental liabilities (Note 16) 221 239 Regulatory liabilities (Note 11) 168 163 Net unamortized debt premiums 18 20 Asset retirement obligations (Note 17) 9 14 Long-term accounts payable and other liabilities 17 20 4,515 3,918Total liabilities 14,603 14,210 Contingencies and commitments (Notes 22, 23) Subsequent Event (Note 25) Preferred shares (authorized: unlimited; issued: 12,920,000) (Notes 18, 19) 323 323Noncontrolling interest subject to redemption (Note 4) 21 – Equity Common shares (authorized: unlimited; issued: 100,000) (Notes 18, 19) 3,314 3,314 Retained earnings 4,249 3,787 Accumulated other comprehensive loss (9) (9) Noncontrolling interest (Note 4) 49 –Total equity 7,603 7,092 22,550 21,625 See accompanying notes to Consolidated Financial Statements. On behalf of the Board of Directors:
Sandra Pupatello George L. Cooke Chair Chair, Audit, Finance and Pension Investment Committee

HYDRO ONE INC. CONSOLIDATED STATEMENTS OF CHANGES IN EQUITY
For the years ended December 31, 2014 and 2013
6
Year ended December 31, 2014 (millions of Canadian dollars)
Common Shares
Retained Earnings
Accumulated Other
Comprehensive Loss
Noncontrolling Interest
Total Equity
January 1, 2014 3,314 3,787 (9) – 7,092Net income – 749 – (1) 748Other comprehensive income – – – – –Amount contributed by noncontrolling interest – – –
50 50
Dividends on preferred shares – (18) – – (18)Dividends on common shares – (269) – – (269)December 31, 2014 3,314 4,249 (9) (49) 7,603 Year ended December 31, 2013 (millions of Canadian dollars)
Common Shares
Retained Earnings
Accumulated Other
Comprehensive Loss
Noncontrolling Interest
Total Equity
January 1, 2013 3,314 3,202 (9) – 6,507Net income – 803 – – 803Other comprehensive income – – – – –Dividends on preferred shares – (18) – – (18)Dividends on common shares – (200) – – (200)December 31, 2013 3,314 3,787 (9) – 7,092 See accompanying notes to Consolidated Financial Statements.

HYDRO ONE INC. CONSOLIDATED STATEMENTS OF CASH FLOWS
For the years ended December 31, 2014 and 2013
7
Year ended December 31 (millions of Canadian dollars) 2014 2013Operating activities Net income 747 803Environmental expenditures (18) (16)Adjustments for non-cash items:
Depreciation and amortization (excluding removal costs) 641 597Regulatory assets and liabilities (69) 3Deferred income taxes 10 (2)Other – 8
Changes in non-cash balances related to operations (Note 21) (55) 11Net cash from operating activities 1,256 1,404 Financing activities Long-term debt issued 628 1,185Long-term debt retired (776) (600)Amount contributed by noncontrolling interest (Note 4) 72 –Dividends paid (287) (218)Change in bank indebtedness (29) (11)Other (3) (5)Net cash from (used in) financing activities (395) 351 Investing activities Capital expenditures (Note 21)
Property, plant and equipment (1,481) (1,308)Intangible assets (23) (79)
Acquisition of Norfolk Power Inc. (Note 4) (66) –Proceeds from investment 250 –Other (6) 2Net cash used in investing activities (1,326) (1,385) Net change in cash and cash equivalents (465) 370Cash and cash equivalents, beginning of year 565 195Cash and cash equivalents, end of year 100 565 See accompanying notes to Consolidated Financial Statements.
HYDRO ONE INC. NOTES TO CONSOLIDATED FINANCIAL STATEMENTS For the years ended December 31, 2014 and 2013
8
1. DESCRIPTION OF THE BUSINESS Hydro One Inc. (Hydro One or the Company) was incorporated on December 1, 1998, under the Business Corporations Act (Ontario) and is wholly owned by the Province of Ontario (Province). The principal businesses of Hydro One are the transmission and distribution of electricity to customers within Ontario. The electricity rates of these businesses are regulated by the Ontario Energy Board (OEB). 2. SIGNIFICANT ACCOUNTING POLICIES Basis of Consolidation These Consolidated Financial Statements include the accounts of the Company and its wholly owned subsidiaries: Hydro One Networks Inc. (Hydro One Networks), Hydro One Remote Communities Inc. (Hydro One Remote Communities), Hydro One Brampton Networks Inc. (Hydro One Brampton Networks), Hydro One Telecom Inc. (Hydro One Telecom), Hydro One Lake Erie Link Management Inc., Hydro One Lake Erie Link Company Inc., Norfolk Power Inc. (Norfolk Power), and Hydro One B2M Holdings. Intercompany transactions and balances have been eliminated. Basis of Accounting These Consolidated Financial Statements are prepared and presented in accordance with United States (US) Generally Accepted Accounting Principles (GAAP) and in Canadian dollars. Hydro One performed an evaluation of subsequent events through to February 11, 2015, the date these Consolidated Financial Statements were issued, to determine whether any events or transactions warranted recognition and disclosure in these Consolidated Financial Statements. See Note 25 – Subsequent Event. Use of Management Estimates The preparation of financial statements requires management to make estimates and assumptions that affect the reported amounts of assets and liabilities at the date of the financial statements and the reported amounts of revenues, expenses, gains and losses during the reporting periods. Management evaluates these estimates on an ongoing basis based upon historical experience, current conditions, and assumptions believed to be reasonable at the time the assumptions are made, with any adjustments being recognized in results of operations in the period they arise. Significant estimates relate to regulatory assets and regulatory liabilities, environmental liabilities, pension benefits, post-retirement and post-employment benefits, asset retirement obligations (AROs), goodwill and asset impairments, contingencies, unbilled revenues, allowance for doubtful accounts, derivative instruments, and deferred income tax assets and liabilities. Actual results may differ significantly from these estimates, which may be impacted by future decisions made by the OEB or the Province. Rate Setting The Company’s Transmission Business includes the separately regulated transmission businesses of Hydro One Networks and B2M Limited Partnership (B2M LP). The Company’s consolidated Distribution Business includes the separately regulated distribution businesses of Hydro One Networks and the newly acquired Norfolk Power, as well as the subsidiaries Hydro One Brampton Networks and Hydro One Remote Communities. The OEB has approved the use of US GAAP for rate setting and regulatory accounting and reporting by Hydro One Networks’ transmission and distribution businesses, as well as by Hydro One Remote Communities, beginning with the year 2012. Up to the year ended December 31, 2014, Hydro One Brampton Networks used Canadian GAAP (Part V) for its distribution rate-setting purposes, and has transitioned to International Financial Reporting Standards beginning on January 1, 2015.
HYDRO ONE INC. NOTES TO CONSOLIDATED FINANCIAL STATEMENTS (continued) For the years ended December 31, 2014 and 2013
9
Transmission In May 2012, Hydro One Networks filed a cost-of-service application with the OEB for 2013 and 2014 transmission rates. In December 2012, the OEB approved the 2013 and 2014 revenue requirement of $1,438 million and $1,528 million, respectively. In December 2013, Hydro One Networks filed a draft Rate Order with the OEB for 2014 transmission rates. The 2014 transmission revenue requirement was increased to $1,535 million from the originally-approved revenue requirement of $1,528 million, primarily due to changes in the cost of capital parameters for 2014 released by the OEB in November 2013. On January 9, 2014, the OEB approved the draft Rate Order for 2014 transmission rates as filed. Distribution In June 2012, Hydro One Networks filed an Incentive Regulation Mechanism (IRM) application with the OEB for 2013 distribution rates, to be effective January 1, 2013. In December 2012, the OEB issued its final Decision, which resulted in an increase in distribution rates of approximately 1.3% in 2013, or 0.4% when considering total bill impact, for a typical residential customer consuming 800 kWh per month. In April 2013, Hydro One Networks filed an IRM application with the OEB for 2014 distribution rates, to be effective January 1, 2014. In December 2013, the OEB issued its final Decision, which resulted in an increase in distribution rates of approximately 2.4% in 2014, or 0.85% when considering total bill impact, for a typical residential customer consuming 800 kWh per month. In August 2012, Hydro One Brampton Networks filed an IRM application with the OEB for 2013 distribution rates, to be effective January 1, 2013. In December 2012, the OEB issued its final Decision, which resulted in an increase in distribution rates of approximately 0.3% in 2013, or less than 0.1% when considering total bill impact, for a typical residential customer consuming 800 kWh per month. In August 2013, Hydro One Brampton Networks filed an IRM application with the OEB for 2014 distribution rates, to be effective January 1, 2014. In December 2013, the OEB issued its final Decision, which resulted in a reduction in distribution rates of approximately 2.3% in 2014, or 0.5% when considering total bill impact, for a typical residential customer consuming 800 kWh per month. In September 2012, Hydro One Remote Communities filed a cost-of-service application with the OEB for 2013 rates, seeking approval for a 2013 revenue requirement of $53 million. In June 2013, the OEB approved a revenue requirement of $51 million for 2013. In October 2013, Hydro One Remote Communities filed an IRM application with the OEB for 2014 rates, seeking approval for a rate increase of approximately 0.5%. In March 2014, the OEB approved an increase of approximately 1.7% to basic rates for the distribution and generation of electricity, with an effective date of May 1, 2014. The final rate increase was adjusted by the OEB’s updated rate adjustment parameters and Hydro One Remote Communities’ IRM stretch factor. Regulatory Accounting The OEB has the general power to include or exclude revenues, costs, gains or losses in the rates of a specific period, resulting in a change in the timing of accounting recognition from that which would have been applied in an unregulated company. Such change in timing involves the application of rate-regulated accounting, giving rise to the recognition of regulatory assets and liabilities. The Company’s regulatory assets represent certain amounts receivable from future customers and costs that have been deferred for accounting purposes because it is probable that they will be recovered in future rates. In addition, the Company has recorded regulatory liabilities that generally represent amounts that are refundable to future customers. The Company continually assesses the likelihood of recovery of each of its regulatory assets and continues to believe that it is probable that the OEB will factor its regulatory assets and liabilities into the setting of future rates. If, at some future date, the Company judges that it is no longer probable that the OEB will include a regulatory asset or liability in setting future rates, the appropriate carrying amount will be reflected in results of operations in the period that the assessment is made. Cash and Cash Equivalents Cash and cash equivalents include cash and short-term investments with an original maturity of three months or less.
HYDRO ONE INC. NOTES TO CONSOLIDATED FINANCIAL STATEMENTS (continued) For the years ended December 31, 2014 and 2013
10
Revenue Recognition Transmission revenues are collected through OEB-approved rates, which are based on an approved revenue requirement that includes a rate of return. Such revenue is recognized as electricity is transmitted and delivered to customers. Distribution revenues are recognized on an accrual basis and include billed and unbilled revenues. Distribution revenues attributable to the delivery of electricity are based on OEB-approved distribution rates and are recognized as electricity is delivered to customers. The Company estimates monthly revenue for a period based on wholesale electricity purchases because customer meters are not generally read at the end of each month. At the end of each month, the electricity delivered to customers, but not billed, is estimated and revenue is recognized. The unbilled revenue estimate is affected by energy demand, weather, line losses and changes in the composition of customer classes. Distribution revenue also includes an amount relating to rate protection for rural, residential and remote customers, which is received from the Independent Electricity System Operator (IESO) based on a standardized customer rate that is approved by the OEB. Current legislation provides rate protection for prescribed classes of rural, residential and remote consumers by reducing the electricity rates that would otherwise apply. Revenues also include amounts related to sales of other services and equipment. Such revenue is recognized as services are rendered or as equipment is delivered. Revenues are recorded net of indirect taxes. Accounts Receivable and Allowance for Doubtful Accounts Billed accounts receivable are recorded at the invoiced amount, net of allowance for doubtful accounts. Unbilled accounts receivable are estimated and recorded based on wholesale electricity purchases. Overdue amounts related to regulated billings bear interest at OEB-approved rates. The allowance for doubtful accounts reflects the Company’s best estimate of losses on billed accounts receivable balances. The allowance is based on accounts receivable aging, historical experience and other currently available information. The Company estimates the allowance for doubtful accounts on customer receivables by applying internally developed loss rates to the outstanding receivable balances by risk segment. Risk segments represent groups of customers with similar credit quality indicators and are computed based on various attributes, including number of days receivables are past due, delinquency of balances and payment history. Loss rates applied to the accounts receivable balances are based on historical average write-offs as a percentage of accounts receivable in each risk segment. An account is considered delinquent if the final amount billed is not received within 110 days of the invoiced date. Accounts receivable are written off against the allowance when they are deemed uncollectible. The existing allowance for uncollectible accounts will continue to be affected by changes in volume, prices and economic conditions. Noncontrolling interest Noncontrolling interest represents the portion of equity ownership in subsidiaries that is not attributable to the Shareholder of the parent company. Noncontrolling interest is initially recorded at fair value and subsequently the amount is adjusted for the proportionate share of net income (loss) and other comprehensive income (loss) attributable to the noncontrolling interest and any dividends or distributions paid to the noncontrolling interest. If a transaction results in the acquisition of all, or part, of a noncontrolling interest in a subsidiary, the acquisition of the noncontrolling interest is accounted for as an equity transaction. No gain or loss is recognized in consolidated net income or comprehensive income as a result of changes in the noncontrolling interest, unless a change results in the loss of control by the Company. Corporate Income Taxes Under the Electricity Act, 1998, Hydro One is required to make payments in lieu of corporate income taxes (PILs) to the Ontario Electricity Financial Corporation (OEFC). These payments are calculated in accordance with the rules for computing income and other relevant amounts contained in the Income Tax Act (Canada) and the Taxation Act, 2007 (Ontario) as modified by the Electricity Act, 1998 and related regulations.
HYDRO ONE INC. NOTES TO CONSOLIDATED FINANCIAL STATEMENTS (continued) For the years ended December 31, 2014 and 2013
11
Current and deferred income taxes are computed based on the tax rates and tax laws enacted at the balance sheet date. Tax benefits associated with income tax positions taken, or expected to be taken, in a tax return are recorded only when the “more-likely-than-not” recognition threshold is satisfied and are measured at the largest amount of benefit that has a greater than 50% likelihood of being realized upon settlement. Management evaluates each position based solely on the technical merits and facts and circumstances of the position, assuming the position will be examined by a taxing authority having full knowledge of all relevant information. Significant management judgment is required to determine recognition thresholds and the related amount of tax benefits to be recognized in the Consolidated Financial Statements. Management re-evaluates tax positions each period in which new information about recognition or measurement becomes available. Current Income Taxes The provision for current taxes and the assets and liabilities recognized for the current and prior periods are measured at the amounts receivable from, or payable to, the OEFC. Deferred Income Taxes Deferred income taxes are provided for using the liability method. Deferred income taxes are recognized based on the estimated future tax consequences attributable to temporary differences between the carrying amount of assets and liabilities in the Consolidated Financial Statements and their corresponding tax bases. Deferred income tax liabilities are generally recognized on all taxable temporary differences. Deferred tax assets are recognized to the extent that it is more-likely-than-not that these assets will be realized from taxable income available against which deductible temporary differences can be utilized. Deferred income taxes are calculated at the tax rates that are expected to apply in the period when the liability is settled or the asset is realized, based on the tax rates and tax laws that have been enacted at the balance sheet date. Deferred income taxes that are not included in the rate-setting process are charged or credited to the Consolidated Statements of Operations and Comprehensive Income. If management determines that it is more-likely-than-not that some or all of a deferred income tax asset will not be realized, a valuation allowance is recorded against the deferred income tax asset to report the net balance at the amount expected to be realized. Previously unrecognized deferred income tax assets are reassessed at each balance sheet date and are recognized to the extent that it has become more-likely-than-not that the tax benefit will be realized. The Company records regulatory assets and liabilities associated with deferred income taxes that will be included in the rate-setting process. The Company uses the flow-through method to account for investment tax credits (ITCs) earned on eligible scientific research and experimental development expenditures, and apprenticeship job creation. Under this method, only non-refundable ITCs are recognized as a reduction to income tax expense. Materials and Supplies Materials and supplies represent consumables, small spare parts and construction materials held for internal construction and maintenance of property, plant and equipment. These assets are carried at average cost less any impairments recorded. Property, Plant and Equipment Property, plant and equipment is recorded at original cost, net of customer contributions received in aid of construction and any accumulated impairment losses. The cost of additions, including betterments and replacement asset components, is included on the Consolidated Balance Sheets as property, plant and equipment. The original cost of property, plant and equipment includes direct materials, direct labour (including employee benefits), contracted services, attributable capitalized financing costs, asset retirement costs, and direct and indirect overheads that are related to the capital project or program. Indirect overheads include a portion of corporate costs such as finance, treasury,

HYDRO ONE INC. NOTES TO CONSOLIDATED FINANCIAL STATEMENTS (continued) For the years ended December 31, 2014 and 2013
12
human resources, information technology and executive costs. Overhead costs, including corporate functions and field services costs, are capitalized on a fully allocated basis, consistent with an OEB-approved methodology. Property, plant and equipment in service consists of transmission, distribution, communication, administration and service assets and land easements. Property, plant and equipment also includes future use assets, such as land, major components and spare parts, and capitalized project development costs associated with deferred capital projects. Transmission Transmission assets include assets used for the transmission of high-voltage electricity, such as transmission lines, support structures, foundations, insulators, connecting hardware and grounding systems, and assets used to step up the voltage of electricity from generating stations for transmission and to step down voltages for distribution, including transformers, circuit breakers and switches. Distribution Distribution assets include assets related to the distribution of low-voltage electricity, including lines, poles, switches, transformers, protective devices and metering systems. Communication Communication assets include the fibre optic and microwave radio system, optical ground wire, towers, telephone equipment and associated buildings. Administration and Service Administration and service assets include administrative buildings, personal computers, transport and work equipment, tools and other minor assets. Easements Easements include statutory rights of use for transmission corridors and abutting lands granted under the Reliable Energy and Consumer Protection Act, 2002, as well as other land access rights. Intangible Assets Intangible assets separately acquired or internally developed are measured on initial recognition at cost, which comprises purchased software, direct labour (including employee benefits), consulting, engineering, overheads and attributable capitalized financing charges. Following initial recognition, intangible assets are carried at cost, net of any accumulated amortization and accumulated impairment losses. The Company’s intangible assets primarily represent major company-wide computer applications. Capitalized Financing Costs Capitalized financing costs represent interest costs attributable to the construction of property, plant and equipment or development of intangible assets. The financing cost of attributable borrowed funds is capitalized as part of the acquisition cost of such assets. The capitalized portion of financing costs is a reduction to financing charges recognized in the Consolidated Statements of Operations and Comprehensive Income. Capitalized financing costs are calculated using the Company’s weighted average effective cost of debt. Construction and Development in Progress Construction and development in progress consists of the capitalized cost of constructed assets that are not yet complete and which have not yet been placed in service.
HYDRO ONE INC. NOTES TO CONSOLIDATED FINANCIAL STATEMENTS (continued) For the years ended December 31, 2014 and 2013
13
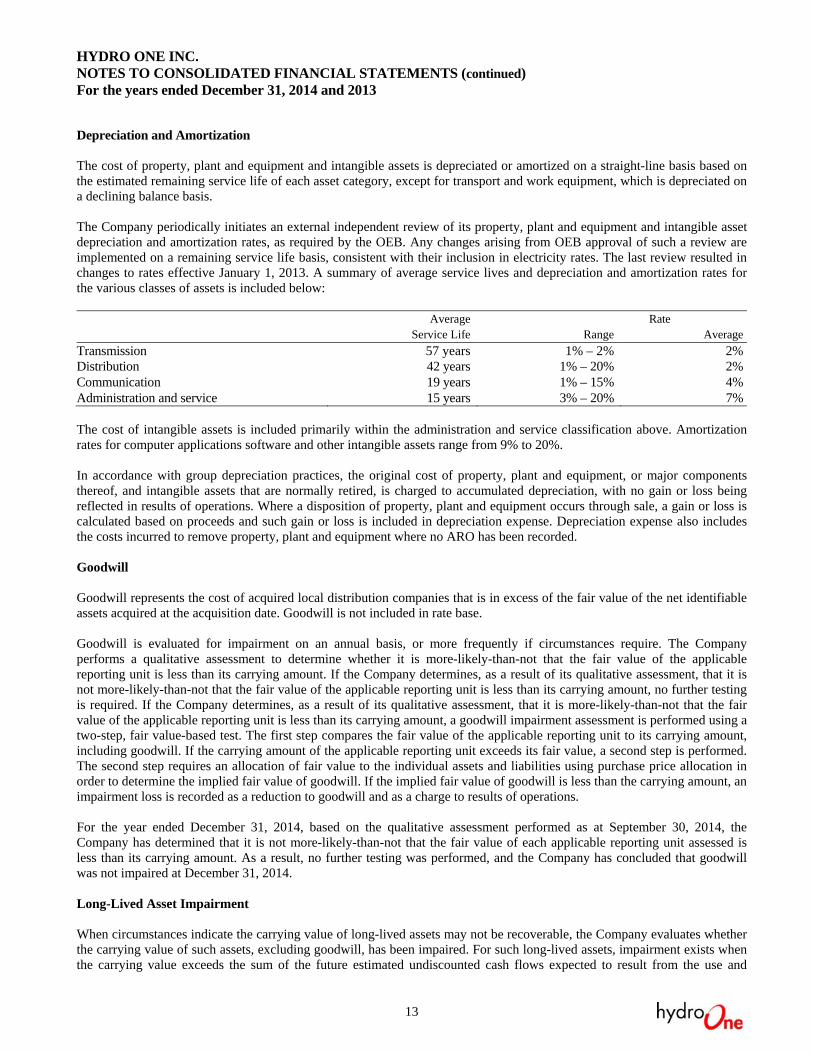
Depreciation and Amortization The cost of property, plant and equipment and intangible assets is depreciated or amortized on a straight-line basis based on the estimated remaining service life of each asset category, except for transport and work equipment, which is depreciated on a declining balance basis. The Company periodically initiates an external independent review of its property, plant and equipment and intangible asset depreciation and amortization rates, as required by the OEB. Any changes arising from OEB approval of such a review are implemented on a remaining service life basis, consistent with their inclusion in electricity rates. The last review resulted in changes to rates effective January 1, 2013. A summary of average service lives and depreciation and amortization rates for the various classes of assets is included below:
Average Rate Service Life Range Average
Transmission 57 years 1% – 2% 2%Distribution 42 years 1% – 20% 2%Communication 19 years 1% – 15% 4%Administration and service 15 years 3% – 20% 7% The cost of intangible assets is included primarily within the administration and service classification above. Amortization rates for computer applications software and other intangible assets range from 9% to 20%. In accordance with group depreciation practices, the original cost of property, plant and equipment, or major components thereof, and intangible assets that are normally retired, is charged to accumulated depreciation, with no gain or loss being reflected in results of operations. Where a disposition of property, plant and equipment occurs through sale, a gain or loss is calculated based on proceeds and such gain or loss is included in depreciation expense. Depreciation expense also includes the costs incurred to remove property, plant and equipment where no ARO has been recorded. Goodwill Goodwill represents the cost of acquired local distribution companies that is in excess of the fair value of the net identifiable assets acquired at the acquisition date. Goodwill is not included in rate base. Goodwill is evaluated for impairment on an annual basis, or more frequently if circumstances require. The Company performs a qualitative assessment to determine whether it is more-likely-than-not that the fair value of the applicable reporting unit is less than its carrying amount. If the Company determines, as a result of its qualitative assessment, that it is not more-likely-than-not that the fair value of the applicable reporting unit is less than its carrying amount, no further testing is required. If the Company determines, as a result of its qualitative assessment, that it is more-likely-than-not that the fair value of the applicable reporting unit is less than its carrying amount, a goodwill impairment assessment is performed using a two-step, fair value-based test. The first step compares the fair value of the applicable reporting unit to its carrying amount, including goodwill. If the carrying amount of the applicable reporting unit exceeds its fair value, a second step is performed. The second step requires an allocation of fair value to the individual assets and liabilities using purchase price allocation in order to determine the implied fair value of goodwill. If the implied fair value of goodwill is less than the carrying amount, an impairment loss is recorded as a reduction to goodwill and as a charge to results of operations. For the year ended December 31, 2014, based on the qualitative assessment performed as at September 30, 2014, the Company has determined that it is not more-likely-than-not that the fair value of each applicable reporting unit assessed is less than its carrying amount. As a result, no further testing was performed, and the Company has concluded that goodwill was not impaired at December 31, 2014. Long-Lived Asset Impairment When circumstances indicate the carrying value of long-lived assets may not be recoverable, the Company evaluates whether the carrying value of such assets, excluding goodwill, has been impaired. For such long-lived assets, impairment exists when the carrying value exceeds the sum of the future estimated undiscounted cash flows expected to result from the use and
HYDRO ONE INC. NOTES TO CONSOLIDATED FINANCIAL STATEMENTS (continued) For the years ended December 31, 2014 and 2013
14
eventual disposition of the asset. When alternative courses of action to recover the carrying amount of a long-lived asset are under consideration, a probability-weighted approach is used to develop estimates of future undiscounted cash flows. If the carrying value of the long-lived asset is not recoverable based on the estimated future undiscounted cash flows, an impairment loss is recorded, measured as the excess of the carrying value of the asset over its fair value. As a result, the asset’s carrying value is adjusted to its estimated fair value. Within its regulated business, the carrying costs of most of Hydro One’s long-lived assets are included in rate base where they earn an OEB-approved rate of return. Asset carrying values and the related return are recovered through approved rates. As a result, such assets are only tested for impairment in the event that the OEB disallows recovery, in whole or in part, or if such a disallowance is judged to be probable. Hydro One regularly monitors the assets of its unregulated Hydro One Telecom subsidiary for indications of impairment. Management assesses the fair value of such long-lived assets using commonly accepted techniques, and may use more than one. Techniques used to determine fair value include, but are not limited to, the use of recent third party comparable sales for reference and internally developed discounted cash flow analysis. Significant changes in market conditions, changes to the condition of an asset, or a change in management’s intent to utilize the asset are generally viewed by management as triggering events to reassess the cash flows related to these long-lived assets. As at December 31, 2014, no asset impairment had been recorded for assets within either the Company’s regulated or unregulated businesses. Costs of Arranging Debt Financing For financial liabilities classified as other than held-for-trading, the Company defers the external transaction costs related to obtaining debt financing and presents such amounts as deferred debt issuance costs on the Consolidated Balance Sheets. Deferred debt issuance costs are amortized over the contractual life of the related debt on an effective-interest basis and the amortization is included within financing charges in the Consolidated Statements of Operations and Comprehensive Income. Transaction costs for items classified as held-for-trading are expensed immediately. Comprehensive Income Comprehensive income is comprised of net income and other comprehensive income (OCI). Hydro One presents net income and OCI in a single continuous Consolidated Statement of Operations and Comprehensive Income. Financial Assets and Liabilities All financial assets and liabilities are classified into one of the following five categories: held-to-maturity; loans and receivables; held-for-trading; other liabilities; or available-for-sale. Financial assets and liabilities classified as held-for-trading are measured at fair value. All other financial assets and liabilities are measured at amortized cost, except accounts receivable and amounts due from related parties, which are measured at the lower of cost or fair value. Accounts receivable and amounts due from related parties are classified as loans and receivables. The Company considers the carrying amounts of accounts receivable and amounts due from related parties to be reasonable estimates of fair value because of the short time to maturity of these instruments. Provisions for impaired accounts receivable are recognized as adjustments to the allowance for doubtful accounts and are recognized when there is objective evidence that the Company will not be able to collect amounts according to the original terms. All financial instrument transactions are recorded at trade date. Derivative instruments are measured at fair value. Gains and losses from fair valuation are included within financing charges in the period in which they arise. The Company determines the classification of its financial assets and liabilities at the date of initial recognition. The Company designates certain of its financial assets and liabilities to be held at fair value, when it is consistent with the Company’s risk management policy disclosed in Note 13 – Fair Value of Financial Instruments and Risk Management. Derivative Instruments and Hedge Accounting The Company closely monitors the risks associated with changes in interest rates on its operations and, where appropriate, uses various instruments to hedge these risks. Certain of these derivative instruments qualify for hedge accounting and are

HYDRO ONE INC. NOTES TO CONSOLIDATED FINANCIAL STATEMENTS (continued) For the years ended December 31, 2014 and 2013
15
designated as accounting hedges, while others either do not qualify as hedges or have not been designated as hedges (hereinafter referred to as undesignated contracts) as they are part of economic hedging relationships. The accounting guidance for derivative instruments requires the recognition of all derivative instruments not identified as meeting the normal purchase and sale exemption as either assets or liabilities recorded at fair value on the Consolidated Balance Sheets. For derivative instruments that qualify for hedge accounting, the Company may elect to designate such derivative instruments as either cash flow hedges or fair value hedges. The Company offsets fair value amounts recognized on its Consolidated Balance Sheets related to derivative instruments executed with the same counterparty under the same master netting agreement. For derivative instruments that qualify for hedge accounting and which are designated as cash flow hedges, the effective portion of any gain or loss, net of tax, is reported as a component of accumulated OCI (AOCI) and is reclassified to results of operations in the same period or periods during which the hedged transaction affects results of operations. Any gains or losses on the derivative instrument that represent either hedge ineffectiveness or hedge components excluded from the assessment of effectiveness are recognized in results of operations. For fair value hedges, changes in fair value of both the derivative instrument and the underlying hedged exposure are recognized in the Consolidated Statements of Operations and Comprehensive Income in the current period. The gain or loss on the derivative instrument is included in the same line item as the offsetting gain or loss on the hedged item in the Consolidated Statements of Operations and Comprehensive Income. Additionally, the Company enters into derivative agreements that are economic hedges which either do not qualify for hedge accounting or have not been designated as hedges. The changes in fair value of these undesignated derivative instruments are reflected in results of operations. Embedded derivative instruments are separated from their host contracts and carried at fair value on the Consolidated Balance Sheets when: (a) the economic characteristics and risks of the embedded derivative are not clearly and closely related to the economic characteristics and risks of the host contract; (b) the hybrid instrument is not measured at fair value, with changes in fair value recognized in results of operations each period; and (c) the embedded derivative itself meets the definition of a derivative. The Company does not engage in derivative trading or speculative activities and had no embedded derivatives at December 31, 2014 or 2013. Hydro One periodically develops hedging strategies taking into account risk management objectives. At the inception of a hedging relationship where the Company has elected to apply hedge accounting, Hydro One formally documents the relationship between the hedged item and the hedging instrument, the related risk management objective, the nature of the specific risk exposure being hedged, and the method for assessing the effectiveness of the hedging relationship. The Company also assesses, both at the inception of the hedge and on a quarterly basis, whether the hedging instruments are effective in offsetting changes in fair values or cash flows of the hedged items. Employee Future Benefits Employee future benefits provided by Hydro One include pension, post-retirement and post-employment benefits. The costs of the Company’s pension, post-retirement and post-employment benefit plans are recorded over the periods during which employees render service. The Company recognizes the funded status of its pension, post-retirement and post-employment plans on its Consolidated Balance Sheets and subsequently recognizes the changes in funded status at the end of each reporting year. Pension, post-retirement and post-employment plans are considered to be underfunded when the projected benefit obligation exceeds the fair value of the plan assets. Liabilities are recognized on the Consolidated Balance Sheets for any net underfunded projected benefit obligation. The net underfunded projected benefit obligation may be disclosed as a current liability, long-term liability, or both. The current portion is the amount by which the actuarial present value of benefits included in the benefit obligation payable in the next 12 months exceeds the fair value of plan assets. If the fair value of plan assets exceeds the projected benefit obligation of the plan, an asset is recognized equal to the net overfunded projected benefit obligation. The post-retirement and post-employment benefit plans are unfunded because there are no related plan assets.
HYDRO ONE INC. NOTES TO CONSOLIDATED FINANCIAL STATEMENTS (continued) For the years ended December 31, 2014 and 2013
16
Pension benefits In accordance with the OEB’s rate orders, pension costs are recorded on a cash basis as employer contributions are paid to the pension fund in accordance with the Pension Benefits Act (Ontario). Pension costs are recorded on an accrual basis for financial reporting purposes. Pension costs are actuarially determined using the projected benefit method prorated on service and are based on assumptions that reflect management’s best estimate of the effect of future events, including future compensation increases. Past service costs from plan amendments and all actuarial gains and losses are amortized on a straight-line basis over the expected average remaining service period of active employees in the plan, and over the estimated remaining life expectancy of inactive employees in the plan. Pension plan assets, consisting primarily of listed equity securities as well as corporate and government debt securities, are fair valued at the end of each year. Hydro One records a regulatory asset equal to the net underfunded projected benefit obligation for its pension plan. The regulatory asset for the net underfunded projected benefit obligation for the pension plan, in the absence of regulatory accounting, would be recognized in AOCI. A regulatory asset is recognized because management considers it to be probable that pension benefit costs will be recovered in the future through the rate-setting process. The pension regulatory assets are remeasured at the end of each year based on the current status of the pension plan. All future pension benefit costs are attributed to labour and are either charged to results of operations or capitalized as part of the cost of property, plant and equipment and intangible assets. Post-retirement and post-employment benefits Post-retirement and post-employment benefits are recorded and included in rates on an accrual basis. Costs are determined by independent actuaries using the projected benefit method prorated on service and based on assumptions that reflect management’s best estimates. Past service costs from plan amendments are amortized to results of operations based on the expected average remaining service period. Hydro One records a regulatory asset equal to the incremental net unfunded projected benefit obligation for post-retirement and post-employment plans recorded at each year end based on annual actuarial reports. The regulatory asset for the incremental net unfunded projected benefit obligation for post-retirement and post-employment plans, in the absence of regulatory accounting, would be recognized in AOCI. A regulatory asset is recognized because management considers it to be probable that post-retirement and post-employment benefit costs will be recovered in the future through the rate-setting process. For post-retirement benefits, all actuarial gains or losses are deferred using the “corridor” approach. The amount calculated above the “corridor” is amortized to results of operations on a straight-line basis over the expected average remaining service life of active employees in the plan and over the remaining life expectancy of inactive employees in the plan. The post-retirement benefit obligation is remeasured to its fair value at each year end based on an annual actuarial report, with an offset to the associated regulatory asset, to the extent of the remeasurement adjustment. For post-employment obligations, the associated regulatory liabilities representing actuarial gains on transition to US GAAP are amortized to results of operations based on the “corridor” approach. Post transition, the actuarial gains and losses on post-employment obligations that are incurred during the year are recognized immediately to results of operations. The post-employment benefit obligation is remeasured to its fair value at each year end based on an annual actuarial report, with an offset to the associated regulatory asset, to the extent of the remeasurement adjustment. All post-retirement and post-employment future benefit costs are attributed to labour and are either charged to results of operations or capitalized as part of the cost of property, plant and equipment and intangible assets. Multiemployer Pension Plan Employees of Hydro One Brampton Networks and the newly acquired Norfolk Power participate in the Ontario Municipal Employees Retirement System Fund (OMERS), a multiemployer, contributory, defined benefit public sector pension fund. OMERS provides retirement pension payments based on members’ length of service and salary. Both the participating employers and members are required to make plan contributions. The OMERS plan assets are pooled together to provide

HYDRO ONE INC. NOTES TO CONSOLIDATED FINANCIAL STATEMENTS (continued) For the years ended December 31, 2014 and 2013
17
benefits to all plan participants and the plan assets are not segregated by member entity. OMERS is registered with the Financial Services Commission of Ontario under Registration #0345983. At December 31, 2013, OMERS had approximately 440,000 members, with approximately 335 members being current employees of Hydro One Brampton Networks and Norfolk Power. The OMERS plan is accounted for as a defined contribution plan by Hydro One because it is not practicable to determine the present value of the Company’s obligation, the fair value of plan assets or the related current service cost applicable to Hydro One Brampton Networks and Norfolk Power employees. Hydro One recognizes its contributions to the OMERS plan as pension expense, with a portion being capitalized. The expensed amount is included in operation, maintenance and administration costs in the Consolidated Statements of Operations and Comprehensive Income. Loss Contingencies Hydro One is involved in certain legal and environmental matters that arise in the normal course of business. In the preparation of its Consolidated Financial Statements, management makes judgments regarding the future outcome of contingent events and records a loss for a contingency based on its best estimate when it is determined that such loss is probable and the amount of the loss can be reasonably estimated. Where the loss amount is recoverable in future rates, a regulatory asset is also recorded. When a range estimate for the probable loss exists and no amount within the range is a better estimate than any other amount, the Company records a loss at the minimum amount within the range. Management regularly reviews current information available to determine whether recorded provisions should be adjusted and whether new provisions are required. Estimating probable losses may require analysis of multiple forecasts and scenarios that often depend on judgments about potential actions by third parties, such as federal, provincial and local courts or regulators. Contingent liabilities are often resolved over long periods of time. Amounts recorded in the Consolidated Financial Statements may differ from the actual outcome once the contingency is resolved. Such differences could have a material impact on future results of operations, financial position and cash flows of the Company. Provisions are based upon current estimates and are subject to greater uncertainty where the projection period is lengthy. A significant upward or downward trend in the number of claims filed, the nature of the alleged injuries, and the average cost of resolving each claim could change the estimated provision, as could any substantial adverse or favourable verdict at trial. A federal or provincial legislative outcome or structured settlement could also change the estimated liability. Legal fees are expensed as incurred. Environmental Liabilities Environmental liabilities are recorded in respect of past contamination when it is determined that future environmental remediation expenditures are probable under existing statute or regulation and the amount of the future expenditures can be reasonably estimated. Hydro One records a liability for the estimated future expenditures associated with the contaminated land assessment and remediation (LAR) and for the phase-out and destruction of polychlorinated biphenyl (PCB)-contaminated mineral oil removed from electrical equipment, based on the present value of these estimated future expenditures. The Company determines the present value with a discount rate equal to its credit-adjusted risk-free interest rate on financial instruments with comparable maturities to the pattern of future environmental expenditures. As the Company anticipates that the future expenditures will continue to be recoverable in future rates, an offsetting regulatory asset has been recorded to reflect the future recovery of these environmental expenditures from customers. Hydro One reviews its estimates of future environmental expenditures annually, or more frequently if there are indications that circumstances have changed. Asset Retirement Obligations AROs are recorded for legal obligations associated with the future removal and disposal of long-lived assets. Such obligations may result from the acquisition, construction, development and/or normal use of the asset. Conditional AROs are recorded when there is a legal obligation to perform a future asset retirement activity but where the timing and/or method of settlement are conditional on a future event that may or may not be within the control of the Company. In such a case, the obligation to perform the asset retirement activity is unconditional even though uncertainty exists about the timing and/or method of settlement.
HYDRO ONE INC. NOTES TO CONSOLIDATED FINANCIAL STATEMENTS (continued) For the years ended December 31, 2014 and 2013
18
When recording an ARO, the present value of the estimated future expenditures required to complete the asset retirement activity is recorded in the period in which the obligation is incurred, if a reasonable estimate can be made. In general, the present value of the estimated future expenditures is added to the carrying amount of the associated asset and the resulting asset retirement cost is depreciated over the estimated useful life of the asset. Where an asset is no longer in service when an ARO is recorded, the asset retirement cost is recorded in results of operations. Some of the Company’s transmission and distribution assets, particularly those located on unowned easements and rights-of-way, may have AROs, conditional or otherwise. The majority of the Company’s easements and rights-of-way are either of perpetual duration or are automatically renewed annually. Land rights with finite terms are generally subject to extension or renewal. As the Company expects to use the majority of its facilities in perpetuity, no ARO currently exists for these assets. If, at some future date, a particular facility is shown not to meet the perpetuity assumption, it will be reviewed to determine whether an estimable ARO exists. In such a case, an ARO would be recorded at that time. The Company’s AROs recorded to date relate to estimated future expenditures associated with the removal and disposal of asbestos-containing materials installed in some of its facilities and with the decommissioning of specific switching stations located on unowned sites. 3. NEW ACCOUNTING PRONOUNCEMENTS Recently Adopted Accounting Pronouncements In July 2013, the Financial Accounting Standards Board (FASB) issued Accounting Standards Update (ASU) 2013-11, Income Taxes (Topic 740): Presentation of an Unrecognized Tax Benefit When a Net Operating Loss Carryforward, a Similar Tax Loss, or a Tax Credit Carryforward Exists. This ASU provides guidance on the presentation of unrecognized tax benefits. This ASU is effective for fiscal years, and interim periods within those years, beginning after December 15, 2013, and should be applied prospectively to all unrecognized tax benefits that exist at the effective date. The adoption of this ASU did not have a significant impact on the Company’s consolidated financial statements. Recent Accounting Guidance Not Yet Adopted In May 2014, the FASB issued ASU 2014-09, Revenue from Contracts with Customers (Topic 606). This ASU provides guidance on revenue recognition that depicts the transfer of promised goods or services to customers in an amount that reflects the consideration to which the entity expects to be entitled in exchange for those goods and services. This ASU is required to be applied retrospectively and is effective for fiscal years, and interim periods within those years, beginning after December 15, 2016. The Company is currently assessing the impact of adoption of ASU 2014-09 on its consolidated financial statements. In August 2014, the FASB issued ASU 2014-15, Presentation of Financial Statements – Going Concern (Subtopic 205-40): Disclosure of Uncertainties about an Entity’s Ability to Continue as a Going Concern. This ASU provides guidance about management’s responsibility to evaluate whether there is substantial doubt about an entity’s ability to continue as a going concern and related disclosures. This ASU is effective for the annual period ending December 31, 2016, and for annual and interim periods thereafter. The adoption of this ASU is not anticipated to have a significant impact on the Company’s consolidated financial statements. In November 2014, the FASB issued ASU 2014-16, Derivatives and Hedging (Topic 815). This ASU provides guidance on accounting for hybrid financial instruments issued in the form of a share. This ASU is effective for fiscal years, and interim periods within those years, beginning after December 15, 2015. The Company is currently assessing the impact of adoption of ASU 2014-16 on its consolidated financial statements.
HYDRO ONE INC. NOTES TO CONSOLIDATED FINANCIAL STATEMENTS (continued) For the years ended December 31, 2014 and 2013
19
4. BUSINESS COMBINATIONS B2M Limited Partnership In 2012, Hydro One entered into an agreement with the Chippewas of Nawash First Nation and the Chippewas of Saugeen First Nation, collectively referred to as the Saugeen Ojibway Nation (SON), where a noncontrolling equity interest in Hydro One’s new limited partnership, B2M LP, would be made available for purchase at fair value by the SON. B2M LP was formed by Hydro One in 2013 to hold most of the transmission lines and a licence to use the related land. These assets are associated with Hydro One’s Bruce to Milton Transmission Reinforcement Project, an electricity transmission line (Bruce to Milton Line) in southwestern Ontario, from the Bruce Power facility in Kincardine to Hydro One’s Milton Switching Station in the Town of Milton. Hydro One Networks will maintain and operate the Bruce to Milton Line in accordance with an operation and management services agreement. In November 2013, the OEB issued a Decision and Order granting B2M LP a transmission licence and granting Hydro One Networks leave to sell the relevant Bruce to Milton Line transmission assets to B2M LP. On December 16, 2014, the relevant Bruce to Milton Line transmission assets totalling $526 million were transferred from Hydro One Networks to B2M LP. This was financed by 60% debt ($316 million) and 40% equity ($210 million). On December 17, 2014, the SON acquired a 34.2% equity interest in B2M LP for consideration of $72 million, representing the fair value of the equity interest acquired. Part of the SON’s equity interest in B2M LP is in Class B units of B2M LP that have a mandatory put option. The put option requires that upon the occurrence of an enforcement event (i.e. an event of default such as a debt default by the SON or insolvency event), the SON has the ability to require Hydro One to purchase the Class B units of B2M LP for net book value on the redemption date. The noncontrolling interest relating to the Class B units is classified on the Consolidated Balance Sheet as temporary equity because the redemption feature is outside the control of the Company. The balance of the noncontrolling interest is classified within equity. At December 31, 2014, the total noncontrolling interest was reduced by the 2014 net loss attributable to noncontrolling interest totalling $2 million, including $1 million relating to noncontrolling interest subject to redemption. Acquisition of Norfolk Power On August 29, 2014, Hydro One acquired 100% of the common shares of Norfolk Power, an electricity distribution and telecom company located in southwestern Ontario. The total purchase price for Norfolk Power, net of the long-term debt assumed and adjusted for preliminary working capital and other closing adjustments, is approximately $68 million. The following table summarizes the preliminary determination of the fair value of the assets acquired and liabilities assumed: (millions of Canadian dollars) Working capital 6Property, plant and equipment 56Deferred income tax assets 1Goodwill 40Bank indebtedness (3)Derivative instruments (3)Long-term debt (26)Post-retirement and post-employment benefit liability (1)Environmental liability (1)Long-term accounts payable and other liabilities (1) 68 The determination of the fair values of assets acquired and liabilities assumed has been based upon management’s estimates and certain assumptions with respect to the fair values of the assets acquired and liabilities assumed. The purchase agreement provides for final purchase price adjustments based on agreed working capital and other balances at the acquisition date which have not yet been finalized. The Company will continue to review information and perform further analysis prior to finalizing
HYDRO ONE INC. NOTES TO CONSOLIDATED FINANCIAL STATEMENTS (continued) For the years ended December 31, 2014 and 2013
20
the total purchase price and therefore the actual total purchase price and the consequent impact on goodwill may differ from the amounts above. Goodwill of approximately $40 million arising from the Norfolk Power acquisition consists largely of the synergies and economies of scale expected from combining the operations of Hydro One and Norfolk Power. All of the goodwill was assigned to Hydro One’s Distribution Business segment. None of the goodwill recognized is expected to be deductible for income tax purposes. Norfolk Power contributed revenues of $18 million and net income of less than $1 million to the Company’s consolidated financial results for the year ended December 31, 2014. All costs related to the acquisition have been expensed through the Consolidated Statements of Operations and Comprehensive Income. The disclosure of Norfolk Power’s pro forma information is immaterial to the Company’s consolidated financial results for the year ended December 31, 2014. Woodstock Hydro Purchase Agreement On May 21, 2014, Hydro One reached an agreement with the City of Woodstock to acquire 100% of the common shares of Woodstock Hydro Holdings Inc. (Woodstock Hydro), an electricity distribution company located in southwestern Ontario. The acquisition is pending a regulatory decision from the OEB. The purchase price for Woodstock Hydro will be approximately $29 million, subject to final closing adjustments. The transaction is anticipated to be completed in 2015. In anticipation of the Woodstock Hydro acquisition, the Company made a refundable deposit totalling $2 million, which is recorded in prepaid expenses and other assets on the Consolidated Balance Sheet. Haldimand Hydro Purchase Agreement On June 10, 2014, Hydro One reached an agreement with Haldimand County to acquire 100% of the common shares of Haldimand County Utilities Inc. (Haldimand Hydro), an electricity distribution and telecom company located in southwestern Ontario. The acquisition is pending a regulatory decision from the OEB. The purchase price for Haldimand Hydro will be approximately $65 million, subject to final closing adjustments. The transaction is anticipated to be completed in 2015. In anticipation of the Haldimand Hydro acquisition, the Company made a refundable deposit totalling $3 million, which is recorded in prepaid expenses and other assets on the Consolidated Balance Sheet. 5. DEPRECIATION AND AMORTIZATION
Year ended December 31 (millions of Canadian dollars) 2014 2013
Depreciation of property, plant and equipment 565 533Amortization of intangible assets 53 48Asset removal costs 81 79Amortization of regulatory assets 23 16 722 676 6. FINANCING CHARGES Year ended December 31 (millions of Canadian dollars) 2014 2013Interest on long-term debt 432 416Other 12 9Less: Interest capitalized on construction and development in progress (49) (51) Gain on interest-rate swap agreements (10) (11) Interest earned on investments (6) (3) 379 360
HYDRO ONE INC. NOTES TO CONSOLIDATED FINANCIAL STATEMENTS (continued) For the years ended December 31, 2014 and 2013
21
7. PROVISION FOR PAYMENTS IN LIEU OF CORPORATE INCOME TAXES The provision for PILs differs from the amount that would have been recorded using the combined Canadian federal and Ontario statutory income tax rate. The reconciliation between the statutory and the effective tax rates is provided as follows: Year ended December 31 (millions of Canadian dollars) 2014 2013Income before provision for PILs 836 912Canadian federal and Ontario statutory income tax rate 26.50% 26.50%Provision for PILs at statutory rate 222 242 Increase (decrease) resulting from: Net temporary differences included in amounts charged to customers: Capital cost allowance in excess of depreciation and amortization (72) (72) Pension contributions in excess of pension expense (24) (23) Overheads capitalized for accounting but deducted for tax purposes (15) (14) Interest capitalized for accounting but deducted for tax purposes (13) (13) Environmental expenditures (5) (4) Prior year’s adjustments (4) (8) Non-refundable investment tax credits (3) (4) Post-retirement and post-employment benefit expense in excess of cash payments 3 4 Other (1) (1)Net temporary differences (134) (135)Net permanent differences 1 2Total provision for PILs 89 109 The major components of income tax expense are as follows: Year ended December 31 (millions of Canadian dollars) 2014 2013
Current provision for PILs 79 111Deferred provision (recovery) for PILs 10 (2)Total provision for PILs 89 109 Effective income tax rate 10.63% 11.98% The current provision for PILs is remitted to, or received from, the OEFC. At December 31, 2014, $39 million due from the OEFC was included in due from related parties on the Consolidated Balance Sheet (2013 – $29 million). At December 31, 2014, the total provision for PILs includes deferred provision for PILs of $10 million (2013 – deferred recovery of $2 million) that is not included in the rate-setting process, using the liability method of accounting. Deferred PILs balances expected to be included in the rate-setting process are offset by regulatory assets and liabilities to reflect the anticipated recovery or disposition of these balances within future electricity rates.
HYDRO ONE INC. NOTES TO CONSOLIDATED FINANCIAL STATEMENTS (continued) For the years ended December 31, 2014 and 2013
22
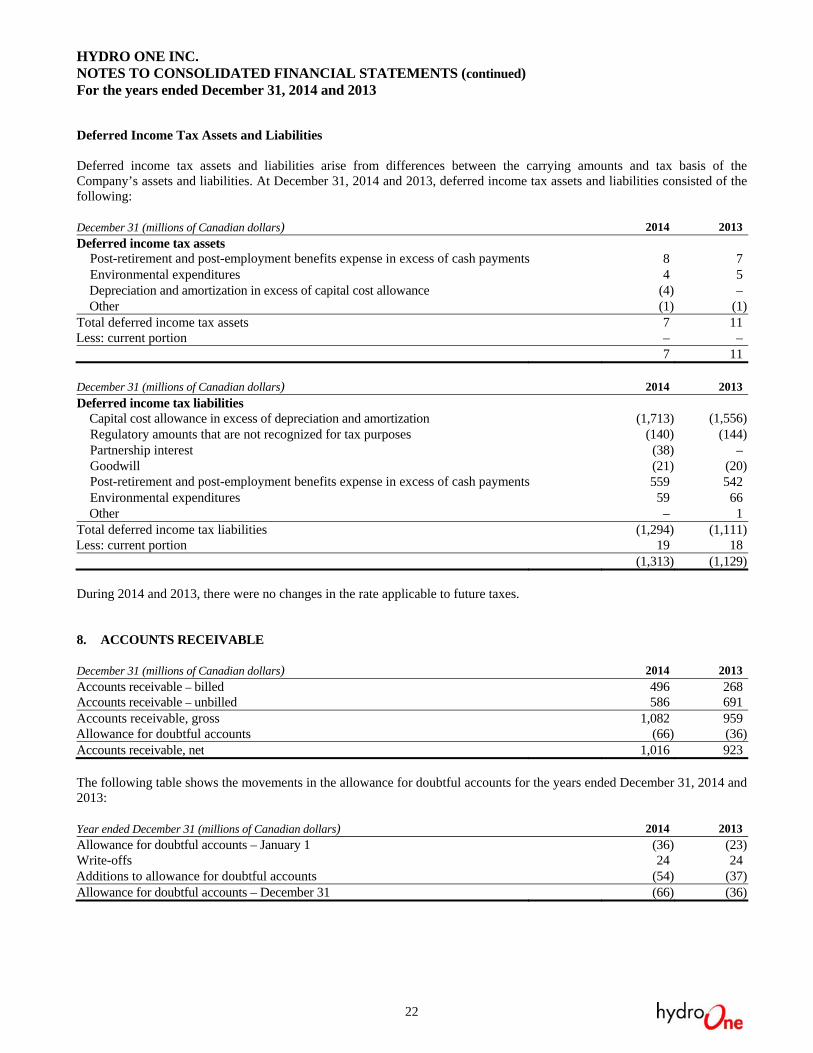
Deferred Income Tax Assets and Liabilities Deferred income tax assets and liabilities arise from differences between the carrying amounts and tax basis of the Company’s assets and liabilities. At December 31, 2014 and 2013, deferred income tax assets and liabilities consisted of the following: December 31 (millions of Canadian dollars) 2014 2013
Deferred income tax assets Post-retirement and post-employment benefits expense in excess of cash payments 8 7 Environmental expenditures 4 5 Depreciation and amortization in excess of capital cost allowance (4) – Other (1) (1)Total deferred income tax assets 7 11Less: current portion – – 7 11 December 31 (millions of Canadian dollars) 2014 2013
Deferred income tax liabilities Capital cost allowance in excess of depreciation and amortization (1,713) (1,556) Regulatory amounts that are not recognized for tax purposes (140) (144) Partnership interest (38) – Goodwill (21) (20) Post-retirement and post-employment benefits expense in excess of cash payments 559 542 Environmental expenditures 59 66 Other – 1Total deferred income tax liabilities (1,294) (1,111)Less: current portion 19 18 (1,313) (1,129) During 2014 and 2013, there were no changes in the rate applicable to future taxes. 8. ACCOUNTS RECEIVABLE December 31 (millions of Canadian dollars) 2014 2013
Accounts receivable – billed 496 268Accounts receivable – unbilled 586 691Accounts receivable, gross 1,082 959Allowance for doubtful accounts (66) (36)Accounts receivable, net 1,016 923 The following table shows the movements in the allowance for doubtful accounts for the years ended December 31, 2014 and 2013: Year ended December 31 (millions of Canadian dollars) 2014 2013Allowance for doubtful accounts – January 1 (36) (23)Write-offs 24 24Additions to allowance for doubtful accounts (54) (37)Allowance for doubtful accounts – December 31 (66) (36)

HYDRO ONE INC. NOTES TO CONSOLIDATED FINANCIAL STATEMENTS (continued) For the years ended December 31, 2014 and 2013
23
9. PROPERTY, PLANT AND EQUIPMENT December 31, 2014 (millions of Canadian dollars)
Property, Plant and Equipment
Accumulated Depreciation
Construction in Progress
Total
Transmission 13,209 4,416 626 9,419Distribution 9,076 3,225 320 6,171Communication 1,100 615 56 541Administration and Service 1,502 793 23 732Easements 623 85 – 538 25,510 9,134 1,025 17,401 December 31, 2013 (millions of Canadian dollars)
Property, Plant and Equipment
Accumulated Depreciation
Construction in Progress
Total
Transmission 12,413 4,215 671 8,869Distribution 8,498 3,046 316 5,768Communication 1,060 560 53 553Administration and Service 1,380 716 38 702Easements 617 78 – 539 23,968 8,615 1,078 16,431 Financing charges capitalized on property, plant and equipment under construction were $48 million in 2014 (2013 – $48 million). 10. INTANGIBLE ASSETS
December 31, 2014 (millions of Canadian dollars)
Intangible Assets
Accumulated Amortization
Development in Progress
Total
Computer applications software 573 303 3 273Other 5 2 – 3 578 305 3 276 December 31, 2013 (millions of Canadian dollars)
Intangible Assets
Accumulated Amortization
Development in Progress
Total
Computer applications software 557 249 3 311Other 5 3 – 2 562 252 3 313 Financing charges capitalized on intangible assets under development were $1 million in 2014 (2013 – $3 million). The estimated annual amortization expense for intangible assets is as follows: 2015 – $53 million; 2016 – $53 million; 2017 – $53 million; 2018 – $45 million; and 2019 – $31 million.
HYDRO ONE INC. NOTES TO CONSOLIDATED FINANCIAL STATEMENTS (continued) For the years ended December 31, 2014 and 2013
24
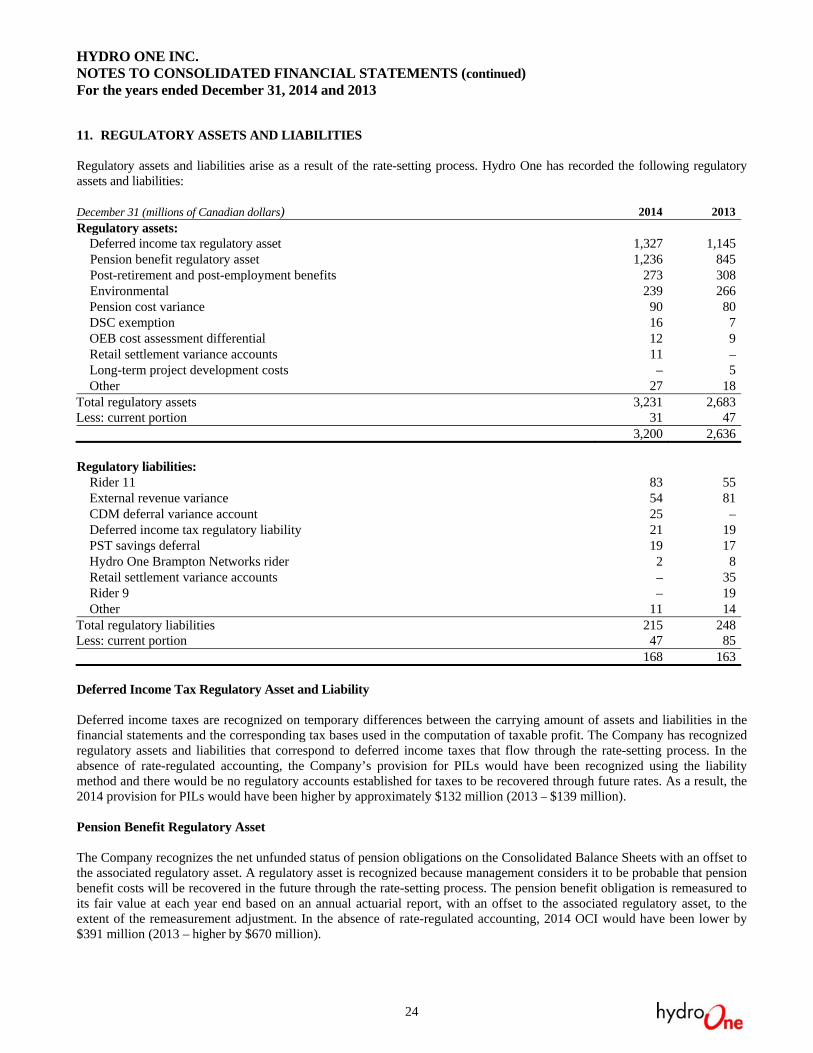
11. REGULATORY ASSETS AND LIABILITIES Regulatory assets and liabilities arise as a result of the rate-setting process. Hydro One has recorded the following regulatory assets and liabilities: December 31 (millions of Canadian dollars) 2014 2013
Regulatory assets: Deferred income tax regulatory asset 1,327 1,145 Pension benefit regulatory asset 1,236 845 Post-retirement and post-employment benefits 273 308 Environmental 239 266 Pension cost variance 90 80 DSC exemption 16 7 OEB cost assessment differential 12 9 Retail settlement variance accounts 11 – Long-term project development costs – 5 Other 27 18
Total regulatory assets 3,231 2,683Less: current portion 31 47
3,200 2,636 Regulatory liabilities: Rider 11 83 55 External revenue variance 54 81 CDM deferral variance account 25 – Deferred income tax regulatory liability 21 19 PST savings deferral 19 17 Hydro One Brampton Networks rider 2 8 Retail settlement variance accounts – 35 Rider 9 – 19 Other 11 14
Total regulatory liabilities 215 248Less: current portion 47 85
168 163 Deferred Income Tax Regulatory Asset and Liability Deferred income taxes are recognized on temporary differences between the carrying amount of assets and liabilities in the financial statements and the corresponding tax bases used in the computation of taxable profit. The Company has recognized regulatory assets and liabilities that correspond to deferred income taxes that flow through the rate-setting process. In the absence of rate-regulated accounting, the Company’s provision for PILs would have been recognized using the liability method and there would be no regulatory accounts established for taxes to be recovered through future rates. As a result, the 2014 provision for PILs would have been higher by approximately $132 million (2013 – $139 million). Pension Benefit Regulatory Asset The Company recognizes the net unfunded status of pension obligations on the Consolidated Balance Sheets with an offset to the associated regulatory asset. A regulatory asset is recognized because management considers it to be probable that pension benefit costs will be recovered in the future through the rate-setting process. The pension benefit obligation is remeasured to its fair value at each year end based on an annual actuarial report, with an offset to the associated regulatory asset, to the extent of the remeasurement adjustment. In the absence of rate-regulated accounting, 2014 OCI would have been lower by $391 million (2013 – higher by $670 million).
HYDRO ONE INC. NOTES TO CONSOLIDATED FINANCIAL STATEMENTS (continued) For the years ended December 31, 2014 and 2013
25
Post-Retirement and Post-Employment Benefits The Company recognizes the net unfunded status of post-retirement and post-employment obligations on the Consolidated Balance Sheets with an incremental offset to the associated regulatory assets. A regulatory asset is recognized because management considers it to be probable that post-retirement and post-employment benefit costs will be recovered in the future through the rate-setting process. The post-retirement and post-employment benefit obligation is remeasured to its fair value at each year end based on an annual actuarial report, with an offset to the associated regulatory asset, to the extent of the remeasurement adjustment. In the absence of rate-regulated accounting, 2014 OCI would have been higher by $35 million (2013 – $12 million). Environmental Hydro One records a liability for the estimated future expenditures required to remediate environmental contamination. Because such expenditures are expected to be recoverable in future rates, the Company has recorded an equivalent amount as a regulatory asset. In 2014, the environmental regulatory asset decreased by $33 million (2013 – $3 million) to reflect related changes in the Company’s PCB liability, and increased by $13 million (2013 – $26 million) due to changes in the LAR liability. The environmental regulatory asset is amortized to results of operations based on the pattern of actual expenditures incurred and charged to environmental liabilities. The OEB has the discretion to examine and assess the prudency and the timing of recovery of all of Hydro One’s actual environmental expenditures. In the absence of rate-regulated accounting, 2014 operation, maintenance and administration expenses would have been lower by $20 million (2013 – higher by $23 million). In addition, 2014 amortization expense would have been lower by $18 million (2013 – $16 million), and 2014 financing charges would have been higher by $11 million (2013 – $10 million). Pension Cost Variance A pension cost variance account was established for Hydro One Networks’ transmission and distribution businesses to track the difference between the actual pension expenses incurred and estimated pension costs approved by the OEB. The balance in this regulatory account reflects the excess of pension costs paid as compared to OEB-approved amounts. In the absence of rate-regulated accounting, 2014 revenue would have been lower by $10 million (2013 – $19 million). DSC Exemption In June 2010, Hydro One Networks filed an application with the OEB regarding the OEB’s new cost responsibility rules contained in the OEB’s October 2009 Notice of Amendment to the Distribution System Code (DSC), with respect to the connection of certain renewable generators that were already connected or that had received a connection impact assessment prior to October 21, 2009. The application sought approval to record and defer the unanticipated costs incurred by Hydro One Networks that resulted from the connection of certain renewable generation facilities. The OEB ruled that identified specific expenditures can be recorded in a deferral account subject to the OEB’s review until the next Hydro One Networks’ distribution cost-of-service application. This program effectively ended at the end of 2014 with no new principal to be recorded in 2015. OEB Cost Assessment Differential In April 2010, the OEB issued its Decision regarding Hydro One Networks’ distribution rate application for 2010 and 2011. As part of this decision, the OEB also approved the distribution-related OEB Cost Assessment Differential Account to record the difference between the amounts approved in rates and actual expenditures with respect to the OEB’s cost assessments. This continued for 2012-2014 until the next Hydro One Networks’ distribution cost-of-service application, which was submitted in 2014. This program effectively ended at the end of 2014 with no new activity to be recorded in 2015. Retail Settlement Variance Accounts (RSVAs) Hydro One has deferred certain retail settlement variance amounts under the provisions of Article 490 of the OEB’s Accounting Procedures Handbook. In December 2012, the OEB approved the disposition of the total RSVA balance accumulated from January 2010 to December 2011, including accrued interest, to be disposed over a 24-month period from January 1, 2013 to December 31, 2014. At December 31, 2014, the RSVA was in a net asset position due to a change in global adjustment.
HYDRO ONE INC. NOTES TO CONSOLIDATED FINANCIAL STATEMENTS (continued) For the years ended December 31, 2014 and 2013
26
Long-Term Project Development Costs In May 2009, the OEB approved the creation of a deferral account to record Hydro One Networks’ costs of preliminary work to advance certain transmission projects identified in the Company’s 2009 and 2010 transmission rate applications. In March 2010, the OEB issued a decision amending the scope of the account to include the 20 major transmission projects identified in the September 2009 request from the Ministry of Energy and Infrastructure. In December 2012, the OEB approved the recovery of the December 31, 2012 balance, including accrued interest, to be recovered over a one-year period from January 1, 2014 to December 31, 2014. Rider 11 In April 2010, the OEB requested the establishment of deferral accounts which capture the difference between the revenue recorded on the basis of Green Energy Plan expenditures incurred and the actual recoveries received. Rider 11 includes amounts previously included as Rider 8. External Revenue Variance In May 2009, the OEB approved forecasted amounts related to export service revenue, external revenue from secondary land use, and external revenue from station maintenance and engineering and construction work. In November 2012, the OEB again approved forecasted amounts related to these revenue categories and extended the scope to encompass all other external revenues. The external revenue variance account balance reflects the excess of actual external revenues compared to the OEB-approved forecasted amounts. CDM Deferral Variance Account As part of Hydro One Networks’ application for 2013 and 2014 transmission rates, Hydro One agreed to establish a new regulatory deferral variance account to track the impact of actual Conservation and Demand Management (CDM) and demand response results on the load forecast compared to the estimated load forecast included in the revenue requirement. The balance in the CDM deferral variance account relates to the actual 2013 CDM compared to the amounts included in 2013 revenue requirement. The OEB rate order specifically states that the Ontario Power Authority (OPA) data used to calculate the difference between forecasted and actual savings will be provided one year in arrears, and as a result, no amount should be recorded in advance of notification from the OPA of actual results. This notification from the OPA typically occurs in September of each year. PST Savings Deferral Account The provincial sales tax (PST) and goods and services tax (GST) were harmonized in July 2010. Unlike the GST, the PST was included in operation, maintenance and administration expenses or capital expenditures for past revenue requirements approved during a full cost-of-service hearing. Under the harmonized sales tax (HST) regime, the HST included in operation, maintenance and administration expenses or capital expenditures is not a cost ultimately borne by the Company and as such, a refund of the prior PST element in the approved revenue requirement is applicable, and calculations for tracking and refund were requested by the OEB. For Hydro One Networks’ transmission revenue requirement, PST was included between July 1, 2010 and December 31, 2010 and recorded in a deferral account, per direction from the OEB. For Hydro One Networks’ distribution revenue requirement, PST was included between July 1, 2010 and December 31, 2014 and recorded in a deferral account, per direction from the OEB. Hydro One Brampton Networks Rider In December 2013, the OEB issued a decision for Hydro One Brampton Networks’ 2014 distribution rates. Included in the OEB’s decision was the approval of certain deferral account balances, primarily RSVAs. The OEB ordered that the approved balances be aggregated into a single regulatory account and disposed of through a rate rider over a two-year period from January 1, 2014 to December 31, 2015.

HYDRO ONE INC. NOTES TO CONSOLIDATED FINANCIAL STATEMENTS (continued) For the years ended December 31, 2014 and 2013
27
Rider 9 In December 2012, as part of Hydro One Networks’ 2013 IRM distribution rate application, the OEB approved for disposition certain distribution-related deferral account balances, including RSVA amounts and balances of Rider 2 and Rider 3, accumulated up to December 2011, including accrued interest, to be disposed over a 24-month period from January 1, 2013 to December 31, 2014. 12. DEBT AND CREDIT AGREEMENTS Short-Term Notes Hydro One meets its short-term liquidity requirements in part through the issuance of commercial paper under its Commercial Paper Program which has a maximum authorized amount of $1,000 million. These short-term notes are denominated in Canadian dollars with varying maturities not exceeding 365 days. Hydro One had no commercial paper borrowings outstanding as at December 31, 2014 and 2013. Hydro One has a $1,500 million committed and unused revolving standby credit facility with a syndicate of banks, maturing in June 2019. If used, interest on the facility would apply based on Canadian benchmark rates. This credit facility is unsecured and supports the Company’s Commercial Paper Program. The Company may use the credit facility for general corporate purposes, including meeting short-term funding requirements. The obligation of each lender to make any credit extension to the Company under its credit facility is subject to various conditions including, among other things, that no event of default has occurred or would result from such credit extension. Long-Term Debt The Company issues notes for long-term financing under its Medium-Term Note (MTN) Program. The maximum authorized principal amount of notes issuable under this program is $3,000 million. At December 31, 2014, $1,187 million remained available for issuance until October 2015.
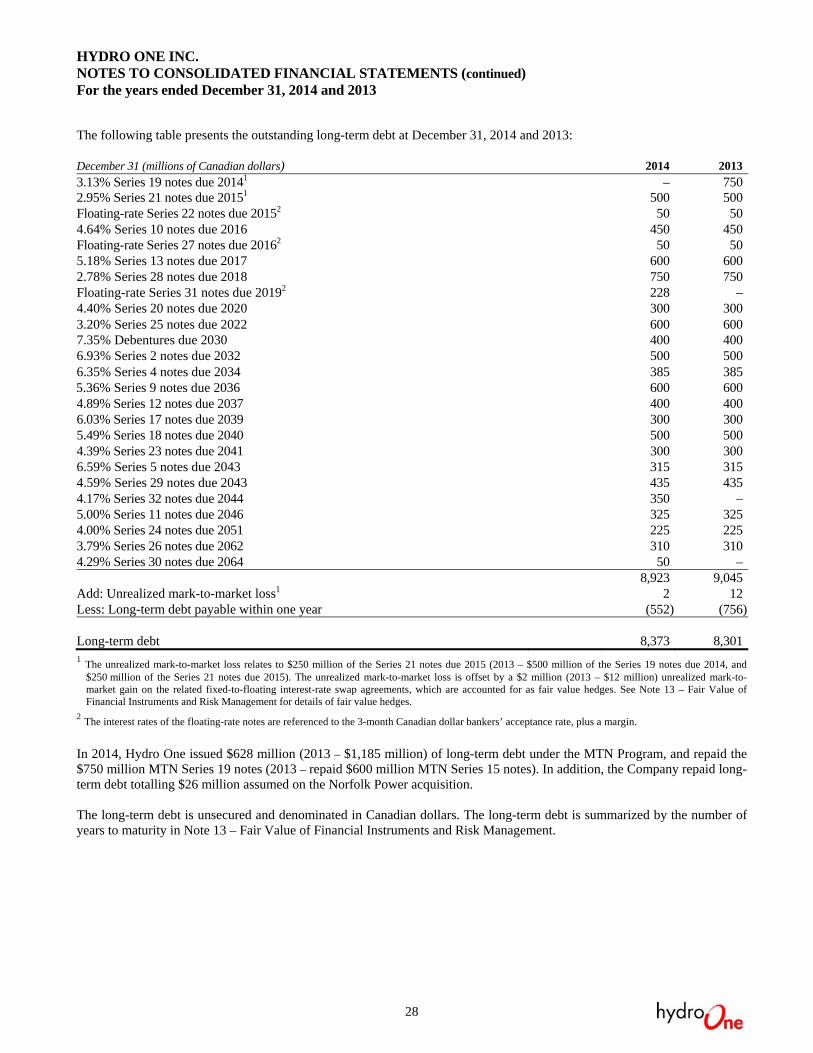
HYDRO ONE INC. NOTES TO CONSOLIDATED FINANCIAL STATEMENTS (continued) For the years ended December 31, 2014 and 2013
28
The following table presents the outstanding long-term debt at December 31, 2014 and 2013: December 31 (millions of Canadian dollars) 2014 2013
3.13% Series 19 notes due 20141 – 7502.95% Series 21 notes due 20151 500 500Floating-rate Series 22 notes due 20152 50 504.64% Series 10 notes due 2016 450 450Floating-rate Series 27 notes due 20162 50 505.18% Series 13 notes due 2017 600 6002.78% Series 28 notes due 2018 750 750Floating-rate Series 31 notes due 20192 228 –4.40% Series 20 notes due 2020 300 3003.20% Series 25 notes due 2022 600 6007.35% Debentures due 2030 400 4006.93% Series 2 notes due 2032 500 5006.35% Series 4 notes due 2034 385 3855.36% Series 9 notes due 2036 600 6004.89% Series 12 notes due 2037 400 4006.03% Series 17 notes due 2039 300 3005.49% Series 18 notes due 2040 500 5004.39% Series 23 notes due 2041 300 3006.59% Series 5 notes due 2043 315 3154.59% Series 29 notes due 2043 435 4354.17% Series 32 notes due 2044 350 –5.00% Series 11 notes due 2046 325 3254.00% Series 24 notes due 2051 225 2253.79% Series 26 notes due 2062 310 3104.29% Series 30 notes due 2064 50 – 8,923 9,045Add: Unrealized mark-to-market loss1 2 12Less: Long-term debt payable within one year (552) (756) Long-term debt 8,373 8,3011 The unrealized mark-to-market loss relates to $250 million of the Series 21 notes due 2015 (2013 – $500 million of the Series 19 notes due 2014, and
$250 million of the Series 21 notes due 2015). The unrealized mark-to-market loss is offset by a $2 million (2013 – $12 million) unrealized mark-to-market gain on the related fixed-to-floating interest-rate swap agreements, which are accounted for as fair value hedges. See Note 13 – Fair Value of Financial Instruments and Risk Management for details of fair value hedges.
2 The interest rates of the floating-rate notes are referenced to the 3-month Canadian dollar bankers’ acceptance rate, plus a margin.
In 2014, Hydro One issued $628 million (2013 – $1,185 million) of long-term debt under the MTN Program, and repaid the $750 million MTN Series 19 notes (2013 – repaid $600 million MTN Series 15 notes). In addition, the Company repaid long-term debt totalling $26 million assumed on the Norfolk Power acquisition. The long-term debt is unsecured and denominated in Canadian dollars. The long-term debt is summarized by the number of years to maturity in Note 13 – Fair Value of Financial Instruments and Risk Management.

HYDRO ONE INC. NOTES TO CONSOLIDATED FINANCIAL STATEMENTS (continued) For the years ended December 31, 2014 and 2013
29
13. FAIR VALUE OF FINANCIAL INSTRUMENTS AND RISK MANAGEMENT Fair value is considered to be the exchange price in an orderly transaction between market participants to sell an asset or transfer a liability at the measurement date. The fair value definition focuses on an exit price, which is the price that would be received in the sale of an asset or the amount that would be paid to transfer a liability. Hydro One classifies its fair value measurements based on the following hierarchy, as prescribed by the accounting guidance for fair value, which prioritizes the inputs to valuation techniques used to measure fair value into three levels: Level 1 inputs are unadjusted quoted prices in active markets for identical assets or liabilities that Hydro One has the ability to access. An active market for the asset or liability is one in which transactions for the asset or liability occur with sufficient frequency and volume to provide ongoing pricing information. Level 2 inputs are those other than quoted market prices that are observable, either directly or indirectly, for an asset or liability. Level 2 inputs include, but are not limited to, quoted prices for similar assets or liabilities in an active market, quoted prices for identical or similar assets or liabilities in markets that are not active and inputs other than quoted market prices that are observable for the asset or liability, such as interest-rate curves and yield curves observable at commonly quoted intervals, volatilities, credit risk and default rates. A Level 2 measurement cannot have more than an insignificant portion of the valuation based on unobservable inputs. Level 3 inputs are any fair value measurements that include unobservable inputs for the asset or liability for more than an insignificant portion of the valuation. A Level 3 measurement may be based primarily on Level 2 inputs. Non-Derivative Financial Assets and Liabilities At December 31, 2014 and 2013, the Company’s carrying amounts of accounts receivable, due from related parties, cash and cash equivalents, bank indebtedness, accounts payable, and due to related parties are representative of fair value because of the short-term nature of these instruments. Fair Value Measurements of Long-Term Debt The fair values and carrying values of the Company’s long-term debt at December 31, 2014 and 2013 are as follows:
December 31 (millions of Canadian dollars) 2014
Carrying Value2014
Fair Value2013
Carrying Value 2013
Fair ValueLong-term debt
$500 million of MTN Series 19 notes1 – – 506 506 $250 million of MTN Series 21 notes1 252 252 256 256 Other notes and debentures2 8,673 10,159 8,295 9,018 8,925 10,411 9,057 9,780
1 The fair value of $500 million of the MTN Series 19 notes and of $250 million of the MTN Series 21 notes subject to hedging is primarily based on changes in the present value of future cash flows due to a change in the yield in the swap market for the related swap (hedged risk).
2 The fair value of other notes and debentures, and the portions of the MTN Series 19 notes and the MTN Series 21 notes that are not subject to hedging, represents the market value of the notes and debentures and is based on unadjusted period-end market prices for the same or similar debt of the same remaining maturities.
Fair Value Measurements of Derivative Instruments At December 31, 2014, the Company had interest-rate swaps totalling $250 million (2013 – $750 million) that were used to convert fixed-rate debt to floating-rate debt. These swaps are classified as fair value hedges. The Company’s fair value hedge exposure was equal to about 3% (2013 – 8%) of its total long-term debt of $8,925 million (2013 – $9,057 million). At December 31, 2014, the Company had the following interest-rate swaps designated as fair value hedges:
(a) two $125 million fixed-to-floating interest-rate swap agreements to convert $250 million of the $500 million MTN Series 21 notes maturing September 11, 2015 into three-month variable-rate debt.
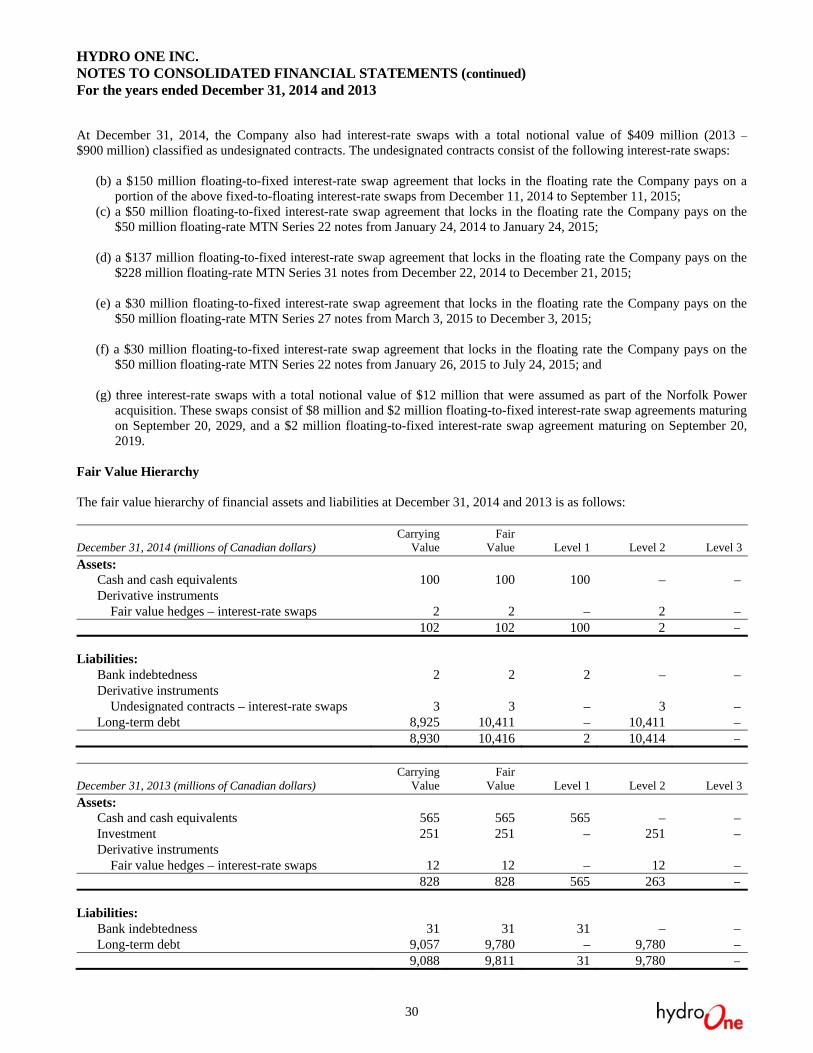
HYDRO ONE INC. NOTES TO CONSOLIDATED FINANCIAL STATEMENTS (continued) For the years ended December 31, 2014 and 2013
30
At December 31, 2014, the Company also had interest-rate swaps with a total notional value of $409 million (2013 – $900 million) classified as undesignated contracts. The undesignated contracts consist of the following interest-rate swaps:
(b) a $150 million floating-to-fixed interest-rate swap agreement that locks in the floating rate the Company pays on a portion of the above fixed-to-floating interest-rate swaps from December 11, 2014 to September 11, 2015;
(c) a $50 million floating-to-fixed interest-rate swap agreement that locks in the floating rate the Company pays on the $50 million floating-rate MTN Series 22 notes from January 24, 2014 to January 24, 2015;
(d) a $137 million floating-to-fixed interest-rate swap agreement that locks in the floating rate the Company pays on the
$228 million floating-rate MTN Series 31 notes from December 22, 2014 to December 21, 2015; (e) a $30 million floating-to-fixed interest-rate swap agreement that locks in the floating rate the Company pays on the
$50 million floating-rate MTN Series 27 notes from March 3, 2015 to December 3, 2015; (f) a $30 million floating-to-fixed interest-rate swap agreement that locks in the floating rate the Company pays on the
$50 million floating-rate MTN Series 22 notes from January 26, 2015 to July 24, 2015; and (g) three interest-rate swaps with a total notional value of $12 million that were assumed as part of the Norfolk Power
acquisition. These swaps consist of $8 million and $2 million floating-to-fixed interest-rate swap agreements maturing on September 20, 2029, and a $2 million floating-to-fixed interest-rate swap agreement maturing on September 20, 2019.
Fair Value Hierarchy The fair value hierarchy of financial assets and liabilities at December 31, 2014 and 2013 is as follows: December 31, 2014 (millions of Canadian dollars)
Carrying Value
Fair Value
Level 1
Level 2
Level 3
Assets: Cash and cash equivalents 100 100 100 – – Derivative instruments Fair value hedges – interest-rate swaps 2 2 – 2 – 102 102 100 2 –
Liabilities: Bank indebtedness 2 2 2 – – Derivative instruments Undesignated contracts – interest-rate swaps 3 3 – 3 – Long-term debt 8,925 10,411 – 10,411 – 8,930 10,416 2 10,414 –
December 31, 2013 (millions of Canadian dollars)
Carrying Value
Fair Value
Level 1
Level 2
Level 3
Assets: Cash and cash equivalents 565 565 565 – – Investment 251 251 – 251 – Derivative instruments Fair value hedges – interest-rate swaps 12 12 – 12 – 828 828 565 263 –
Liabilities: Bank indebtedness 31 31 31 – – Long-term debt 9,057 9,780 – 9,780 – 9,088 9,811 31 9,780 –
HYDRO ONE INC. NOTES TO CONSOLIDATED FINANCIAL STATEMENTS (continued) For the years ended December 31, 2014 and 2013
31
Cash and cash equivalents include cash and short-term investments. At December 31, 2014, short-term investments consisted of bankers’ acceptances and money market funds totalling $nil (2013 – $515 million). The carrying values are representative of fair value because of the short-term nature of these instruments. The investment at December 31, 2013 represented the Province of Ontario Floating-Rate Notes that matured in November 2014. The fair value of the investment was determined using inputs other than quoted prices that are observable for the asset, with unrecognized gains or losses recognized in financing charges. The Company obtained quotes from an independent third party for the fair value of the investment, who uses the market price of similar securities adjusted for changes in observable inputs such as maturity dates and interest rates. The fair value of the derivative instruments is determined using inputs other than quoted prices that are observable for these assets. The fair value is primarily based on the present value of future cash flows using a swap yield curve to determine the assumptions for interest rates. The fair value of the hedged portion of the long-term debt is primarily based on the present value of future cash flows using a swap yield curve to determine the assumption for interest rates. The fair value of the unhedged portion of the long-term debt is based on unadjusted period-end market prices for the same or similar debt of the same remaining maturities. There were no significant transfers between any of the fair value levels during the years ended December 31, 2014 and 2013. Risk Management Exposure to market risk, credit risk and liquidity risk arises in the normal course of the Company’s business. Market Risk Market risk refers primarily to the risk of loss that results from changes in commodity prices, foreign exchange rates and interest rates. The Company does not have commodity risk. The Company does have foreign exchange risk as it enters into agreements to purchase materials and equipment associated with capital programs and projects that are settled in foreign currencies. This foreign exchange risk is not material, although the Company could in the future decide to issue foreign currency-denominated debt which would be hedged back to Canadian dollars consistent with its risk management policy. Hydro One is exposed to fluctuations in interest rates as the regulated rate of return for the Company’s Transmission and Distribution Businesses is derived using a formulaic approach that is based on the forecast for long-term Government of Canada bond yields and the spread in 30-year “A”-rated Canadian utility bonds over the 30-year benchmark Government of Canada bond yield. The Company estimates that a 1% decrease in the forecasted long-term Government of Canada bond yield or the “A”-rated Canadian utility spread used in determining the Company’s rate of return would reduce the Transmission Business’ 2014 annual results of operations by approximately $20 million (2013 – $19 million) and Hydro One Networks’ distribution business’ 2014 annual results of operations by approximately $10 million (2013 – $10 million). The Company uses a combination of fixed and variable-rate debt to manage the mix of its debt portfolio. The Company also uses derivative financial instruments to manage interest-rate risk. The Company utilizes interest-rate swaps, which are typically designated as fair value hedges, as a means to manage its interest rate exposure to achieve a lower cost of debt. In addition, the Company may utilize interest-rate derivative instruments to lock in interest-rate levels in anticipation of future financing. Hydro One may also enter into derivative agreements such as forward-starting pay fixed-interest-rate swap agreements to hedge against the effect of future interest-rate movements on long-term fixed-rate borrowing requirements. Such arrangements are typically designated as cash flow hedges. No cash flow hedge agreements were in existence as at December 31, 2014 or 2013. A hypothetical 10% increase in the interest rates associated with variable-rate debt would not have resulted in a significant decrease in Hydro One’s results of operations for the years ended December 31, 2014 or 2013. Fair Value Hedges For derivative instruments that are designated and qualify as fair value hedges, the gain or loss on the derivative as well as the offsetting loss or gain on the hedged item attributable to the hedged risk are recognized in the Consolidated Statements of
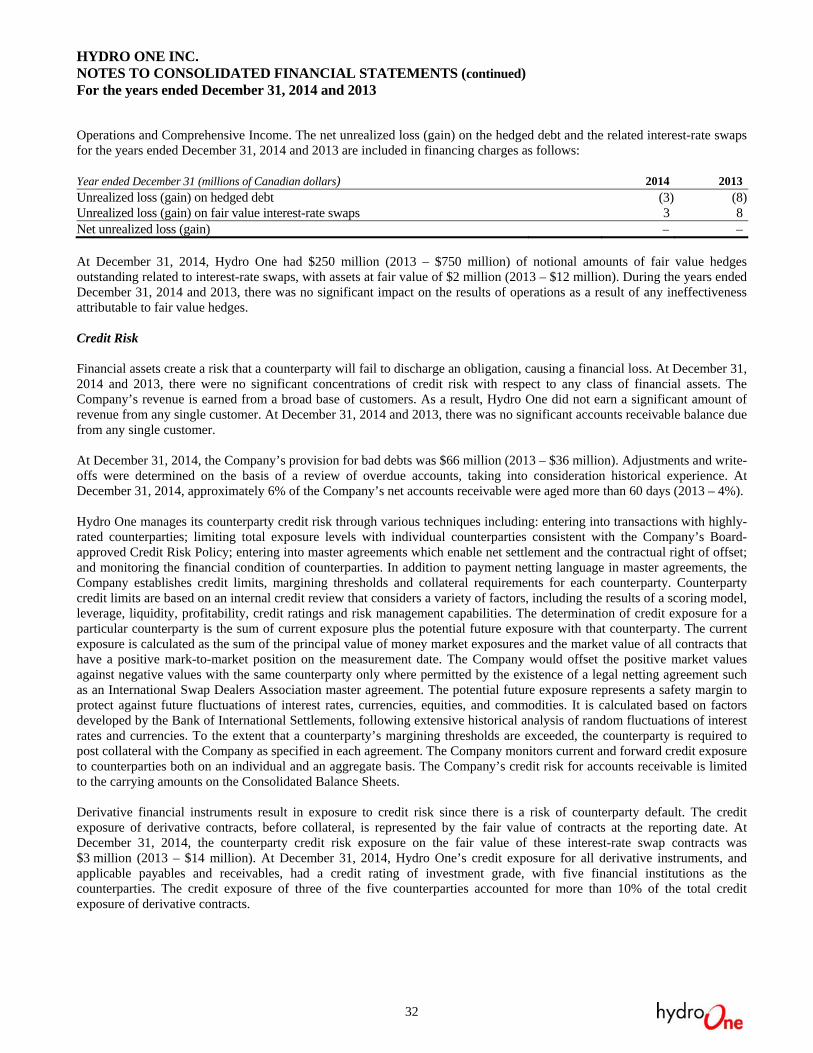
HYDRO ONE INC. NOTES TO CONSOLIDATED FINANCIAL STATEMENTS (continued) For the years ended December 31, 2014 and 2013
32
Operations and Comprehensive Income. The net unrealized loss (gain) on the hedged debt and the related interest-rate swaps for the years ended December 31, 2014 and 2013 are included in financing charges as follows: Year ended December 31 (millions of Canadian dollars) 2014 2013
Unrealized loss (gain) on hedged debt (3) (8)Unrealized loss (gain) on fair value interest-rate swaps 3 8Net unrealized loss (gain) – – At December 31, 2014, Hydro One had $250 million (2013 – $750 million) of notional amounts of fair value hedges outstanding related to interest-rate swaps, with assets at fair value of $2 million (2013 – $12 million). During the years ended December 31, 2014 and 2013, there was no significant impact on the results of operations as a result of any ineffectiveness attributable to fair value hedges. Credit Risk Financial assets create a risk that a counterparty will fail to discharge an obligation, causing a financial loss. At December 31, 2014 and 2013, there were no significant concentrations of credit risk with respect to any class of financial assets. The Company’s revenue is earned from a broad base of customers. As a result, Hydro One did not earn a significant amount of revenue from any single customer. At December 31, 2014 and 2013, there was no significant accounts receivable balance due from any single customer. At December 31, 2014, the Company’s provision for bad debts was $66 million (2013 – $36 million). Adjustments and write-offs were determined on the basis of a review of overdue accounts, taking into consideration historical experience. At December 31, 2014, approximately 6% of the Company’s net accounts receivable were aged more than 60 days (2013 – 4%). Hydro One manages its counterparty credit risk through various techniques including: entering into transactions with highly-rated counterparties; limiting total exposure levels with individual counterparties consistent with the Company’s Board-approved Credit Risk Policy; entering into master agreements which enable net settlement and the contractual right of offset; and monitoring the financial condition of counterparties. In addition to payment netting language in master agreements, the Company establishes credit limits, margining thresholds and collateral requirements for each counterparty. Counterparty credit limits are based on an internal credit review that considers a variety of factors, including the results of a scoring model, leverage, liquidity, profitability, credit ratings and risk management capabilities. The determination of credit exposure for a particular counterparty is the sum of current exposure plus the potential future exposure with that counterparty. The current exposure is calculated as the sum of the principal value of money market exposures and the market value of all contracts that have a positive mark-to-market position on the measurement date. The Company would offset the positive market values against negative values with the same counterparty only where permitted by the existence of a legal netting agreement such as an International Swap Dealers Association master agreement. The potential future exposure represents a safety margin to protect against future fluctuations of interest rates, currencies, equities, and commodities. It is calculated based on factors developed by the Bank of International Settlements, following extensive historical analysis of random fluctuations of interest rates and currencies. To the extent that a counterparty’s margining thresholds are exceeded, the counterparty is required to post collateral with the Company as specified in each agreement. The Company monitors current and forward credit exposure to counterparties both on an individual and an aggregate basis. The Company’s credit risk for accounts receivable is limited to the carrying amounts on the Consolidated Balance Sheets. Derivative financial instruments result in exposure to credit risk since there is a risk of counterparty default. The credit exposure of derivative contracts, before collateral, is represented by the fair value of contracts at the reporting date. At December 31, 2014, the counterparty credit risk exposure on the fair value of these interest-rate swap contracts was $3 million (2013 – $14 million). At December 31, 2014, Hydro One’s credit exposure for all derivative instruments, and applicable payables and receivables, had a credit rating of investment grade, with five financial institutions as the counterparties. The credit exposure of three of the five counterparties accounted for more than 10% of the total credit exposure of derivative contracts.
HYDRO ONE INC. NOTES TO CONSOLIDATED FINANCIAL STATEMENTS (continued) For the years ended December 31, 2014 and 2013
33
Liquidity Risk Liquidity risk refers to the Company’s ability to meet its financial obligations as they come due. Hydro One meets its short-term liquidity requirements using cash and cash equivalents on hand, funds from operations, the issuance of commercial paper, and the revolving standby credit facility of $1,500 million. The short-term liquidity under the Commercial Paper Program, and anticipated levels of funds from operations should be sufficient to fund normal operating requirements. At December 31, 2014, accounts payable and accrued liabilities in the amount of $784 million (2013 – $789 million) were expected to be settled in cash at their carrying amounts within the next 12 months. At December 31, 2014, Hydro One had issued long-term debt in the principal amount of $8,923 million (2013 – $9,045 million). Principal repayments, interest payments and related weighted average interest rates are summarized by the number of years to maturity in the following table:
Long-term Debt
Principal Repayments Interest Payments Weighted Average
Interest Rate
Years to Maturity (millions of Canadian dollars) (millions of Canadian dollars) (%)
1 year 550 419 2.82 years 500 393 4.33 years 600 381 5.24 years 750 350 2.85 years 228 327 1.6 2,628 1,870 3.56 – 10 years 900 1,522 3.6Over 10 years 5,395 4,373 5.4 8,923 7,765 4.7 14. CAPITAL MANAGEMENT The Company’s objectives with respect to its capital structure are to maintain effective access to capital on a long-term basis at reasonable rates, and to deliver appropriate financial returns. In order to ensure ongoing effective access to capital, the Company targets to maintain an “A” category long-term credit rating. The Company considers its capital structure to consist of Shareholder’s equity, preferred shares, long-term debt, and cash and cash equivalents. At December 31, 2014 and 2013, the Company’s capital structure was as follows: December 31 (millions of Canadian dollars) 2014 2013Long-term debt payable within one year 552 756Less: cash and cash equivalents 100 565 452 191 Long-term debt 8,373 8,301 Preferred shares 323 323 Common shares 3,314 3,314Retained earnings 4,249 3,787 7,563 7,101 Total capital 16,711 15,916 The Company has customary covenants typically associated with long-term debt. Among other things, Hydro One’s long-term debt and credit facility covenants limit the permissible debt to 75% of the Company’s total capitalization, limit the
HYDRO ONE INC. NOTES TO CONSOLIDATED FINANCIAL STATEMENTS (continued) For the years ended December 31, 2014 and 2013
34
ability to sell assets and impose a negative pledge provision, subject to customary exceptions. At December 31, 2014 and 2013, Hydro One was in compliance with all of these covenants and limitations. 15. PENSION AND POST-RETIREMENT AND POST-EMPLOYMENT BENEFITS Hydro One has a defined benefit pension plan, a supplementary pension plan, and post-retirement and post-employment benefit plans. The defined benefit pension plan (Pension Plan) is contributory and covers all regular employees of Hydro One and its subsidiaries, except employees of Hydro One Brampton Networks and Norfolk Power. Employees of Hydro One Brampton Networks and Norfolk Power participate in the OMERS plan. The supplementary pension plan provides members of the Pension Plan with benefits that would have been earned and payable under the Pension Plan but for the limitations imposed by the Income Tax Act (Canada). The supplementary pension plan obligation is included with other post-retirement and post-employment benefit obligations on the Consolidated Balance Sheets. The OMERS Plan Hydro One contributions to the OMERS plan for the year ended December 31, 2014 were $2 million (2013 – $2 million). Company contributions payable at December 31, 2014 and included in accrued liabilities on the Consolidated Balance Sheets were less than $1 million (2013 – less than $1 million). Hydro One contributions do not represent more than 5% of total contributions to the OMERS plan, as indicated in OMERS’ most recently available annual report for the year ended December 31, 2013. At December 31, 2013, the OMERS plan was 88.2% funded, with an unfunded liability of $8,641 million. This unfunded liability could result in future payments by participating employers and members. Hydro One future contributions could be increased substantially if other entities withdraw from the plan. Pension Plan, Post-Retirement and Post-Employment Plans The Pension Plan provides benefits based on highest three-year average pensionable earnings. For new management employees who commenced employment on or after January 1, 2004, and for new Society of Energy Professionals-represented staff hired after November 17, 2005, benefits are based on highest five-year average pensionable earnings. After retirement, pensions are indexed to inflation. Company and employee contributions to the Pension Plan are based on actuarial valuations performed at least every three years. Annual Pension Plan contributions for 2014 of $174 million (2013 – $160 million) were based on an actuarial valuation effective December 31, 2013 (2013 – effective December 31, 2011) and the expected level of pensionable earnings. Estimated annual Pension Plan contributions for 2015 and 2016 are approximately $174 million and $175 million, respectively, based on the actuarial valuation as at December 31, 2013 and projected levels of pensionable earnings. Future minimum contributions beyond 2016 will be based on an actuarial valuation effective no later than December 31, 2016. Contributions are payable one month in arrears. All of the contributions are expected to be in the form of cash. Hydro One recognizes the overfunded or underfunded status of the Pension Plan, and post-retirement and post-employment benefit plans (Plans) as an asset or liability on its Consolidated Balance Sheets, with offsetting regulatory assets and liabilities as appropriate. The underfunded benefit obligations for the Plans, in the absence of regulatory accounting, would be recognized in AOCI. The impact of changes in assumptions used to measure pension, post-retirement and post-employment benefit obligations is generally recognized over the expected average remaining service period of the employees. The measurement date for the Plans is December 31.

HYDRO ONE INC. NOTES TO CONSOLIDATED FINANCIAL STATEMENTS (continued) For the years ended December 31, 2014 and 2013
35
Pension Benefits
Post-Retirement and Post-Employment Benefits
Year ended December 31 (millions of Canadian dollars) 2014 2013 2014 2013
Change in projected benefit obligation Projected benefit obligation, beginning of year 6,576 6,507 1,531 1,459Current service cost 145 170 41 40Interest cost 312 278 73 63Reciprocal transfers – 1 – –Benefits paid (319) (317) (45) (44)Net actuarial loss (gain) 821 (63) (18) 13Projected benefit obligation, end of year 7,535 6,576 1,582 1,531 Change in plan assets Fair value of plan assets, beginning of year 5,731 4,992 – –Actual return on plan assets 703 887 – –Reciprocal transfers – 1 – –Benefits paid (319) (317) – –Employer contributions 174 160 – –Employee contributions 35 30 – –Administrative expenses (25) (22) – –Fair value of plan assets, end of year 6,299 5,731 – – Unfunded status 1,236 845 1,582 1,531 Hydro One presents its benefit obligations and plan assets net on its Consolidated Balance Sheets within the following line items:
Pension Benefits
Post-Retirement and Post-Employment Benefits
December 31 (millions of Canadian dollars) 2014 2013 2014 2013
Accrued liabilities – – 49 43Pension benefit liability 1,236 845 – –Post-retirement and post-employment benefit liability – – 1,533 1,488Unfunded status 1,236 845 1,582 1,531 The funded or unfunded status of the pension, post-retirement and post-employment benefit plans refers to the difference between the fair value of plan assets and the projected benefit obligations for the Plans. The funded/unfunded status changes over time due to several factors, including contribution levels, assumed discount rates and actual returns on plan assets. The following table provides the projected benefit obligation (PBO), accumulated benefit obligation (ABO) and fair value of plan assets for the Pension Plan: December 31 (millions of Canadian dollars) 2014 2013
PBO 7,535 6,576ABO 6,887 5,998Fair value of plan assets 6,299 5,731 On an ABO basis, the Pension Plan was funded at 91% at December 31, 2014 (2013 – 96%). On a PBO basis, the Pension Plan was funded at 84% at December 31, 2014 (2013 – 87%). The ABO differs from the PBO in that the ABO includes no assumption about future compensation levels.

HYDRO ONE INC. NOTES TO CONSOLIDATED FINANCIAL STATEMENTS (continued) For the years ended December 31, 2014 and 2013
36
Components of Net Periodic Benefit Costs The following table provides the components of the net periodic benefit costs for the years ended December 31, 2014 and 2013 for the Pension Plan: Year ended December 31 (millions of Canadian dollars) 2014 2013Current service cost, net of employee contributions 110 141Interest cost 312 278Expected return on plan assets, net of expenses (369) (309)Actuarial loss amortization 103 175Prior service cost amortization 2 2Net periodic benefit costs 158 287 Charged to results of operations1 81 721
The Company follows the cash basis of accounting consistent with the inclusion of pension costs in OEB-approved rates. During the year ended December 31, 2014, pension costs of $174 million (2013 – $160 million) were attributed to labour, of which $81 million (2013 – $72 million) was charged to operations, and $93 million (2013 – $88 million) was capitalized as part of the cost of property, plant and equipment and intangible assets.
The following table provides the components of the net periodic benefit costs for the years ended December 31, 2014 and 2013 for the post-retirement and post-employment benefit plans: Year ended December 31 (millions of Canadian dollars) 2014 2013
Current service cost, net of employee contributions 41 40Interest cost 73 63Actuarial loss amortization 18 27Prior service cost amortization 2 3Net periodic benefit costs 134 133 Charged to results of operations 62 58 Assumptions
The measurement of the obligations of the Plans and the costs of providing benefits under the Plans involves various factors, including the development of valuation assumptions and accounting policy elections. When developing the required assumptions, the Company considers historical information as well as future expectations. The measurement of benefit obligations and costs is impacted by several assumptions including the discount rate applied to benefit obligations, the long-term expected rate of return on plan assets, Hydro One’s expected level of contributions to the Plans, the incidence of mortality, the expected remaining service period of plan participants, the level of compensation and rate of compensation increases, employee age, length of service, and the anticipated rate of increase of health care costs, among other factors. The impact of changes in assumptions used to measure the obligations of the Plans is generally recognized over the expected average remaining service period of the plan participants. In selecting the expected rate of return on plan assets, Hydro One considers historical economic indicators that impact asset returns, as well as expectations regarding future long-term capital market performance, weighted by target asset class allocations. In general, equity securities, real estate and private equity investments are forecasted to have higher returns than fixed-income securities.
HYDRO ONE INC. NOTES TO CONSOLIDATED FINANCIAL STATEMENTS (continued) For the years ended December 31, 2014 and 2013
37
The following weighted average assumptions were used to determine the benefit obligations at December 31, 2014 and 2013:
Pension Benefits
Post-Retirement and Post-Employment Benefits
Year ended December 31 2014 2013 2014 2013
Significant assumptions: Weighted average discount rate 4.00% 4.75% 4.00% 4.75% Rate of compensation scale escalation (without merit) 2.50% 2.50% 2.50% 2.50% Rate of cost of living increase 2.00% 2.00% 2.00% 2.00% Rate of increase in health care cost trends1 – – 4.36% 4.39%1
6.52% per annum in 2015, grading down to 4.36% per annum in and after 2031 (2013 – 6.81% in 2014, grading down to 4.39% per annum in and after 2031)
The following weighted average assumptions were used to determine the net periodic benefit costs for the years ended December 31, 2014 and 2013. Assumptions used to determine current year-end benefit obligations are the assumptions used to estimate the subsequent year’s net periodic benefit costs. Year ended December 31 2014 2013
Pension Benefits: Weighted average expected rate of return on plan assets 6.50% 6.25% Weighted average discount rate 4.75% 4.25% Rate of compensation scale escalation (without merit) 2.50% 2.50% Rate of cost of living increase 2.00% 2.00% Average remaining service life of employees (years) 11 11 Post-Retirement and Post-Employment Benefits: Weighted average discount rate 4.75% 4.25% Rate of compensation scale escalation (without merit) 2.50% 2.50% Rate of cost of living increase 2.00% 2.00% Average remaining service life of employees (years) 12 12 Rate of increase in health care cost trends1 4.39% 4.39%1 6.81% per annum in 2014, grading down to 4.39% per annum in and after 2031 (2013 – 6.91% in 2013, grading down to 4.39% per annum in and after 2031)
The discount rate used to determine the current year pension obligation and the subsequent year’s net periodic benefit costs is based on a yield curve approach. Under the yield curve approach, expected future benefit payments for each plan are discounted by a rate on a third party bond yield curve corresponding to each duration. The yield curve is based on “AA” long-term corporate bonds. A single discount rate is calculated that would yield the same present value as the sum of the discounted cash flows. The effect of a 1% change in health care cost trends on the projected benefit obligation for the post-retirement and post-employment benefits at December 31, 2014 and 2013 is as follows: December 31 (millions of Canadian dollars) 2014 2013
Projected benefit obligation: Effect of a 1% increase in health care cost trends 248 258 Effect of a 1% decrease in health care cost trends (193) (200)
HYDRO ONE INC. NOTES TO CONSOLIDATED FINANCIAL STATEMENTS (continued) For the years ended December 31, 2014 and 2013
38
The effect of a 1% change in health care cost trends on the service cost and interest cost for the post-retirement and post-employment benefits for the years ended December 31, 2014 and 2013 is as follows: Year ended December 31 (millions of Canadian dollars) 2014 2013
Service cost and interest cost: Effect of a 1% increase in health care cost trends 23 21 Effect of a 1% decrease in health care cost trends (17) (16) The following approximate life expectancies were used in the mortality assumptions to determine the projected benefit obligations for the pension and post-retirement and post-employment plans at December 31, 2014 and 2013:
December 31, 2014 December 31, 2013
Life expectancy at 65 for a member currently at Life expectancy at 65 for a member currently at
Age 65 Age 45 Age 65 Age 45 Male Female Male Female Male Female Male Female 23 25 24 26 23 25 24 26
Estimated Future Benefit Payments At December 31, 2014, estimated future benefit payments to the participants of the Plans were: (millions of Canadian dollars)
Pension Benefits
Post-Retirement and Post-Employment Benefits
2015 305 502016 316 522017 328 542018 339 562019 350 592020 through to 2024 1,889 332Total estimated future benefit payments through to 2024 3,527 603 Components of Regulatory Assets A portion of actuarial gains and losses and prior service costs is recorded within regulatory assets on Hydro One’s Consolidated Balance Sheets to reflect the expected regulatory inclusion of these amounts in future rates, which would otherwise be recorded in OCI. The following table provides the actuarial gains and losses and prior service costs recorded within regulatory assets: Year ended December 31 (millions of Canadian dollars) 2014 2013
Pension Benefits: Actuarial loss (gain) for the year 511 (619) Actuarial loss amortization (103) (175) Prior service cost amortization (2) (2) 406 (796) Post-Retirement and Post-Employment Benefits: Actuarial loss (gain) for the year (18) 13 Actuarial loss amortization (18) (27) Prior service cost amortization (2) (3) (38) (17)
HYDRO ONE INC. NOTES TO CONSOLIDATED FINANCIAL STATEMENTS (continued) For the years ended December 31, 2014 and 2013
39
The following table provides the components of regulatory assets that have not been recognized as components of net periodic benefit costs for the years ended December 31, 2014 and 2013: Year ended December 31 (millions of Canadian dollars) 2014 2013
Pension Benefits: Prior service cost 2 3 Actuarial loss 1,234 842 1,236 845 Post-Retirement and Post-Employment Benefits: Prior service cost – 2 Actuarial loss 273 306 273 308 The following table provides the components of regulatory assets at December 31 that are expected to be amortized as components of net periodic benefit costs in the following year:
Pension Benefits
Post-Retirement and Post-Employment Benefits
December 31 (millions of Canadian dollars) 2014 2013 2014 2013
Prior service cost 2 2 – 2 Actuarial loss 119 103 10 15 121 105 10 17 Pension Plan Assets Investment Strategy On a regular basis, Hydro One evaluates its investment strategy to ensure that Pension Plan assets will be sufficient to pay Pension Plan benefits when due. As part of this ongoing evaluation, Hydro One may make changes to its targeted asset allocation and investment strategy. The Pension Plan is managed at a net asset level. The main objective of the Pension Plan is to sustain a certain level of net assets in order to meet the pension obligations of the Company. The Pension Plan fulfills its primary objective by adhering to specific investment policies outlined in its Summary of Investment Policies and Procedures (SIPP), which is reviewed and approved by the Audit, Finance and Pension Investment Committee of Hydro One’s Board of Directors. The Company manages net assets by engaging knowledgeable external investment managers who are charged with the responsibility of investing existing funds and new funds (current year’s employee and employer contributions) in accordance with the approved SIPP. The performance of the managers is monitored through a governance structure. Increases in net assets are a direct result of investment income generated by investments held by the Pension Plan and contributions to the Pension Plan by eligible employees and by the Company. The main use of net assets is for benefit payments to eligible Pension Plan members. Pension Plan Asset Mix At December 31, 2014, the Pension Plan target asset allocations and weighted average asset allocations were as follows: Target Allocation (%) Pension Plan Assets (%)
Equity securities 60.0 60.9Debt securities 35.0 35.9Other1 5.0 3.2 100.0 100.01 Other investments include real estate and infrastructure investments.
At December 31, 2014, the Pension Plan held no Hydro One corporate bonds (2013 – $15 million) and $340 million of debt securities of the Province (2013 – $217 million).
HYDRO ONE INC. NOTES TO CONSOLIDATED FINANCIAL STATEMENTS (continued) For the years ended December 31, 2014 and 2013
40
Concentrations of Credit Risk Hydro One evaluated its Pension Plan’s asset portfolio for the existence of significant concentrations of credit risk as at December 31, 2014 and 2013. Concentrations that were evaluated include, but are not limited to, investment concentrations in a single entity, concentrations in a type of industry, and concentrations in individual funds. At December 31, 2014 and 2013, there were no significant concentrations (defined as greater than 10% of plan assets) of risk in the Pension Plan’s assets. The Pension Plan manages its counterparty credit risk with respect to bonds by investing in investment-grade and government bonds and with respect to derivative instruments by transacting only with financial institutions rated at least “A+” by Standard and Poor’s Rating Services Inc., DBRS Limited, and Fitch Ratings Inc., and “A1” by Moody’s Investors Service Inc., and also by utilizing exposure limits to each counterparty and ensuring that exposure is diversified across counterparties. The risk of default on transactions in listed securities is considered minimal, as the trade will fail if either party to the transaction does not meet its obligation. Fair Value Measurements The following tables present the Pension Plan assets measured and recorded at fair value on a recurring basis and their level within the fair value hierarchy at December 31, 2014 and 2013: December 31, 2014 (millions of Canadian dollars) Level 1 Level 2 Level 3 Total
Pooled funds – 18 142 160Cash and cash equivalents 166 – – 166Short-term securities – 176 – 176Real estate – – 2 2Corporate shares – Canadian 1,008 – – 1,008Corporate shares – Foreign 2,766 – – 2,766Bonds and debentures – Canadian – 1,799 – 1,799Bonds and debentures – Foreign – 211 – 211Total fair value of plan assets1 3,940 2,204 144 6,2881 At December 31, 2014, the total fair value of Pension Plan assets excludes $18 million of interest and dividends receivable, and $7 million relating to accruals for pension administration expense.
December 31, 2013 (millions of Canadian dollars) Level 1 Level 2 Level 3 Total
Pooled funds 1 16 117 134Cash and cash equivalents 150 – – 150Short-term securities – 180 – 180Real estate – – 2 2Corporate shares – Canadian 943 – – 943Corporate shares – Foreign 2,708 – – 2,708Bonds and debentures – Canadian – 1,416 – 1,416Bonds and debentures – Foreign – 186 – 186Total fair value of plan assets1 3,802 1,798 119 5,7191 At December 31, 2013, the total fair value of Pension Plan assets excludes $19 million of interest and dividends receivable, and $7 million relating to accruals for pension administration expense.
See Note 13 – Fair Value of Financial Instruments and Risk Management for a description of levels within the fair value hierarchy. Changes in the Fair Value of Financial Instruments Classified in Level 3 The following table summarizes the changes in fair value of financial instruments classified in Level 3 for the years ended December 31, 2014 and 2013. The Pension Plan classifies financial instruments as Level 3 when the fair value is measured based on at least one significant input that is not observable in the markets or due to lack of liquidity in certain markets. The

HYDRO ONE INC. NOTES TO CONSOLIDATED FINANCIAL STATEMENTS (continued) For the years ended December 31, 2014 and 2013
41
gains and losses presented in the table below may include changes in fair value based on both observable and unobservable inputs. Year ended December 31 (millions of Canadian dollars) 2014 2013
Fair value, beginning of year 119 106Realized and unrealized gains 30 23Purchases 23 –Sales and disbursements (28) (10)Fair value, end of year 144 119 There were no significant transfers between any of the fair value levels during the years ended December 31, 2014 and 2013. The Company performs sensitivity analysis for fair value measurements classified in Level 3, substituting the unobservable inputs with one or more reasonably possible alternative assumptions. These sensitivity analyses resulted in negligible changes in the fair value of financial instruments classified in this level. Valuation Techniques Used to Determine Fair Value Pooled Funds The pooled fund category mainly consists of private equity and infrastructure investments. Private equity investments represent private equity funds that invest in operating companies that are not publicly traded on a stock exchange. Investment strategies in private equity include limited partnerships in businesses that are characterized by high internal growth and operational efficiencies, venture capital, leveraged buyouts and special situations such as distressed investments. Infrastructure investments represent infrastructure funds that invest in real assets which are not publicly traded on a stock exchange. Investment strategies in infrastructure include limited partnerships in core infrastructure assets focusing on assets that generate stable, long-term cash flows and deliver incremental returns relative to conventional fixed-income investments. Private equity and infrastructure valuations are reported by the fund manager and are based on the valuation of the underlying investments which includes inputs such as cost, operating results, discounted future cash flows and market-based comparable data. Since these valuation inputs are not highly observable, private equity and infrastructure investments have been categorized as Level 3 within pooled funds. Cash Equivalents Demand cash deposits held with banks and cash held by the investment managers are considered cash equivalents and are included in the fair value measurements hierarchy as Level 1. Short-Term Securities Short-term securities are valued at cost plus accrued interest, which approximates fair value due to their short-term nature. Short-term securities have been categorized as Level 2. Real Estate Real estate investments represent private equity investments in holding companies that invest in real estate properties. The investments in the holding companies are valued using net asset values reported by the fund manager. Real estate investments are categorized as Level 3. Corporate Shares Corporate shares are valued based on quoted prices in active markets and are categorized as Level 1. Investments denominated in foreign currencies are translated into Canadian currency at year-end rates of exchange.
HYDRO ONE INC. NOTES TO CONSOLIDATED FINANCIAL STATEMENTS (continued) For the years ended December 31, 2014 and 2013
42
Bonds and Debentures Bonds and debentures are presented at published closing trade quotations, and are categorized as Level 2. 16. ENVIRONMENTAL LIABILITIES
The following tables show the movements in environmental liabilities for the years ended December 31, 2014 and 2013: Year ended December 31, 2014 (millions of Canadian dollars) PCB LAR Total
Environmental liabilities, January 1 201 65 266Interest accretion 9 2 11Expenditures (5) (13) (18)Revaluation adjustment (33) 13 (20)Environmental liabilities, December 31 172 67 239Less: current portion 8 10 18 164 57 221 Year ended December 31, 2013 (millions of Canadian dollars) PCB LAR TotalEnvironmental liabilities, January 1 197 52 249Interest accretion 9 1 10Expenditures (2) (14) (16)Revaluation adjustment (3) 26 23Environmental liabilities, December 31 201 65 266Less: current portion 15 12 27 186 53 239 The following tables show the reconciliation between the undiscounted basis of the environmental liabilities and the amount recognized on the Consolidated Balance Sheets after factoring in the discount rate: December 31, 2014 (millions of Canadian dollars) PCB LAR Total
Undiscounted environmental liabilities 195 70 265Less: discounting accumulated liabilities to present value 23 3 26Discounted environmental liabilities 172 67 239 December 31, 2013 (millions of Canadian dollars) PCB LAR Total
Undiscounted environmental liabilities 237 68 305Less: discounting accumulated liabilities to present value 36 3 39Discounted environmental liabilities 201 65 266 At December 31, 2014, the estimated future environmental expenditures were as follows: (millions of Canadian dollars) 2015 182016 372017 362018 352019 33Thereafter 106 265
At December 31, 2014, of the total estimated future environmental expenditures, $195 million relates to PCBs (2013 – $237 million) and $70 million relates to LAR (2013 – $68 million).
HYDRO ONE INC. NOTES TO CONSOLIDATED FINANCIAL STATEMENTS (continued) For the years ended December 31, 2014 and 2013
43
Hydro One records a liability for the estimated future expenditures for the contaminated LAR and for the phase-out and destruction of PCB-contaminated mineral oil removed from electrical equipment when it is determined that future environmental remediation expenditures are probable under existing statute or regulation and the amount of the future expenditures can be reasonably estimated. There are uncertainties in estimating future environmental costs due to potential external events such as changes in legislation or regulations, and advances in remediation technologies. In determining the amounts to be recorded as environmental liabilities, the Company estimates the current cost of completing required work and makes assumptions as to when the future expenditures will actually be incurred, in order to generate future cash flow information. A long-term inflation rate assumption of approximately 2% has been used to express these current cost estimates as estimated future expenditures. Future expenditures have been discounted using factors ranging from approximately 2.3% to 6.3%, depending on the appropriate rate for the period when expenditures are expected to be incurred. All factors used in estimating the Company’s environmental liabilities represent management’s best estimates of the present value of costs required to meet existing legislation or regulations. However, it is reasonably possible that numbers or volumes of contaminated assets, cost estimates to perform work, inflation assumptions and the assumed pattern of annual cash flows may differ significantly from the Company’s current assumptions. In addition, with respect to the PCB environmental liability, the availability of critical resources such as skilled labour and replacement assets and the ability to take maintenance outages in critical facilities may influence the timing of expenditures. PCBs The Environment Canada regulations, enacted under the Canadian Environmental Protection Act, 1999, govern the management, storage and disposal of PCBs based on certain criteria, including type of equipment, in-use status, and PCB-contamination thresholds. Under current regulations, Hydro One’s PCBs have to be disposed of by the end of 2025, with the exception of specifically exempted equipment. Contaminated equipment will generally be replaced, or will be decontaminated by removing PCB-contaminated insulating oil and retro filling with replacement oil that contains PCBs in concentrations of less than 2 ppm. The Company’s best estimate of the total estimated future expenditures to comply with current PCB regulations is $195 million. These expenditures are expected to be incurred over the period from 2015 to 2025. As a result of its annual review of environmental liabilities, the Company recorded a revaluation adjustment in 2014 to reduce the PCB environmental liability by $33 million (2013 – $3 million). LAR The Company’s best estimate of the total estimated future expenditures to complete its LAR program is $70 million. These expenditures are expected to be incurred over the period from 2015 to 2023. As a result of its annual review of environmental liabilities, the Company recorded a revaluation adjustment in 2014 to increase the LAR environmental liability by $13 million (2013 – $26 million). 17. ASSET RETIREMENT OBLIGATIONS Hydro One records a liability for the estimated future expenditures for the removal and disposal of asbestos-containing materials installed in some of its facilities and for the decommissioning of specific switching stations located on unowned sites. AROs, which represent legal obligations associated with the retirement of certain tangible long-lived assets, are computed as the present value of the projected expenditures for the future retirement of specific assets and are recognized in the period in which the liability is incurred, if a reasonable estimate of fair value can be made. If the asset remains in service at the recognition date, the present value of the liability is added to the carrying amount of the associated asset in the period the liability is incurred and this additional carrying amount is depreciated over the remaining life of the asset. If an ARO is recorded in respect of an out-of-service asset, the asset retirement cost is charged to results of operations. Subsequent to the initial recognition, the liability is adjusted for any revisions to the estimated future cash flows associated with the ARO, which can occur due to a number of factors including, but not limited to, cost escalation, changes in technology applicable to the assets to be retired, changes in legislation or regulations, as well as for accretion of the liability due to the passage of time

HYDRO ONE INC. NOTES TO CONSOLIDATED FINANCIAL STATEMENTS (continued) For the years ended December 31, 2014 and 2013
44
until the obligation is settled. Depreciation expense is adjusted prospectively for any increases or decreases to the carrying amount of the associated asset. In determining the amounts to be recorded as AROs, the Company estimates the current fair value for completing required work and makes assumptions as to when the future expenditures will actually be incurred, in order to generate future cash flow information. A long-term inflation assumption of approximately 2% has been used to express these current cost estimates as estimated future expenditures. Future expenditures have been discounted using factors ranging from approximately 3.0% to 5.0%, depending on the appropriate rate for the period when expenditures are expected to be incurred. All factors used in estimating the Company’s AROs represent management’s best estimates of the cost required to meet existing legislation or regulations. However, it is reasonably possible that numbers or volumes of contaminated assets, cost estimates to perform work, inflation assumptions and the assumed pattern of annual cash flows may differ significantly from the Company’s current assumptions. AROs are reviewed annually or more frequently if significant changes in regulations or other relevant factors occur. Estimate changes are accounted for prospectively. At December 31, 2014, Hydro One had recorded AROs of $9 million (2013 – $14 million), consisting of $8 million (2013 – $7 million) related to the estimated future expenditures associated with the removal and disposal of asbestos-containing materials installed in some of its facilities, as well as $1 million (2013 – $7 million) related to the future decommissioning and removal of two switching stations. The amount of interest recorded is nominal. 18. SHARE CAPITAL Preferred Shares The Company has 12,920,000 issued and outstanding 5.5% cumulative preferred shares with a redemption value of $25 per share or $323 million total value. The Company is authorized to issue an unlimited number of preferred shares. The Company’s preferred shares are entitled to an annual cumulative dividend of $18 million, or $1.375 per share, which is payable on a quarterly basis. The preferred shares are not subject to mandatory redemption (except on liquidation) but are redeemable in certain circumstances. The shares are redeemable at the option of the Province at the redemption value, plus any accrued and unpaid dividends, if the Province sells a number of the common shares which it owns to the public such that the Province’s holdings are reduced to less than 50% of the common shares of the Company. Hydro One may elect, without condition, to pay all or part of the redemption price by issuing additional common shares to the Province. If the Province does not exercise its redemption right, the Company would have the ability to adjust the dividend on the preferred shares to produce a yield that is 0.50% less than the then-current dividend market yield for similarly rated preferred shares. The preferred shares do not carry voting rights, except in limited circumstances, and would rank in priority over the common shares upon liquidation. These preferred shares have conditions for their redemption that are outside the control of the Company because the Province can exercise its right to redeem in the event of change in ownership without approval of the Company’s Board of Directors. Because the conditional redemption feature is outside the control of the Company, the preferred shares are classified outside of equity on the Consolidated Balance Sheets. Management believes that it is not probable that the preferred shares will become redeemable. No adjustment to the carrying value of the preferred shares has been recognized at December 31, 2014. If it becomes probable in the future that the preferred shares will be redeemed, the redemption value would be adjusted. Common Shares The Company has 100,000 issued and outstanding common shares. The Company is authorized to issue an unlimited number of common shares. Common share dividends are declared at the sole discretion of the Hydro One Board of Directors, and are recommended by management based on results of operations, maintenance of the deemed regulatory capital structure, financial conditions, cash requirements, and other relevant factors, such as industry practice and Shareholder expectations.

HYDRO ONE INC. NOTES TO CONSOLIDATED FINANCIAL STATEMENTS (continued) For the years ended December 31, 2014 and 2013
45
Earnings per Share Basic and diluted earnings per share have been calculated on the basis of net income attributable to the Shareholder of Hydro One and the weighted average number of common shares outstanding during the year. 19. DIVIDENDS In 2014, preferred share dividends in the amount of $18 million (2013 – $18 million) and common share dividends in the amount of $269 million (2013 – $200 million) were declared. 20. RELATED PARTY TRANSACTIONS Hydro One is owned by the Province. The OEFC, IESO, OPA, Ontario Power Generation Inc. (OPG) and the OEB are related parties to Hydro One because they are controlled or significantly influenced by the Province. The Province During 2014, Hydro One paid dividends to the Province totalling $287 million (2013 – $218 million). In November 2014, the Company redeemed the $250 million Province of Ontario Floating-Rate Notes held as a long-term investment. These notes were originally purchased in January 2010 with a maturity date of November 19, 2014. IESO In 2014, Hydro One purchased power in the amount of $2,601 million (2013 – $2,477 million) from the IESO-administered electricity market. Hydro One receives revenues for transmission services from the IESO, based on OEB-approved uniform transmission rates. Transmission revenues for 2014 include $1,556 million (2013 – $1,509 million) related to these services. Hydro One receives amounts for rural rate protection from the IESO. Distribution revenues for 2014 include $127 million (2013 – $127 million) related to this program. Hydro One also receives revenues related to the supply of electricity to remote northern communities from the IESO. Distribution revenues for 2014 include $32 million (2013 – $33 million) related to these services. OPA The OPA funds substantially all of the Company’s conservation and demand management programs. The funding includes program costs, incentives, and management fees. In 2014, Hydro One received $33 million (2013 – $34 million) from the OPA related to these programs. OPG In 2014, Hydro One purchased power in the amount of $23 million (2013 – $15 million) from OPG. Hydro One has service level agreements with OPG. These services include field, engineering, logistics and telecommunications services. In 2014, revenues related to the provision of construction and equipment maintenance services with respect to these service level agreements were $12 million (2013 – $9 million), primarily for the Transmission Business. Operation, maintenance and administration costs in 2014 related to the purchase of services with respect to these service level agreements were $1 million (2013 – $1 million).
HYDRO ONE INC. NOTES TO CONSOLIDATED FINANCIAL STATEMENTS (continued) For the years ended December 31, 2014 and 2013
46
OEFC In 2014, Hydro One made payments in lieu of corporate income taxes to the OEFC totalling $86 million (2013 – $138 million). In 2014, Hydro One purchased power in the amount of $9 million (2013 – $8 million) from power contracts administered by the OEFC. Hydro One pays a $5 million annual fee to the OEFC for indemnification against adverse claims in excess of $10 million paid by the OEFC with respect to certain of Ontario Hydro’s businesses transferred to Hydro One on April 1, 1999. PILs and payments in lieu of property taxes are paid to the OEFC. OEB Under the Ontario Energy Board Act, 1998, the OEB is required to recover all of its annual operating costs from gas and electricity distributors and transmitters. In 2014, Hydro One incurred $12 million (2013 – $12 million) in OEB fees. Sales to and purchases from related parties occur at normal market prices or at a proxy for fair value based on the requirements of the OEB’s Affiliate Relationships Code. Outstanding balances at period end are interest free and settled in cash. The amounts due to and from related parties as a result of the transactions referred to above are as follows: December 31 (millions of Canadian dollars) 2014 2013
Due from related parties 224 197Due to related parties1 (227) (230)Investment – 2511 Included in due to related parties at December 31, 2014 are amounts owing to the IESO in respect of power purchases of $214 million (2013 – $217 million).
21. CONSOLIDATED STATEMENTS OF CASH FLOWS The changes in non-cash balances related to operations consist of the following: Year ended December 31 (millions of Canadian dollars) 2014 2013Accounts receivable (93) (78)Due from related parties (27) (43)Prepaid expenses and other assets (13) (5)Accounts payable 39 13Accrued liabilities (35) 71Due to related parties (3) (31)Accrued interest – 5Long-term accounts payable and other liabilities (3) (5)Post-retirement and post-employment benefit liability 80 84 (55) 11
HYDRO ONE INC. NOTES TO CONSOLIDATED FINANCIAL STATEMENTS (continued) For the years ended December 31, 2014 and 2013
47
Capital Expenditures The following table illustrates the reconciliation between investments in property, plant and equipment and the amount presented in the Consolidated Statements of Cash Flows after factoring in capitalized depreciation and the net change in related accruals: Year ended December 31 (millions of Canadian dollars) 2014 2013
Capital investments in property, plant and equipment (1,511) (1,312)Capitalized depreciation and net change in accruals included in capital investments in property, plant and equipment 30 4Capital expenditures – property, plant and equipment (1,481) (1,308) The following table illustrates the reconciliation between investments in intangible assets and the amount presented in the Consolidated Statements of Cash Flows after factoring in the net change in related accruals: Year ended December 31 (millions of Canadian dollars) 2014 2013
Capital investments in intangible assets (19) (82)Net change in accruals included in capital investments in intangible assets (4) 3Capital expenditures – intangible assets (23) (79) Supplementary Information Year ended December 31 (millions of Canadian dollars) 2014 2013
Net interest paid 412 395PILs 86 138 22. CONTINGENCIES Legal Proceedings Hydro One is involved in various lawsuits, claims and regulatory proceedings in the normal course of business. In the opinion of management, the outcome of such matters will not have a material adverse effect on the Company’s consolidated financial position, results of operations or cash flows. Transfer of Assets The transfer orders by which the Company acquired certain of Ontario Hydro’s businesses as of April 1, 1999 did not transfer title to some assets located on Reserves (as defined in the Indian Act (Canada)). Currently, the OEFC holds these assets. Under the terms of the transfer orders, the Company is required to manage these assets until it has obtained all consents necessary to complete the transfer of title of these assets to itself. The Company cannot predict the aggregate amount that it may have to pay, either on an annual or one-time basis, to obtain the required consents. In 2014, the Company paid approximately $1 million (2013 – $2 million) in respect of these consents. If the Company cannot obtain the required consents, the OEFC will continue to hold these assets for an indefinite period of time. If the Company cannot reach a satisfactory settlement, it may have to relocate these assets to other locations at a cost that could be substantial or, in a limited number of cases, to abandon a line and replace it with diesel-generation facilities. The costs relating to these assets could have a material adverse effect on the Company’s results of operations if the Company is not able to recover them in future rate orders.
HYDRO ONE INC. NOTES TO CONSOLIDATED FINANCIAL STATEMENTS (continued) For the years ended December 31, 2014 and 2013
48
23. COMMITMENTS Outsourcing Agreements The current agreement with Inergi LP (Inergi), an affiliate of Capgemini Canada Inc., expires on February 28, 2015. On November 28, 2014, Hydro One entered into an agreement with Inergi (Inergi Agreement), the service provider selected through a competitive procurement process which began in 2013, for second-generation back office and IT outsourcing services for a term of 58 months, commencing March 1, 2015 to December 31, 2019. Under the agreement, Inergi will provide Hydro One with settlements, source to pay services, pay operations services, information technology and finance and accounting services. Coincident with the conclusion of negotiations on the Inergi Agreement, Hydro One reached agreement with Inergi for the provision of second-generation customer service operations outsourcing services for a fixed period of three years beginning March 1, 2015 to February 28, 2018. In September 2014, Hydro One entered into an agreement with Brookfield Johnson Controls Canada LP (Brookfield) for facilities management services for a term of ten years, from January 1, 2015 to December 31, 2024, with the option to renew for an additional term of three years. Under the agreement, Brookfield will provide us with facilities management and execution of certain capital projects as deemed required by the Company. The Brookfield Agreement has a value of up to approximately $658 million over the ten-year term of the agreement, including the facilities management portion of the contract, plus a variable amount of capital work depending on the needs that may arise as determined by the Company, with no minimum capital work guarantee. The agreement also includes a fixed management fee of approximately $2 million for each year of the term. At December 31, 2014, the annual commitments under the outsourcing agreements were as follows: 2015 – $179 million; 2016 – $146 million; 2017 – $145 million; 2018 – $113 million; 2019 – $105 million; and thereafter – $13 million. Prudential Support Purchasers of electricity in Ontario, through the IESO, are required to provide security to mitigate the risk of their default based on their expected activity in the market. As at December 31, 2014, the Company provided prudential support to the IESO on behalf of its subsidiaries using parental guarantees of $330 million (2013 – $325 million), and on behalf of two distributors using guarantees of $1 million (2013 – $1 million). In addition, as at December 31, 2014, the Company has provided letters of credit in the amount of $8 million (2013 – $21 million) to the IESO. The IESO could draw on these guarantees and/or letters of credit if these subsidiaries or distributors fail to make a payment required by a default notice issued by the IESO. The maximum potential payment is the face value of any letters of credit plus the amount of the parental guarantees. Retirement Compensation Arrangements Bank letters of credit have been issued to provide security for the Company’s liability under the terms of a trust fund established pursuant to the supplementary pension plan for eligible employees of Hydro One. The supplementary pension plan trustee is required to draw upon these letters of credit if Hydro One is in default of its obligations under the terms of this plan. Such obligations include the requirement to provide the trustee with an annual actuarial report as well as letters of credit sufficient to secure the Company’s liability under the plan, to pay benefits payable under the plan and to pay the letter of credit fee. The maximum potential payment is the face value of the letters of credit. At December 31, 2014, Hydro One had letters of credit of $126 million (2013 – $127 million) outstanding relating to retirement compensation arrangements. Operating Leases Hydro One is committed as lessee to irrevocable operating lease contracts for buildings used in administrative and service-related functions and storing telecommunications equipment. These leases have a typical term of between three and five years, but several leases have lesser or greater terms to address special circumstances and/or opportunities. Renewal options, which are generally prevalent in most leases, have similar terms of three to five years. All leases include a clause to enable upward revision of the rental charge on an annual basis or on renewal according to prevailing market conditions or pre-established rents. There are no restrictions placed upon Hydro One by entering into these leases. Hydro One Networks and Hydro One Telecom are the principal entities concerned.
HYDRO ONE INC. NOTES TO CONSOLIDATED FINANCIAL STATEMENTS (continued) For the years ended December 31, 2014 and 2013
49
During the year ended December 31, 2014, the Company made lease payments totalling $11 million (2013 – $11 million). At December 31, 2014, the future minimum lease payments under non-cancellable operating leases were as follows: 2015 – $7 million; 2016 – $10 million; 2017 – $9 million; 2018 – $7 million; 2019 – $3 million; and thereafter – $9 million. 24. SEGMENTED REPORTING Hydro One has three reportable segments: The Transmission Business, which comprises the core business of providing electricity transportation and connection
services, is responsible for transmitting electricity throughout the Ontario electricity grid;
The Distribution Business, which comprises the core business of delivering and selling electricity to customers; and
Other, which includes certain corporate activities and the operations of the telecommunications business. The designation of segments has been based on a combination of regulatory status and the nature of the products and services provided. Operating segments of the Company are determined based on information used by the chief operating decision maker in deciding how to allocate resources and evaluate the performance of each of the segments. The Company evaluates segment performance based on income before financing charges and provision for PILs from continuing operations (excluding certain allocated corporate governance costs). The accounting policies followed by the segments are the same as those described in the summary of significant accounting policies (see Note 2 – Significant Accounting Policies). Segment information on the above basis is as follows: Year ended December 31, 2014 (millions of Canadian dollars) Transmission Distribution Other Consolidated
Revenues 1,588 4,903 57 6,548Purchased power – 3,419 – 3,419Operation, maintenance and administration 394 742 56 1,192Depreciation and amortization 346 367 9 722Income (loss) before financing charges and provision for PILs 848 375 (8) 1,215 Capital investments 845 680 5 1,530 Year ended December 31, 2013 (millions of Canadian dollars) Transmission Distribution Other Consolidated
Revenues 1,529 4,484 61 6,074Purchased power – 3,020 – 3,020Operation, maintenance and administration 375 672 59 1,106Depreciation and amortization 327 340 9 676Income (loss) before financing charges and provision for PILs 827 452 (7) 1,272 Capital investments 714 673 7 1,394 Total Assets by Segment: December 31 (millions of Canadian dollars) 2014 2013Transmission 12,540 11,846Distribution 9,805 8,805Other 205 974Total assets 22,550 21,625 All revenues, costs and assets, as the case may be, are earned, incurred or held in Canada.

HYDRO ONE INC. NOTES TO CONSOLIDATED FINANCIAL STATEMENTS (continued) For the years ended December 31, 2014 and 2013
50
25. SUBSEQUENT EVENT On February 11, 2015, preferred share dividends in the amount of $4 million and common share dividends in the amount of $25 million were declared.