hydrochemical facies and ionic ratios of groundwater … · hydrochemical facies and ionic ratios...
TRANSCRIPT

Res.J.Chem.Sci.______________________________________________Research Journal of Chemical Sciences
Vol. 1(3) June (2011) ISSN 2231-606X
87
Hydrochemical Facies and Ionic Ratios of Groundwater in Port Harcourt,
Southern Nigeria
Nwankwoala H.O. and Udom G.J. Department of Geology, University of Port Harcourt, NIGERIA
Available online at: www.isca.in
(Received 29th
April 2011, revised 12th
May 2011, accepted 27th
May 2011)
Abstract
A hydro geochemical facies and ionic ratios evaluation of groundwater in Port Harcourt City, Southern
Nigeria has been carried out. Groundwater samples were analysed for their physical, chemical and
microbiological properties. Besides of the major chemical compositions, ionic ratio (HCO3/Cl, Na/Ca,
Ca/Cl, Mg/Cl and Ca/SO4) was used to delineate saline water intrusion. The analytical results present
the abundance of the ions in the following order: Mg > Ca > Na > K = Cl > SO4 > HCO3 > NO3.
Chloride is the dominant anion found in the groundwater of the study area. Piper trilinear diagram for
the study area shows that there is a mixture of two types of water with variable concentrations of major
ions. These are Ca – Mg – Cl – SO4 type and Na + K – Cl – SO4 type water. The second water type is
also influenced by NO3. This means that groundwater in the area is mainly made up of mixtures of earth
alkaline and alkaline metals and predominantly Cl- - SO4
2-water type. The quality of groundwater and
the processes that control the concentration of major constituents is very necessary. Therefore, it is very
imperative that adequate hydro chemical knowledge be improved, in the study area, owing to the hydro
geological heterogeneity in order to evaluate the hydro chemical characteristics, determine the ionic
interactions as well as the hydro geochemical facies distribution in the area. Achieving these aims will
establish a basis for developing an appropriate monitoring programme and therefore improved
management of the groundwater resources of the area.
Key words: Hydro geochemical, groundwater, hydro geological, hydro chemical.
Introduction
Groundwater chemistry is largely a function of the
mineral composition of the aquifer through which it
flows. The hydro chemical processes and hydro
geochemistry of the groundwater vary spatially and
temporally, depending on the geology and chemical
characteristics of the aquifer. Hydro geochemical
processes such as dissolution, precipitation, ion-
exchange processes and the residence time along the
flow path control the chemical composition of
groundwater1, 2
.
In Port Harcourt (fig.1) studies on comprehensive
approaches to the understanding of groundwater that
involve chemical indicators and subsequent hydro
chemical evolution of groundwater by using
chemical data from the standpoint of environmental
geochemistry are relatively few. Previous studies
carried out in the area have tended to emphasize only
the general water supply problems3, 4
. The hydro
geochemistry of groundwaters in parts of the Niger
Delta was assessed5. The groundwater quality in the
area is rapidly deteriorating6,7,8
. Increase in
population and rapid urbanization has made
groundwater the major source of water supply,
hence, it is very essential to understand the hydro
geochemical processes that take place in the aquifer
system. This study attempts to evaluate the different
water types and hydro geochemistry of the main
source of water supply in the area as well as
determine the groundwater characteristics. The most
relevant controls on the water quality and ionic
processes which control the groundwater
composition of the aquifer systems in the area will
also be studied. This study also provides an

Res.J.Chem.Sci.______________________________________________Research Journal of Chemical Sciences
Vol. 1(3) June (2011) ISSN 2231-606X
88
opportunity to observe a detailed profile of the
dominant hydro geochemical facies distribution and
processes of groundwater, with a view to predicting
their water character.
In view of the aforementioned, it has become
necessary to study the quality of groundwater and
the processes that control the concentration of major
constituents in the area. Therefore, it is very
imperative that adequate hydro-geological, and
hydro chemical knowledge be improved, in order to
evaluate the hydro chemical characteristics,
determine the ionic interactions as well as the hydro
geochemical facies distribution in the area.
Achieving these aims will establish a basis for
developing an appropriate monitoring programme
and therefore improved management of the
groundwater resources of the area.
Material and Methods
The ground water samples were collected near the
well head of each of the sampled boreholes before
the water went through tanks/treatment units. One
(1) liter of water was collected from each borehole.
Prior to all sample collection, the wells were pumped
for about three to five minutes. This was to ensure
collection of representative samples. Samples were
collected in three (3) labeled, well drained plastic
containers tightly corked. The choice of plastic
containers is to minimize contamination that could
alter the water constituents. The first container was
250ml for microbial test. The second (1 litre
container) was acidified with two (2) drops of
concentrated Nitric acid (HNO3) for cations
determination in order to homogenize and prevent
absorption/adsorption of metals to the wall of the
plastic container. Acidification equally stops most
bacterial growth, inhibits oxidation reactions and
precipitation of cations. The third plastic container
(1 litre) was used for anion determination. These
samples were preserved in cool boxes to keep the
temperature below 20oC for eventual transfer to the
laboratory for analysis within stipulated period.
Before sample collection, the containers were
properly rinsed with the borehole water to be
sampled, filled to the brim, tightly covered to retain
the CO2 that was in the water when the sample was
taken and to avoid contamination, appropriately
labeled at the points of collection and transported to
the laboratory for further analyses. Sampling was
done only in good weather condition to avoid
rainwater contamination, as this would affect the
quality of the samples collected. A maximum of
three samples were collected per visit to avoid
possible deterioration, thus affecting the actual
groundwater chemistry. The static water table
(SWL) in each of the sampling locations as well as
the total depth penetrated by the boreholes was
equally recorded, where possible. A Global
Positioning System (GPS) unit, portable GARMIN
Etrex 76, was used for recording coordinates and
elevation readings. Because the chemistry of
groundwater is sensitive to environmental changes,
the following parameters were measured and
recorded in-situ: Colour, pH, Conductivity and
Temperature. Field activities were mainly carried out
during the raining season, between June and
September, 2009.
Chemical types and trends of groundwater:
Generally, the chemical composition of groundwater
is primarily dependent on the type of chemical
reaction as well as the geochemical processes taking
place within the groundwater system. The
hydrogeochemical characteristics of the major and
minor ions with a view to determining the
groundwater types and visualizing trends of
groundwater chemistry, the Piper trilinear diagrams
are used. The Piper trilinear diagram9 is applied to
show the relative concentrations of the major cations
and anions.
Analytical result presents the abundance of these
ions in the following order: Mg > Ca > Na > K =
Cl > SO4 > HCO3 > NO3. Chloride is the dominant
anion found in the groundwater of the study area. Its
concentration is generally higher than 12mg/l.
Sulphate is equally found in considerable amount
(9.70 – 230.11mg/l), with mean value of 68.76mg/l,
followed by Bicarbonate (3.003 – 58.040mg/l), with
mean value of 16.68mg/l. NO3 values ranges from

Res.J.Chem.Sci.______________________________________________Research Journal of Chemical Sciences
Vol. 1(3) June (2011) ISSN 2231-606X
89
0.010 – 34.000mg/l, with mean value of 3.24mg/l.
Magnesium dominates the cationic components of
the groundwater, with a mean value of 3.16mg/l,
followed by Calcium, with mean value of 3.02mg/l.
Next to Calcium is Sodium with mean value of
1.58mg/l and followed by Potassium with mean
value of 0.47mg/l.
Major ions constitute the most significant part of the
total dissolved solids present in the groundwater and
the concentration of these ions in groundwater
depends mainly on the hydro chemical processes that
place in the aquifer system 10
. Major ions in the
groundwater present a definite spatial trend. The
distributions of the ionic components of the
groundwater in the study area are shown in Figs. 2 –
10.
Hydro geochemical facies and classification: The
diagnostic chemical character of water solutions in
hydrologic systems has been determined with the
application of the concept of hydro chemical facies
11, which enables a convenient subdivision of water
compositions by identifiable categories and reflects
the effect of chemical processes occurring between
the minerals within the subsurface rock units and the
groundwater.
Statistical distribution diagrams such as Piper
trilinear 9
, is used to gain better insight into the hydro
chemical processes operating in the groundwater
system. The Piper trilinear diagram was used for the
purpose of characterizing the water types present in
the area. It permits the cation and anion
compositions of many samples to be represented on
a single graph in which major groupings or trends in
the data can be discerned visually 12
. Water types are
often used in the characterization of waters as a
diagnostic tool 13, 14
.
Piper trilinear diagram (fig.11) for the study area
shows that there is a mixture of two types of water
with variable concentrations of major ions. These are
Ca – Mg – Cl – SO4 type and Na + K – Cl – SO4
type water. The second water type is also influenced
by NO3. This means that groundwater in the area is
mainly made up of mixtures of earth alkaline and
alkaline metals and predominantly Cl-
- SO42-
water
type. Chloride is the dominant anion followed by
sulphate. Most of the water samples are made up of
mixtures of the two water types.
The chloride and sulphate ions, as revealed in this
study, are clearly the dominant anions and so there
are practically no bicarbonate waters, as might be
expected from the chemistry of the lateral
groundwater recharge. Given the influence of the
recharge in the aquifer systems of the area, the
groundwater generally gives a SO4/Cl (in meq/l)
ratio that is higher than that corresponding to
seawater in the sampled water. This reveals that only
a part of the sulphate content can be attributed to
seawater and that a significant proportion must come
from other saline contributions that differentially
enrich the water with the sulphate ion. This sulphate
enrichment is accompanied by increases in calcium
and magnesium, and this suggests a common, non-
marine origin for these ions.
Since this is a coastal aquifer subject to marine
intrusion, the ion exchange process assumes great
significance in the salinized zones and is a very
important factor regulating ion concentrations in the
groundwater 15
. The classic bibliography on ion
exchange processes in coastal aquifers 16, 17, 18, 19, 15
,
all state that the appearance of Ca-Cl facies in a
coastal aquifer reflects the operation of inverse ion
exchange, whereas the Na-HCO3 facies can indicate
direct exchange, and the predominance of Ca-Cl or
Ca-Cl, SO4 facies over much of the aquifer clearly
indicates the existence of inverse ion exchange.
In this study, the dominant ions are Cl-, Na with Ca
2+
and HCO3- ions following. Generally, within the
evolutionary trend, groundwater tends to acquire
chemical compositions similar to that of seawater
(that is more dissolved and relative increase in
chloride ion) the longer it remains underground and
the further it travels.
Mineralogical composition can exert an important
control on the final water chemistry. As groundwater

Res.J.Chem.Sci.______________________________________________Research Journal of Chemical Sciences
Vol. 1(3) June (2011) ISSN 2231-606X
90
flows through the strata of different mineralogical
composition, the water composition undergoes
adjustments caused by imposition of new
mineralogically controlled thermodynamic
constraints 20
.
Hydro chemical indices: The following ionic
relationships were studied to check the salinity and
origin of the groundwater in the study area. These
includes: Mg/Ca, Cl/HCO3, and the Cationic
Exchange Value (CEV = [Cl – (Na + K)]/Cl). Mg/Ca
values were all less than 2.0 (Table 2) ranging 0.029
– 1.892. According to the interpretation of this
index, the groundwater in the study appears to be
slightly of inland origin, because waters under
marine influence would have values of about 5 21
,
except where other processes such as Cationic
Exchange intervene, when the values could be 4 or
less.
The Cl/HCO3 values range from 0.553 – 49.250.
Values of this hydro geochemical index given for
inland waters are between 0.1 and 5 and for seawater
between 20 and 50 22
. In general, the CEV for
seawater ranges from +1.2 to +1.3 23
, where low-salt
inland waters give values close to zero, either
positive or negative. The CEV values for
groundwater of Port Harcourt area are generally
below 1.0 (Table 2) ranging from 0.75 – 0.99,
indicating that the groundwater is inland in some
locations with respect to provenance.
Mechanisms controlling water chemistry: The
ionic composition may be caused by several factors
during the interaction. Hence, it is necessary to use
ionic ratios and plots to discriminate between. The
concentration of atmospheric sources to the
dissolved salts has been discussed by many authors 24, 25, 26, 27
. Chloride is the most useful parameter for
evaluating atmospheric input to water as it shows
very little fractionation 15
. Sodium and Chloride
inputs are likely to be mainly from rainfall and,
therefore, will largely reflect the ratio observed in
seawater. Cation exchange may account for a
reduction in the Na concentration, and halite
dissolution may account for high concentration of
Cl. The low concentrations of potassium in natural
water are a consequence of its tendency to be fixed
by clay minerals and participate in the formation of
secondary minerals 28
.
Dissolved species and their relations with each other
can reveal the origin of solutes and the processes that
generated the observed composition of water. The
Na/Cl relationship has often been used to identify
the mechanism for salinity distribution and saline
intrusions 29, 30
. The Na+ and Ca
2+ shows a good
correlation indicating that Cl- and for the most part,
Na+ are probably derived from the dissolution of
disseminated halite in fine-grained sediments. The
high Na/Cl ratios are probably controlled by water-
rock interaction.
When there is an exchange between Na+ and K
+ in
groundwater with Mg2+
or Ca2+
in the aquifer
material, both of the indices are positive, indicating
ion exchange of Na+ in groundwater with Ca
2+ or
Mg2+
in the alluvium31
. In general, these indices
show positive values, whereas the low salt waters
give negative values. The increase in groundwater
salinity is usually accompanied by a slow rise in
reverse ionic exchange, which indicates a cationic
exchange that increases the hardness of these waters.
The contribution of K+ to the groundwater in these
samples is modest. The low levels of potassium in
water are a consequence of its tendency to be fixed
by clay minerals and to participate in the formation
of secondary minerals31
.
Ionic ratios/ relations and sources of major
components: During rock weathering, Ca2+
, Mg2+
,
SO42-
, HCO3- and SiO2 are added to water. The
amount of each ion in water is dependent on the rock
mineralogy. However, the use of major ions
chemistry to identify rock mineralogy can be useful
but must be applied carefully. Mineral precipitation,
ion exchange and evaporation can modify chemical
composition. In many cases, the source rock
minerals may be deduced from the water
composition.

Res.J.Chem.Sci.______________________________________________Research Journal of Chemical Sciences
Vol. 1(3) June (2011) ISSN 2231-606X
91
Using ionic ratios in groundwater, it is possible to
indicate the minerals of source rock types 32
. For this
purpose, the concentrations of the various
constituents are converted to meq L-1
to be able to
combine the various ions in a chemically meaningful
way. In this study, most of the ion ratios have been
calculated (table 3).
Ionic ratios of ground waters have been often used to
evaluate seawater intrusion in coastal areas 33, 34, 35
.
The values of HCO3/Cl, indicative of freshwater
recharge are all greater. Generally, the ratios
gradually increase and approach the seawater value
as TDS increases, indicating increase in influence of
seawater intrusion. As previously noted in this study,
TDS is a perfect surrogate for Cl. Consequently, the
ratio of HCO3//Cl can be a good indicator for
salinization due to the seawater encroachment. The
results for the SO42-
/Cl- ratios and the Ca and Mg
concentrations are consistent with intrusion of
seawater into the shallow aquifers.
Ratios of Na/Ca, indicating cation exchange reaction
can show some mixed behaviour but it mostly
increases with increase in TDS, which is a good
indicator revealing the salinization process 36
.
Generally, some ionic ratios appeared useful to
delineate degree of salinization effect for the ground
waters, but it should be noted that they may be
disturbed by certain artifacts in the course of the
groundwater samplings or chemical analysis.
Conclusion
Controls on the distribution of water qualities in the
study area reflect wall-rock interactions (affecting
geochemistry); effects of land-use change (especially
where the aquifer is unconfined); saline intrusion
and aquifer refreshing (including ion exchange
effects); and over-exploitation (in the semi-confined
and confined zones of the aquifer).
The hydro chemical interpretation presented here
strongly illustrates that rational plans for long-term
and sustainable management of the aquifer systems
cannot be based simply on regulatory water quality
targets, which are focused on current anthropogenic
causes of water quality degradation (e.g. in relation
to saline intrusion or industrial contaminants).
Although recent management effort may have an
influence on the quality of the aquifer (e.g. in
relation to the dynamic movement of freshwater),
palaeo-hydro geological events have resulted in the
presence of relict saline components in the aquifer
isolated from their original sea water source.
Following the above scenario, such isolated (and
potentially dynamic) sources must be taken into
account when assessing boundary conditions for
water quality modeling. A successful aquifer
management plan will need to take into account the
degree to which various waters currently
encountered in the aquifer already are complex
mixtures between modern recharge waters, modern
seawater and ancient, trapped seawaters. Only a plan
which builds upon a sound understanding of this
history can be expected to produce sensible options
for sustainable aquifer management into the future.
The evolution of groundwater in the area could be
explained by the order of encounter 12
. This theory
states succinctly that the order in which groundwater
encounter strata of different mineralogical
composition can exert an important control on the
final water chemistry. As groundwater flows through
the strata of different mineralogical composition, the
water composition undergoes adjustments caused by
imposition of new mineralogically controlled
thermodynamic constraints 20
.
References
1. Apodaca L.E, Jeffrey B.B. and Michelle C.S.,
Water quality in shallow alluvial aquifers,
Upper Colarado River Basin, Colorado, Journal
of American Water Research Association,
38(1),133-143(2002)
2. Martinez D.E. and Bocanegra E.M., Hydro
geochemistry and Cation Exchange Processes in
the Coastal Aquifers of Mar Del Plata,
Argentina, Hydrogeology Journal, (10), 393 -
408 (2002)

Res.J.Chem.Sci.______________________________________________Research Journal of Chemical Sciences
Vol. 1(3) June (2011) ISSN 2231-606X
92
3. Etu-Efeotor, J.O and Odigi, M.I., Water supply
problems in the Eastern Niger Delta, Journ. Min.
Geol., 20 (1and 2), 183 -193 (1983)
4. Amajor L.C., Geochemical Characteristics of
Groundwater in Port Harcourt and its Environs.
Proc. Int’l Symp. on Groundwater Resources of
Nigeria, Lagos, 358 – 375(1986)
5. Amadi P.A., Ofoegbu C.O. and Morrison T.,
Hydrogeochemical Assessment of Groundwater
Quality in parts of the Niger Delta, Nigeria,
Environmental Geol. Water Science, 14(3), 195
– 202 (1989)
6. Etu- Effeotor, J.O., Preliminary
hydrogeochemical investigations of subsurface
waters in parts of the Niger Delta, Journ. Min.
Geol., 18(1), 103 – 107 (1981)
7. Udom G.J., Etu- Efeotor J.O. and Esu,E.O.,
Hydrochemical evaluation of groundwater in
parts of Port Harcourt and Tai-Eleme Local
Government Area, Rivers State., Global Journal
of Pure and Applied Sciences, (5), 546 – 552
(1999)
8. Nwankwoala H.O., Okeke E.V. and Okereke
S.C., Groundwater quality in parts of Port
Harcourt, Nigeria: An overview, trends and
concerns, International Journal of Biotechnology
and Allied Sciences, 2(3), 282 – 289 (2007)
9. Piper A.M., A graphical interpretation of water
analysis, Transactions of the American
Geophysical Union, (25), 914 -928 (1944)
10. Lakshmanen E., Kannan R. and Kumar M.S.,
Major ion chemistry and identification of
hydrochemical processes of groundwater in a
part of Kancheepuram District, Tamil Nadu,
India. Environmental Geosciences, 10(4), 157 –
166 (2003)
11. Back W., Hydro chemical facies and
groundwater flow patterns in northern part of
Atlantic Coastal Plain: US Geological Survey
Professional Paper 498 – A, 42 (1966)
12. Freeze R.A. and Cherry J.A., Groundwater,
Prentice-Hall Inc. Englewood Cliffs, N.J (1979)
13. Leybourne M.I., Goodfellow W.D. and Boyle
D.R., Hydro geochemical, isotopic and rare earth
element evidence for contrasting water-rock
interactions at two undisturbed Zn-Pb massive
sulphide deposits, Bathurst Mining Camp, N.B,
Canada, J. Geochem Exp., (64), 237-261 (1998)
14. Pitkanen P., Kaija J., Blomqvist R., Smellie
J.A.T., Frape S.K., Laaksoharju M., Negral P.H.,
Casanova J. and Karhu J., Hydro geochemical
interpretation of groundwater at Palmottu, Paper
EUR 19118 EN, European Commission,
Brussels, 155 – 167 (2002)
15. Appelo C.A.J., Postma D., Geochemistry,
groundwater and Pollution. Balkema, Rottadam,
NL, 530 -536 (1993)
16. Howard K.W.F and Lloyd J.W., Major ion
characterization of coastal saline ground waters,
Groundwater 21(4), 429-437(1983)
17. Tellam J.H., and Lloyd J.W., Problems in the
recognition of seawater intrusion by chemical
means: an example of apparent chemical
equivalence, Q. J. Eng. Geol., (19), 389-398
(1986)
18. Lloyd J.W. and Tellam J.H., Caraterizacion
hidroquimica de las agues subterraneas en areas
costeras (Hydro chemical characterization of
groundwater in coastal areas), Proceedings of
International Symposium TIAC’88 (Tecnologia
de la Intrusion marina en Acuiferos Costeros),
Vol 1, Almunnecar, Granada, Spain, June 1-8
(1988)
19. Ikeda K., Chemical evolution of groundwater
quality in the southern foot of Mount Fuji, Bull.
Geol. Surv. Japan, 40 (7), 331- 404 (1989)
Res.J.Chem.Sci.______________________________________________Research Journal of Chemical Sciences
Vol. 1(3) June (2011) ISSN 2231-606X
93
20. Edet A.E., Groundwater quality assessment in
parts of eastern Niger Delta, Nigeria,
Environmental Geology, Springer Verlag, 22, 41
– 46 (1993)
21. Morrell I., Pulido-Bosch A. and Fernandez
Rubio R., Hydro geochemical analysis of
salinization processes in the coastal aquifers of
Oropesa, Spain, Environmental Geology, (29),
118-131 (1986)
22. Custodio E., Groundwater problems in coastal
areas, In: Studies and Reports in Hydrology
(UNESCO), (1987)
23. Custodio E., Hidrogeoquimica, In: Custodio, E
and Llymas, M.R (Ed.), Hydrologia Subterranea,
Section 10, Omega, Barcelona (1983)
24. Garrels R.M and Mackenzie, F.T., Gregor’s
denudation of the continents, Nature, (23), 382 –
383 (1971)
25. Stallard R.F. and Edmund J.M., Geochemistry of
the Amazon River, The influence of Geology
and weathering environment on dissolved load,
Journal of Geophysical Research, (88), 9671 –
9688 (1983)
26. Sarin M.M., Krishnaswamy S., Somajajulu
B.L.K. and Moore W.S., Major ion chemistry of
the Ganga-Brahmaputra and fluxes to the Bay of
Bengal, Geochem Cosmochim Acta, (53), 997 –
1009 (1989)
27. Berner E.K. and Berner R.A., The global water
cycle: geochemistry and environment, Prentice-
Hall, Englewood Cliff, New Jersey, USA (1996)
28. Matheis G., The properties of groundwater,
Wiley, New York, USA (1982)
29. Sami K., Recharge mechanisms and geochemical
processes in a semi-arid sedimentary basin,
Eastern Cape, South Africa, Journal of
Hydrology, (139), 27-48 (1992)
30. Panteleit B., Kessels W., Kantor W. and Schulz
H.D., Geochemical characteristics of
salinization-zones in the Coastal Aquifer Test
Field (CAT-Field) in North- Germany. In:
Proceedings of 5th
International Conference on
Saltwater Intrusion and Coastal Aquifers –
Monitoring, Modelling, and Management,
Essaouira, Morocco, 1- 11 (2001)
31. Zhu G.F., Su Y.H., and Feng Q., The hydro
geochemical characteristics and evolution of
groundwater and surface water in the Heihe
River Basin, northwest China, Hydrogeology
Journal, (16), 167-182 (2008)
32. Hounslow A.W., Water quality data: analysis
and interpretation, CRC, Boca Raton, FL (1995)
33. Sanchez-Martos F., Pulido-Bosch A., Molina-
Sanchez L. and Vallejos Izquierdo A.,
Identification of the origin of salinization in
groundwater using minor ions (Lower
ANDARAX, Southeast. Spain), Science of the
Total Environment, (29), 43-58 (2002)
34. Kim J.H; Kim R.H. and Chang H.W., Hydro
geochemical Characterization of major factors
affecting the quality of shallow Groundwater in
the coastal area at Kimje in South Korea,
Environmental Geology, 478- 489 (2003)
35. Moujabber E.l., Bou Samra M., Darwish B., and
Atallah T., Comparison of different indicators
for groundwater contamination by seawater
intrusion on the Lebanese Coast, Water
Resources Management, (20), 161 -180 (2006)
36. Edet A.E. and Okereke C.S., .Delineation of
shallow groundwater aquifers in the coastal plain
sands of Calabar area (Southern Nigeria) using
surface resistivity and hydro geological data,
Journal of African Earth Sciences, (35), 433-443
(2002)

Res.J.Chem.Sci.______________________________________________Research Journal of Chemical Sciences
Vol. 1(3) June (2011) ISSN 2231-606X
94
Fig-1: Map of Port Harcourt City showing Sampled Borehole Locations
Res.J.Chem.Sci.______________________________________________Research Journal of Chemical Sciences
Vol. 1(3) June (2011) ISSN 2231-606X
95
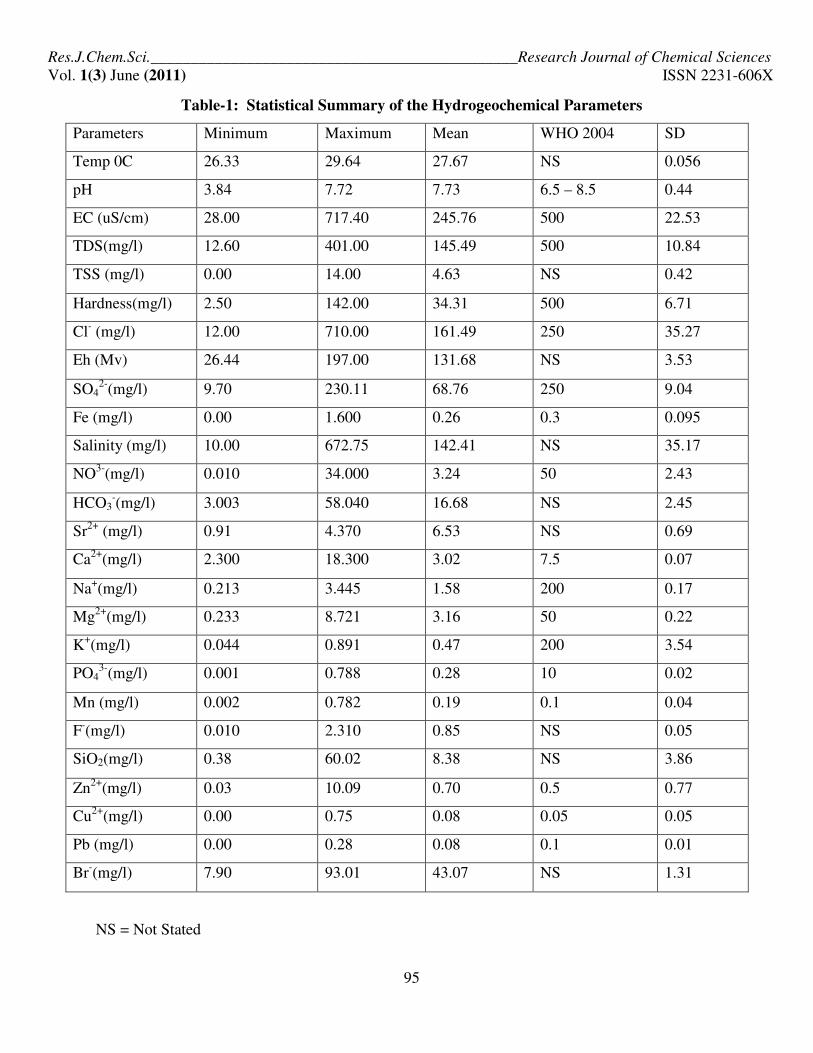
Table-1: Statistical Summary of the Hydrogeochemical Parameters
Parameters Minimum Maximum Mean WHO 2004 SD
Temp 0C 26.33 29.64 27.67 NS 0.056
pH 3.84 7.72 7.73 6.5 – 8.5 0.44
EC (uS/cm) 28.00 717.40 245.76 500 22.53
TDS(mg/l) 12.60 401.00 145.49 500 10.84
TSS (mg/l) 0.00 14.00 4.63 NS 0.42
Hardness(mg/l) 2.50 142.00 34.31 500 6.71
Cl- (mg/l) 12.00 710.00 161.49 250 35.27
Eh (Mv) 26.44 197.00 131.68 NS 3.53
SO42-
(mg/l) 9.70 230.11 68.76 250 9.04
Fe (mg/l) 0.00 1.600 0.26 0.3 0.095
Salinity (mg/l) 10.00 672.75 142.41 NS 35.17
NO3-
(mg/l) 0.010 34.000 3.24 50 2.43
HCO3-(mg/l) 3.003 58.040 16.68 NS 2.45
Sr2+
(mg/l) 0.91 4.370 6.53 NS 0.69
Ca2+
(mg/l) 2.300 18.300 3.02 7.5 0.07
Na+(mg/l) 0.213 3.445 1.58 200 0.17
Mg2+
(mg/l) 0.233 8.721 3.16 50 0.22
K+(mg/l) 0.044 0.891 0.47 200 3.54
PO43-
(mg/l) 0.001 0.788 0.28 10 0.02
Mn (mg/l) 0.002 0.782 0.19 0.1 0.04
F-(mg/l) 0.010 2.310 0.85 NS 0.05
SiO2(mg/l) 0.38 60.02 8.38 NS 3.86
Zn2+
(mg/l) 0.03 10.09 0.70 0.5 0.77
Cu2+
(mg/l) 0.00 0.75 0.08 0.05 0.05
Pb (mg/l) 0.00 0.28 0.08 0.1 0.01
Br-(mg/l) 7.90 93.01 43.07 NS 1.31
NS = Not Stated

Res.J.Chem.Sci.______________________________________________Research Journal of Chemical Sciences
Vol. 1(3) June (2011) ISSN 2231-606X
96
Table-2: Hydrogeochemical Facies Analysis of Groundwater Samples Note: BH=Borehole; ND=Not
Determined
BOREHOLE
S/NO
Ca
2+%
Mg
2+%
So4 2-
%
Cl -% Na
+% K
+% Hco3
-
%
Co3 -
%
So4 2-
+
Cl-
Ca 2+
+
mg2+
Na+ +
k+
HCO3-
+CO3-
BH1 1.66 2.20 ND 13.73 5.45 3.58 3.45 ND 13.73 3.86 9.03 3.45
BH2 2.13 2.94 ND 4.84 5.93 5.36 4.09 ND 4.84 5.07 11.29 4.09
BH3 3.66 0.82 ND 6.39 2.02 3.34 1.26 ND 6.39 4.48 5.36 1.26
BH4 1.97 4.45 3.41 5.81 1.65 1.99 1.93 ND 9.22 6.42 3.64 1.93
BH5 0.96 2.72 0.88 6.79 1.32 5.90 3.94 ND 7.67 3.68 7.22 3.94
BH6 2.93 0.44 4.09 7.93 6.72 2.85 10.12 ND 12.02 3.37 9.57 10.12
BH7 3.88 0.23 3.14 1.03 2.77 4.85 2.06 ND 4.17 4.11 7.62 2.06
BH8 5.38 2.05 3.75 6.41 3.51 0.95 7.35 ND 10.16 7.43 4.46 7.35
BH9 2.39 0.99 4.38 5.81 3.60 4.34 0.56 ND 10.19 3.38 7.94 0.56
BH10 1.97 3.18 1.74 1.32 0.61 2.94 1.53 ND 3.06 5.15 3.55 1.53
BH11 2.58 0.31 3.96 0.35 0.86 3.31 2.27 ND 4.31 2.89 4.17 2.27
BH12 3.60 0.27 3.45 0.93 3.51 2.66 2.87 ND 4.38 3.87 6.17 2.87
BH13 5.85 0.81 ND 0.74 4.81 1.99 10.88 ND 0.74 6.86 6.80 10.88
BH14 2.02 1.77 2.18 4.84 4.59 2.81 ND ND 7.02 3.79 9.08 ND
BH15 1.44 5.61 3.32 2.23 2.85 3.68 5.62 ND 5.55 7.05 6.53 5.62
BH16 3.92 20.09 1.00 2.00 4.59 4.49 1.33 ND 3.00 6.01 9.08 1.33
BH17 4.41 4.56 1.12 2.55 1.98 2.26 1.78 ND 3.67 8.93 4.24 1.78
BH18 3.03 8.79 10.46 7.76 4.55 1.53 2.85 ND 18.22 11.82 6.08 2.85
BH19 8.76 6.92 0.44 7.56 3.60 2.13 3.88 ND 8.00 15.68 5.73 3.88
BH20 2.03 2.79 3.54 0.23 4.37 5.22 1.51 ND 3.77 4.82 9.59 1.51
BH21 1.19 0.33 2.96 0.68 0.42 0.88 1.94 ND 3.64 1.52 1.30 1.94
BH22 6.60 4.25 3.42 0.74 0.48 3.75 2.06 ND 4.14 10.85 4.23 2.06
BH23 2.55 2.75 4.36 0.37 2.86 0.29 2.51 ND 4.73 5.30 3.15 2.51
BH24 3.25 3.95 ND 0.45 4.55 5.17 1.94 ND 0.45 7.20 9.72 1.94
BH25 2.57 8.62 3.64 0.79 1.98 1.54 2.38 ND 4.43 11.19 3.52 2.38
BH26 2.87 2.97 3.18 0.60 6.81 3.03 2.84 ND 3.78 5.84 9.84 2.84
BH27 3.63 2.09 3.54 0.98 4.17 3.60 2.27 ND 4.52 5.72 7.77 2.27
BH28 1.10 6.12 8.69 0.62 0.66 5.22 2.45 ND 9.31 7.22 5.88 2.45
BH29 2.77 5.76 5.73 0.31 4.18 1.54 5.45 ND 6.04 8.53 5.72 5.45
BH30 2.03 4.00 4.54 0.54 1.25 3.58 2.25 ND 5.08 6.03 4.83 2.25
BH31 3.83 2.31 3.64 4.16 2.72 1.46 2.25 ND 7.80 6.14 4.18 2.25
BH32 3.03 2.96 5.47 0.54 0.62 3.75 2.30 ND 6.01 5.99 4.37 2.30

Res.J.Chem.Sci.______________________________________________Research Journal of Chemical Sciences
Vol. 1(3) June (2011) ISSN 2231-606X
97
Table-3: Ionic Ratios and CEV of the Groundwater in the Study Area
S/N HCO3/Cl Na/Ca Na/Cl Ca/Cl Mg/Cl K/Cl SO4/Cl Mg/Ca Ca/SO4 Ca/HCO3 CEV
1. 1 0.0259 0.7965 0.0039 0.0049 0.0031 0.0008 0.0000 0.6420 0.0000 0.1880 0.99
2. 0.0872 0.6751 0.0120 0.0178 0.0119 0.0032 0.0000 0.6710 0.0000 0.2039 0.98
3. 0.0173 0.1339 0.0031 0.0231 0.0025 0.0015 0.0000 0.1080 0.0000 1.3389 0.99
4. 0.0344 0.2029 0.0028 0.0137 0.0150 0.0010 0.2500 1.0951 0.0548 0.3983 0.99
5. 0.0599 0.3330 0.0019 0.0070 0.0079 0.0025 0.0549 1.3790 0.1036 0.0952 0.99
6. 0.1317 0.5553 0.0083 0.0057 0.0011 0.0011 0.2198 0.0730 0.0679 0.1134 0.98
7. 0.2075 0.1728 0.0264 0.0149 0.0044 0.0138 0.3043 0.0290 0.1172 0.7363 0.95
8. 0.1182 0.1581 0.0054 0.1528 0.0063 0.0004 0.2494 0.1850 0.1361 0.2864 0.99
9. 0.0767 0.3644 0.0061 0.0339 0.0033 0.0022 0.3211 0.2001 0.0519 0.2174 0.99
10. 0.1204 0.0752 0.0046 0.0160 0.0474 0.0065 0.5634 0.7822 0.1076 0.5032 0.98
11. 0.6778 0.0803 0.0241 0.0606 0.0172 0.0278 4.8417 0.5750 0.0619 0.4455 0.94
12. 0.3188 0.2362 0.0370 0.2997 0.0058 0.0084 1.5792 0.37000 0.0992 0.4917 0.95
13. 1.5274 0.1993 0.0640 0.1567 0.0217 0.0079 0.0000 0.6730 0.0000 0.2004 0.93
14. 0.0927 0.5496 0.0093 0.3213 0.0072 0.0017 0.1920 0.4240 0.0879 0.1823 0.98
15. 0.2609 0.4767 0.0125 0.0169 0.0494 0.0048 0.6344 1.8920 0.4011 0.1000 0.98
16. 0.0687 0.2816 0.0224 0.0261 0.0203 0.0066 0.2139 0.2563 0.3738 0.0581 0.97
17. 0.0719 0.1086 0.0076 0.0796 0.0347 0.0026 0.1871 0.4980 0.3725 0.9684 0.98
18. 0.0379 0.2818 0.0057 0.0697 0.0222 0.0006 0.5738 1.4082 0.0275 0.4156 0.99
19. 0.0530 0.0995 0.0047 0.0158 0.0179 0.0008 0.0248 0.3831 1.8866 0.8835 0.99
20. 0.6733 0.5208 0.1843 0.0469 0.2351 0.0657 6.5000 0.6658 0.0544 0.5254 0.75
21. 0.2956 0.0859 0.0061 0.3538 0.0095 0.0038 1.8600 0.1345 0.0381 0.2395 0.99
22. 0.2895 0.0175 0.0069 0.0708 0.1132 0.0149 1.9660 0.3120 0.1846 1.2535 0.97
23. 0.7053 0.2708 0.0380 0.3628 0.1464 0.0023 5.0526 0.5210 0.0556 0.3979 0.92
24. 0.4505 0.3392 0.1211 0.2807 0.1734 0.0339 0.0000 0.5894 0.0000 0.6545 0.86
25. 0.3100 0.1873 0.0435 0.2948 0.2127 0.0057 1.9512 1.6330 0.0668 0.4201 0.96
26. 0.4925 0.5742 0.0840 0.1302 0.0977 0.0148 2.2727 0.5022 0.0857 0.3955 0.87
27. 0.0024 0.2783 0.0685 0.1948 0.0418 0.0108 0.0154 0.2780 0.0973 0.6250 0.95
28. 0.4094 0.1447 0.0066 0.0015 0.1938 0.0247 5.9786 2.6961 0.0120 0.1756 0.96
29. 1.8075 0.3658 0.0660 0.0719 0.3646 0.0145 7.8261 1.0090 0.0458 0.1985 0.85
30. 0.4286 0.1490 0.0392 0.3588 0.1446 0.0193 3.5714 0.9570 0.0423 0.3528 0.96
31. 0.0558 0.3249 0.0491 0.1512 0.0109 0.0088 0.3721 0.2933 0.1000 0.6667 0.99
32. 0.4373 0.3249 0.0014 0.0372 0.1066 0.0202 4.2766 0.4740 0.0526 0.5149 0.97
Res.J.Chem.Sci.__________________________________
Vol. 1(3) June (2011)
Fig-2: Relationship between
Fig-3: Relationship between HCO
Co
nc
(mg
/l)
Co
nc
(mg
/l)
Co
nc
(mg
/l)
__________________________________Research Journal of
98
2: Relationship between HCO3/Cl and Na/Ca
3: Relationship between HCO3/Cl and Na/Cl
Research Journal of Chemical Sciences
ISSN 2231-606X

Res.J.Chem.Sci.__________________________________
Vol. 1(3) June (2011)
Fig-4: Relationship between Na/Ca and Na/Cl
Fig.-5: Relationship between Na/Cl and Ca/Cl
Fig.-6: Relationship between
Co
nc
(mg
/l)
Co
nc
(mg
/l)
Co
nc
(mg
/l)
__________________________________Research Journal of
99
4: Relationship between Na/Ca and Na/Cl
5: Relationship between Na/Cl and Ca/Cl
6: Relationship between Ca/Ca and Mg/Cl
Research Journal of Chemical Sciences
ISSN 2231-606X

Res.J.Chem.Sci.__________________________________
Vol. 1(3) June (2011)
Fig.-7: Relationship between Mg/Cl and K/C l
Fig.-8: Relationship between Mg/Cl and SO
Fig.-9: Relationship between Mg/Ca and Ca/SO
Fig.-10: Relationship between
Co
nc
(mg
/l)
Co
nc
(mg
/l)
Co
nc
(mg
/l)
__________________________________Research Journal of
100
7: Relationship between Mg/Cl and K/C l
8: Relationship between Mg/Cl and SO4/Cl
9: Relationship between Mg/Ca and Ca/SO4
10: Relationship between Na/Ca and SO4/Cl
Research Journal of Chemical Sciences
ISSN 2231-606X

Res.J.Chem.Sci.______________________________________________Research Journal of Chemical Sciences
Vol. 1(3) June (2011) ISSN 2231-606X
101
Fig.-11: Piper Trilinear Diagram for Groundwater
Classification in the area 9