hydrography and flow in the lucky strike segment of...
TRANSCRIPT

Ple
ase
note
that
this
is a
n au
thor
-pro
duce
d P
DF
of a
n ar
ticle
acc
ept
ed fo
r pu
blic
atio
n fo
llow
ing
peer
rev
iew
. The
def
initi
ve p
ub
lish
er-a
uthe
ntic
ated
ve
rsio
n is
ava
ilab
le o
n th
e pu
blis
her
Web
site
1
Journal of Marine Research May 2008 ; Volume 66, Number 3 : Pages 347-372 http://dx.doi.org/10.1357/002224008786176034 © 2008 Sears Foundation for Marine Research, Yale University http://www.journalofmarineresearch.org/
Archimer Archive Institutionnelle de l’Ifremer
http://www.ifremer.fr/docelec/
Hydrography and flow in the Lucky Strike segment of the Mid-Atlantic Ridge
A. M. Thurnherr1, *, G. Reverdin2, P. Bouruet-Aubertot2, L. C. St. Laurent3,
A. Vangriesheim4 and V. Ballu5 1 Lamont-Doherty Earth Observatory, Columbia University, Palisades, NY, USA 2 LOCEAN, UMR7159 CNRS/UPMC/IRD/MNHN, Université Pierre et Marie Curie, Paris, France 3 Dept. of Oceanography, Florida State University, Tallahassee, FL, USA 4 Ifremer, DEEP/LEP, BP70, 29280 Plouzané, France 5 PGP/CNRS, 4 place Jussieu, 75252 Paris cedex 05, France (now at IRD/CNRS, Geoazur, Port-Vila, Vanuatu) *: Corresponding author : A. M. Thurnherr, email address : [email protected]
Abstract: The Lucky Strike segment between 37 and 38N on the Mid-Atlantic Ridge is the focus of the international MoMAR program to monitor seafloor-spreading processes. During the GRAVILUCK cruise in August 2006, hydrographic, velocity and light-scattering data were collected in the rift valley at Lucky Strike in order to investigate the regional dynamics and to provide background information for the monitoring effort. The survey observations reveal a remarkably simple dynamical setting dominated by persistent northward flow transporting ≈0.2 Sv of water along the rift valley. Approximately half of this transport must upwell within a deep basin that occupies the northern half of the segment. In the comparatively shallow segment center, the along-valley transport takes place in two parallel, hydraulically controlled overflows on both sides of an active volcano that rises from the rift-valley floor. Within the better sampled of these overflows instantaneous velocities recorded during the survey were northward more than 95% of the time and occasionally exceeded 20 cm s-1. Similar to other laterally confined overflows in the deep ocean, the cross-sill density gradients are characterized by a lower layer with streamwise decreasing densities and an upper layer where the densities increase along the path of the flow. This vertical density-gradient dipole is the signature of the buoyancy flux associated with high levels of diapycnal mixing near the sill. Overall, the hydrography and dynamics in the rift valley of the Lucky Strike segment are highly reminiscent of many ridge-flank canyons in the western South Atlantic, where mean along-axial advection of density is balanced by vigorous diapycnal mixing. There is circumstantial evidence from historic hydrographic data suggesting that northward flow below ≈1800m in the rift valley in the MoMAR region is persistent on time scales of years to decades and that it extends more than 200 km to the south. During GRAVILUCK the northward flow at Lucky Strike extended well above 1600m, where two previous one year-long current meters had recorded southward mean flows near the Lucky Strike hydrothermal vent field. While interannual variability can potentially account for this difference, the data also allow for the possibility of a cyclonic re-circulation around an isolated topographic peak east of the vent field, resulting in the southward mean flows observed there. In addition to the light-scattering anomalies associated with plumes rising from the Lucky Strike vent field near the segment center, the GRAVILUCK data also show clear evidence for a separate hydrothermal particle plume emanating from a not-yet-discovered vent field in the southern half of the segment, probably near 2000m.

Ple
ase
note
that
this
is a
n au
thor
-pro
duce
d P
DF
of a
n ar
ticle
acc
ept
ed fo
r pu
blic
atio
n fo
llow
ing
peer
rev
iew
. The
def
initi
ve p
ub
lish
er-a
uthe
ntic
ated
ve
rsio
n is
ava
ilab
le o
n th
e pu
blis
her
Web
site
2
1. Introduction Hydrothermal circulation accounts for approximately one third of the global
geothermal heat flux to the oceans and strongly affects the chemical composition of
the water (e.g. Elderfield and Schultz, 1996). Most of the currently known
hydrothermal sources in the ocean occur along the axes of mid-ocean ridges where
tectonic plates spread apart and new seafloor is formed (e.g. Baker and German,
2004). The chemical energy associated with hydrothermal effluents supports
chemosynthetic ecosystems that are characterized by a high degree of endemicity
(e.g. Herring, 2002). Hydrothermal vent fields typically contain many individual
sources from which the hot effluents rise as buoyant plumes through the water
column. Entrainment and mechanical mixing driven by other processes increase the
density of the rising effluents until the plumes reach their

JMR (in press) June24, 2008
34˚W 33˚W 32˚W 31˚W
37˚N
38˚N A
B
DC
2000m
2500m
Figure 1: Lucky Strike segment topography, from Cannatet al. (1999); contour interval is500 m;hatched areas are regions of no data. The cross at37◦18 ′N 32◦17 ′W marks the location of theLucky Strike vent field. Circled labels indicate sills that connect the rift valley to the ridge flanks,as determined with the algorithm of Otto and Thurnherr (2007); sill depths, rounded to10 m: A:1790 m, B: 1080 m, C: 1310 m and D:1830 m.
levels of neutral buoyancy, where they are dispersed laterally by the oceanic currents (e.g. McDuff,1995).
While hydrothermal fluxes of energy and mass can be determined from measurements at thevents (e.g. Converseet al., 1984), the distributed nature of hydrothermal sources makes vent-field-scale flux estimates using this method difficult and costly. Neutrally buoyant hydrothermal plumes,on the other hand, integrate the effects of multiple temporally varying and spatially distributedsources. Due to their high load of suspended particles, neutrally buoyant plumes from high-temperature hydrothermal sources can be mapped by carrying out optical water-column surveysnear hydrothermal vent fields. Such plume observations have been used to quantify hydrothermalheat fluxes (e.g. Thurnherr and Richards, 2001) as well as to characterize dispersal of a variety ofhydrothermal “products,” including geochemical tracers (e.g. Jean-Baptisteet al., 1998) and larvæof organisms associated with hydrothermal vent-field ecosystems (e.g. Mullineauxet al., 1995).In order to calculate fluxes from neutrally buoyant hydrothermal-plume observations, both the hy-drography and the circulation that disperses the plumes must be known.
Here, we report on the results from a recent survey of the hydrography, velocity field, andlight scattering in the rift valley of the Lucky Strike segment of the Mid-Atlantic Ridge (MAR).The known hydrothermal sources are located on a seamount in the segment center near37◦18 ′N32◦17 ′W (Langmuiret al., 1997; Fig. 1). The Lucky Strike site is the focus of the interdisciplinary
3

JMR (in press) June24, 2008
international MoMAR project to monitor seafloor-spreading processeson the MAR1. As is typicallythe case for hydrothermal vent fields on slow-spreading mid-ocean ridges, the Lucky Strike vents liedeep inside the rift valley, which is physically isolated from the water column on the MAR flanks:With the exception of a passage at1310 m near the southern end of the segment (labeled “C” inFig. 1), the eastern rift-valley wall blocks exchange between the rift valley and the deep easternNorth Atlantic up to a depth of≈1100 m. In the west, the Lucky Strike rift valley is connectedto the open North Atlantic via two deeper passages: Passage “A” in the northwest at1790 m andpassage “D” in the southwest at1830 m.
Ours are not the first water-column data collected in the Lucky Strike segment: During theFAZAR cruise in 1992 a number of quasi-horizontal tows and vertical casts with hydrographic,optical and geochemical sensors were carried out near the Lucky Strike vent field, which had beendiscovered during the same cruise (Langmuiret al., 1997). During FAZAR, the neutrally buoyanthydrothermal plumes from the Lucky Strike vents were associated with weak (compared to otherhydrothermal sites on the MAR) optical particle signatures and spanned the depth range between1350 and1900 m. Except for some small optical anomalies directly over the seamount, the hy-drothermal signatures in the Lucky Strike segment were restricted to depths below1400 m (Wilsonet al., 1996), i.e. the hydrothermal plumes were largely confined within the rift valley, as is usuallythe case for hydrothermal plumes rising from vent fields on slow-spreading ridges (Germanet al.,1995). Since the hydrothermal plumes in the FAZAR data extend significantly below the depthof the known vents (≈1700 m), an additional, not-yet-discovered hydrothermal source has beenhypothesized to lie somewhere near the base of the seamount (Klinkhammeret al., 1995; Wil-sonet al., 1996). In 1994, two years after FAZAR, additional hydrographic and optical data werecollected in the Lucky Strike segment during the HEAT cruise (Germanet al., 1996). Due to instru-ment and sampling limitations the plume in the segment center was missed by two horizontal tows,but a clear optical plume signal centered near1800 m was observed≈25 km south of the seamountat 37◦03 ′N 32◦25 ′W. Germanet al. (1996) attribute this plume to another not-yet-discoveredhydrothermal source.
In terms of the hydrography at Lucky Strike, Wilsonet al. (1995) note that the T/S proper-ties observed in the rift valley in 1992 (FAZAR) were characterized by salinity-compensated tem-perature inversions up to≈0.05◦C (the corresponding salinity anomalies are≈0.01), presumablyassociated with frontal interleaving. The isopycnal temperature and salinity variability associatedwith these interleaving signatures largely masks the hydrographic anomalies associated with thehydrothermal plumes (∆θ≈ 0.02◦C; Wilson et al., 1996).
Approximately three months before the 1994 water-column survey (HEAT) was carried out,two moorings with a total of three current meters were deployed in close proximity to the hy-drothermal vents (Jean-Baptisteet al., 1998; Khripounoffet al., 2000). The taller of the mooringswas deployed for a total of 14 months with current meters 20 and130 m above the seabed. Thevelocity records from both instruments are dominated by very strong semidiurnal tidal fluctuations,with respective maximum speeds of23 and29 cm s−1. Both instruments recorded predominantlyalong-valley (approximately meridional) flow. In the record from the lower instrument, whichfailed after 95 days, the current was persistently to the north, with a mean speed of2.9 cm s−1. The
1http://www.ipgp.jussieu.fr/rech/lgm/MOMAR
4

JMR (in press) June24, 2008
upper instrument recorded several flow reversals; the408 daysrecord mean is1.5 cm s−1 to thesouth-southwest. Due to an instrument problem, the single current meter deployed on the shortermooring about3.5 m above the seabed did not record current speed — during its 25-day deploymentthe flow direction was predominantly between north- and eastward (Khripounoffet al., 2000).
This paper is organized as follows: Section 2 contains a description of the rift-valley topogra-phy, instrumentation and data processing, as well as the survey design. The main hydrographic andcirculation observations are presented and analyzed in Section 3. In Section 4 the optical signaturesof two distinct hydrothermal particle plumes in the Lucky Strike segment are described. The paperconcludes with a synthesis and discussion of our observations (Section 5).
2. Methods
a. Rift-Valley Topography
The topography of the Lucky Strike segment is characterized by an hour-glass-shaped rift val-ley, consisting of two deep (>2700 m) segment-end basins connected by a narrower and shallowerregion in the segment center, where the rift valley trends approximately N–S (20◦ true; Fig. 1). Thevolcanically active Lucky Strike seamount rises from the valley floor in the segment center, leav-ing two narrow and almost equally deep passages connecting the southern and northern basins onboth sides of the seamount (Fig. 2). The sill depths and approximate minimum channel widths are2060 m/5 km and2075 m/3 km for the western and eastern passages, respectively. Near the sills,both passages are confined below≈1700 m by extremely steep lateral walls, with multibeam dataindicating slopes of≈0.5 (rise/run). The top of the seamount consists of two groups of peaks sepa-rated by a1775 m deep passage. (The individual peaks are not visible in Fig. 2; for a closeup of theeastern group, see Fig. 11 below.) The highest peak in the western group rises to a depth of1540 mnear37◦19.2 ′N 32◦18.2 ′W and the highest peak in the eastern group rises to a depth of1560 mnear37◦17.1 ′N 32◦16.9 ′W. The known hydrothermal vents at Lucky Strike are situated betweenthe peaks of the eastern group near37◦17.5 ′N 32◦16.5 ′W at depths ranging from 1646 to1706 m(Langmuiret al., 1997).
b. Instrumentation and Data Processing
In August 2006 the French research vesselL’Atalante visited the Lucky Strike segment, pri-marily in order to install a geodesy network for monitoring vertical deformation of the seafloor(GRAVILUCK project). A separate physical oceanographic component, funded by the US NationalScience Foundation with additional support from the French government, was carried out duringalternate nights of the twenty-day expedition. The survey consisted primarily of CTD, LADCP andmicrostructure casts, augmented by a 2-week deployment of a bottom-mounted ADCP. This paperdiscusses primarily the hydrographic and velocity data; results from the microstructure componentof the project have been reported elsewhere (St. Laurent and Thurnherr, 2007).
The main profiling platform used during the survey was a SBE 911 CTD mounted on a frametogether with a 24-bottle rosette, a Teledyne/RDI Workhorse300 kHz ADCP and a high-sensitivity
5

JMR (in press) June24, 2008
32˚30'W 32˚15'W
37˚05'N
37˚10'N
37˚15'N
37˚20'N
37˚25'N
2000m
2250m
2500m
Figure 2: Hydrographic stations in the Lucky Strike segment; topographiccontour interval is250 m. The cross at37◦18 ′N 32◦17 ′W marks the location of the Lucky Strike vent field; the tri-angle at37◦17 ′N 32◦14 ′W shows the deployment location of the bottom-mounted ADCP. Bullets:L’Atalante CTD/LADCP/STM stations; squares:Pourquoi Pas ? CTD stations; star at37◦22 ′N32◦15 ′W: location of two CTD profiles collected in 2005 (EXOMAR cruise); pentagon at37◦03 ′N32◦25 ′W: plume station of Germanet al. (1996). Dashed circles enclose theL’Atalante stationsfrom which mean light-scattering (STM) profiles were constructed (Section 4).
(5 FTU range) version of the Seapoint Turbidity Meter (STM), measuring the backscatter of lightfrom suspended particles in the water column. Additional full-depth CTD profiles were collectedwith a self-contained SBE 19+ from a second French research vessel, thePourquoi Pas ?, whichcarried out a separate project in the Lucky Strike region at the same time.
The primary CTD (SBE 911) was equipped with sensors for pressure, temperature, conduc-tivity and partial pressure of oxygen. The oxygen sensor calibration was not verified with water
6

JMR (in press) June24, 2008
samples; as a result, the accuracy of the oxygen data is not known.Temperature and conductivitywere recorded with two thermistors and two conductivity cells, respectively. The sensors knownto perform better were used as primaries. The salinities derived from the two temperature andconductivity sensor pairs are very similar (usually within 0.001 of each other), and the salinitycalibration was monitored with water samples analyzed on a Guildline Autosal salinometer. Theaccuracy of the salinity data, determined from the Autosal measurements and supported by a post-cruise conductivity-sensor calibration, is≈0.001. The temperature and pressure sensors were alsopost-cruise calibrated, yielding accuracies of0.001◦C and0.5 dbar respectively.
The secondary CTD (SBE 19+) was equipped with one sensor each for pressure, tempera-ture and conductivity. The salinity bias of the secondary CTD was evaluated by comparisonswith data from the primary CTD in the deep basin south of the Lucky Strike seamount between2500 and2700 m, where the mean isobaric standard deviation of salinity reaches a minimum of1.5 × 10−4. Both salinity vs. depth and salinity vs. potential temperature indicate an identicalsalinity bias of−0.007 in the secondary CTD, which implies that there is no significant bias inthe SBE 19+ temperature data. The success of the salinity-bias correction is confirmed by theobservation that the isobaric potential-density standard deviation in the deep basin south of thesegment center for a mean profile derived from both CTDs (7 profiles collected over 11 days;2.3(±0.6) × 10−4) is similar to the corresponding standard deviation calculated from the primaryCTD alone (3 profiles collected over 12 hours;1.4(±0.6) × 10−4), whereas the corresponding stan-dard deviation of the combined data set before bias correction is more than an order of magnitudelarger (29.3(±0.6) × 10−4).
The light-scattering data from all our rift-valley profiles are associated with local minima be-tween 850 and950 m. In order to correct for cast-to-cast variability in the instrument response, e.g.due to dirt on the sensor window, the median instrument response of each cast in this depth rangewas used as a reference value for the profile, yielding the light-scattering anomalies used below.
The LADCP was programmed to record single-ping velocity ensembles in beam coordinates.The blanking distance was set to0 m and data from the first bin were discarded. In order to min-imize the effects of previous-ping interference, staggered pings (1 s/1.6 s) were used. Initially thebin length was set to4 m. During the first few casts proximity of the CTD/LADCP platform to theseabed was determined using a bottom switch, triggered by a steel ball suspended on a wire belowthe CTD frame. However, it was soon found that the acoustic reflections from the steel ball sig-nificantly degraded the LADCP data quality and the switch was removed after station 12. Duringtesting the ADCP was swapped with a spare after station 4 and the spare was left on during theremainder of the cruise because of its more audible ping. On station 14, the bin length was doubledto 8 m in order to increase the range and, thus, the data quality and this setup was kept for theremainder of the survey. The LADCP data from the casts carried out with the CTD bottom switchare not used here.
The LADCP data were processed both with the shear-method implementation of the Universityof Hawaii2 and with the Lamont inversion software3. The former uses the GPS-derived ship driftto constrain the barotropic velocities whereas the latter additionally makes use of shipboard ADCP
2http://currents.soest.hawaii.edu/software/ladcp3ftp://ftp.ldeo.columbia.edu/pub/LADCP/Version IX
7

JMR (in press) June24, 2008
project depth h.a.b. rec. start duration<dir.> <speed> % northward
DIVA 1570 m 130 m Jun2, 1994 407 days 201◦ 1.5 cm s−1 14–65%ATOS 1615 m 15 m Jul4, 2001 364 days 153◦ 2.8 cm s−1 18–41%
Table 1: Year-long current-meter data from the center of the Lucky Strike seamount; see Figure 11for mooring locations. Angle brackets indicate record averages; h.a.b. is height above bottom; thecolumn labeled “% northward” lists the incidence of northward flow in non-overlapping 2-weekdata segments.
and bottom-tracking data. Except for the early casts when the bottom switch was in place, thereis good agreement between the profiles processed with the two methods: The overallrms velocitydifference calculated from the20 m sub-sampled profiles without the bottom switch is3.7 cm s−1,which agrees well with the corresponding mean inversion-derived velocity error of3.4 cm s−1, andthe average ratio of the flow speed to the magnitude of the velocity differences (signal-to-noiseratio) is 3.2. (For comparison, the corresponding signal-to-noise ratio for the casts with the bottomswitch is only 1.4.) In many of the casts the instrument range (as calculated by the Lamont software)attains a minimum value of≈75 m between 1500 and1700 m. The LADCP data presented beloware inversion solutions.
During the GRAVILUCK cruise, a second300 kHz Teledyne/RDI Workhorse ADCP was de-ployed on the seabed for 14 days. It was mounted together with a battery case on a frame designedand constructed by the FSU current-meter facility. Since this package was deployed and recoveredwith the submersibleNautile it was possible to ensure that the instrument was oriented nearly ver-tically (pitch < 3.5◦), at accurately known position (32◦14.12 ′W, 37◦16.70 ′N) and depth (2078 m)and with unobstructed beam paths. The bottom-mounted ADCP was programmed to ping every6 sand record 1-minute ensemble averages in beam coordinates. The bin length was set to4 m, theblanking distance to zero and the data from the first bin were discarded, as were all beam velocitiesdetermined from less than 3 samples. The instrument recorded complete velocity time series in thebottom65 m; 100 m above the seabed only 15% of the velocities remain valid. One of the beamsperformed significantly worse than the others, resulting in an increase of 3-beam solutions from1%40 m above bottom to 95%100 m above the seabed.
In addition to the velocity data collected during the GRAVILUCK cruise, we also use 2 one-year-long current-meter records collected in 1994/95 (DIVA project; Jean-Baptisteet al., 1998;Khripounoff et al., 2000) and 2001/02 (ATOS project; Khripounoffet al., 2008) — see Table 1 fordetails.
c. Survey Design
A substantial fraction of the physical oceanography sampling during GRAVILUCK was car-ried out in the eastern passage between the eastern flank of the Lucky Strike volcano and theeastern rift-valley wall (Fig. 2), primarily because of the somewhat simpler channel topographycompared to the western passage. In order to account for tidal variability CTD/LADCP repeat
8

JMR (in press) June24, 2008
profiles were collected during different phases of the semidiurnaltide (as determined from a pre-cruise tidal analysis of the DIVA current-meter records). The 2-week averaged velocities recordedby the bottom-mounted ADCP near the eastern-passage sill is indistinguishable (within the un-certainties) from a corresponding ensemble-averaged LADCP profile constructed from 4 profilestaken during the same time interval within500 m of the sill (see Fig. 8 below). Furthermore, therms difference at2000 m between the bottom-mounted ADCP velocities and the individual LADCPcasts (4.2 cm s−1) is significantly larger than the corresponding velocity difference in the ensemble-averaged LADCP profile (2.5 cm s−1). These observations imply i) that tidal influence in the en-semble average is significantly reduced compared to individual profiles and ii) that the LADCP dataare of high quality. Additional evidence supporting these inferences is provided by the consistencyof the LADCP-derived circulation near the Lucky Strike seamount (see Section 3c below).
3. Hydrography and Flow
a. Regional Hydrographic Setting
Above the topography of the MAR, the regional hydrography near the Lucky Strike segment isdominated by the meandering Azores current/front, which forms the southern limit of the Mediter-ranean water tongue (Sy, 1988). Gould (1985) proposes two criteria to assess whether a givenstation lies north or south of the Azores Front, one for the depth of the15◦C isotherm and the otherfor the surface salinity: North of the front the15◦C isotherm is shallower than300 m, and typi-cally found near100 m — the corresponding mean value (±1standard deviation) observed duringGRAVILUCK is 250(±50) m. The surface salinity north of the Azores front is less than36.4 withtypical values near36.2 — the GRAVILUCK value is36.4(±0.1). Both criteria suggest that thesouthern edge of the frontal region was sampled. While it is not clear whether the criteria of Gould(1985) remain valid — recent satellite and float observations indicate a regional warming near thesurface of about1◦C compared to the 1980s — our interpretation is consistent with the locationof one of the branches of the Azores current apparent in satellite-altimetry data and with the factthat a strong salinity maximum associated with Mediterranean water (35.57 at998 m) was onlyobserved in a single profile. While the MAR in our study region does not constitute a solid barrierfor cross-ridge exchange above1000 m (Fig. 1) its apparent influence on the hydrography extendsthroughout the entire layer of Mediterranean water, as evidenced by a westward cross-ridge salinitydrop extending at least up to700 m in this region (e.g. Wilsonet al., 1995).
The hydrographic properties of the water within the rift valley are limited by the conditions atthe inflow sills (Saunders and Francis, 1985; Thurnherret al., 2002). In regions where there areappreciable along- or cross-ridge isopycnal gradients of hydrographic properties, such as temper-ature, salinity or oxygen, differences in rift-valley properties can be used to constrain the relativelocations of different inflows. In our study region the deepest sills connecting the rift valley tothe off-ridge water column are found at approximately1800 m (Fig. 1), i.e. significantly below thecore of the Mediterranean water. In order to assess the regional horizontal hydrographic gradientsat this depth we use data from a 1983 survey (TOPOGULF/3; Harvey and Arhan, 1988), whichconsists of a1000 × 1000 km box of CTD stations centered on the ridge crest near35◦N. The max-
9
JMR (in press) June24, 2008
Western-Passage SillEastern-Passage Sill
Eastern MAR FlankRift Valley
1000
1200
1400
1600
1800
2000
2200
2400
2600
2800
3000
Dep
th [m
]
36.5 36.6 36.7 36.8 36.9 37.0σ2
Western-Passage SillEastern-Passage Sill
Eastern MAR FlankNorthern BasinSouthern Basin
1000
1200
1400
1600
1800
2000
2200
2400
2600
2800
3000
Dep
th [m
]
0.00010.0001 0.001N [s-1]
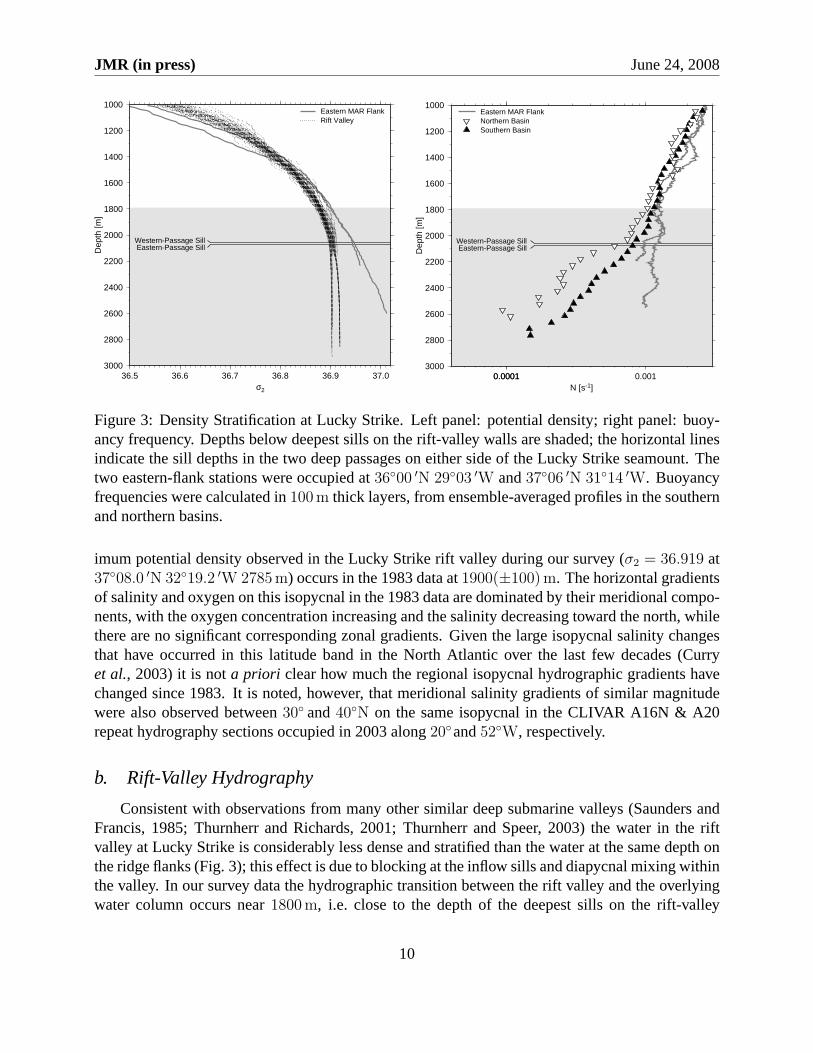
Figure 3: Density Stratification at Lucky Strike. Left panel: potentialdensity; right panel: buoy-ancy frequency. Depths below deepest sills on the rift-valley walls are shaded; the horizontal linesindicate the sill depths in the two deep passages on either side of the Lucky Strike seamount. Thetwo eastern-flank stations were occupied at36◦00 ′N 29◦03 ′W and37◦06 ′N 31◦14 ′W. Buoyancyfrequencies were calculated in100 m thick layers, from ensemble-averaged profiles in the southernand northern basins.
imum potential density observed in the Lucky Strike rift valley during our survey (σ2 = 36.919 at37◦08.0 ′N 32◦19.2 ′W 2785 m) occurs in the 1983 data at1900(±100) m. The horizontal gradientsof salinity and oxygen on this isopycnal in the 1983 data are dominated by their meridional compo-nents, with the oxygen concentration increasing and the salinity decreasing toward the north, whilethere are no significant corresponding zonal gradients. Given the large isopycnal salinity changesthat have occurred in this latitude band in the North Atlantic over the last few decades (Curryet al., 2003) it is nota priori clear how much the regional isopycnal hydrographic gradients havechanged since 1983. It is noted, however, that meridional salinity gradients of similar magnitudewere also observed between30◦ and40◦N on the same isopycnal in the CLIVAR A16N & A20repeat hydrography sections occupied in 2003 along20◦and52◦W, respectively.
b. Rift-Valley Hydrography
Consistent with observations from many other similar deep submarine valleys (Saunders andFrancis, 1985; Thurnherr and Richards, 2001; Thurnherr and Speer, 2003) the water in the riftvalley at Lucky Strike is considerably less dense and stratified than the water at the same depth onthe ridge flanks (Fig. 3); this effect is due to blocking at the inflow sills and diapycnal mixing withinthe valley. In our survey data the hydrographic transition between the rift valley and the overlyingwater column occurs near1800 m, i.e. close to the depth of the deepest sills on the rift-valley
10

JMR (in press) June24, 2008
σ2 = 36.86
σ2 = 36.90
Rift Valley (all profiles)Southern Basin (SB)Northern Basin (NB1)Northern Basin (NB2)
3.7
3.8
3.9
4.0
4.1
4.2
4.3
4.4
4.5
4.6
4.7
4.8
4.9
5.0
θ 0 [˚
C]
35.00 35.02 35.04 35.06 35.08 35.10 35.12Salinity
3.85
3.90
θ 0 [˚
C]
35.00 35.01 35.02Salinity
Figure 4: T/S properties in the rift valley; the inset shows a zoomedview illustrating the near-seabed properties in the northern basin (see text for details). Three example profiles discussed inthe text are marked with symbols.
walls in this region (Fig. 1). Within the rift valley, the density profiles separate into two distinctpopulations below≈2200 m. Inspection of the individual profiles reveals that all high-densityprofiles were collected south of the segment center in the southern basin and all lower-densityprofiles in the northern basin. As a consequence, the deep stratification is weaker in the northernthan in the southern basin (Fig. 3, right panel). In both deep basins the stratification near the seabedis very weak, with the buoyancy frequency in the northern basin below2600 m approaching thelocal value of the Coriolis parameter (f≈ 9 × 10⁻⁵ s−1).
The T/S properties of the rift-valley water are bracketed by warm/salty and cold/fresh endmembers, both with approximately linear (and parallel) T/S characteristics (Fig. 4). There is a sin-gle profile from the northern basin at37◦25 ′N 32◦25 ′W where only the cold/fresh end memberwas sampled (labeled “NB1” in the figure). At all other stations both cold/fresh and warm/saltywater was observed, often in multiple vertically alternating layers characterized by salinity “steps”of 0.01–0.02 (e.g. profiles “SB” & “NB2”). Similar interleaving signatures have been observedin the rift valley of the MAR before, both in the Lucky Strike segment (Wilsonet al., 1996) andelsewhere (e.g. near36◦15 ′N; Thurnherr and Richards, 2001). Inspection of individual profileswith interleaving layers indicates that the cold/fresh water is associated with higher levels of dis-solved oxygen than the warm/salty water. Combining the isopycnal salinity difference betweenthe two water-mass end members observed in the Lucky Strike segment (≈0.03) with the merid-ional salinity gradient on the 36.919σ2-isopycnal in the TOPOGULF/3 data between36◦ and39◦N (≈−1.5 × 10⁻⁴ km−1) implies that the warm/salty/oxygen-rich water enters the rift valley
11

JMR (in press) June24, 2008
σ2 = 36.86
σ2 = 36.90
Southern Basin (all profiles)
3.7
3.8
3.9
4.0
4.1
4.2
4.3
4.4
4.5
4.6
4.7
4.8
4.9
5.0θ 0
[˚C
]
35.00 35.02 35.04 35.06 35.08 35.10 35.12
Salinity
σ2 = 36.86
σ2 = 36.90
A
B
Northern Basin (2005 EXOMAR cruise)Northern Basin (2006 all profiles)
3.7
3.8
3.9
4.0
4.1
4.2
4.3
4.4
4.5
4.6
4.7
4.8
4.9
5.0
θ 0 [˚
C]
35.00 35.02 35.04 35.06 35.08 35.10 35.12Salinity
Figure 5: T/S properties in the deep southern and northern basins.Left panel: Southern basin; rightpanel: Northern basin, including data from a station occupied in 2005 (EXOMAR cruise); see textfor explanation of labels “A” and “B”.
≈200 km south of the cold/fresh/oxygen-poor water. Below, we will use the terms “northern-origin” and “southern-origin” to differentiate between the two water masses.
In order to elucidate the spatial distribution of the water masses in the Lucky Strike segmentit is useful to distinguish different density layers: At potential densities below 36.86 (correspond-ing to depths shallower than1700 and1660 m in the southern and northern basins, respectively)both southern- and northern-origin waters are found throughout our survey region (Fig. 5). Be-low this isopycnal the southern basin contains only water of southern origin (left panel). In thenorthern basin, the mix of southern- and northern-origin water extends all the way to the seabed(right panel). Approximately one year prior to our survey, two CTD profiles were collected inthe northern basin (star in Fig. 2) with the same CTD that was used a year later on thePourquoiPas ?. Comparison between the 2005 and 2006 data indicates that there was no significant changein the hydrographic properties (Fig. 5, right panel). The T/S properties in the northern basin be-low σ2 = 36.90 (≈2100 m) are particularly interesting: With a single exception (one of 4 pro-files collected near37◦24 ′N 32◦15 ′W), all deep northern-basin profiles show a transition be-tween southern-origin warm/salty water atσ2 = 36.90 (labeled “A” in the right panel of Fig. 5)and northern-origin cold/fresh water at the bottom (labeled “B”). In most profiles this transitioninvolves interleaving layers, as illustrated by example profile “NB2” in the inset of Figure 4.
12

JMR (in press) June24, 2008
Western-Passage SillEastern-Passage Sill
1400
1500
1600
1700
1800
1900
2000
2100
2200
2300
2400
2500
2600
2700
Dep
th [m
]
-0.02 -0.01 0.00 0.01 0.02∆σ2 [kg m-3]
Figure 6: Potential-density differences between the northernand southern basins; error bars showstandard deviations; negative values (shaded half space) indicate northward-decreasing densities;the sill depths in the two deep passages on either side of the Lucky Strike seamount are marked.
c. Rift-Valley Circulation
In order to quantify the along-segment potential-density gradients (Fig. 3), ensemble averageswere calculated from the 10 available CTD profiles in the northern and from the 7 profiles in thesouthern basin, ignoring depths with less than 5 samples. The isobaric density differences be-tween these mean profiles are characterized by two distinct layers, a lower one between1900 mand the seabed, where the density decreases toward the north, and an upper one between 1500and 1900 m, where the density increases toward the north (Fig. 6). Similar vertical dipoles ofalong-valley density gradients are commonly observed in deep submarine valleys; in a steady statethey are maintained by a balance between unidirectional along-axial advection (down-gradient inthe lower layer) and strong diapycnal mixing (Thurnherr and Speer, 2003). One particularly rel-evant example is found at another rift-valley site, approximately200 km south of Lucky Strike,where there is a vertical density-gradient dipole across a persistent overflow transporting≈0.1 Svof rift-valley water to the north and where the diapycnal diffusivities near the overflow are of order10−2 m2 s−1 (Thurnherr, 2006).
As expected from the sign of the along-valley density gradient below1900 m, the deep flowin the Lucky Strike rift valley during GRAVILUCK was predominantly to the north (Fig. 7). Theobserved currents near the seabed are strong, in particular in the eastern passage where the meannorthward velocity is≈10 cm s−1 with some values downstream of the sill exceeding20 cm s−1.The available velocity, hydrographic and mixing (microstructure) observations from the easternpassage are consistent with a hydraulically controlled overflow extending from the seabed at least
13

JMR (in press) June24, 2008
32˚20'W 32˚15'W
37˚14'N
37˚16'N
37˚18'N
37˚20'N
37˚22'Nvelocities at 1600m
10cm/s
2000m
2500m
32˚20'W 32˚15'W
37˚14'N
37˚16'N
37˚18'N
37˚20'N
37˚22'Nvelocities at 2000m
10cm/s
2000m
2500m
Figure 7:50 m layer-averaged velocities centered at1600 m (left panel) and2000 m (right panel).Black arrows: LADCP velocities that are significantly different from zero (speed> inversion-derived error estimate). Double arrow in right panel near37◦17 ′N 32◦14.5 ′W: 2-week averagedvelocity from the bottom-mounted ADCP. Topographic contour interval is100 m.
up to 1800 m (St. Laurent and Thurnherr, 2007). While sampling limitations prevent a definiteconclusion, it appears that the deep flow in the western passage is similar but somewhat weaker.
The maximum potential density observed at a station near the northern (downstream) end ofthe eastern passage (σ2 = 36.9034 at37◦20 ′N 32◦14 ′W 2154 m) provides an estimate for the max-imum density of the water flowing into the northern basin from the south. The transit time for flowthrough the passages (τt = l/u ≈ 28 hr, wherel ≈ 10 km is the passage length andu ≈ 10 cm s−1
is the mean along-passage velocity) is similar to but somewhat longer than a pendulum day atthis latitude (τf = 2π/f ≈ 20 hr), indicating that rotational effects play a role in the overflow dy-namics. The relevant Rossby radius is≈5 km (from Nh/f , whereN = 1.1(±0.3) × 10−3 s−1 isthe buoyancy frequency andh ≈ 400 m is the vertical extent over which the passages are laterallyclosed). The fact that the eastern passage is narrower than the deformation radius is consistent withthe lack of any apparent cross-passage shear of the along-passage flow. The width of the westernpassage is similar to the deformation radius, but our sampling is insufficient to determine whetherthere is a significant cross-valley shear of the along-axial flow there.
The apparent dominance of the “mean” flow over the variability in the deep eastern passageis quantitatively confirmed by kinetic-energy spectra calculated from the two-week-long record ofthe bottom-mounted ADCP deployed there: Motions with periods longer than56 hr (including themean flow) were over six times more energetic than the semidiurnal tides, which dominated thehigher-frequency variability and were associated withrms velocities of4.6 cm s−1. The time-seriesdata furthermore indicate that southward near-bottom flow in the eastern passage occurred less than3% of the time, consistent with the LADCP data where southward flow near the seabed is observedin only one out of the 18 available profiles from the eastern passage.
14

JMR (in press) June24, 2008
Western Passage LADCPEastern Passage LADCPEastern Passage BMADCP
1200
1300
1400
1500
1600
1700
1800
1900
2000
2100
Dep
th [m
]
-0.15 -0.10 -0.05 0.00 0.05 0.10 0.15Along-Valley Velocity [m/s]
Western Passage LADCPEastern Passage LADCPEastern Passage BMADCP
1200
1300
1400
1500
1600
1700
1800
1900
2000
2100
Dep
th [m
]
-0.15 -0.10 -0.05 0.00 0.05 0.10 0.15Cross-Valley Velocity [m/s]
Figure 8: Ensemble-averaged velocity profiles near the sills inthe deep passages on both sides ofthe Lucky Strike volcano; negative half spaces are shaded. Left panel: along-channel velocities(20◦ true); right panel: cross-channel velocities (110◦ true). The western-passage LADCP averageis derived from 3 profiles; that from the eastern passage from 4, and the bottom-mounted ADCP(BMADCP) recorded velocities for 14 days. Error bars show standard errors of the means, assum-ing sample independence for individual LADCP profiles and semi-diurnal tidal dominance of thevariability for the bottom-mounted ADCP data.
Above the overflows at1600 m the instantaneous velocities recorded by the LADCP are char-acterized by greater variability and the dominance of northward flow is restricted to the easternpart of the rift valley (Fig. 7, left panel). No coherent circulation was observed over the LuckyStrike seamount, where two out of the 6 LADCP profiles with significant velocities at1600 m showsouthward flow. Since the (arbitrarily referenced) M2 phases of the two profiles associated withsouthward flow at1600 m are similar to each other (232◦and266◦), but considerably different fromthe phases of the other four profiles (52◦, 54◦, 172◦and355◦), we interpret the variability apparent inthe LADCP measurements as primarily caused by the tides, rather than by spatial variability. Thisinference is consistent with the long-term current-meter records from the center of the Lucky Strikevolcano, which confirm significant probabilities for both north- and southward flows throughout theentire durations of the records (rightmost column in Table 1).
d. Along-Segment Transport
In order to remove the effects of tidal variability as much as possible, ensemble-averaged ve-locity profiles were calculated from the available LADCP data near the controlling sills in theeastern and western passages (Fig. 8). The deep cross-sill flows in both passages are northwardwith time-averaged speeds near the seabed of5–10 cm s−1. Significant northward velocities in the
15

JMR (in press) June24, 2008
Western PassageEastern PassageEntire Rift Valley
1300
1400
1500
1600
1700
1800
1900
2000
Dep
th [m
]
0.00 0.05 0.10 0.15 0.20 0.25 0.30Vertically Integrated Transport [Sv]
Figure 9: Vertically integrated along-valley transport calculatedfrom the mean velocity profiles inthe two deep passages (Fig. 8) and the rift-valley cross section at37◦18 ′N. Below1600 m, separatetransports were calculated for the eastern and western passages; above1600 m, the eastern andwestern velocity profiles were averaged and integrated over the entire width of the rift-valley.
eastern passage extend throughout the entire depth of the rift valley, whereas the northward flowin the western passage is restricted to depths below1800 m. Above1900 m the ensemble-averagedLADCP velocities in the western passage are not significantly different from zero; however, thedata are suggestive of a weak mean southward return flow above1750 m. As expected, the cross-channel velocities are significantly smaller than the corresponding along-channel velocities. Themonotonic vertical shears in the cross-channel velocities below1850 m observed in both deep pas-sages are consistent with observations from other overflows and are most likely the signatures ofbottom Ekman layers (Johnson and Sanford, 1992), supporting our previous inference that rota-tional effects play a role in the overflow dynamics (Section 3c).
Combining the mean along-passage velocities with the rift-valley geometry at the latitude ofthe controlling sills yields an estimate of the along-valley transport (Fig. 9). Below1800 m, thenorthward flows in both passages contribute significantly to the total while the currents in andabove the eastern passage dominate the along-valley transport at shallower depths.
4. Hydrothermal Particle Plumes
Neutrally buoyant hydrothermal plumes resulting from high-temperature venting are rich inparticles and, therefore, associated with significant light-scattering anomalies that can sometimesbe traced several 10s ofkm from their sources (e.g. Thurnherr and Richards, 2001). The distribu-
16

JMR (in press) June24, 2008
Northern Basin
Lucky Strike VolcanoSouthern Basin
HEAT station 8 (1994)
1000
1100
1200
1300
1400
1500
1600
1700
1800
1900
2000
2100
2200
2300
2400
2500
Dep
th [m
]
0.000 0.005 0.010 0.015 0.020 0.025
Light-Scattering Anomaly [V]
36.580
36.668
36.717
36.764
36.801
36.823
36.842
36.863
36.878
36.888
36.899
36.906
36.911
36.914
36.916
36.917
σ 2
Figure 10: Lucky Strike light-scattering (STM) anomalies in density space. The right-hand y-axisindicates the mean depths of the isopycnals in the southern basin. The three profiles with errorbars show density-averaged GRAVILUCK light-scattering anomalies in the southern basin, overthe Lucky Strike volcano, and in the northern basin, respectively; the corresponding stations areenclosed by grey dashed circles in Figure 2. For clarity, the profile from the volcano has beenhorizontally offset by0.01 V. The error bars show the minimum and maximum values in eachdensity bin. The light-grey dots show an the arbitrarily scaled nephelometry profile occupied in1994 near the southern end of the segment (pentagon in Fig. 2; Germanet al., 1996).
tion of the light-scattering anomalies in the Lucky Strike rift valley observed during GRAVILUCKis characterized by a generally downward-increasing trend on which the distinct peaks of neu-trally buoyant hydrothermal particle plumes are superimposed (Fig. 10). Outside the hydrothermalplume peaks the particle load below≈1400 m in the northern basin is consistently higher than thecorresponding particle load at the same densities in the southern basin.
Whereas no distinct hydrothermal-plume signatures were observed north of the Lucky Strikevolcano during GRAVILUCK, the three light-scattering profiles from the deep southern basin (aswell as a subset of the eastern-passage profiles) show a≈400 m-thick plume centered near the36.878 isopycnal (≈1800 m). A nephelometry profile collected in 1994 near the southern end ofthe segment is associated with a distinct light-scattering peak in the same density range (grey dotsin Fig. 10). While the different light-scattering instruments used during the 1994 HEAT cruiseand GRAVILUCK preclude a quantitative comparison, the qualitative similarities between the1994 plume and our southern-basin observations nevertheless suggest a common source. Both thefact that no northern-origin water was observed during GRAVILUCK in the southern basin below1700 m (Section 3b) and the observed northward along-valley transport in the depth range of thisplume (Fig. 9) imply a source south of the southernmost of the GRAVILUCK light-scattering sta-tions. While buoyant high-temperature hydrothermal plumes rise rapidly from their sources, light-
17

JMR (in press) June24, 2008
scattering anomalies nevertheless commonly extend all the wayto the source depth (e.g. Thurnherrand Richards, 2001). Therefore, we surmise that the most likely depth of the unknown hydrother-mal vent field in the south of the Lucky Strike segment is≈2000 m.
During GRAVILUCK, optical anomalies associated with the hydrothermal plumes rising fromthe known vents at Lucky Strike were observed directly over the Lucky Strike seamount (Fig. 10).The fact that this segment-center plume occupies a different density range than the southern-basinplume supports our inference of two separate sources. Averaging the light-scattering profiles inpressure or depth space yields the same conclusion: The southern-basin plume peaks at1800 m,≈150 m deeper than the segment-center plume. These observations are consistent with the fact thatthe along-segment density differences in the depth range of the plumes (<0.01; Fig. 6) are smallcompared to the density difference between the two plume peaks (≈0.03; Fig. 10). Apart fromthe profiles collected directly over the Lucky Strike seamount, no hydrothermal particle anomalieswere observed in the density range of the segment-center plume elsewhere in our survey region.
5. Discussion
a. Synthesis of Observations
The observations of the rift-valley hydrography and velocity field at Lucky Strike obtainedduring GRAVILUCK indicate a remarkably simple dynamical setting, characterized by mean flowtoward the north and a vertical dipole of along-stream horizontal density gradients. Below1900 mthe density decreases along the path of the flow, while there is a streamwise density increase ofsimilar magnitude between1500 and1900 m. The strongest along-valley flow was observed inthe deep passages on both sides of the Lucky Strike seamount where the cross-sectional area ofthe rift valley is smallest. The observed cross-sill density drop below1900 m is consistent withhydraulic control, as inferred from a detailed analysis of the CTD, LADCP and microstructuredata from the eastern passage by St. Laurent and Thurnherr (2007). Above the summit depth ofthe Lucky Strike seamount the northward flow takes place in a boundary current along the easternrift-valley wall. Within the two overflows and in the boundary current above the eastern passagethe low-frequency currents are stronger than the temporal variability, while the semidiurnal tidedominates the instantaneous velocity field over the Lucky Strike seamount and above the westernpassage. Overall, these observations are highly reminiscent of the situation in the rift valley inthe vicinity of the Rainbow hydrothermal vent field near36◦N, where similarly strong northwardflow and a corresponding vertical dipole of along-segment density gradients are associated witha hydraulically controlled overflow and strong mixing (Thurnherr and Richards, 2001; Thurnherret al., 2002; Thurnherr, 2006).
Combined, the two overflows in the Lucky Strike segment center transport≈0.2 Sv of rift-valley water toward the north. Approximately half of this southern inflow into the northern basintakes place below1800 m, where the basin is entirely closed, implying that at least0.1 Sv of over-flow water must upwell within the basin, again similar to the situation in the rift valley near36◦N(Thurnherret al., 2002). However, the presence of northern-origin water near the seabed in allhydrographic profiles from the northern basin (both in 2005 and 2006) implies an additional source
18

JMR (in press) June24, 2008
for the densest water observed there. This inference is supportedby the close agreement betweenthe isopycnal marking the upper limit of the transition between southern- and northern-origin waterin the northern basin (σ2 ≈ 36.90; Section 3b) and the densest water observed near the downstreamend of the eastern passage (σ2 = 36.9034; Section 3c). The most likely inflow location for thenorthern-basin bottom water is the deepest sill connecting the rift valley to the western MAR flanknear38◦N 32◦45 ′W (labeled “A” in Fig. 1). We surmise, therefore, that, on average, the sill in thenorthwestern corner of the northern basin acts as an additional inflow, rather than as an outflow and,thus, that significantly more than0.1 Sv of water upwell in the northern half of the Lucky Strikesegment.
b. Hydrothermal Particle Plumes & Their Sources
The simplicity of the circulation in the Lucky Strike segment encountered during GRAVILUCKallows us to infer the source locations of the hydrothermal particle plumes with much greater con-fidence than has been possible in previous studies. We observed two distinct hydrothermal particleplumes, one between 1700 and2000 m in the southern basin and in the eastern passage, and theother over the summit of the Lucky Strike volcano below1580 m. The known vents at LuckyStrike are almost certainly the source of the latter, implying a mean plume rise of≈100 m duringour survey. The apparent reduction in rise height compared to the FAZAR data collected in 1992(Wilson et al., 1996) may indicate a reduction in heat flux or a change in effluent chemistry. Giventhe predominantly northward flow within the segment, as well as the fact that the light-scatteringmaximum in the southern basin (1800 m) was observed below the depth of the known vents atLucky Strike (1700 m), we conclude that the southern-basin plume emanates from a separate, not-yet-discovered hydrothermal source south of the Lucky Strike volcano.4 The depth range of thesouthern-basin light-scattering plume observed during GRAVILUCK coincides closely with that ofa single plume profile recorded in 1994 in the rift valley approximately25 km south of the LuckyStrike volcano (Germanet al., 1996), suggesting the same hydrothermal source, most likely nearthe southern end of the Lucky Strike segment at≈2000 m.
In contrast to the segment center and the southern basin, we did not observe any particle-plumesignatures north of the Lucky Strike volcano, in spite of the fact that both the particles from theLucky Strike vents and from the southern source are advected there by the mean flow. The apparent“disappearance” of the hydrothermal particles is most likely due to the strength of the diapycnalmixing in the deep passages (St. Laurent and Thurnherr, 2007), spreading the hydrothermal parti-cles throughout the entire depth of the rift valley. This inference is supported by the observationthat, outside the depth range of the southern-source plume, the light scattering in the rift valleybelow1400 m is consistently higher in the northern than in the southern basin.
There are several possible reasons why the southern-source plume was observed several 10s ofkilometers from its likely source while the plume emanating from the Lucky Strike hydrothermalfield was only observed within a kilometer from the vents. First, it is possible that the mixingbetween the southern source and the Lucky Strike segment center is too weak to effectively “mix
4Thesouthern-basin plume is also too deep to be related to the somewhat mysterious “Menez Hom” site, which,according to Jean-Baptisteet al. (2008), is a low-temperature source located at a latitude of37◦08 ′N near1790m.
19

JMR (in press) June24, 2008
away” the particle plume before it reaches the overflows. Second,chemical differences between theeffluents of the two sources may either cause the southern-source plume to precipitate significantlymore particles than the plume rising from the Lucky Strike vents or the southern-source particlesmay be more neutrally buoyant than the Lucky Strike particles, resulting in less settling. Finally,it is also possible of course that the southern source is associated with significantly higher heatand chemical fluxes than the Lucky Strike vent field. While we do not have any evidence for sucha difference we note that the only other known particle plume that can be traced several 10s ofkilometers from the corresponding source in the rift-valley of the MAR occurs at the Rainbowhydrothermal vent field, which is associated with significantly higher fluxes of heat (Thurnherr andRichards, 2001; Jean-Baptisteet al., 2004) and particles (Khripounoffet al., 2001) than the LuckyStrike vents (Wilsonet al., 1996).
c. Representativeness of the Survey Data For Longer Timescales
There is significant circumstantial evidence suggesting that the deep flow in the Lucky Strikerift valley was northward not just in 2006, but also during all other surveys we are aware of (in 1992,1994 and 2005), i.e. that the GRAVILUCK observations are representative for the flow on muchlonger time scales. First, we reiterate that the interleaving signatures observed in the rift-valleyT/S properties both in 2005 and 2006 require two distinct water sources meridionally separatedby several hundreds of kilometers (Section 3b) and, therefore, unidirectional advection along aconsiderable stretch of rift valley. While the MAR topography precludes advection into the LuckyStrike segment below1800 m from the north, the deep rift valley extends continuously south to theOceanographer fracture zone near35◦N. Therefore, we infer that northward flow in the rift valleyof the Lucky Strike segment in 2005 and 2006 is required in order to account for the observedinterleaving signatures. Wilsonet al. (1995) also discuss interleaving in the Lucky Strike segmentand a comparison of their Figure 8 (or Figure 2 of Wilsonet al., 1996) to our Figure 4 indicates thatthe interleaving signatures observed in 1992 are qualitatively and quantitatively very similar to ours,i.e. they also require northward flow in the rift valley. While Germanet al. (1996) do not discussthe rift-valley hydrography an inspection of their CTD data reveals nevertheless that interleavingsignatures of very similar magnitude were also observed in 1994, again implying northward flow.Furthermore, the available hydrothermal-plume data from 1992 and 1994 are also fully consistentwith northward flow in the rift valley, as the Lucky Strike vents are too shallow to account forthe plumes observed south of the Lucky Strike volcano below1700 m (Klinkhammeret al., 1995;Wilson et al., 1996; Germanet al., 1996).
The inference of northward rift-valley flow in 1992 is strongly supported by a hydrographicsection along the axis of the MAR, which is characterized by a monotonic northward density de-crease below1800 m between35◦40 ′N and the northernmost deep rift-valley station at37◦N, i.e.the monotonic density gradient spans the South AMAR, AMAR, FAMOUS, and North FAMOUSsegments (Wilsonet al., 1995). It requires predominantly northward flow as there is no mechanismthat could cause a streamwise densification of the bottom water in a laterally enclosed valley. Thedata suggest, therefore, that the northward velocities observed during our survey are part of a co-herent along-valley flow that begins≈250 km south of Lucky Strike. Direct evidence for long-term
20

JMR (in press) June24, 2008
32˚17'W 32˚16'W
37˚17'N
37˚18'N
5cm/s
1600m
1700m
1800m
Figure 11: Velocity observations at1600 m around the eastern group of peaks of the Lucky Strikevolcano. Topographic contour interval is20 m; the1700 m isobath is marked with a white contour.Wide black arrows show record means of the available long-term current-meter data (Table 1).Narrow gray arrows show the GRAVILUCK LADCP data, which are dominated by the semidiurnaltides at this location (Section 3c). Small black triangles mark the locations of the currently knownhydrothermal sources (J. Escartın, personal communication).
persistence of this larger-scale northward flow in the rift valley is provided by current-meter datafrom the FAMOUS segment near36◦45 ′N, where continuous strong northward flow was observedduring a 46-day deployment in 1972 (Kelleret al., 1975), and from the Rainbow hydrothermal siteat36◦15 ′N, where persistent strong northward along-valley flow was observed on two sets of moor-ings deployed for an entire year in 1997/98 (Khripounoffet al., 2001; Thurnherret al., 2002). Theobservation in 1998 of an inflow into the rift valley from the eastern North Atlantic near35◦35 ′N34◦10 ′W (Thurnherret al., 2002), i.e. approximately250 km south of the Lucky Strike vent field,is fully consistent with our inferences.
During our survey the northward flow at Lucky Strike extended significantly above1600 mwhere two current meters deployed on the summit of the volcano had recorded southward year-long mean flows in 1994/95 and 2001/02 (Table 1 & Fig. 11). While this apparent difference inmean-flow direction could be attributed to interannual variability, it should be noted that the north-ward flow at this depth during our survey took place primarily in a boundary current along theeastern wall of the rift valley, whereas individual velocity samples over the summit of the vol-cano were dominated by the semidiurnal tide (Section 3c). Therefore, there is no contradictionbetween our LADCP data from the summit of the Lucky Strike volcano and the available year-longcurrent-meter records. This inference is supported by the observation of both south- and northwardtwo-week-averaged mean velocities throughout the entire 1994/95 current-meter record, northward
21

JMR (in press) June24, 2008
flow accounting for≈30%of the 2-week averages. Therefore, it is not possible to determine thedirection of the yearly averaged low-frequency flow over the summit of the Lucky Strike volcanoat1600 m from our 2-week survey.
In contrast to the 1994/95 data, the longest run of northward mean daily averaged flow in the2001/02 current-meter record lasted only 3 days. The fact that these data were recorded in closeproximity to the seabed (15 mabove bottom) suggests that nearby topography may have affected thevelocities. Topographic influence is also suggested by the close alignment of the yearly-averagedmean-flow directions of both current-meter records with nearby topographic contours (Fig. 11),which is qualitatively consistent with a cyclonic (counterclockwise) recirculation around the east-ernmost peak of the Lucky Strike volcano. The GRAVILUCK data are insufficient to determinewhether such a re-circulation existed in August 2006.
d. Larger Context & Implications
All available data that we are aware of indicate that the overflows in the Lucky Strike segmentare part of a contiguous persistent northward rift-valley flow that extends≈250 km to the south(Section 5c). This flow field has important consequences for the dispersal of hydrothermal organ-isms between the vent sites in this region of the MAR, as northward advection is strongly favored.For example, a sufficiently long-lived demersal larva released into the rift valley at the Rainbowhydrothermal field near36◦15 ′N can conceivably settle at Lucky Strike (or at any of the interveningvent fields), whereas dispersal in the opposite direction is much less probable.
The depth of the MAR crest in this region decreases toward the north, because of the influenceof the Azores hotspot; i.e. the water in the rift valley flows uphill. Considering also the high rates ofdiapycnal mixing in the valley both at Lucky Strike (St. Laurent and Thurnherr, 2007) and furthersouth (Thurnherret al., 2002), the rift-valley dynamics are highly reminiscent of the situation innumerous canyons corrugating the western flank of the MAR in the South Atlantic, where thereare persistent low-frequency up-flank flows down the density gradients and high rates of diapycnalmixing (St. Laurentet al., 2001; Thurnherret al., 2002; Thurnherret al., 2005). It is also worthnoting that both in the rift valley and in one relatively well sampled ridge-flank canyon in theSouth Atlantic a significant portion of the diapycnal mixing appears to be associated with overflows(Thurnherret al., 2002; Thurnherret al., 2005; Thurnherr, 2006; St. Laurent and Thurnherr, 2007),which suggests that overflow mixing may be much more important for closing the overturningcirculation than is generally accepted. Regardless, however, to what degree the diapycnal fluxestaking place on the rough mid-ocean ridge topography are associated with hydraulic processes,such overflows are ideal monitoring sites. Simultaneously instrumenting, for example, severaldistant overflows in the same valley would allow both the integrated diapycnal and the verticalfluxes between the overflows to be determined.
ACKNOWLEDGMENTS. We highly appreciate the shiptime offered to us by V. Ballu, chief sci-entist of the GRAVILUCK project, as well as instrumental and personnel support from DT-INSU.The officers and crew of the French research vesselL’Atalante, as well as theNautile submersibleteam enthusiastically supported our efforts and ensured the scientific success of our project. The
22

JMR (in press) June24, 2008
survey work was funded by the US National Science Foundation undergrant #0550730, with addi-tional support from the French IDAO/LEFE GRAVILUCK project. Free access to data from earlierexpeditions provided by A. Godfroy, C. Wilson and C. German is gratefully acknowledged.
References
Baker, E. T. and C. R. German. 2004. On the global distribution of hydrothermal vent fields,inMid-Ocean Ridges: Hydrothermal Interactions Between the Lithosphere and Oceans, Geo-physical Monograph Series,148, C. R. German, J. Lin, and L. M. Parson, eds., 245–266.
Cannat, M., A. Briais, C. Deplus, J. Escartın, J. Georgen, J. Lin, S. Mercouriev, C. Meyzen,M. Muller, G. Pouliquen, A. Rabain, and P. da Silva. 1999. Mid-Atlantic Ridge–Azoreshotspot interactions: Along-axis migration of a hotspot-derived event of enhanced magma-tism 10 to 4 Ma ago. Earth Planet. Sci. Lett.,173, 257–269.
Converse, D. R., H. D. Holland, and J. M. Edmond. 1984. Flow rates in the axial hot springs ofthe East Pacific Rise (21◦N): Implications for the heat budget and the formation of massivesulfide deposits. Earth Planet. Sci. Lett.,69, 159–175.
Curry, R., B. Dickson, and I. Yashayaev. 2003. A change in the freshwater balance of the AtlanticOcean over the past four decades. Nature,426, 826–829.
Elderfield, H. and A. Schultz. 1996. Mid-ocean ridge hydrothermal fluxes and the chemicalcomposition of the ocean. Annu. Rev. Earth Planet. Sci.,24, 191–224.
German, C. R., E. T. Baker, and G. Klinkhammer. 1995. Regional setting of hydrothermal activ-ity. Geol. Soc. London Spec. Publ.,87, 3–15.
German, C. R., L. M. Parson, and the HEAT Scientific Team. 1996. Hydrothermal explorationat the Azores triple-junction: Tectonic control of venting at slow-spreading ridges? EarthPlanet. Sci. Lett.,138, 93–104.
Gould, W. J.. 1985. Physical oceanography of the Azores front. Prog. Oceanogr.,14, 167–190.
Harvey, J. and M. Arhan. 1988. The water masses of the central North Atlantic in 1983–84. J.Phys. Oceanogr.,18, 1855–1875.
Herring, P.. 2002.The Biology of the Deep Ocean. Oxford University Press.
Jean-Baptiste, P., H. Bougault, A. Vangriesheim, J. L. Charlou, J. Radford-Knoery, Y. Fouquet,D. Needham, and C. German. 1998. Mantle3He in hydrothermal vents and plume of theLucky Strike site (Mid-Atlantic Ridge36◦17 ′N) and associated geothermal heat flux. EarthPlanet. Sci. Lett.,157, 69–77.
Jean-Baptiste, P., E. Fourre, J.-L. Charlou, C. R. German, and J. Radford-Knoery. 2004. Heliumisotopes at the Rainbow hydrothermal site (Mid-Atlantic Ridge, 36:14N). Earth Planet. Sci.Lett., 221, 325–335.
23

JMR (in press) June24, 2008
Jean-Baptiste, P., E. Fourre,A. Dapoigny, J. L. Charlou, and J.-P. Donval. 2008. Deepwater man-tle 3He plumes over the northern Mid-Atlantic Ridge (36◦N–40◦N) and the Azores Platform.Geochem. Geophys. Geosyst.,9, Q03010.
Johnson, G. C. and T. B. Sanford. 1992. Secondary circulation in the Faroe Bank Channel out-flow. J. Phys. Oceanogr.,22, 927–933.
Keller, G. H., S. H. Anderson, and J. W. Lavelle. 1975. Near-bottom currents in the Mid-AtlanticRidge rift valley. Can. J. Earth Sci.,12, 703–710.
Khripounoff, A., T. Comtet, A. Vangriesheim, and P. Crassous. 2000. Near-bottom biologicaland mineral particle flux in the Lucky Strike hydrothermal vent area (Mid-Atlantic Ridge).J. Mar. Syst.,25, 101–118.
Khripounoff, A., A. Vangriesheim, P. Crassous, M. Segonzac, A. Colaco, D. Desbruyeres, andR. Barthelemy. 2001. Particle flux in the Rainbow hydrothermal vent field (Mid-AtlanticRidge): Dynamics, mineral and biological composition. J. Mar. Res.,59, 633–656.
Khripounoff, A., A. Vangriesheim, P. Crassous, M. Segonzac, V. Lafon, and A. Waren. 2008.Temporal variation of currents, particulate flux and organism supply at two deep-sea hy-drothermal fields of the Azores Triple Junction. Deep Sea Res. I:,55, 532–551.
Klinkhammer, G. P., C. S. Chin, C. Wilson, and C. R. German. 1995. Venting from the Mid-Atlantic Ridge at37◦17 ′N: The Lucky Strike Hydrothermal Site. Geol. Soc. London Spec.Publ.,87, 87–96.
Langmuir, C., S. Humphris, D. Fornari, C. VanDover, K. VonDamm, M. K. Tivey, D. Colodner,J. L. Charlou, D. Desonie, C. Wilson, Y. Fouquet, G. Klinkhammer, and H. Bougault. 1997.Hydrothermal vents near a mantle hot spot: The Lucky Strike vent field at37◦N on theMid-Atlantic Ridge. Earth Planet. Sci. Lett.,148, 69–91.
McDuff, R. E.. 1995. Physical dynamics of deep-sea hydrothermal plumes,in Seafloor Hy-drothermal SystemsS. E. Humphris, R. A. Zierenberg, L. S. Mullineaux, and R. E. Thomson,eds., Physical, Chemical, Biological, and Geological Interactions.
Mullineaux, L. S., P. H. Wiebe, and E. T. Baker. 1995. Larvae of benthic invertebrates in hy-drothermal vent plumes over Juan-de-Fuca Ridge. Marine Biology,122, 585–596.
Otto, T. D. and A. M. Thurnherr. 2007. Efficient algorithms for finding sills in digital topographicmaps. Computers and Geosciences,33, 678–684.
Saunders, P. M. and T. J. Francis. 1985. The search for hydrothermal sources on the Mid-AtlanticRidge. Prog. Oceanogr.,14, 527–536.
St. Laurent, L. C., J. M. Toole, and R. W. Schmitt. 2001. Buoyancy forcing by turbulence aboverough topography in the abyssal Brazil Basin. J. Phys. Oceanogr.,31, 3476–3495.
St. Laurent, L. C. and A. M. Thurnherr. 2007. Intense mixing of lower thermocline water on thecrest of the Mid-Atlantic Ridge. Nature,448, 680–683.
24

JMR (in press) June24, 2008
Sy, A.. 1988. Investigation of large-scale circulation patternsin the central North Atlantic: TheNorth Atlantic Current, the Azores Current, and the Mediterranean Water plume in the areaof the Mid-Atlantic Ridge. Deep Sea Res., Part A,35, 383–413.
Thurnherr, A. M. and K. J. Richards. 2001. Hydrography and high-temperature heat flux of theRainbow hydrothermal site (36◦14 ′N, Mid-Atlantic Ridge). J. Geophys. Res.,106, 9411–9426.
Thurnherr, A. M., K. J. Richards, C. R. German, G. F. Lane-Serff, and K. G. Speer. 2002. Flowand mixing in the rift valley of the Mid-Atlantic Ridge. J. Phys. Oceanogr.,32, 1763–1778.
Thurnherr, A. M. and K. G. Speer. 2003. Boundary mixing and topographic blocking on theMid-Atlantic Ridge in the South Atlantic. J. Phys. Oceanogr.,33, 848–862.
Thurnherr, A. M., L. C. St. Laurent, K. G. Speer, J. M. Toole, and J. R. Ledwell. 2005. Mixingassociated with sills in a canyon on the mid-ocean ridge flank. J. Phys. Oceanogr.,35, 1370–1381.
Thurnherr, A. M.. 2006. Diapycnal mixing associated with an overflow in a deep submarinecanyon. Deep Sea Res. II,53, 194–206.
Wilson, C., K. Speer, J.-L. Charlou, H. Bougault, and G. Klinkhammer. 1995. Hydrographyabove the Mid-Atlantic Ridge (33◦– 40◦N) and within the Lucky Strike segment. J. Geophys.Res.,100, 20,555–20,564.
Wilson, C., J. L. Charlou, E. Ludford, G. Klinkhammer, C. Chin, H. Bougault, C. German,K. Speer, and M. Palmer. 1996. Hydrothermal anomalies in the Lucky Strike segment on theMid-Atlantic Ridge (37◦17 ′N). Earth Planet. Sci. Lett.,142, 467–477.
25