hydrologic processes and watershed response evaporation, infiltration, ... on hydrologic processes...
TRANSCRIPT

133
introduction
Streamflow reflects the complex interactions be-tween the weather and the biophysical environ-ment as water flows through the hydrologic cycle. It represents the balance of water that remains after all losses back to the atmosphere and storage opportu-nities within a watershed have been satisfied. This chapter describes the hydrologic processes that affect the generation of streamflow in British Columbia’s watersheds. These processes include precipitation, interception, evaporation, infiltration, soil mois-ture storage and hillslope flow, overland flow, and groundwater. The processes and their spatial and temporal variability are described at both the stand
and watershed scales. Understanding how stream-flow is generated is vital in evaluating the effects of forest disturbance on hydrologic response and in identifying best management practices in a water-shed. Chapter 7 (“The Effects of Forest Disturbance on Hydrologic Processes and Watershed Response”) describes how forest disturbances, such as insects, fire, logging, or silviculture, alter both stand-scale processes and watershed response as streamflow. The discussion in the current chapter is organized by surface and subsurface processes, beginning with precipitation and ending with streamflow.
Hydrologic Processes and Watershed Response
Chapter 6
Rita D. Winkler, R.D. (Dan) Moore, Todd E. Redding, David L. Spittlehouse, Darryl E. Carlyle-Moses, and Brian D. Smerdon
surface Processes
Forest vegetation directly affects the amount of water available for streamflow through the interception of rain and snow, the evaporation of intercepted water, and through transpiration. Altering forest vegetation can have an important influence on water balances at the site and watershed scale. In the hydrologic cycle (Figure 6.1), the forest canopy is the first surface that intercepts and stores precipitation, resulting in some amount (depending on canopy characteristics) re-turning to the atmosphere through sublimation and
evaporation. Water also returns to the atmosphere through transpiration and by evaporation from the forest floor, soil surface, and open water bodies, such as lakes and wetlands (Figure 6.1). Forest vegetation reduces the rate at which snow melts and hence the rate of soil moisture recharge and downslope flow (Spittlehouse and Winkler 2002).
A water balance equation is often used to express the contributions of these processes to streamflow. At the watershed scale, the water balance equation

134
links streamfl ow (R), precipitation (P), evaporation (E), losses to regional groundwater (G), and changes in watershed storage (∆S):
R = P – E – G ± ∆S (1)
where the variables are measured in water depth equivalent (millimetres) over time. Th e quantity G represents water that leaves the watershed as ground-water and thus does not contribute to streamfl ow.
Watershed storage includes water stored as snow, surface water (lakes, ponds, depression storage), glacier ice, soil moisture, and groundwater. As water fl ows through a watershed, it oft en moves between these storage compartments before discharging to a stream or being lost through evaporation and transpiration. For example, meltwater draining from a snowpack and infi ltrating the soil represents a loss of snowpack storage and a gain of soil moisture, but with no net eff ect on total watershed storage.
At smaller spatial scales, the site or stand wa-ter balance equation links soil water storage (W), precipitation (P), interception (I), overland fl ow (O), infi ltration (F = P – I – O), plant transpiration (Et), evaporation from the soil surface (Es), and drainage from the root zone (D):
∆W = F – Et – Es – D (2)
where ∆W is the change in soil water storage (mil-limetres) over time. During winter in areas where precipitation falls as snow, there is a delay in infi l-tration until snowmelt: Es is zero when snow covers the ground, and water content change depends only on drainage from the root zone except where tree transpiration occurs during snowmelt (Spittlehouse 2002). Th ese processes are discussed in detail in the following sections. Equation 2 does not account for lateral downslope fl ow of soil water, and therefore may not be applicable on hillslopes.
Precipitation
Precipitation is defi ned as liquid (rain) or frozen (sleet, hail, graupel, snow) water, or a combination of both, falling from the sky. Water is also depos-ited at the land surface through condensation (e.g., dew, fog, rime, and hoar frost) (UNESCO and World Meteorological Association, International Hydrology Program 1998). British Columbia’s precipitation re-gimes are a result of weather systems that are typical of mid-latitudes on the east side of the Pacifi c Ocean
FIGURE 6.1 The hillslope hydrologic cycle and stand water balance.
Precipitation
Evapotranspiration
Evaporation
OverlandFlow
StreamFlow
Groundwater Flow
ReturnFlow
Baseflow
SubsurfaceFlow
GroundwaterRecharge
Infiltration
DepressionStorage
Precipitation
Transpiration
Interception loss
Through-fall
Stem-flow
RootZone
Drainage
{ Infiltration
Evaporation
LateralFlow
135
and that interact with the mountain ranges and val-leys paralleling the coast. Alternating sequences of eastward-flowing high- and low-pressure systems, incursions of arctic air, and flows from the midwest-ern United States interact with topography to pro-duce precipitation regimes including wet coastal, dry interior, moist northern, and snow-dominated high elevations (Hare and Thomas 1974; Phillips 1990; also see Chapter 3, “Weather and Climate”).
Precipitation and other climatic elements vary seasonally because of the combined effects of solar radiation and weather patterns. For example, most coastal locations are dominated by a wet-winter/dry-summer pattern. In the lee of the Coast Mountains and throughout much of the interior, seasonal differ-ences in precipitation are smaller than on the coast (see Chapter 3, “Weather and Climate”). Variations in sea surface temperatures in the Pacific Ocean (e.g., El Niño/La Niña and the Pacific Decadal Oscil-lation [PDO]) also influence precipitation on annual and decadal cycles, producing large between-year variations superimposed on long-term trends (Rodenhuis et al. 2007).
In general, rainfall volume and intensity are the highest during the winter in coastal British Colum-bia. Storms that produce over 100 mm of rain in a 24-hour period are common, as are intensities that reach 30 mm/h. Coastal winter rainstorms can last for many days with long periods of light drizzle intermixed with periods of high rainfall intensi-ties. Summer storms on the coast are usually much shorter in duration and lower in total precipitation than winter storms. In contrast, rainstorms in the province’s interior and north are usually of shorter duration (less than 1 day) and occur in late spring through early fall when temperatures are above 0°C. Storms with higher rainfall volumes and intensities are often convective, with durations of a few hours. In the province’s interior and north, infrequent warm frontal storms in the late winter can also de-liver large amounts of rain. Further information on precipitation and intensity-duration-frequency data is provided in Chapter 17 (“Watershed Measurement Methods and Data Limitations”).
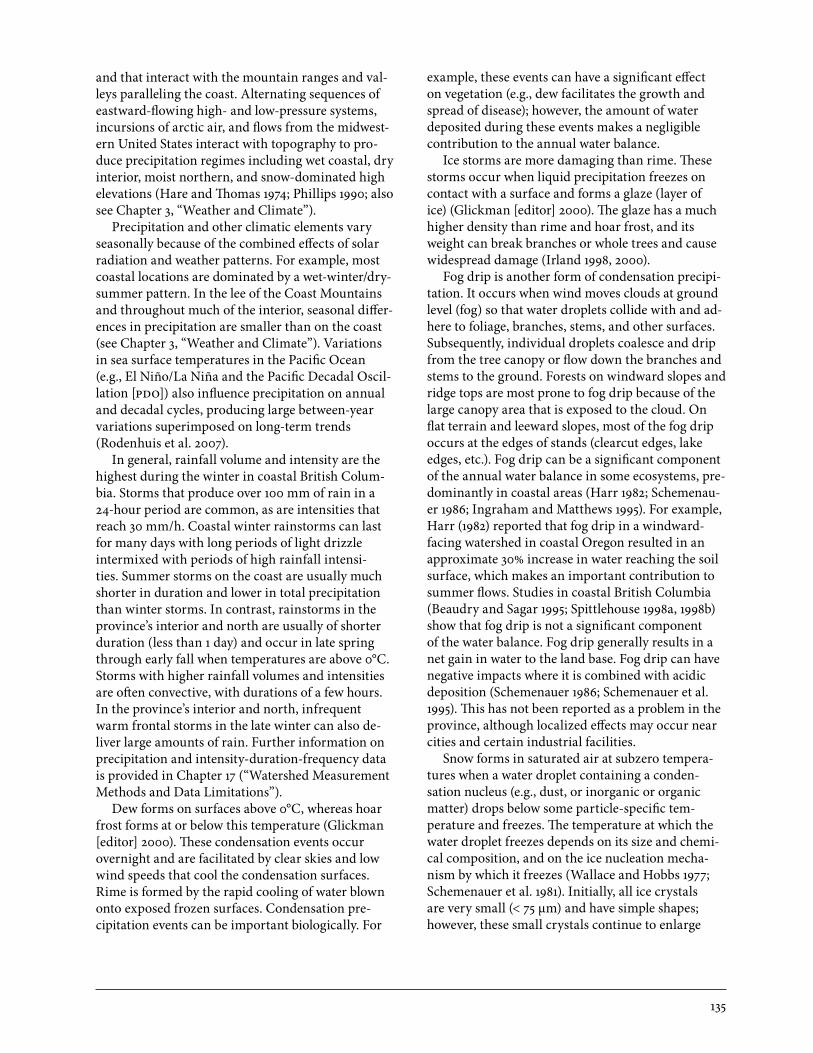
Dew forms on surfaces above 0°C, whereas hoar frost forms at or below this temperature (Glickman [editor] 2000). These condensation events occur overnight and are facilitated by clear skies and low wind speeds that cool the condensation surfaces. Rime is formed by the rapid cooling of water blown onto exposed frozen surfaces. Condensation pre-cipitation events can be important biologically. For
example, these events can have a significant effect on vegetation (e.g., dew facilitates the growth and spread of disease); however, the amount of water deposited during these events makes a negligible contribution to the annual water balance.
Ice storms are more damaging than rime. These storms occur when liquid precipitation freezes on contact with a surface and forms a glaze (layer of ice) (Glickman [editor] 2000). The glaze has a much higher density than rime and hoar frost, and its weight can break branches or whole trees and cause widespread damage (Irland 1998, 2000).
Fog drip is another form of condensation precipi-tation. It occurs when wind moves clouds at ground level (fog) so that water droplets collide with and ad-here to foliage, branches, stems, and other surfaces. Subsequently, individual droplets coalesce and drip from the tree canopy or flow down the branches and stems to the ground. Forests on windward slopes and ridge tops are most prone to fog drip because of the large canopy area that is exposed to the cloud. On flat terrain and leeward slopes, most of the fog drip occurs at the edges of stands (clearcut edges, lake edges, etc.). Fog drip can be a significant component of the annual water balance in some ecosystems, pre-dominantly in coastal areas (Harr 1982; Schemenau-er 1986; Ingraham and Matthews 1995). For example, Harr (1982) reported that fog drip in a windward-facing watershed in coastal Oregon resulted in an approximate 30% increase in water reaching the soil surface, which makes an important contribution to summer flows. Studies in coastal British Columbia (Beaudry and Sagar 1995; Spittlehouse 1998a, 1998b) show that fog drip is not a significant component of the water balance. Fog drip generally results in a net gain in water to the land base. Fog drip can have negative impacts where it is combined with acidic deposition (Schemenauer 1986; Schemenauer et al. 1995). This has not been reported as a problem in the province, although localized effects may occur near cities and certain industrial facilities.
Snow forms in saturated air at subzero tempera-tures when a water droplet containing a conden-sation nucleus (e.g., dust, or inorganic or organic matter) drops below some particle-specific tem-perature and freezes. The temperature at which the water droplet freezes depends on its size and chemi-cal composition, and on the ice nucleation mecha-nism by which it freezes (Wallace and Hobbs 1977; Schemenauer et al. 1981). Initially, all ice crystals are very small (< 75 µm) and have simple shapes; however, these small crystals continue to enlarge

136
Schaerer (2006) and Gray and Male (editors, 1981).
Net Precipitation
Only a portion of the precipitation falling during a given period reaches the ground. Some falls directly to the ground through gaps in the forest canopy; the rest is caught (intercepted) by vegetation or other surfaces and subsequently drips or slides from these surfaces to the ground or is lost through evaporation and sublimation. The precipitation that reaches the ground is referred to as net precipitation. Net precipi-tation depends on the weather (e.g., solar radiation, humidity, temperature, and wind speed), the time between precipitation events, the size and duration of events, and the type of vegetation cover present.
Rain interceptionThe fraction of rain intercepted by a forest depends on storm intensity and duration, weather condi-tions (wind speed, air temperature, humidity), and amount and type of vegetation present. Rain either falls directly to the forest floor through gaps in the canopy (throughfall) or hits foliage, branches, and stems. Rain that hits the vegetation may bounce off and fall to the forest floor (throughfall), run down branches and stems (stemflow), be absorbed by bark, lichens, and moss in the canopy, or remain on the surface of the foliage and branches and evaporate after the storm (interception loss) (Calder 1990). Interception loss increases with an increase in rain-fall and the volume of material in the canopy (e.g., leaves, branches, stems, mosses, epiphytes) (McMinn 1960; Rothacher 1963; Plamondon et al. 1984; Giles et al. 1985; Spittlehouse 1998a, 1998b; Pypker et al. 2005).
The interception storage capacity of a forest is the maximum amount of water that can be absorbed by and reside on the canopy at any one time, and var-ies from 0.5 to 2 mm (Shuttleworth 1989). The total interception loss during storms is often much greater because of increased energy exchange and efficient mixing of the air, and moisture evaporated from the canopy is constantly replenished (Calder 1990). Most of the rain from small storms (e.g., < 10 mm) is intercepted and lost, particularly from the dense canopies of old coastal forests (Figure 6.2). In these forests, interception (volume) increases as storm rainfalls increase up to 100 mm (point of maximum interception loss), whereas the fraction of rainfall lost decreases. The less dense canopies of lodgepole
through the condensation and freezing of liquid water molecules onto the ice crystals or through the collision of large ice crystals and water droplets as the ice crystals fall. Rimed crystals, graupel, or snow pellets form when supercooled water droplets freeze onto large snow crystals as they fall (Schemenauer et al. 1981).
Snowfall requires sufficient cloud height to permit snow crystal growth and temperatures less than 0°C in most of the area through which the snow falls (Schemenauer et al. 1981). Snow can remain sus-pended in the air column for a considerable length of time because its surface area is large in relation to its mass. During this time, snow may be transported by wind, or may melt or sublimate. Wind redistribution of falling snow occurs at various scales. The move-ment of air masses over topographic barriers and large water bodies influences snowfall at the macro-, or regional, scale. At the mesoscale, snow may be redistributed over distances of 100–1000 m through the combined effect of wind, terrain, and vegetation. At the microscale of 10–100 m, snowfall is affected by surface roughness and airflow patterns (Scheme-nauer et al. 1981; Gray and Prowse 1993).
While snow is falling, its crystal mass changes through vapour exchange with the surrounding air. If the air temperature is above 0°C, or if the vapour pressure is less than the saturated vapour pressure, then falling snow may melt or sublimate before it reaches the ground (Satterlund and Adams 1992). The amount of energy required to sublimate snow at 0°C is 2.83 × 10⁶ J/kg, which is the amount of energy required to melt snow (0.33 × 10⁶ J/kg) plus the amount of energy required to evaporate water (2.50 × 10⁶ J/kg at 0°C) (Oke 1987). This energy comes from several sources, including solar and longwave radiation, and convective heat transfer between the air and the snow.
As snow falls, air temperature controls its dry-ness, hardness, and crystalline form. Depending on the temperature, snow crystals can vary in shape from plates to prismlike crystals to dendrites and hollow columns (Wallace and Hobbs 1977; Scheme-nauer et al. 1981; McClung and Schaerer 2006). Generally, snow crystals that fall through a cold atmosphere are smaller than those that fall through warmer air (McClung and Schaerer 2006). Snow fall-ing at low temperatures is also drier and less dense than that falling at warmer temperatures (Geiger et al. 1995). Detailed discussions of snow formation and crystalline structure can be found in McClung and

137
pine and Engelmann spruce in the British Colum-bia interior have the same general effect; however, peak interception losses occur with storm rainfalls of approximately 25 mm (Figure 6.3). Young coastal stands are intermediate between these two situations (Figure 6.4) (Spittlehouse 1998a, 1998b). Maximum interception losses range from 3 to 30% of the storm precipitation depth depending on forest age, canopy density, and climate (Table 6.1).
Storms of long duration and low intensity have greater interception loss than higher-intensity, shorter-duration storms with the same total rainfall. This is because storms of short duration and high intensity have less favourable weather conditions for evaporation (Calder 1990; Spittlehouse 1998a, 1998b; Crockford and Richardson 2000; Carlyle-Moses 2004). Antecedent conditions, such as the time since the last storm, are also important because these con-ditions influence the remaining interception storage capacity of the vegetation. Figures 6.2 and 6.3 provide examples of the influence of antecedent conditions.
Points highlighted by the arrow symbols show inter-ception losses during a wide range of storm sizes in coastal and interior forests. The arrows in Figure 6.2 and the arrows in Figure 6.3 highlight storms that occurred when the foliage was wet from previous storms. Interception losses were also measured over a series of storms at Upper Penticton Creek. The first storm with 6.2 mm rainfall occurred in the late af-ternoon, 2 days after the last rain, and had a 2.3 mm (37%) interception loss. A second storm began just after midnight and was of higher intensity; however, with little time for the canopy to dry out, the result-ing interception loss for the higher-intensity storm (29 mm rainfall) was only 1.4 mm (5%) (Spittlehouse 1998b).
Understorey vegetation, slash, downed wood, rocks, and the forest floor also intercept rainfall (Black and Kelliher 1989; Kelliher et al. 1992; Putahena and Cordery 1996). The lower amount of leaf area in the understorey and less favourable conditions for evaporation because of low wind speed means that
Interception (mm/rain storm)
30
25
20
15
10
5
0 0 50 100 150 200 250 300
Rainstorm (mm)
Inte
rcep
tion
(mm
/rai
nsto
rm)
FIGURE 6.2 Interception loss as a function of the amount of rainfall in an individual rainstorm for a mature coastal hemlock forest at Carnation Creek on the west coast of Vancouver Island. The arrows indicate two high-intensity winter storms. Line fitted by eye. (Adapted from Spittlehouse 1998a)

138
Rainstorm (mm)
Inte
rcep
tion
(mm
/rai
nsto
rm)
5
4
3
2
1
0 0 5 10 15 20 25 30 35 40
Pine
Spruce
FIGURE 6.3 Interception loss as a function of the amount of rainfall in an individual rainstorm for lodgepole pine ( ■ ) and Engelmann spruce–subalpine fir (+) forests at Upper Penticton Creek. The arrows indicate interception for storms that occurred when the canopy was wet from a preceding storm. Line fitted by eye. (Adapted from Spittlehouse 1998b)
20
18
16
14
12
10
8
6
4
2
0 0 20 40 60 80 100 120 140 160 180 200
Rainstorm (mm)
Inte
rcep
tion
(mm
/rai
nsto
rm)
FIGURE 6.4 Interception loss as a function of the amount of rainfall in an individual rainstorm for a young coastal Sitka spruce forest at Carnation Creek on the west coast of Vancouver Island. Line fitted by eye. (Adapted from Spittlehouse 1998b)

139
maximum interception is similar to the interception storage capacity—about 0.2 mm per unit leaf area (Black and Kelliher 1989).
Throughfall and stemflow may be negligible for rainfalls that are less than 3 mm and during the initial stages of larger events because much of the rainfall is intercepted and stored by the canopy. As rainfall increases, a greater proportion of it becomes throughfall (Beaudry and Sagar 1995; Price et al. 1997; Spittlehouse 1998a, 1998b). Stemflow is usually not produced until the canopy interception storage capacity has been exceeded. In an old coastal hem-lock forest (Figure 6.2) and in an interior lodgepole pine forest (Figure 6.3), a rainfall of 15 mm or more on a dry canopy was required for stemflow to occur. In younger forests, stemflow commenced with as lit-tle as 2 mm of rainfall (Spittlehouse 1998b). In older forests, stemflow is often negligible (Table 6.1).
On an annual basis, interception loss from conifer forests typically ranges from 10 to 40% of total rainfall depending on canopy characteristics and weather conditions (e.g., McMinn 1960; Rothacher 1963; Sollins et al. 1980; Beaudry and Sagar 1995; Spittlehouse 1998a, 1998b; Link et al. 2004; Levia and Frost 2006). At lower elevations in coastal British Columbia where most of the precipitation falls as rain, the percentage of rainfall lost to interception is greater in summer than in winter because precipita-tion events are generally smaller and weather condi-tions are more suitable for evaporation. Up to 50% of rainfall can be intercepted in the summer in mature coastal conifer stands. Annual variability in the rainfall regime also affects interception losses. An-
nual rainfall interception losses from the old interior lodgepole pine site reported in Table 6.1 and Figure 6.3 varied from 23 to 31% over a 10-year period. If this stand was subjected to the rainfall regime of the mature coastal western hemlock stand, then interception loss would be about 12%. No published interception data exist for deciduous trees in British Columbia. In a review of the interception loss litera-ture, Carlyle-Moses (2004) reported that, on average, canopy interception loss from coniferous forests was double that of deciduous stands, with typical values of approximately 26% and 13% of incident rainfall, respectively, during the growing season.
Snow interceptionThe amount of snow intercepted by forest canopies is affected by weather variables and stand character-istics, including existing snow load, air temperature, wind speed, time since last snowfall, and snowfall amount, as well as tree species, leaf area, stand den-sity, and stem distribution (Schmidt and Troendle 1992; Gray and Prowse 1993; Pomeroy and Gray 1995; Hedstrom and Pomeroy 1998). The lowest inter-ception rates of falling snow occur at wind speeds greater than 2 m/s (Gray and Prowse 1993); the high-est rates occur at temperatures of –3 to 0°C (Pomeroy and Goodison 1997). At these temperatures, snow crystals are more cohesive and less likely to rebound from branches, needles, and previously intercepted snow. At lower temperatures, the less cohesive snow is more likely to be redistributed by wind (Schmidt and Troendle 1992). The exact proportion of the total snowfall that is redistributed once it has been
Age Elevation Canopy T S ImaxForest type (yr) Location (m) cover (%) (%) (%) (mm)
Western hemlock–western redcedar > 250 Prince Rupert area 50 75–80 73–78 1 30
Western hemlock > 125 Carnation Creek 450 85 69 1 30
Sitka spruce, western redcedar, approx. 20 Carnation Creek 5 75 77 9 14western hemlock
Douglas-fir 55 Campbell River 300 85 75 3 11
Douglas-fir # 1 25 Cowichan Lake 175 70 70 9 15
Douglas-fir # 2 25 Cowichan Lake 175 40 85 4 9
Lodgepole pine > 125 Upper Penticton Creek 1650 45 71 < 0.5 5
Engelmann spruce–subalpine fir > 125 Upper Penticton Creek 1800 45 71 < 0.5 3.5
Lodgepole pine 25 Upper Penticton Creek 1750 40 71 5 4
TABLE 6.1 Throughfall (T), stemflow (S), and maximum storm interception (Imax) percentages of season-long rainfall in various forest types in British Columbia (Spittlehouse 1998a, 1998b, 2004, unpublished data; D. Maloney, unpublished data)

140
intercepted is the subject of much debate. Estimates range from a minor proportion of the total snowfall to as high as 90% during individual storms. Wheeler (1987) suggested that only 2% of the difference in the water equivalent of the snowpack between an open-ing and an Engelmann spruce–subalpine fir–lodge-pole pine forest in Colorado could be explained by the redistribution of snow by wind. As snow ages, the ability of wind to transport intercepted snow decreases (Miller 1962; Schmidt and Troendle 1992).
Schmidt and Troendle (1992) suggested that when winter storms are small (e.g., 5–25 mm of water equivalent), 50% of the snowfall may be intercepted when conifer crown closure exceeds 50%. Pomeroy et al. (1998) found that 56% of the total snowfall was intercepted in a 19 m tall jack pine stand in Saskatch-ewan with a crown closure of 82%. At a high-eleva-tion site in the Kootenays, Schmidt and Gluns (1991) found that snow interception was 45–50% on indi-vidual Engelmann spruce, subalpine fir, and lodge-pole pine branches during a 10 mm water equivalent, low-density snowfall event. These authors also found that snow catch decreased to about 10% as snow den-sity increased to 13%, highlighting the importance of meteorological conditions during snowfall events. Snow intercepted by the canopy gradually builds up, forming bridges between the needles and branches. This process increases the surface area on which any additional snow can be intercepted until the weight of the snow can no longer be supported and some or all of it slides off the branches. Intercepted snow that remains on the canopy can be lost through sublimation. In spring, snow on the canopy may also melt, slide off, or wash off during rainfall and warm weather.
Snow accumulationSnow accumulation on the ground is usually de-scribed by its depth, density, and water equivalent. Snow water equivalent (SWE) is the depth of water that would result from melting a given depth of snow. Snow water equivalent is calculated as the product of the snow depth and snow density. Snow accumulation is affected by snowfall, topography, and vegetation. In a given climatic region, snow accumulation generally increases with increasing elevation as a result of greater storm frequency, de-creased evaporation, and decreased melt throughout the winter (Gray and Prowse 1993). The relationship between elevation and snow accumulation varies considerably from year to year. Snow accumula-tion also varies with slope position and orientation,
decreasing along a slope oriented parallel to the prevailing winds and increasing in depressions and on lee slopes (Gray and Prowse 1993). Aspect influ-ences the amount of energy that reaches the snow surface, and as a consequence, the magnitude of melt and sublimation losses in late winter before the main melt period. Topographic variability in SWE is reduced by tall vegetation, an effect that generally in-creases with increasing vegetation density (Pomeroy et al. 1998). Snow accumulation under tall vegetation is generally less than in the open. The loss of forest cover caused by logging, fire, insects, or disease generally results in increased snow accumulation on the ground (see Chapter 7, “The Effects of Forest Disturbance on Hydrologic Processes and Watershed Response”).
In forests, snow accumulation varies between stands of different species, canopy density, and stem distribution. Within the same stand, snow accumu-lation varies significantly from year to year; however, within-stand variability has been found to decrease with increasing mean accumulation (Winkler and Moore 2006). Snow accumulation also varies with distance from individual trees, increasing up to a distance of approximately 3 m from the trunk of a coniferous tree (Pomeroy and Goodison 1997; Faria et al. 2000). The amount of forest canopy, often described by estimates of canopy closure, gap frac-tion, or leaf area, is inversely related to SWE on the ground, although the exact nature of the relation-ships between these variables changes with climatic conditions (Metcalfe and Buttle 1998).
Pomeroy and Goodison (1997) reported that snow accumulation in the boreal forest was greater in stands of aspen than of jack pine and was least in stands of black spruce. The increases in snow accu-mulation corresponded to the lack of foliage during winter in aspen stands and to lower leaf area in pine relative to spruce stands. Pomeroy et al. (1998) stated that up to 70% of the spatial variation in SWE under forest cover is related to winter leaf area. At high-el-evation sites in central British Columbia, Teti (2003) found that canopy density, measured in a cone 60° wide, explained 22–73% of the variability in mean peak SWE, with the least variability occurring in the smallest openings, likely as a result of edge effects. In the southern interior of British Columbia, crown closure explained 68% of the variability in pre-melt SWE across a range of typical forest types (Winkler et al. 2004). In a survey of lodgepole pine stands of varying ages on the Thompson-Okanagan plateau, April 1 SWE was reduced by approximately 6% for

141
every 10% increase in crown closure (Winkler and Roach 2005).
Snow metamorphismNewly fallen snow generally has a complex crystal structure and low density, ranging from 50 to 120 kg/m3 (Pomeroy et al. 1998). On the ground, snow undergoes continual change in crystal form, surface conditions, temperature, water content, permeabil-ity, and density. Snowpack metamorphism refers to the change in the shape of snow grains through time. The nature of metamorphism depends on the presence or absence of liquid water, snowpack tem-perature, and vertical temperature gradient through the snowpack. The vertical temperature gradient depends on the temperature at the ground–snow in-terface, as well as on air temperature and snowpack depth.
In dry snow with weak vertical temperature gradients (less than 10°C change over each metre of snow depth), metamorphism is initially caused by the migration of water molecules from the convex areas of a snow crystal (which have a high equili- brium vapour pressure) to the concave areas (which have a lower equilibrium vapour pressure). As a result, snow crystals evolve from original complex forms toward rounded grains, typically about 0.5 mm in diameter. This process is referred to as equilibrium metamorphism. It dominates in regions with consistently below-freezing air temperatures and relatively deep snowpacks, such as the Columbia Mountains and inland, and at higher elevations in the Coast Mountains. The rate at which equilibrium metamorphism proceeds decreases with decreasing temperature.
Strong vertical temperature gradients (greater than 10°C per metre of snow depth) can develop where extremely low air temperatures coincide with relatively shallow snow because the base of the snow-pack is maintained within a few degrees of freezing by heat conduction from the soil. In these situations, the strong temperature gradient is accompanied by a strong vapour pressure gradient: the lower, warmer portions of the snowpack have higher vapour pres-sures in the pore spaces than does the overlying snow. In a process called kinetic metamorphism, these gradients drive the diffusion of water vapour upward, where it condenses and refreezes to form faceted crystals, which are often called depth hoar. It is a common occurrence in the Rocky Mountains, but also occurs in other regions.
In the Coast and Cascade Mountains, and at
lower elevations in the interior of the province, snowpacks experience periodic mid-winter melt and rainfall followed by percolation of liquid water into the snowpack. In the presence of liquid water, snow grains rapidly evolve into relatively coarse, rounded grains up to 1 mm or more in diameter. If the snowpack temperature is below freezing, some or all of the percolating water freezes, releasing its latent heat of fusion and warming the snowpack. Repeated melt–freeze cycles produce bonded clusters of coarse grains. If a snow surface exposed to melt and refreezing is buried by additional snowfalls, it can be a barrier to vertical percolation through the snowpack during subsequent melt–freeze cycles. Per-colating melt and rain may pond on such a surface and refreeze, sometimes producing thick ice layers. The resulting stratification in the snowpack is not uniform across the landscape, which produces large spatial variability in snow density and meltwater percolation (Langham 1981).
As a result of snow metamorphism, the density of the snowpack tends to increase through the winter, reaching densities of 200–300 kg/m3 or more once the snowpack has settled and been exposed to wind (McKay and Gray 1981). During the seasonal transi-tion from winter to the onset of spring melt, snow-pack densities typically increase to 250–500 kg/m3
because of ongoing metamorphism and retention of liquid water (Pomeroy and Gray 1995; Pomeroy et al. 1998). Figure 6.5 shows an example of this general increase in snow density over the ablation season at Mayson Lake on the Thompson Plateau. The den-sity of the snowpack measured on day 92 was less than that on the previous date as a result of snowfall between days 84 and 92, as shown by the increase in SWE.
Snowpack metamorphism is of great interest in relation to avalanche hazard, but is also relevant to hydrological processes. For example, the albedo of freshly fallen snow is high due in part to the complex grain shapes. As snow metamorphoses into rounded grains, the albedo declines. Depth hoar has a low thermal conductivity, which restricts the conduc-tion of heat from the soil into upper layers of the snowpack. Small snow grains have a higher water retention capacity than coarser grains, and also have a lower hydraulic conductivity, which results in lower rates of water percolation through the snow-pack. Thick ice layers within a snowpack can impede vertical water percolation and encourage downslope flow. See Langham (1981) and McClung and Schaerer (2006) for further discussions of snowpack processes

142
and properties, and Haegeli and McClung (2007) for a treatment of the geographic variability of these processes in southern British Columbia.
SnowmeltThe rate at which snow melts depends on the amount of energy available to change snow to liquid water. The energy fluxes to and from a snowpack include: radiant energy (QR, shortwave and longwave radia-tion); latent heat flux (QE, energy released through the condensation of water onto the snowpack or lost through evaporation); sensible heat flux (QH, energy transferred to or from the snow surface by turbu-lent exchange); conduction/ground heat flux (QG, energy conducted to the bottom of the snowpack from the ground); advection (QP, transfer of heat to the snowpack through rain); and the rate of change of internal energy (stored) in the snowpack (QS). The amount of energy available for melt (QM) can be expressed using the energy balance equation:
QM = QR + QE + QH + QG + QP – QS (3)
All streams of energy are expressed in units of megajoules per square metre per day (MJ/m2 per day) or watts per square metre (W/m2). During snowmelt periods, the term QS is often omitted
(especially for daily totals) because its assumed value is small relative to the other energy balance components and because the snowpack is close to 0°C during melt (Male and Gray 1981). Net radiation is the difference between incoming and outgoing shortwave and longwave radiation:
Qn = S↓ – S↑ + L↓ – L↑ (4)
where: S↓ is the shortwave (global) radiation arriving at the snow surface; S↑ is the shortwave radiation reflected by the snow surface, which is a function of the surface albedo (reflectivity of the snow); L↓ is the longwave radiation arriving at the snow surface from the sky and forest canopy; and L↑ is the longwave radiation emitted by the snow surface, which is determined by the temperature of the snow surface plus a typically small contribu-tion attributed to the reflection of incident longwave radiation.
The amount of meltwater produced (M), ex-pressed as a snow water equivalent (millimetres), can be calculated from:
M = (Qm / [ρw λf B]) 1000 (5)
where: Qm is in MJ/m2 per day; ρw is the density of water (approximately 1000 kg/m3); λf is the latent
FIGURE 6.5 Changes in snow water equivalent (SWE) and snow density in a clearcut at Mayson Lake. (R.D. Winkler, unpublished data)
400
350
300
250
200
150
100
50
0
400
350
300
250
200
150
100
50
0 60 70 80 90 100 110 120 130
Day of the year 2007
Snow
wat
er e
quiv
alen
t (m
m)
Den
sity
(kg/
m3 )
SWE Density

143
heat of fusion (0.334 MJ/kg); and B is the thermal quality of snow (generally between 0.95 and 0.97) (Pomeroy and Goodison 1997).
Shortwave radiation reaching the Earth’s surface is a function of slope, aspect, cloud cover, time of year, and time of day. The amount of shortwave ra-diation reaching a snow surface under forest cover is reduced relative to that in an open site. The amount of reduction is not easily related to simple measures, such as canopy closure, because this reduction also depends strongly on canopy volume, stem distribu-tion within the canopy, and density and arrange-ment of foliage elements, as well as on the relative proportions of direct and diffuse (direct radiation scattered by particles in the atmosphere) solar radia-tion reaching the top of the canopy, and the Sun’s lo-cation within the sky dome. In stands with sparsely dispersed trees and at the edges of openings, shading effects can extend up to a distance of two to three times the crown height from the tree trunk (bole) (Bohren and Thorud 1973; Spittlehouse et al. 2004).
The fraction of incident shortwave radiation that is reflected is termed the albedo. As discussed above, albedo depends on the snow age and the nature of metamorphism. Snow albedo also depends on the fractions of diffuse and direct radiation (Pomeroy and Goodison 1997). The albedo can be as high as 0.95 for a fresh snow surface colder than 0°C and as low as 0.2–0.3 for an old, thin snowpack (Geiger et al. 1995). Below a forest canopy, albedo is also affected by the amount of leaves, lichens, and moss that has fallen on the snow surface (Adams et al. 1998; Melloh et al. 2001; Spittlehouse and Winkler 2004). Shortwave radiation can be absorbed and reflected within the snowpack, the amount of which decreases exponentially with depth. As much as 40% of the shortwave radiation received at the snow surface penetrates to a depth of 10 cm, and only 10% or less reaches a depth of 25 cm (Geiger et al. 1995). This energy may be reflected back to the surface or may contribute to snowpack metamorphism.
Longwave radiation depends on the temperature of the radiating surface and its emissivity. The emis-sivity is a measure of the efficiency with which a body emits longwave radiation relative to a theoreti-cal black body, which has an emissivity of unity. The emissivity of the atmosphere depends on tempera-ture and vapour content (and thus cloud cover). Under clear sky conditions, a typical emissivity for the atmosphere would be 0.75, whereas the emissivity under thick cloud cover can approach unity. Long-wave radiation below the forest canopy is composed
of sky radiation that penetrates through gaps in the canopy plus radiation from the canopy and tree trunks. It is usually greater than sky radiation because the trees are warmer than the sky and have a higher emissivity than is typical for clear sky condi-tions. Snow absorbs 95–99% of the incident longwave radiation, reflecting less than 5%. Because snow has a high emissivity approaching unity (Oke 1987), long-wave radiation emitted by snow depends primarily on its surface temperature (Gray and Prowse 1993).
The increase in longwave radiation emitted by a forest canopy compared to sky radiation can partially compensate for the reduction in short-wave radiation reaching a snow surface below the canopy. For example, Woo and Giesbrecht (2000) found that shortwave radiation was reduced under a mixed black and white spruce canopy relative to the open areas, and longwave radiation was enhanced, particularly during overcast conditions. Overall, net radiation decreases as canopy density increases up to approximately 60%, after which net radiation increases (Pomeroy and Goodison 1997). Under dense canopies, increased longwave radiation from the canopy and multiple reflections of solar radiation between the canopy and snowpack can compensate for reductions in solar radiation as canopy density increases (Bohren and Thorud 1973). Net radiation can also be greater under a deciduous than a conifer-ous canopy (Pomeroy and Goodison 1997).
Convective fluxes depend on the intensity of turbulence and thus on wind speed, and the rough-ness of the snow surface. These fluxes also depend on the differences in temperature (for sensible heat) and vapour pressure (for latent heat) between the overlying air and the snow surface. Convective flux often provides a much smaller source of energy to the snow than radiation. Under forest cover, where wind speeds are low, these fluxes are small (Woo and Giesbrecht 2000; Spittlehouse and Winkler 2004); however, convective fluxes can be important energy sources at open sites during weather conditions that are dominated by warm, moist maritime air masses and strong winds (such as “Pineapple Express” or “Tropical Punch” events, as described in Chapter 3, “Weather and Climate”).
Ground heat flux is usually negligible compared to radiation and to latent and sensible heat fluxes, and is often ignored or capped in energy budget pre-dictions of daily snowmelt (Pomeroy and Goodison 1997). Nevertheless, ground heat flux is important for maintaining the heat content of the snowpack dur-ing winter and thus for minimizing the amount of

144
energy required to raise the snowpack to the melting point in the initial stages of snowmelt.
Sublimation from the snowpack occurs when the temperature is less than 0°C and the vapour pres-sure of the air is less than that of the snow surface. Sublimation and evaporation from snow-covered clearcuts is usually less than 1 mm/d, amounting to a total seasonal loss of 10–20 mm SWE (Bengtsson 1980; Bernier 1990; Prévost et al. 1991; Adams et al. 1998). Although water losses from the snowpack are small, the energy lost or added through sublimation or condensation can affect melt rates.
The transition from winter snow accumulation to spring melt begins when net heat exchange at a snow surface becomes dominantly positive, prima-rily as a result of increasing shortwave radiation and air temperature. At the time of this transition, the snowpack often has temperatures below freez-ing and thus negligible liquid water content. Before substantial quantities of water can percolate to the base of the snowpack, the snowpack must become “ripe”—that is, it must become isothermal at 0°C and its water-holding capacity must be satisfied. Water often percolates through the snowpack via preferred pathways, and therefore it is not necessary for the entire snowpack to become primed for some amount of drainage to occur in the early stages of a rain-on-snow event or spring melt (Conway and Benedict 1994).
Initially, the upper layers of a snowpack will warm to 0°C and then begin to melt. Warming of deeper layers of the snowpack occurs partly by con-duction of heat through the snow grains. In addition, meltwater percolates down through the pack and re-freezes, releasing its latent heat of fusion and warm-ing the snowpack until it becomes isothermal at 0°C. After a layer of snow has been warmed to 0°C, some of the meltwater or rain percolating to this layer will be retained and any surplus can percolate deeper. The water retention capacity of a snowpack depends on grain size and structure, and is highly variable, ranging from near zero to more than 10% by vol-ume (Kattelmann 1986). As a result of these internal snowpack processes, there is a delay between the onset of rainfall or melt at or near the snow surface and the arrival of that water at the base of the snow-pack. This delay is augmented by refreezing of water within the snowpack, which decreases its perme-ability by filling in voids, thus reducing percolation rates (Pfeffer and Humphrey 1996). Detention in the snowpack can moderate peak streamflows by delay-ing the delivery of rain or meltwater to channels
compared to areas with no or shallow snowpacks. Figure 6.6 illustrates the warming process at Upper Penticton Creek. It shows the distinct lag between the time that maximum daily air and snow surface temperatures reached zero and the time when the entire snowpack became isothermal and the period of continuous melt began.
In an isothermal snowpack, the rate of water percolation varies with the snowpack’s structure (particularly permeability, and the presence or absence of ice layers) and water content. During periods of melt, a snowpack’s liquid water content can exceed its water-holding capacity because of the presence of water that is percolating under the force of gravity. In fact, during periods of high melt rates, 20% or more of the snowpack volume may be liquid water (Male and Gray 1981). As liquid water enters or moves through the snowpack, metamorphism occurs, changing the water retention characteristics of the pack, as described earlier. As snow grains be-come larger and more rounded, pore space increases, making the snowpack more permeable and reduc-ing its water-holding capacity. In addition, ice layers tend to decay in the presence of liquid water. These structural changes, in conjunction with decreas-ing snowpack depth, result in reduced travel times through the snowpack as the melt season progresses, and thus less time lag between peak snowmelt and peak streamflow (Jordan 1983).
During the main spring-melt period, snowmelt rates tend to be highest during episodes of clear weather and are enhanced significantly by sensible and latent heat fluxes under windy conditions at open sites. Snowmelt rates vary strongly with aspect, with the highest rates occurring on south-facing slopes (in the northern hemisphere) because of the aspect-dependence of incident solar radiation. In contrast, mid-winter rain-on-snow events (see next section) typically involve relatively warm, humid air, high wind speeds, and low solar radiation.
Snowmelt rates reported in the literature are often calculated from repeated measurements of SWE over time, and therefore represent the combined losses of water from the snowpack through sublimation, evaporation of meltwater, and outflow. This com-bined loss is referred to as ablation. Average abla-tion rates reported in the literature vary from 4 to 25 mm/d in the open and 3–17 mm/d in the forest (Winkler et al. 2005). In the Thompson-Okanagan region, ablation rates calculated from repeated SWE measurements typically vary from 4 to 5 mm/d in mature Engelmann spruce or lodgepole pine

145
stands and from 6 to 10 mm/d in the open (Win-kler 2001). At Mayson Lake, maximum daily snow melt rates, measured as lysimeter outflow, were as high as 29 mm/d in the open (Winkler et al. 2005). At 15 sites in the Kootenays, average ablation rates determined from repeated snow surveys were 1.1 and 0.8 mm/d in the open and forest, respectively (Toews and Gluns 1986). Snow ablation, estimated using an energy balance approach, at sites near Vanderhoof ranged from 2 to 5 mm/d in the open
and forest, respectively (Boon 2007). In the southern interior of British Columbia, 57% of the variability in standardized (to account for the weather) ablation rates among forest stands was explained by crown closure. Year alone explained 24% of the variability in ablation rates among these sites. These results highlight the importance of both forest structure and the weather in regulating snowmelt (Winkler et al. 2004).
FIGURE 6.6 Changes in maximum and minimum air temperature (upper panel), snow depth (middle panel), and daily mean snow temperature (lower panel) under a forest during winter 2005/06 at Upper Penticton Creek. When a snow temperature sensor is above the snow (Oct–Dec and May) its readings approximate air temperature. The solid arrow indicates the time when the snowpack has uniformly warmed to about 0°C and the dashed arrow indicates when it has ripened sufficiently to start melting. (D. Spittle-house, unpublished data)
30
20
10
0
-10
-20
-30
1
0.8
0.6
0.4
0.2
0
5
0
-5
-10
-15
-20
Tem
per
atur
e (°
C)
Tem
per
atur
e (°
C)
Snow
dep
th (m
)
Oct Nov Dec Jan Feb Mar Apr May
Air temperature
Snow depth
Snow temperature
MaximumMinimum
0.5 m0.2 m0.0 m
Melting
146
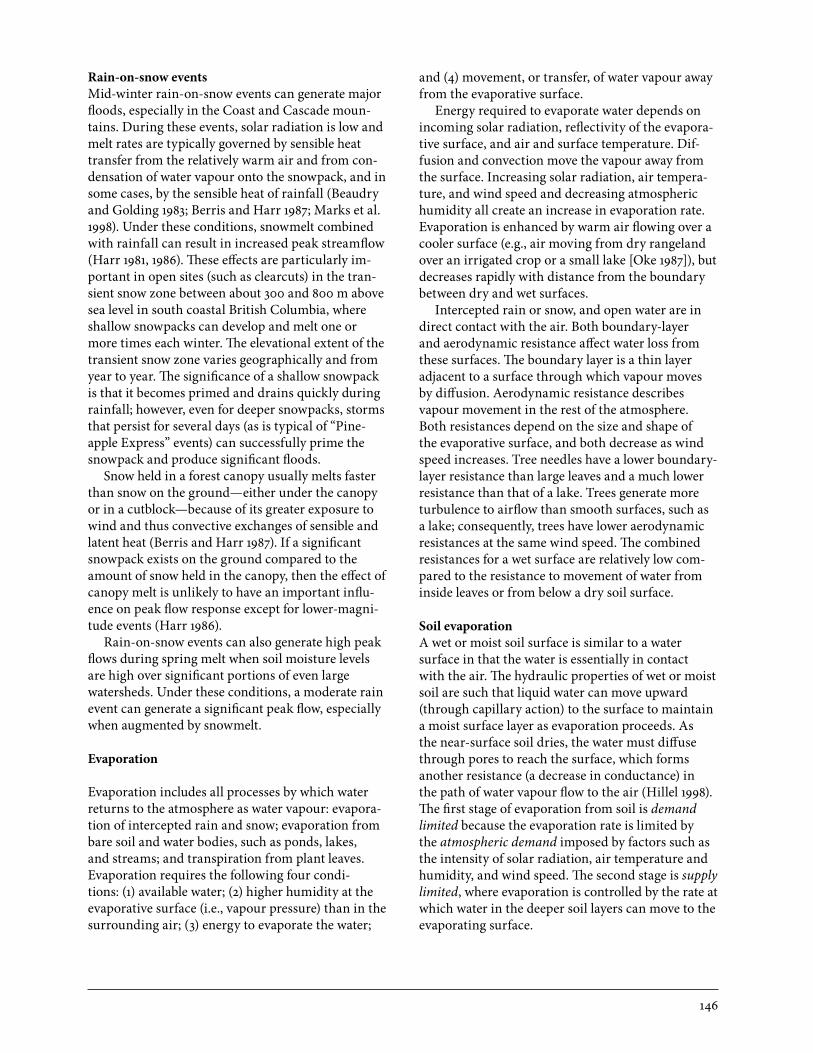
Rain-on-snow eventsMid-winter rain-on-snow events can generate major floods, especially in the Coast and Cascade moun-tains. During these events, solar radiation is low and melt rates are typically governed by sensible heat transfer from the relatively warm air and from con-densation of water vapour onto the snowpack, and in some cases, by the sensible heat of rainfall (Beaudry and Golding 1983; Berris and Harr 1987; Marks et al. 1998). Under these conditions, snowmelt combined with rainfall can result in increased peak streamflow (Harr 1981, 1986). These effects are particularly im-portant in open sites (such as clearcuts) in the tran-sient snow zone between about 300 and 800 m above sea level in south coastal British Columbia, where shallow snowpacks can develop and melt one or more times each winter. The elevational extent of the transient snow zone varies geographically and from year to year. The significance of a shallow snowpack is that it becomes primed and drains quickly during rainfall; however, even for deeper snowpacks, storms that persist for several days (as is typical of “Pine-apple Express” events) can successfully prime the snowpack and produce significant floods.
Snow held in a forest canopy usually melts faster than snow on the ground—either under the canopy or in a cutblock—because of its greater exposure to wind and thus convective exchanges of sensible and latent heat (Berris and Harr 1987). If a significant snowpack exists on the ground compared to the amount of snow held in the canopy, then the effect of canopy melt is unlikely to have an important influ-ence on peak flow response except for lower-magni-tude events (Harr 1986).
Rain-on-snow events can also generate high peak flows during spring melt when soil moisture levels are high over significant portions of even large watersheds. Under these conditions, a moderate rain event can generate a significant peak flow, especially when augmented by snowmelt.
Evaporation
Evaporation includes all processes by which water returns to the atmosphere as water vapour: evapora-tion of intercepted rain and snow; evaporation from bare soil and water bodies, such as ponds, lakes, and streams; and transpiration from plant leaves. Evaporation requires the following four condi-tions: (1) available water; (2) higher humidity at the evaporative surface (i.e., vapour pressure) than in the surrounding air; (3) energy to evaporate the water;
and (4) movement, or transfer, of water vapour away from the evaporative surface.
Energy required to evaporate water depends on incoming solar radiation, reflectivity of the evapora-tive surface, and air and surface temperature. Dif-fusion and convection move the vapour away from the surface. Increasing solar radiation, air tempera-ture, and wind speed and decreasing atmospheric humidity all create an increase in evaporation rate. Evaporation is enhanced by warm air flowing over a cooler surface (e.g., air moving from dry rangeland over an irrigated crop or a small lake [Oke 1987]), but decreases rapidly with distance from the boundary between dry and wet surfaces.
Intercepted rain or snow, and open water are in direct contact with the air. Both boundary-layer and aerodynamic resistance affect water loss from these surfaces. The boundary layer is a thin layer adjacent to a surface through which vapour moves by diffusion. Aerodynamic resistance describes vapour movement in the rest of the atmosphere. Both resistances depend on the size and shape of the evaporative surface, and both decrease as wind speed increases. Tree needles have a lower boundary-layer resistance than large leaves and a much lower resistance than that of a lake. Trees generate more turbulence to airflow than smooth surfaces, such as a lake; consequently, trees have lower aerodynamic resistances at the same wind speed. The combined resistances for a wet surface are relatively low com-pared to the resistance to movement of water from inside leaves or from below a dry soil surface.
Soil evaporationA wet or moist soil surface is similar to a water surface in that the water is essentially in contact with the air. The hydraulic properties of wet or moist soil are such that liquid water can move upward (through capillary action) to the surface to maintain a moist surface layer as evaporation proceeds. As the near-surface soil dries, the water must diffuse through pores to reach the surface, which forms another resistance (a decrease in conductance) in the path of water vapour flow to the air (Hillel 1998). The first stage of evaporation from soil is demand limited because the evaporation rate is limited by the atmospheric demand imposed by factors such as the intensity of solar radiation, air temperature and humidity, and wind speed. The second stage is supply limited, where evaporation is controlled by the rate at which water in the deeper soil layers can move to the evaporating surface.

147
TranspirationPlant leaves are analogous to dry soil in that water must pass from the cells within the leaf through sto-mata to the air. This results in a resistance to evapo-ration that is at least 10 times that of the combined boundary-layer and aerodynamic resistances. The stomata regulate water loss to maintain an appro-priate water status in the leaves by balancing the atmospheric demand for water with the ability of the roots to supply water from the soil. Once evaporative demand reaches a certain level, even though the soil is moist, the stomata begin to close, which main-tains evaporation at a constant level. The vapour pressure deficit of the air (see Chapter 17, “Watershed Measurement Methods and Data Limitations”) is a good predictor of evaporative demand and its effect on transpiration (Figure 6.7). Transpiration occurs when stomata open to allow carbon dioxide to dif-fuse in for photosynthesis; thus, stomata usually close at night when there is no light for photosynthe-sis.
There are species differences in the ability to regu-
late water loss. Trees usually have higher stomatal resistances to water loss than shrubs and grass (Kell-iher et al. 1993, 1995). As with soil evaporation, tran-spiration has a supply-limited phase caused by soil drying. Stomata open less and start to close earlier in the day, resulting in a substantial increase in stomat-al resistance (Tan et al. 1978; Spittlehouse 2003) and subsequently a decrease in transpiration (Figure 6.7). Stomatal resistance and the amount of leaf area of the forest are usually combined in the term canopy resistance (Tan and Black 1976). Canopy resistance generally decreases as the canopy of a stand devel-ops, but it tends to plateau at a leaf area index (LAI) of about 4–6 (units of LAI are square metre of leaf area per square metre of ground surface) (Kelliher et al. 1995). Further increases in leaf area produce shading that alters the below-canopy environment, and this combined with the physiological state of what are usually older leaves results in an increase in stomatal resistance. Mature interior lodgepole pine stands typically have an LAI of 2–4, whereas mature coastal Douglas-fir stands have an LAI of 6–20.
2.0
1.8
1.6
1.4
1.2
1.0
0.8
0.6
0.4
0.2
0
0 0.5 1.0 1.5 2.0 2.5 3.0
Maximum vapour pressure deficit (kPa)
Tran
spira
tion
(mm
/d)
Rainy day
Moist soil
Dry soil
FIGURE 6.7 Daily transpiration rates of old lodgepole pine trees at Upper Penticton Creek and daily maximum vapour pressure deficit (kPa) on days when the soil was moist (prior to mid-August) when the soil was dry or when nighttime temperatures were below zero (mid-August to late September), and on days with rain (adapted from Spittlehouse 2002).

148
Free water evaporationSeasonal timing and rates of evaporation from water bodies depend on the physical dimensions of the water body (depth, width, and length) and its geo-graphical location (Phillips 1990; Schertzer 1997). As air passes over the water body, evaporation increases the water content of the air and cools it, thereby reducing evaporation rates. Thus, ponds and small lakes are more affected by the air around them than large lakes and usually maintain higher evaporation rates under the same weather conditions. Summer evaporation rates for lakes vary from 50 to 150 mm per month (Phillips 1990; Schertzer 1997). The length of the ice-free season affects annual evaporation, which varies from 800 mm/yr in southern British Columbia to under 400 mm/yr in the northern part of the province. Wetlands, ranging from those with open water to those with full vegetation cover, have evaporation rates of 2–5 mm/d, which translates to an annual evaporation of between 200 and 500 mm/yr (Roulet et al. 1997).
Evaporation of intercepted precipitationEvaporation rates from forest canopies wetted by rain can exceed transpiration rates from dry cano-pies under the same environmental conditions. Evaporation rates from wet canopies vary from 0.07 to 0.7 mm/h (De Villiers 1982; Dykes 1997; Hum-phreys et al. 2003; Price and Carlyle-Moses 2003) and can be similar during daytime and nighttime conditions (Pearce et al. 1980). These high rates of evaporation are sustained by the sensible heat flux to the canopy from the planetary boundary layer and the low aerodynamic resistance of the canopy. For grasses and similar short vegetation, such as under-storey plants, the aerodynamic resistance is similar in magnitude to that of the canopy resistance. In this case, the evaporation rates of intercepted rain range from 0.07 to 0.4 mm/h depending on whether the canopy is partially wet or saturated (Calder 1991). Transpiration rates are less than this during rainfall because the vapour pressure gradient is small.
In winter, sublimation losses of intercepted snow depend on wind speed, air temperature, humidity, and radiation, and on canopy characteristics, includ-ing canopy surface area. Most of the energy used in sublimation comes from warm, dry air advected into the canopy (Schmidt and Troendle 1992). Maximum rates of sublimation occur during clear periods between small frequent storms, which deposit snow on cold, stiff branches, and are facilitated by the high surface area of snow exposed to the air on the tree
crowns. In dense conifer canopies, all of the inter-cepted snow (up to 30% of the total snowfall on aver-age) can be lost to sublimation and evaporation over the winter (Schmidt and Troendle 1992). Maximum sublimation and evaporative losses from boreal and subalpine forest canopies were found to vary from 3 to 5 mm/d (Woo et al. 2000; Molotch et al. 2007), and average 0.1–0.2 mm/d over the winter (Arain et al. 2003).
Forest evaporation ratesIn British Columbia, evaporation rates from a wet soil surface in a clearcut can be greater than 3 mm/d, but would be 10–20% of this under a closed forest canopy. This rate is rarely maintained for more than a day or two, and as the soil dries, the rate rapidly decreases to a steady loss of 0.1–0.2 mm/d after about 10 days with no rain (Kelliher et al. 1986). On an annual basis, evaporation from a high-elevation clearcut in the southern interior of British Columbia varied from 175 mm in a dry year to 300 mm in a wet year (Spittlehouse 2006a). The evaporation charac-teristics of a clearcut slowly change as the vegeta-tion regrows (Adams et al. 1991; Vertessy et al. 2001; Delzon and Loustau 2005; Spittlehouse 2006b).
Increasing the proportion of forest cover does not correspond to an equal increase in evaporation; there is often a threshold amount of forest cover at which evaporation peaks. In stands with low canopy cover, evaporation from the soil and understorey vegetation contributes substantially to stand evapo-ration. As tree cover increases, shading reduces these losses. Also, individual trees tend to transpire more water under conditions of lower stand density (e.g., Tang et al. 2003; Bladon et al. 2006; Simonin et al. 2006). As noted earlier, above a certain leaf area, canopy resistance tends to remain constant (Kell iher et al. 1995), offsetting the effects of increased leaf area. Younger trees with efficient water transport mechanisms can maintain higher transpiration rates than tall, old trees under the same weather condi-tions (Hubbard et al. 1999; Delzon and Loustau 2005) because of the higher water conductivity of their stems.
On sunny days, typical evaporation rates from provincial forests with a dry canopy are 2–4.5 mm/d (Kelliher et al. 1986; Spittlehouse 1989, 2002; Mc-Caughey et al. 1997; Humphreys et al. 2003). These rates decrease as the soil dries and soil water po-tential drops below about –0.2 MPa. Shallow and (or) coarse-textured soils have a relatively low water storage capacity. Consequently, transpiration and

149
evaporation can be substantially reduced during periods of low rain (Giles et al. 1985; Fleming et al. 1996; Spittlehouse 2003). In an old lodgepole pine stand at Penticton Creek, the mean daily areal tree transpiration rate was between 1 and 1.5 mm/d in mid-summer (Figure 6.8). This decreased to about 0.5 mm/d in late August and September when soil water potential dropped below –0.5 MPa, and re-mained low in the cool, late September and October weather. Average below-canopy evaporation rates varied from 0.7 to 0.2 mm/d. Mean daily evaporation rates varied from 2.4 mm/d in June through August to 1 mm/d in late September. The trees and the be-low-canopy vegetation plus soil contributed 42% and 25%, respectively, of the total evaporation (239 mm) during the snow-free season. The remaining 33% was contributed through the evaporation of intercepted rainfall (78 mm, or 28% of the rainfall).
In British Columbia, few annual or seasonal measurements of evaporation are published for land surfaces. In most cases, seasonal and annual totals must be determined using process-based models of
evaporation based on measured characteristics of the evaporative surface (e.g., Spittlehouse and Black 1981; Kelliher et al. 1986; Spittlehouse 2004, 2006a). The only long-term measurements are for second-growth Douglas-fir stands on the coast (Jassel et al. 2009). From 1998 to 2007, annual evaporation varied from 410 to 480 mm for a stand that was 59 years old in 2007. Monthly evaporation rates varied from as low as 10 mm in winter to over 70 mm in mid-summer. Although soils are about 0.8 m deep at the site, evaporation was reduced by about 20% in July and August in a summer with low precipitation. An 18-year-old stand had similar annual evaporation rates, illustrating that once plant canopy leaf area exceeds a certain level, evaporation remains rela-tively constant. Similar numbers were obtained for the 59-year-old stand using a water balance model (Spittlehouse 2004). The modelling study showed that, on average, about 25% of the evaporation was from intercepted water. In contrast, annual evapora-tion from high-elevation, old lodgepole pine stands varied from 335 mm in a dry year to 430 mm in a wet
171 182 193 204 215 225 234 246 259 266 274 285
3.0
2.5
2.0
1.5
1.0
0.5
0
Day of year
Evap
orat
ion
(mm
/d)
Interception
Trees
Forest floor
FIGURE 6.8 Average daily evaporation of intercepted water (blue), tree transpiration (green), and below-canopy evaporation (yellow) (transpiration from the understorey and trees less than 3 m tall, plus evaporation from the soil surface) at Upper Penticton Creek. Uncertainty in interception is 0.2 mm/d, in tree transpiration is 0.2 mm/d, and below-canopy evaporation is 0.4 mm/d. (Adapted from Spittlehouse 2002)

150
year (Spittlehouse 2006a). In this forest type, about 40% of the evaporation was through sublimation and evaporation of intercepted precipitation (Figure 6.8).
Measurements of annual evaporation from the boreal forest in Saskatchewan may be suggestive of rates in northern British Columbia ecosystems. For example, annual evaporation from a mature aspen stand ranged from 270 mm in a year with substantial drought to 400 mm in a wet year. The growing sea-son was only 4 months long but accounted for 75% of the annual evaporation (Kljun et al. 2006; Krishnan et al. 2006). Conversely, during the same period in the same area, annual evaporation rates in an old black spruce stand on a wet site ranged from 300 to 330 mm, whereas rates in an old jack pine stand on a dry site ranged from 220 to 260 mm (Arain et al. 2003; Kljun et al. 2006). Consequently, maximum daily evaporation from the aspen stand during sum-mer was more than 4 mm compared to 3 mm for the black spruce and jack pine stands. Average evapora-tion rates during summer for the black spruce and jack pine stands were 3 and 2 mm/d, respectively (Kljun et al. 2006), and during winter were 0.1 to 0.2 mm/d, respectively.
Calculation of evaporation for water balance analysis is best done by separating interception from transpiration. Allen et al. (1998) showed how to calculate a reference evaporation rate that can be ad-justed to different surfaces. This method can be used on a daily or monthly time step. Chapter 3 (“Weather and Climate”) provides examples of calculated refer-ence evaporation rates for selected locations in Brit-ish Columbia (see Figure 3.8 and Table 3.2).
Water Storage and Movement on Hillslopes
Water arriving at the ground surface can accumulate on the surface, infiltrate into the forest floor and soil, and (or) flow over the surface. The flow path that water takes (Figure 6.1) is primarily determined by surface and soil properties, antecedent moisture con-ditions, and the characteristics of the precipitation (rain or snowmelt) delivered to the soil surface.
Depression storageIf the soil surface has a low infiltration capacity and low hydraulic conductivity, and if the topography allows for surface storage, then water may be stored at the surface in small pools or depressions. These water-filled depressions, called vernal pools, are often seasonal features (Rains et al. 2006) that form because of perched water tables. These depression
storage areas may become hydrologically connected during high water conditions and develop a flow network to deliver water to streams or other surface water bodies (Rains et al. 2006).
Overland flowIf the rate of rainfall and (or) snowmelt exceeds the infiltration capacity, then some of the surplus water will flow downslope over the soil surface as infiltra-tion-excess overland flow (often termed Hortonian overland flow) (Tarboton 2003). In British Columbia, overland flow seldom occurs on undisturbed forest soils, which typically have sufficiently high infiltra-tion capacities and hydraulic conductivities (Cheng 1988). In most soils, infiltration is aided by the pres-ence of vertical macropores fed by flow concentra-tion within the overlying organic horizons (deVries and Chow 1978).
In near-stream zones (e.g., riparian zones or floodplains), the water table may rise to the soil sur-face during storm or snowmelt events because of the direct input of rain and (or) snowmelt plus contri-butions of subsurface stormflow from surrounding hillslopes. These zones of saturated soil can generate saturation overland flow, which flows directly to the stream channel. Saturation overland flow includes return flow (water flowing to the surface from below) as well as snowmelt or precipitation falling directly onto the saturated zone (Figure 6.1). Depending on the topography, these areas may expand during storm events and during the wet season in response to a rising water table, and subsequently contract between events and during the dry season. Satura-tion overland flow may be significant in watersheds with relatively wide riparian zones or floodplains, particularly in relatively low-gradient terrain (e.g., Taylor 1982). In steeper headwater areas, riparian corridors constitute only a small portion of the watershed and may be the primary area for runoff generation during dry periods (e.g., Sidle et al. 2000) when most of the rain falling onto hillslopes (outside of the riparian zone) is retained within the soil and is unavailable to generate streamflow.
Water repellency (also know as hydrophobicity) and restricted infiltration can occur in situations where mineral soil grains become coated with organic compounds. Many forest soils naturally exhibit water-repellent characteristics when dry, but this effect diminishes once soil moisture increases. Barrett and Slaymaker (1989) found that such water repellency occurred naturally in shallow soil layers in subalpine forests at sites across southern British
151
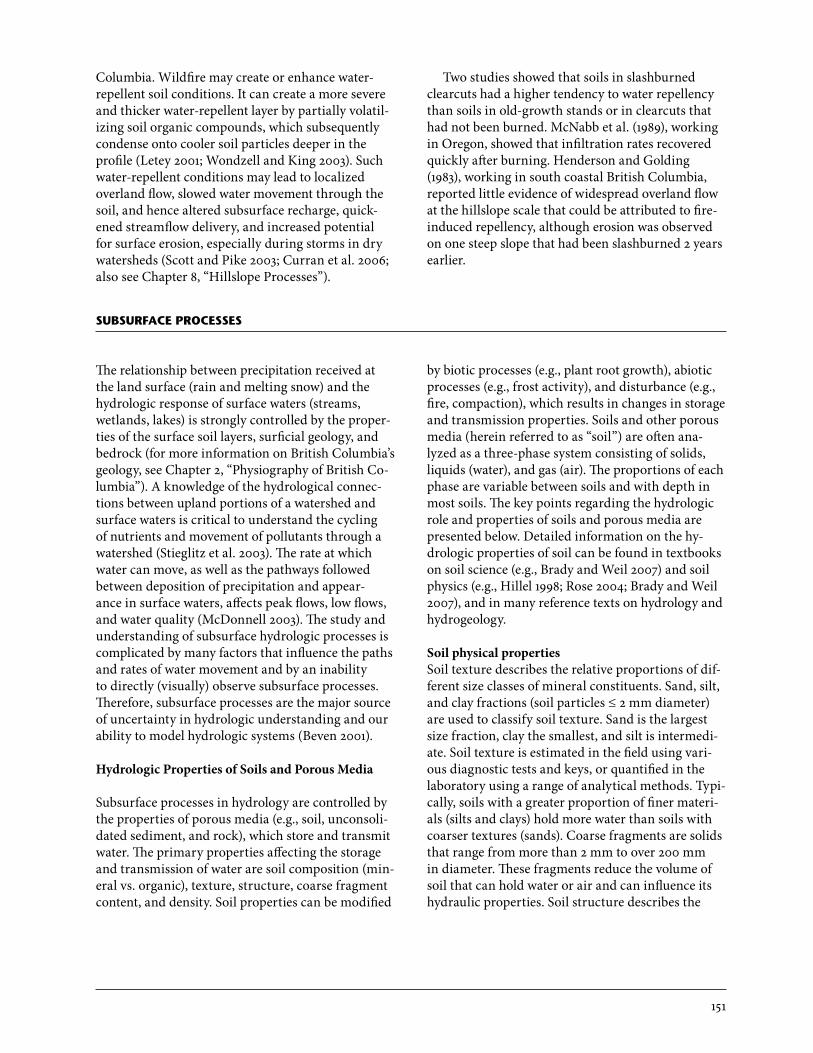
Columbia. Wildfire may create or enhance water-repellent soil conditions. It can create a more severe and thicker water-repellent layer by partially volatil-izing soil organic compounds, which subsequently condense onto cooler soil particles deeper in the profile (Letey 2001; Wondzell and King 2003). Such water-repellent conditions may lead to localized overland flow, slowed water movement through the soil, and hence altered subsurface recharge, quick-ened streamflow delivery, and increased potential for surface erosion, especially during storms in dry watersheds (Scott and Pike 2003; Curran et al. 2006; also see Chapter 8, “Hillslope Processes”).
Two studies showed that soils in slashburned clearcuts had a higher tendency to water repellency than soils in old-growth stands or in clearcuts that had not been burned. McNabb et al. (1989), working in Oregon, showed that infiltration rates recovered quickly after burning. Henderson and Golding (1983), working in south coastal British Columbia, reported little evidence of widespread overland flow at the hillslope scale that could be attributed to fire-induced repellency, although erosion was observed on one steep slope that had been slashburned 2 years earlier.
suBsurface Processes
The relationship between precipitation received at the land surface (rain and melting snow) and the hydrologic response of surface waters (streams, wetlands, lakes) is strongly controlled by the proper-ties of the surface soil layers, surficial geology, and bedrock (for more information on British Columbia’s geology, see Chapter 2, “Physiography of British Co-lumbia”). A knowledge of the hydrological connec-tions between upland portions of a watershed and surface waters is critical to understand the cycling of nutrients and movement of pollutants through a watershed (Stieglitz et al. 2003). The rate at which water can move, as well as the pathways followed between deposition of precipitation and appear-ance in surface waters, affects peak flows, low flows, and water quality (McDonnell 2003). The study and understanding of subsurface hydrologic processes is complicated by many factors that influence the paths and rates of water movement and by an inability to directly (visually) observe subsurface processes. Therefore, subsurface processes are the major source of uncertainty in hydrologic understanding and our ability to model hydrologic systems (Beven 2001).
Hydrologic Properties of Soils and Porous Media
Subsurface processes in hydrology are controlled by the properties of porous media (e.g., soil, unconsoli-dated sediment, and rock), which store and transmit water. The primary properties affecting the storage and transmission of water are soil composition (min-eral vs. organic), texture, structure, coarse fragment content, and density. Soil properties can be modified
by biotic processes (e.g., plant root growth), abiotic processes (e.g., frost activity), and disturbance (e.g., fire, compaction), which results in changes in storage and transmission properties. Soils and other porous media (herein referred to as “soil”) are often ana-lyzed as a three-phase system consisting of solids, liquids (water), and gas (air). The proportions of each phase are variable between soils and with depth in most soils. The key points regarding the hydrologic role and properties of soils and porous media are presented below. Detailed information on the hy-drologic properties of soil can be found in textbooks on soil science (e.g., Brady and Weil 2007) and soil physics (e.g., Hillel 1998; Rose 2004; Brady and Weil 2007), and in many reference texts on hydrology and hydrogeology.
Soil physical propertiesSoil texture describes the relative proportions of dif-ferent size classes of mineral constituents. Sand, silt, and clay fractions (soil particles ≤ 2 mm diameter) are used to classify soil texture. Sand is the largest size fraction, clay the smallest, and silt is intermedi-ate. Soil texture is estimated in the field using vari-ous diagnostic tests and keys, or quantified in the laboratory using a range of analytical methods. Typi-cally, soils with a greater proportion of finer materi-als (silts and clays) hold more water than soils with coarser textures (sands). Coarse fragments are solids that range from more than 2 mm to over 200 mm in diameter. These fragments reduce the volume of soil that can hold water or air and can influence its hydraulic properties. Soil structure describes the

152
arrangement and organization of soil particles (Hil-lel 1998). Structural voids can result in large pore spaces that allow for enhanced water flow (preferen-tial flow) through soils. Bulk density is the mass of soil solids within a given volume of soil, and in-creases as the proportion of solids in the three-phase system increases. The amount of soil volume that is occupied by pore spaces affects water storage and transmission. Bulk density is also related to the type of soil solids (mineral vs. organic). The bulk density of forest soils ranges from 1000 to 1600 kg/m3 for mineral soils and from 100 to 1000 kg/m3 for organic soils, and is typically greater for soils that have been compacted (Fisher and Binkley 2000). Particle densi-ty is the ratio of the mass of soil solids to the volume of solids, and is greater than bulk density because it does not include pore spaces. The particle density of organic materials is typically around 1500 kg/m3 (Redding et al. 2005), whereas mineral materials are typically assumed to have a particle density of 2650 kg/m3 (Hillel 1998).
The proportion of the soil that is occupied by void spaces is termed the soil porosity. These void spaces can be filled with either water or air. The porosity of a soil (f, unitless) is calculated as follows:
f = 1 – (ρb /ρs) (6)
where: ρb is soil bulk density (kilograms per cubic metre), and ρs is particle density (kilograms per cubic metre). When all the pore space is filled with water, the soil is considered to be saturated. The distribution of pore sizes is a function of soil texture, density, and structure. It controls how much water can be held in unsaturated soil and the rate at which water moves in soil.
Water storage in soilWater is held in the soil by cohesive forces between water molecules and adhesive forces between water molecules and soil particles. Films of water cover the solid particles, and as the soil becomes wetter, water sequentially fills the smallest pores through to the largest pores. The amount of water stored within the soil is typically expressed in one of four ways: (1) gravimetric, (2) volumetric, (3) relative saturation, and (4) depth of water. Gravimetric water content (θg) is the ratio of the mass of water (kilograms) to the mass of dry soil (kilograms). Volumetric water content (θv) is the ratio of the volume of water to the total volume of soil, and is related to θg by soil bulk density (ρb):
θv = θg /ρb (7)
where: θv is expressed as a ratio (cubic metres water per cubic metres soil) or a percentage (ratio per 100%).
The relative saturation (S) of a soil is:
S = θv /f (8)
where: S is expressed as a ratio or as percentage. Knowing the equivalent depth of water (D) stored
within a soil profile (e.g., root zone depth), is useful for calculating water balances:
D = θv /z (9)
where: z is the depth range (metres) over which the storage of water is to be calculated. For example, if the mean θv in the top 1 m of soil is 0.3, then the depth of water stored is 0.3 m.
To quantify water movement through the soil, it is necessary to understand the energy state of water in the soil. The energy state of soil water is related to how water is held in the soil (surface tension). As soils dry, larger pores empty, the films of water in fine pores and on the surfaces of the soil particles become thinner, and the energy required to remove the water increases. The energy state, or potential, of water depends on the sum of three forces that act on water in the soil: (1) gravitational, (2) matric, and (3) osmotic. Matric forces are caused by the attraction of the water to the soil; osmotic forces are caused by the attraction of ions (i.e., solutes) in the water. Osmotic forces are small, except in saline soils, and are usually neglected. The gravitational potential depends on the vertical distance between a point in the soil and some reference level. In most cases, as the soil dries, the gravitational potential becomes small compared to the matric potential. When soils are unsaturated, the water potential is negative (less than atmospheric). Other terms used to describe the energy state of water include soil water tension, soil water suction, and pore pressure. In the unsaturated zone, suction and tension are typically considered to be positive values, whereas pore pressure is negative.
The relationship between water content (or rela-tive saturation) and water potential is termed the soil moisture characteristic curve or the water retention curve (Figure 6.9). Retention curves are generally presented for soil fractions that are less than 2 mm. Correction of the volumetric water content for the coarse fragment content (gravel, stones, and rocks) is done by multiplying the volumetric water content by 1 minus the coarse fraction proportion.

153
Two points on the water retention curve are com-monly used to understand water storage and trans-port: (1) field capacity, and (2) permanent wilting point. Field capacity (approximately –0.01 MPa or –0.1 bars) is used to denote the water content at which the drainage rate is minimal. If soils are wet-ter than field capacity, then water will rapidly drain under the force of gravity. Permanent wilting point (approximately –1.50 MPa or –15 bars) refers to the water content at which most plants can no longer remove water from the soil. The water content at field capacity and wilting point varies between soils depending on texture and other soil properties. The permanent wilting point is also determined by the type of plant—some plants can access water under drier soil conditions. The soil water available to plants is often described as that between field capac-ity and the permanent wilting point. Water between –0.01 and –0.20 MPa is readily available to plants. Below this, the soil starts to strongly restrict the wa-ter supply, and plants reduce transpiration accord-ingly (i.e., stomata close). The portion of soil porosity that occurs at a volumetric water content between
saturation and field capacity is termed the drainable porosity. This is the portion of the soil volume that contributes most strongly to stormflow generation (Weiler et al. 2005). Drainable porosity typically de-creases with depth in soils as organic matter content decreases and bulk density increases.
Water movement in soilsWater movement in soil is controlled by several fac-tors, including texture, bulk density, occurrence of preferential flow pathways, and water content. Water flow under unsaturated conditions is controlled by the gradient in water potential between two points (difference in total potential [sum of matric and gravitational potentials] divided by the distance between the points of interest) and the ability of the soil to conduct water. Water movement occurs from zones of higher water potential (wetter, or less nega-tive) to zones of lower water potential (drier, or more negative). It is important to note that water may flow upward (i.e., against gravity) when soils are drier at the surface and wetter with depth. The ability of the soil to conduct water is expressed quantitatively as hydraulic conductivity (K), which is related to soil texture, structure, density, and water content. Hy-draulic conductivity is higher in wetter or coarser-textured soils and decreases non-linearly with decreasing water content (or water potential) and in finer-textured soils. The highest hydraulic conduc-tivity occurs under saturated conditions (Ks).
Preferential flow pathways are an important characteristic of water transmission in forest soils (Beven and Germann 1982; Hendrickx and Flury 2001; Weiler et al. 2005). These large pores (also termed macropores) can transmit large quantities of water at rates greater than the saturated hydraulic conductivity (Ks) of the surrounding soil matrix. This flow bypasses much of the soil matrix and has major implications for processes such as lateral and vertical flow from hillslopes, and for the transport of dissolved materials (e.g., nutrients or pollutants) to groundwater and surface water bodies. Preferen-tial flow pathways can develop from root channels, animal burrows, structural voids, cracks or frac-tures in the soil, or subsurface pipes developed over time through subsurface erosion of these pathways (Beven and Germann 1982; Hendrickx and Flury 2001). Preferential pathways may also develop within the soil matrix at transitions between soil layers of significantly differing texture, in zones of greater permeability, such as at the soil–bedrock interface (e.g., Hutchinson and Moore 2000), or in lenses
FIGURE 6.9 Water retention curves for sand (dash-dot), loam (solid), and clay (dotted) soils.
0.0001
0.001
0.01
0.1
1
10
0 0.2 0.4 0.6 0.8 1
Volumetric water content (m3/m3)
Soil
suct
ion
(–M
Pa)
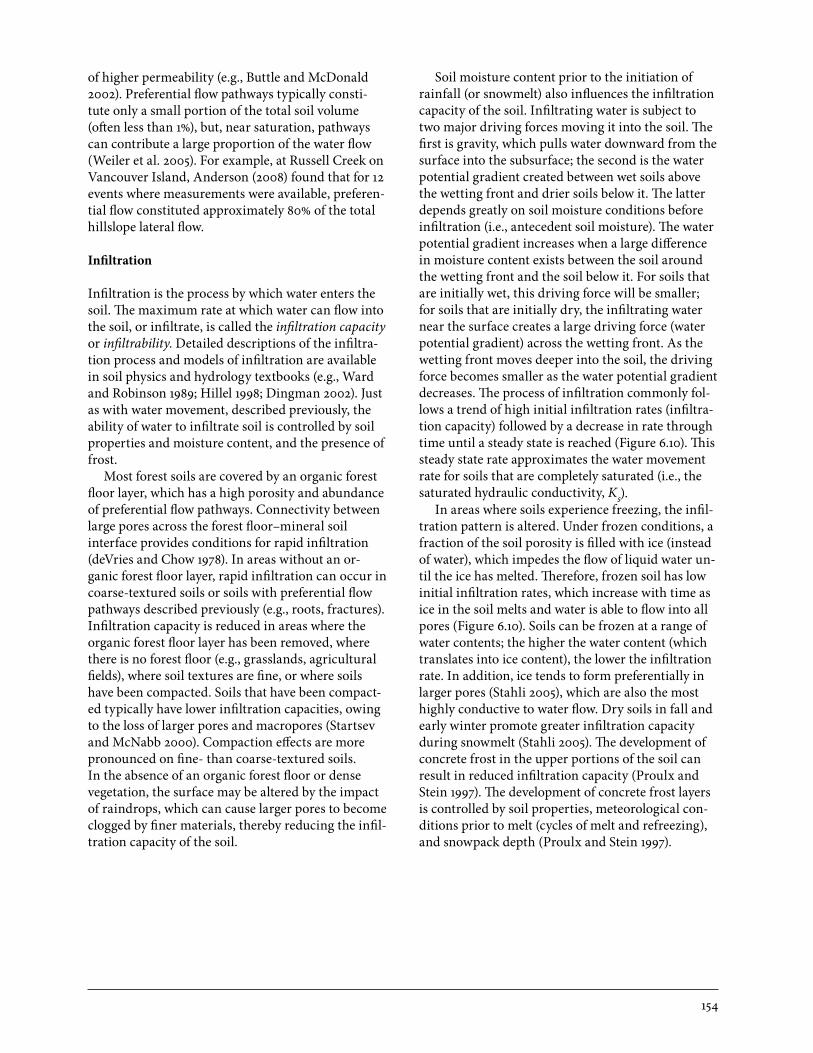
154
of higher permeability (e.g., Buttle and McDonald 2002). Preferential flow pathways typically consti-tute only a small portion of the total soil volume (often less than 1%), but, near saturation, pathways can contribute a large proportion of the water flow (Weiler et al. 2005). For example, at Russell Creek on Vancouver Island, Anderson (2008) found that for 12 events where measurements were available, preferen-tial flow constituted approximately 80% of the total hillslope lateral flow.
Infiltration
Infiltration is the process by which water enters the soil. The maximum rate at which water can flow into the soil, or infiltrate, is called the infiltration capacity or infiltrability. Detailed descriptions of the infiltra-tion process and models of infiltration are available in soil physics and hydrology textbooks (e.g., Ward and Robinson 1989; Hillel 1998; Dingman 2002). Just as with water movement, described previously, the ability of water to infiltrate soil is controlled by soil properties and moisture content, and the presence of frost.
Most forest soils are covered by an organic forest floor layer, which has a high porosity and abundance of preferential flow pathways. Connectivity between large pores across the forest floor–mineral soil interface provides conditions for rapid infiltration (deVries and Chow 1978). In areas without an or-ganic forest floor layer, rapid infiltration can occur in coarse-textured soils or soils with preferential flow pathways described previously (e.g., roots, fractures). Infiltration capacity is reduced in areas where the organic forest floor layer has been removed, where there is no forest floor (e.g., grasslands, agricultural fields), where soil textures are fine, or where soils have been compacted. Soils that have been compact-ed typically have lower infiltration capacities, owing to the loss of larger pores and macropores (Startsev and McNabb 2000). Compaction effects are more pronounced on fine- than coarse-textured soils. In the absence of an organic forest floor or dense vegetation, the surface may be altered by the impact of raindrops, which can cause larger pores to become clogged by finer materials, thereby reducing the infil-tration capacity of the soil.
Soil moisture content prior to the initiation of rainfall (or snowmelt) also influences the infiltration capacity of the soil. Infiltrating water is subject to two major driving forces moving it into the soil. The first is gravity, which pulls water downward from the surface into the subsurface; the second is the water potential gradient created between wet soils above the wetting front and drier soils below it. The latter depends greatly on soil moisture conditions before infiltration (i.e., antecedent soil moisture). The water potential gradient increases when a large difference in moisture content exists between the soil around the wetting front and the soil below it. For soils that are initially wet, this driving force will be smaller; for soils that are initially dry, the infiltrating water near the surface creates a large driving force (water potential gradient) across the wetting front. As the wetting front moves deeper into the soil, the driving force becomes smaller as the water potential gradient decreases. The process of infiltration commonly fol-lows a trend of high initial infiltration rates (infiltra-tion capacity) followed by a decrease in rate through time until a steady state is reached (Figure 6.10). This steady state rate approximates the water movement rate for soils that are completely saturated (i.e., the saturated hydraulic conductivity, Ks).
In areas where soils experience freezing, the infil-tration pattern is altered. Under frozen conditions, a fraction of the soil porosity is filled with ice (instead of water), which impedes the flow of liquid water un-til the ice has melted. Therefore, frozen soil has low initial infiltration rates, which increase with time as ice in the soil melts and water is able to flow into all pores (Figure 6.10). Soils can be frozen at a range of water contents; the higher the water content (which translates into ice content), the lower the infiltration rate. In addition, ice tends to form preferentially in larger pores (Stahli 2005), which are also the most highly conductive to water flow. Dry soils in fall and early winter promote greater infiltration capacity during snowmelt (Stahli 2005). The development of concrete frost in the upper portions of the soil can result in reduced infiltration capacity (Proulx and Stein 1997). The development of concrete frost layers is controlled by soil properties, meteorological con-ditions prior to melt (cycles of melt and refreezing), and snowpack depth (Proulx and Stein 1997).

155
Lateral and Vertical Flow from Hillslopes
Following infiltration, water can move vertically, laterally, or some combination of both, depend-ing on subsurface properties, antecedent moisture content, and precipitation characteristics. The flow pathway(s) of water and flow mechanisms that result from these combined factors are the subject of hill-slope hydrology. Overviews of hillslope hydrology are available in the compilations edited by Kirkby (1978), Anderson and Burt (1990), and Beven (2006). Review papers on the subject have been published by Bonnell (1993, 1998) and Weiler et al. (2005).
If the available water storage capacity of hillslope soils is large relative to the precipitation amount, then most of the water will be stored within the unsaturated zone of the hillslope (e.g., Redding and Devito 2008). If the available storage capacity of the soil is small relative to the precipitation, then water will flow either laterally downslope (as surface runoff or shallow subsurface flow, referred to as subsurface storm flow) or vertically downward to recharge the groundwater (or deeper unsaturated zones). The available storage capacity is a function of soil type (soil texture) and depth to a restricting layer. If soils are shallow, less water is required to fill available storage than in deeper soils. Antecedent soil mois-ture storage can be a strong control on lateral flow
generation. A wetter soil will have less available stor-age than a drier soil to a given depth. The amount of water that is stored in the soil also depends on plant water use.
The interactions between storage capacity and subsurface storm flow are threshold relationships, with a minimum precipitation amount necessary to result in subsurface storm flow. Studies from steep, humid watersheds around the world indicate that storm total precipitation amounts of 20–55 mm are required to generate any subsurface storm flow (Weiler et al. 2005). Therefore, in many areas of the world, a large proportion of precipitation events will not result in appreciable subsurface storm flow from hillslopes, depending on soil properties and geology. For example, at aspen-forested boreal plain sites with deep, fine-textured soils, Redding and Devito (2008) found that a threshold event rainfall amount of more than 20 mm was required to generate more than 1 mm of lateral flow.
The generation of lateral flow depends on the presence of a restricting layer that impedes vertical water flow and directs it laterally (e.g., Hutchinson and Moore 2000). A restricting layer will have low hydraulic conductivity, and may be formed by bed-rock, compacted sediments, a hardpan layer within the soil, or a change in soil texture. For soils and sed-iments without an impermeable bedrock layer, the
Steady-stateinfiltration rate
Unfrozen soilDry antecedent condition
Frozen or hydrophobic soil
Unfrozen soilWet antecedent condition
Infiltration capacityIn
filtr
atio
n ra
te
Time
FIGURE 6.10 Hypothetical example of relative infiltration rates in unfrozen, frozen, and hydrophobic soils.

156
restricting layer may be defined relative to the rate of water input to the soil. If the hydraulic conductiv-ity of a layer is greater than the input rate, it will not restrict flow, whereas if the input rate is greater than the saturated hydraulic conductivity of the layer, it will result in lateral deflection of the flow.
Two primary lateral flow–producing mecha-nisms are associated with a restricting layer. The first involves preferential flow in the saturated layer along the interface between the restricting layer and the overlying sediments, where the materials at the interface have a higher permeability than materials above or below. The preferential flow pathways may be related to the presence of tree roots (e.g., Hutch-inson and Moore 2000) or erosional soil pipes (e.g., Buttle and MacDonald 2002). The second lateral flow mechanism involves the downward wetting of the soil column above the restricting layer, followed by the development of a perched water table. As the water table rises towards the surface, the saturated hydraulic conductivity of the soil typically increases, allowing for greater lateral flow as the water table intersects higher-permeability layers or preferential flow paths (e.g., Stieglitz et al. 2003; Devito et al. 2005).
The combination of rapid vertical flow to a restricting layer followed by lateral flow along the restricting layer is common for hillslopes in humid and steep environments (Hetherington 1982; An-derson et al. 1997; Hutchinson and Moore 2000). Depending on local geology, water exchanges between the saturated soil layer and the underly-ing bedrock may occur. For example, Anderson et al. (1997) showed that a significant amount of water infiltrated from the soil into fractures in the under-lying sedimentary bedrock at a site in the Oregon Coast Range, then re-emerged into the soil some distance downslope. Shallow saturated layers typi-cally respond rapidly (i.e., within minutes to hours) to stormwater inputs (e.g., Pierson 1980; Sidle 1984; Jackson and Cundy 1992; Fannin et al. 2000). Re-gions with abundant subsurface stormflow typically have a shallow restricting layer and a precipitation surplus relative to available soil moisture storage ca-pacity. The control of available soil moisture storage on hillslope-surface water connectivity was shown to be important in shallow soil systems underlain by relatively impermeable bedrock (Buttle et al. 2005; McNamara et al. 2005; Tromp-van Meerveld and McDonnell 2006), and should be even more critical in systems without a well-defined restricting layer and (or) deeper unsaturated sediments (Redding and
Devito 2008). Unsaturated lateral flow may occur on forested hillslopes, and is likely more important outside of the growing season, when plant demand is at a minimum.
Riparian groundwater plays an especially impor-tant role during periods of low flow. In watersheds with shallow soils and steep hillslopes, base flow is normally supplied by drainage of water stored in the riparian zone, which may be fed by a slow movement of water from the hillslopes (Hewlett and Hibbert 1967). Transpiration by riparian vegetation can ex-tract riparian groundwater that would otherwise dis-charge into the stream, producing a diurnal decrease in streamflow followed by recovery at night (Hewlett 1982; Bond et al. 2002).
Groundwater Hydrology
Groundwater refers to water that completely fills pore spaces within the zone of saturation beneath the Earth’s surface (Meinzer 1923). All geologic materials are composed of solids (i.e., actual grains, sediment, or rock matrix) and pore space (i.e., voids). The amount of available pore space and the inter-connectivity of pores govern the storage and trans-mission of groundwater. If all pore spaces are filled with liquid, then a porous medium is considered to be saturated. If air fills some pores, the material is considered to be unsaturated (Figure 6.11).
The distinction between saturated and unsaturat-ed subsurface zones is based on location of the water table, which is found at the top of the saturated zone (Figure 6.11), where the pore water pressure is equal to atmospheric pressure. Above the water table, wa-ter and air occupy pore spaces (Figure 6.11), and the water is held under tension by capillary forces at less than atmospheric pressure. Below the water table, the pore water pressure is greater than atmospheric pressure, and spatial variation in pore water pressure governs groundwater flow.
Groundwater contributes to the generation and regulation of streamflow in watersheds, and the sustainability of many wetlands, ponds, and lakes. The position of the water table (and distribution of pore water pressure) can also strongly influence slope stability (Sidle and Ochiai 2006). In cases where the water table rises rapidly because of a large storm event, many soils have reduced strength, and the potential for slope failure increases (Fannin et al. 2000). In streams, groundwater inflow and exchange with surface water in the hyporheic zone (the region below and adjacent to the streambed where surface
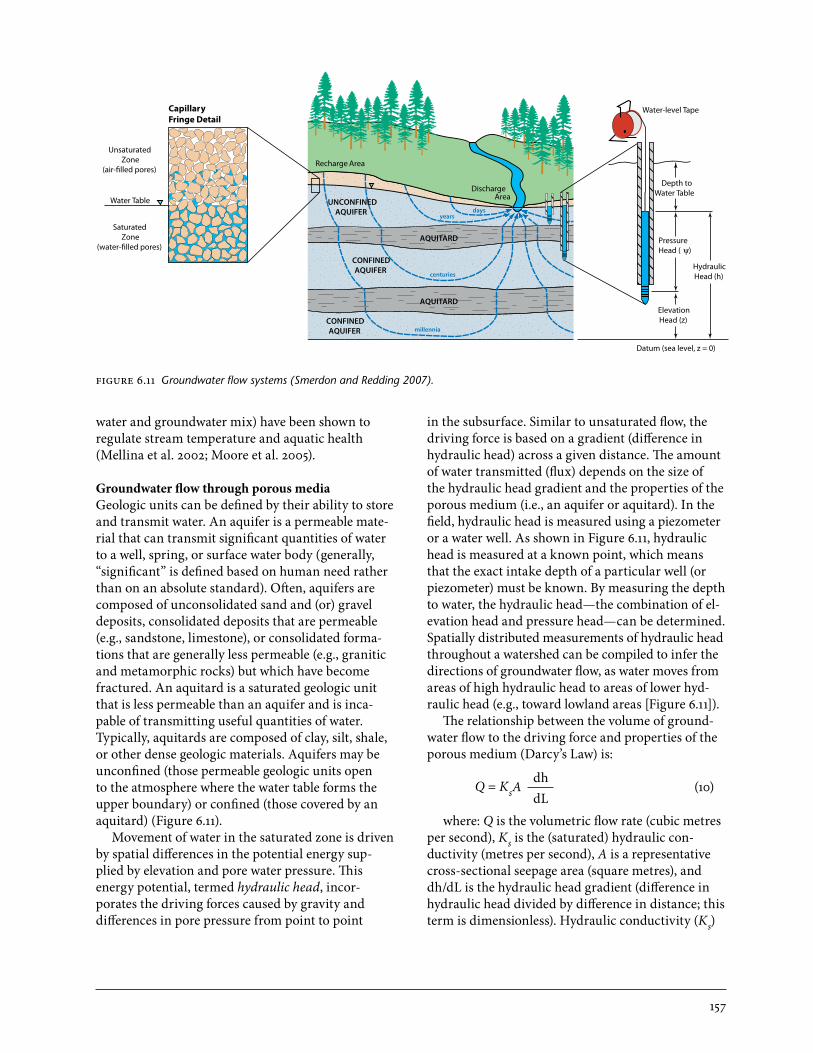
157
water and groundwater mix) have been shown to regulate stream temperature and aquatic health (Mellina et al. 2002; Moore et al. 2005).
Groundwater flow through porous mediaGeologic units can be defined by their ability to store and transmit water. An aquifer is a permeable mate-rial that can transmit significant quantities of water to a well, spring, or surface water body (generally, “significant” is defined based on human need rather than on an absolute standard). Often, aquifers are composed of unconsolidated sand and (or) gravel deposits, consolidated deposits that are permeable (e.g., sandstone, limestone), or consolidated forma-tions that are generally less permeable (e.g., granitic and metamorphic rocks) but which have become fractured. An aquitard is a saturated geologic unit that is less permeable than an aquifer and is inca-pable of transmitting useful quantities of water. Typically, aquitards are composed of clay, silt, shale, or other dense geologic materials. Aquifers may be unconfined (those permeable geologic units open to the atmosphere where the water table forms the upper boundary) or confined (those covered by an aquitard) (Figure 6.11).
Movement of water in the saturated zone is driven by spatial differences in the potential energy sup-plied by elevation and pore water pressure. This energy potential, termed hydraulic head, incor-porates the driving forces caused by gravity and differences in pore pressure from point to point
in the subsurface. Similar to unsaturated flow, the driving force is based on a gradient (difference in hydraulic head) across a given distance. The amount of water transmitted (flux) depends on the size of the hydraulic head gradient and the properties of the porous medium (i.e., an aquifer or aquitard). In the field, hydraulic head is measured using a piezometer or a water well. As shown in Figure 6.11, hydraulic head is measured at a known point, which means that the exact intake depth of a particular well (or piezo meter) must be known. By measuring the depth to water, the hydraulic head—the combination of el-evation head and pressure head—can be determined. Spatially distributed measurements of hydraulic head throughout a watershed can be compiled to infer the directions of groundwater flow, as water moves from areas of high hydraulic head to areas of lower hyd-raulic head (e.g., toward lowland areas [Figure 6.11]).
The relationship between the volume of ground-water flow to the driving force and properties of the porous medium (Darcy’s Law) is:
Q = KsA dhdL
(10)
where: Q is the volumetric flow rate (cubic metres per second), Ks is the (saturated) hydraulic con-ductivity (metres per second), A is a representative cross-sectional seepage area (square metres), and dh/dL is the hydraulic head gradient (difference in hydraulic head divided by difference in distance; this term is dimensionless). Hydraulic conductivity (Ks)
FIGURE 6.11 Groundwater flow systems (Smerdon and Redding 2007).
Recharge Area
Discharge
UNCONFINEDAQUIFER
AQUITARD
daysyears
centuries
millenniaCONFINEDAQUIFER
AQUITARD
CONFINEDAQUIFER
Area
Capillary Fringe Detail
UnsaturatedZone
(air-filled pores)
SaturatedZone
(water-filled pores)
Water Table
Datum (sea level, z = 0)
ElevationHead (z)
HydraulicHead (h)
PressureHead ( ψ)
Depth to Water Table
Water-level Tape

158
is an empirical proportionality constant describing the ease with which water passes through porous media. It is a specific version of permeability (k), which is an empirical constant describing the ease with which any fluid (water, oil, etc.) passes through porous media. These empirical constants range over many orders of magnitude, with higher values cor-responding to aquifers (i.e., highly permeable) and lower values corresponding to aquitards (i.e., less permeable).
Groundwater flow is greatest with larger gradi-ents of hydraulic head (i.e., steeply sloping water table) and higher hydraulic conductivity values. The geology (surficial and bedrock) of the area of interest strongly affects both gradient and hydraulic conductivity. The pore-size distribution and inter-connectivity of pores govern hydraulic conductiv-ity. Larger pores typically conduct more water than smaller pores. Many geologic materials also possess preferential flow pathways, such as macropores or fractures in bedrock, which allow water to be trans-ported at high rates relative to that in the surround-ing substrate.
Role of groundwater in watershedsGroundwater flow systems establish below the water table. These organized systems are comprised of recharge areas (high hydraulic head) that drive water to discharge areas (of low hydraulic head) (Figure 6.11). As a result, stream base flow can originate some distance from a stream. The travel time from recharge to discharge areas may be as short as days or longer than centuries depending on flow system depth and whether the flow path is at a “local” or “regional” scale (Toth 1962). Shallow, local-scale flow systems exhibit seasonal variability in flow rates because they respond to variations in infiltration rates and can be greatly affected in the short term by land use or climate change. Deeper, regional-scale flow systems tend to buffer short-term variability but integrate a multitude of changes over the long term, making deleterious impacts more difficult to reverse. Local and regional scales of groundwater flow systems can create different surface and subsur-face watersheds (Winter et al. 2003). A well-defined surface watershed may not correspond to that for groundwater, which is controlled by geology.
Groundwater discharge to streams is commonly expressed as base flow, which is streamflow that occurs during dry times of the year (not caused by specific storm events or seasonal phenomena, such as snowmelt). Figure 6.11 illustrates a typical
groundwater flow system and groundwater that supplies a stream. This is an example of a gain-ing stream, which gains discharging groundwater along its length. Surface water bodies, however, are both sources of and sinks for groundwater. Losing streams are those in which stream discharge de-creases downstream because of water losses through the streambed to groundwater. Flow-through streams simultaneously gain and lose groundwater along their length. Flow-through stream reaches typically occur where a stream meanders through a low-gradient area in which the groundwater flow is parallel to the general valley alignment and tends to “short-cut” the meander bends. When the groundwater table lies below the stream channel, the stream is perched and loses flow in the downstream direction. A single stream can have reaches that are gaining, losing, or flow-through. This is determined largely by the physical properties of the underly-ing sediments (Winter 1999) and the topography of the watershed. Other surface water bodies, such as wetlands or lakes, exhibit the same gaining/los-ing/flow-through characteristics depending on the groundwater flow system and their position within the landscape. Many wetland types are therefore classified by their interaction with groundwater (Rydin and Jeglum 2006). For example, bogs form in locations where groundwater inflow to the wetland is minimal, whereas fens have groundwater flowing into and through the wetland. The wetland classi-fication system for the province includes the role of groundwater (MacKenzie and Moran 2004).
In addition to the complexity of flow systems described so far, some saturated zones may become perched above a deeper, regional water table. For these isolated zones of saturation, which meet the definition of groundwater, the word “perched” is added to note their disconnection from most of the groundwater regime. Perched conditions often develop above a layer of low permeability (perching layer), which creates a saturated zone in a gener-ally unsaturated subsurface zone (Sidle and Ochiai 2006). Perched water tables may be relatively long term or transient (seasonal or an event), and can be common in environments with high rainfall and shallow soils that lie over a suitable perching layer. The development of these transient perched systems is a common driver of subsurface stormflow (Weiler et al. 2005).
The role of groundwater in a watershed is com-plex, given that groundwater flow systems may have cycling times that range from days to centuries, and

159
that the interaction with surface water can create gaining, losing, or flow-through systems (Winter et al. 2003). Besides contributing to stream base flow, groundwater adjacent to streams can buffer peak flows if bank sediments are sufficiently permeable. A rise in stream stage may temporarily exceed the level of the adjacent water table and cause gaining stream reaches to become losing streams until the stream stage declines (known as a groundwater flow revers-al). Also, transpiration by vegetation in a riparian zone may extract local groundwater and cause a diurnal decrease in streamflow followed by recovery at night (Dunford and Fletcher 1947; Hewlett 1982, Bond et al. 2002). Studies conducted in Australia and South Africa demonstrated that riparian vegeta-tion is a more liberal user of water than vegetation in other parts of a watershed (Bren 1997; Scott 1999), and can cause sections of small streams to dry up in periods of low flow. Stream drying may occur frequently in the headmost portions of the channel network, interrupting connectivity. For example, in the central interior of British Columbia, Story et
al. (2003) found that dewatering of an intermedi-ate segment of stream channel effectively decoupled a lower reach from the warming effects associated with harvesting and road construction on an upper reach of a small stream. The broader biogeochemical and ecological implications of changing connectivity along the length of streams in forested areas do not appear to have been examined.
Groundwater flows are critical to maintaining aquatic health (Douglas 2006, 2008) since these flows buffer nutrients and temperature fluctua-tions (Story et al. 2003), especially in riparian and hyporheic zones (Dahm et al. 1998; Hayashi and Rosenberry 2001). In northern climates, where many surface water bodies freeze in winter, groundwater inflows or seepage can maintain open water, thus providing temperature refugia for fish (Power et al. 1999). Groundwater inflows can also help maintain healthy temperatures for overwintering eggs of sock-eye salmon (Leman 1993). In summer, groundwater inflows to streams may reduce stream temperatures, which is critical for fish survival.
streamflow
Streamflow is water flowing in, or discharging from, a natural surface stream. Streamflow is often referred to as discharge or runoff, which can be confusing. Discharge is the volume of water flowing past a refer-ence point in a stream, canal, pipe, or other struc-ture. In addition to being used synonymously with discharge, runoff is also often used to refer to water flowing downslope along or from any surface. Defi-nitions of these terms are provided in Appendix 1 (“Glossary of Hydrologic and Geomorphic Terms”).
Streamflow regimes, including the timing and duration of high and low flows, vary depending on the predominant form of precipitation (rain, snow, or mixed rain and snow), on whether streamflow is augmented by glacial melt, and on how precipita-tion is stored and released within the watershed. The hydrologic regimes of British Columbia are detailed in Chapter 4 (“Regional Hydrology”). If water in a stream flows throughout the year, then the stream is referred to as perennial. The total length of perennial streams per unit watershed area in a watershed, re-ferred to as the drainage density (km/km2), provides an indication of how quickly streamflow responds to rainfall or snowmelt in one watershed relative to another. Streams with flow only in response to storm
events and no flow during dry seasons or in particu-larly dry years are referred to as ephemeral. Streams in which flow occurs only seasonally in direct response to precipitation or to flow from intermittent springs are referred to as intermittent (UNESCO and World Meteorological Association, International Hy-drology Programme 1998). The stream network and adjacent contributing areas expand and contract in response to rainfall and snowmelt depending on an-tecedent conditions and on the amount and duration of rain or snow input (Figure 6.12). These contribut-ing areas are often referred to as the variable source area (Hewlett 1982). Streamflow reflects the cumula-tive effects of the biophysical environment on the balance of precipitation inputs to a watershed, plus losses through evaporation and transpiration, and storage within the watershed.
Streamflow is expressed by the continuity equa-tion as the volume of water passing a given channel cross-section area per unit time:
Q = wdv (11)
where: Q is streamflow, discharge, or the volumet-ric flow rate (cubic metres per second); w is the chan-nel width (metres); d is mean depth (metres); and

160
v is mean stream velocity (metres per second). The equation above is a simplified version of the cross-section equation applied by most hydrometric moni-toring agencies. (For a more detailed explanation of discharge measurements, see Chapter 17, “Watershed Measurement Methods and Data Limitations.” Appendix 2, “Acronyms, Initialisms, Symbols, and Conversion Factors,” contains details on calculating unit discharge.) Since total streamflow at any point along a channel is affected by the size of the contrib-uting area, it is often also useful to express flow as a depth equivalent over the watershed (millimetres per unit of time). This metric, known as the unit area discharge, is useful when comparing streamflow to precipitation and determining water budgets (ex-pressed in millimetres), and when comparing water yield between watersheds or geographic areas.
At most gauging stations, streamflow is recorded at intervals as frequent as 15 minutes. (For a more detailed explanation of discharge measurements, see Chapter 17, “Watershed Measurement Methods and Data Limitations.”) The 24-hour average of these val-ues is published as mean daily discharge. In Canada, a national network of streamflow gauging stations is maintained by the Water Survey of Canada through agreements between Environment Canada, Indian
and Northern Affairs Canada, and the provinces. Streamflow data, both archived long-term and real-time, are available electronically through the Environment Canada website (www.wateroffice.ec.gc.ca/index_e.html). In British Columbia, 451 sta-tions were active in May 2010. Of these, 313 recorded natural (unregulated) flows from watersheds with-out diversions, storage, or water extraction. These gauging stations are located in watersheds ranging in size from less than 3 km2 (Jamieson Creek at the mouth) to 104 000 km2 (Liard River at lower cross-ing). Several stations, such as those located in the Lillooet, South Thompson, and Slocan River water-sheds, provide more than 80 years of record. The most common variables used to describe streamflow are seasonal or annual water yield, peak flow, low flow, frequency at which streamflows of a certain magnitude occur, and duration of streamflows of a certain magnitude.
The Hydrograph
Streamflow variations over any time period can be represented by a hydrograph (Figure 6.13), which shows peak flows, low flows, and water yield over the course of a year, plus individual storm events or flows over a day, several days, or a season. The hydrograph can also show how streamflow responds to rainfall or snowmelt (Figure 6.13). Hydrographs typical of streams across British Columbia were described in Chapter 4, “Regional Hydrology.” Note that these hydrological classifications are somewhat arbitrary and depend on the conceptual model of streamflow generation assumed by the analyst.
Streamflow begins to increase some time after the onset of a rainstorm or snowmelt. This increase is shown as the rising limb of the hydrograph (Figure 6.14). The time from the centroid (or centremost point in time) of a rainstorm to the peak in stream-flow generated by that storm is referred to as basin lag. The time required for water to flow from the farthest point on the watershed to a point of interest, such as a gauging station or culvert, is referred to as the time of concentration. The maximum streamflow or discharge in response to a storm or snowmelt is referred to as peak flow. The definition of peak flow depends on the time period of interest (e.g., event, seasonal, annual). The magnitude of a peak flow is a function of rainstorm duration or snowmelt volume; storm intensity or melt rate; antecedent conditions affecting storage opportunities, such as soil moisture, soil characteristics, forest floor condi-
FIGURE 6.12 Hypothetical example of expanding variable source areas within a headwater watershed during a runoff event. Thicker lines indicate greater runoff contribution. (Adapted from Hewlett 1982)

161
tions, snowpack conditions, and canopy wetness; and watershed characteristics, including drainage area, topography, and physiography. In watersheds with large floodplains, streamflow may be stored or detained in the floodplain alluvium. From there, it is later released back into the channel as base flow, thereby reducing peak flow (Ritter et al. 2002). Simi-larly, lakes, reservoirs, and wetlands in a watershed may also reduce the magnitude of peak flows.
After a storm or snowmelt, contributions to the channel decrease, as shown by the recession (falling) limb on the hydrograph (Figure 6.14). The shape of
the recession limb is influenced by the physical char-acteristics of the watershed. Once rain- and snow-melt-generated surface and subsurface contributions to the channel are depleted, the remaining stream-flow is referred to as base flow. It is the proportion of the flow in a stream that is contributed by ground-water, or by flow from lakes, wetlands, or glaciers during prolonged periods without precipitation. Base flow also forms part of the hydrograph peak, but is small relative to the total streamflow during a rainstorm or snowmelt.
FIGURE 6.13 Typical hydrographs for coastal (Stave River above Stave Lake [282 km2]) and interior (Blue River near Blue River [280 km2]) watersheds in British Columbia. The hydrographs show the 2005 daily discharge rates, and the maximum and minimum daily flows for Stave River (1983–2005) and Blue River (1926–2006), respectively. (Source: Water Survey of Canada, www.wateroffice.ec.gc.ca/index_e.html)
Daily discharge for Stave River above Stave Lake (08MH147)
Daily discharge for Blue River above Blue River (08LB038)
2005 Data Max Min
2005 Data Max Min
Jan 1 Feb 1 Mar 1 Apr 1 May 1 Jun 1 Jul 1 Aug 1 Sep 1 Oct 1 Nov 1 Dec 1
Jan 1 Feb 1 Mar 1 Apr 1 May 1 Jun 1 Jul 1 Aug 1 Sep 1 Oct 1 Nov 1 Dec 1
700
600
500
400
300
200
100
0
110
100
90
80
70
60
50
40
30
20
10
0
Dis
char
ge (m
3 /s)
Dis
char
ge (m
3 /s)

162
In many snow-dominated watersheds, stream-flows are typically low during late summer or early fall through the winter until spring freshet. Low flows are the minimum flow or absence of flow in a stream, and are often characterized by the lowest average flow over a defined time interval (i.e., 7-day period each year) (Pike and Scherer 2004). These flows are referred to as low flow and are maintained by base flow and occasional rainfall. The sources of base flow in a watershed can be thought of as storage reservoirs. The amount of precipitation ultimately defines the amount of recharge that occurs in these storage reservoirs, whereas the release of water is more a function of physiographic characteristics, such as climate, topography, soils, and geology (Sma-khtin 2001). The natural variability of low flows is caused by the complex interaction and heterogeneity of watershed characteristics. During the dry season, many natural processes can affect low flows, includ-ing “the distribution and infiltration characteristics of the soils, the hydraulic characteristics and ex-tent of aquifers, the rate, frequency and amount of
recharge by periodic rainstorms, the evapotranspira-tion rates from the basin, distribution of vegetation types, topography and climate” (Smakhtin 2001:149).
Annual water yield is the total streamflow (meas-ured in millimetres, cubic metres, or cubic decame-tres [1 dam3 = 1000 m3]) from a watershed over a water year. A water year can be defined as January through December, or any other 12-month period that best captures the precipitation that generates the described streamflow. In snowmelt-dominated regimes, the water year is often set at October 1 through September 30. The streamflow generated during this period is a result of the total precipitation that occurs during this time, including snow that accumulates over the winter. The advantage of using the water year in many parts of the province is that it begins and ends at the time of year when flows and watershed storage are at their lowest, which allows for greater precision in water balance calculations. In British Columbia, annual water yield varies from 50 mm to more than 3000 mm depending on loca-tion. Examples of annual water yields from streams
Rising limb
Hydrograph separationLine (arbitrary)
Baseflow
Ground water recession
Falling limb
Centre of mass of rainstorm
Basin lag
Time of rise
Peak flow rate
Stormflow
Time (hr)
Dis
char
ge (m
3 /s)
Rain
fall
(mm
/hr)
FIGURE 6.14 Components of the hydrograph. (Adapted from Hewlett 1982)

163
throughout the province are provided in Table 6.2.Hydrograph shape is affected by both climate
and the biophysical characteristics of the watershed, with climatic factors dominating the rising limb and watershed characteristics the recession limb. Key climatic factors that influence the hydrograph include rainfall intensity, duration and distribution, storm direction and type, and form of precipitation (Gray 1970). Rainfall intensity and duration deter-mine the volume and duration of stormflow. For a given duration, increased rainfall intensity increases both peak flow and stormflow volume once soil stor-age and (or) infiltration capacity has been exceeded. For a given intensity of storm, its duration will affect the duration of stormflow and, in part, peak flow. These effects are most noticeable in small watersheds but are rarely measurable in large watersheds. The areal distribution of rainfall in a watershed will af-fect hydrograph shape. A storm near the outlet of a watershed will result in a sharp-peaked hydrograph, whereas if the storm occurs in the upper reaches, the hydrograph will generally be broader and have a lower peak. Storms that move down a valley tend to produce more rapid and higher streamflow peaks than storms moving up a watershed. Hydrographs generated by melting snow tend to be lower and broader than those generated by rain. Thunder-storms produce the sharpest peaks in small water-sheds, whereas large frontal storms produce the most significant peaks in large watersheds (Gray 1970). How quickly streamflow responds to precipitation or snowmelt is often referred to as flashiness or hydro-logic response.
The topographic and physiographic characteris-tics of a watershed influence the amount and rate at which excess rainfall and snowmelt are delivered to the channel. These characteristics include: watershed size and shape; drainage density and distribution; slope of the watershed and channel; and presence of natural storage reservoirs, such as lakes, ponds, and wetlands (Gray 1970). Generally, the smaller and steeper the watershed, the greater the drainage density, and the more uniform the distribution of channels, the steeper and narrower the hydro-graph. When there is greater opportunity for detention and storage of flow in a watershed, the hydrograph becomes broader. Each factor influencing the hydrograph may be compounded or obscured by the effect of another; therefore, the hydrograph for individual watersheds will depend on the cumulative effect of all factors specific to the watershed (Gray 1970).
Extreme Events
Streamflow records covering a sufficient time frame to describe the frequency and duration of specific flow conditions provide an understanding of extreme streamflow conditions such as flooding and low flow, which are of central importance to the physical and ecological integrity of streams in forested watersheds (Poff et al. 1997). Streamflow frequency and duration are described only briefly here. Thorough discussions of flow regime analysis are provided in engineering and flood forecasting texts, such as Maidment (editor, 1993) and references therein.
TABLE 6.2 Total annual streamflow volume and water yield per unit area from selected research watersheds throughout British Columbia
Annual Annual water Area streamflow yield per unitGeneral location Watershed (km2) Years of record volume (dam3)a area(mm)
Coast Jamieson Creek 3 2002–2004 8 750 2917 Carnation Creek 10 1973–2006 25 700 2570 Tsitika River 365 1975–2006 709 000 1942
Southern Interior 240 Creek 5 1984–2006 1 880 376 Redfish Creek 26 1968 ; 2006 27 200 1046 Fishtrap Creek 135 1972–2002 ; 2005–2006 24 900 184
Northern Interior Chuchinka Creek 310 1976–2006 157 000 506 Baker Creek 1550 1964–2006 151 000 97 Bowron River 3420 1977–2006 2 030 000 594
a dam3: a cubic decametre equals 1000 m3.
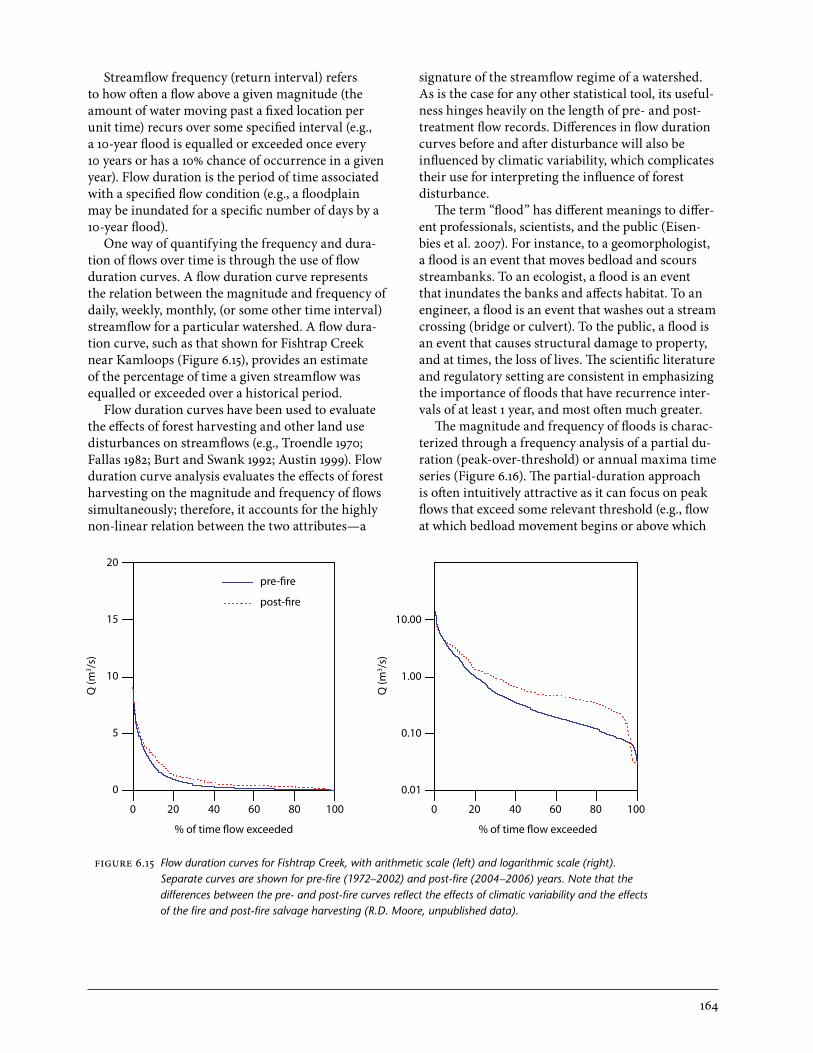
164
Streamflow frequency (return interval) refers to how often a flow above a given magnitude (the amount of water moving past a fixed location per unit time) recurs over some specified interval (e.g., a 10-year flood is equalled or exceeded once every 10 years or has a 10% chance of occurrence in a given year). Flow duration is the period of time associated with a specified flow condition (e.g., a floodplain may be inundated for a specific number of days by a 10-year flood).
One way of quantifying the frequency and dura-tion of flows over time is through the use of flow duration curves. A flow duration curve represents the relation between the magnitude and frequency of daily, weekly, monthly, (or some other time interval) streamflow for a particular watershed. A flow dura-tion curve, such as that shown for Fishtrap Creek near Kamloops (Figure 6.15), provides an estimate of the percentage of time a given streamflow was equalled or exceeded over a historical period.
Flow duration curves have been used to evaluate the effects of forest harvesting and other land use disturbances on streamflows (e.g., Troendle 1970; Fallas 1982; Burt and Swank 1992; Austin 1999). Flow duration curve analysis evaluates the effects of forest harvesting on the magnitude and frequency of flows simultaneously; therefore, it accounts for the highly non-linear relation between the two attributes—a
signature of the streamflow regime of a watershed. As is the case for any other statistical tool, its useful-ness hinges heavily on the length of pre- and post-treatment flow records. Differences in flow duration curves before and after disturbance will also be influenced by climatic variability, which complicates their use for interpreting the influence of forest disturbance.
The term “flood” has different meanings to differ-ent professionals, scientists, and the public (Eisen-bies et al. 2007). For instance, to a geomorphologist, a flood is an event that moves bedload and scours streambanks. To an ecologist, a flood is an event that inundates the banks and affects habitat. To an engineer, a flood is an event that washes out a stream crossing (bridge or culvert). To the public, a flood is an event that causes structural damage to property, and at times, the loss of lives. The scientific literature and regulatory setting are consistent in emphasizing the importance of floods that have recurrence inter-vals of at least 1 year, and most often much greater.
The magnitude and frequency of floods is charac-terized through a frequency analysis of a partial du-ration (peak-over-threshold) or annual maxima time series (Figure 6.16). The partial-duration approach is often intuitively attractive as it can focus on peak flows that exceed some relevant threshold (e.g., flow at which bedload movement begins or above which
FIGURE 6.15 Flow duration curves for Fishtrap Creek, with arithmetic scale (left) and logarithmic scale (right). Separate curves are shown for pre-fire (1972–2002) and post-fire (2004–2006) years. Note that the differences between the pre- and post-fire curves reflect the effects of climatic variability and the effects of the fire and post-fire salvage harvesting (R.D. Moore, unpublished data).
0 20 40 60 80 100 0 20 40 60 80 100
% of time flow exceeded % of time flow exceeded
pre-fire
post-fire
20
15
10
5
0
10.00
1.00
0.10
0.01
Q (m
3 /s)
Q (m
3 /s)

165
the stream overflows its banks); however, the theo-retical basis for interpreting partial-duration series is weaker than that for analyzing annual extreme series.
At a gauged watershed with a long continuous record of flows, a time series of annual extremes is fitted to a theoretical frequency distribution by the method of moments, L-moments, or maximum likelihood. The fitted distribution is then used to estimate the magnitude of extremes for specific return periods of interest (Coulson 1991). Three ma-jor sources of error are associated with such at-site frequency analyses.
The first source of error is caused by the misiden-tification of the underlying frequency distribution, the magnitude of which depends on how much the assumed model differs from the actual parent distribution. For the relatively short record length of streamflow data that is typically available, several distributions with extremely different upper tail characteristics often give an equally good fit in the range of observed floods. This can have major impli-cations for the predictions of extreme flood events.
The second source of error in at-site frequency analysis is caused by sampling deficiencies, where the length of record (i.e., sample size) is not long enough for a reliable statistical analysis (especially for long return periods). This problem is particularly relevant in British Columbia, where a relatively small
number of hydrometric stations have more than 30 years of record.
The third source of error is caused by lack of stationarity. Conventional flood frequency analysis is based on the fundamental assumption that the time series of observed floods is stationary, and as such, has not been affected by either climate or land use. Newly emerging flood frequency analysis techniques that are not constrained by such assumptions should be used to accommodate time series that may have been affected by climate change or forest regrowth (El Adlouni et al. 2007).
For a watershed with short or non-existent flow records, various regional flood frequency analysis techniques can be used to estimate the magnitude and frequency of floods. Regional models are based on the premise that if a set of gauged watersheds can be used to identify a hydrologically “homogene-ous” region, flood frequency characteristics could be transferred from the gauged to ungauged basins within such a region. Pooling of data from a set of nearby gauged watersheds within a homogeneous region is equivalent to increasing the flow record length; therefore, it provides a more reliable way of identifying a regional flood frequency distribution and estimating its higher-order parameters. Several regional flood frequency models are available for British Columbia (e.g., Obedkoff 1998; Eaton et al. 2002). Model development was based on a sparse
FIGURE 6.16 Annual flood frequency plot for Fishtrap Creek for pre-fire years (R.D. Moore, unpublished data).
05
1015
2025
1.001 1.1 1.5 2 5 10 15 30 50 100 200
Time (yr)
Peak
flo
w (m
3 /s)

166
network of gauged watersheds, particularly in north-ern British Columbia; therefore, these models are appropriate only for generating first-order approxi-mations of the magnitude and frequency of floods at ungauged watersheds. In addition, the histori-cal hydrometric database in the province consists largely of medium and large basins (i.e., drainage area > 100 km2), and so all British Columbia regional models are limited in application to basins within this size range. Few data are available to indicate how well these regional models can be extrapolated to small forested watersheds of less than 100 km2. Successful application of these models requires con-siderable judgement, experience, and understanding of hydrologic and hydro-climatic principles, par-ticularly when estimating floods for small ungauged watersheds.
Low-flow frequency analysis is used to evaluate the ability of a stream to meet specified flow require-ments. Such analysis can provide an indication of the adequacy of the flow to meet a given demand with a stated probability of experiencing a shortage. Low-flow frequency analysis is used for applications such as designing hydroelectric power plants, determin-ing minimum flow requirements for fish or wildlife, and designing water storage projects. Annual low flows are usually computed for several durations (in days), with flow rates expressed as the mean flow for the period. The number of days over which the aver-age low flow is calculated depends on the operational problem at hand. The estimation of low flow magni-tude and frequency follows the same procedures and is subject to the same limitations as that for floods, even though the governing physical processes are different. In the case of low flows, the return period is the average length of time between events in which the flow index is as low as or lower than a specific value. Site and regional low-flow analysis models are based on a set of different frequency distributions developed for time series of minima.
Hydrologic Response
How quickly streamflow increases at the begin-ning of a rainfall event or as snow begins to melt is referred to as hydrologic response. This depends on the form of precipitation, antecedent conditions, watershed characteristics, and the flow paths along which water is delivered through the watershed to the stream channel. For example, during an intense, wet-season rainstorm and at the end of the snowmelt season, hydrologic response may be almost immedi-
ate. Conversely, hydrologic response may be slow, lagging precipitation events by months during the winter in snow-dominated environments or after periods of drought. When a precipitation event oc-curs over an entire watershed, and the antecedent conditions plus rates of flow through the area are similar, contributions to streamflow from all por-tions of the watershed may be synchronized. This generally occurs in small watersheds and results in a “flashy” (rapid) response to storm events. In a large watershed, greater variability is likely to occur across the landscape, resulting in desynchronization of flow to the outlet and a more moderated storm response.
Water that contributes to streamflow arrives at the channel along one or more of four generalized flow paths: (1) direct precipitation onto the stream channel, (2) overland flow, (3) shallow subsurface flow or throughflow, and (4) deep subsurface flow or groundwater.
Rain intercepted directly by the channel becomes streamflow immediately. This is usually a minor contribution to the total flow in a stream unless the surface area of the stream is large relative to the area of its watershed (> 1%) (Satterlund and Adams 1992). Stream surface area varies with time of year and storm size. It is small to intermittent during dry periods and larger towards the end of a significant storm, during the wet season, and during snowmelt when the stream network connects to intermittent and ephemeral channels.
Precipitation that reaches the watershed area outside a stream channel can be stored at the surface, or can infiltrate into the soil or flow over an imper-meable surface. Overland flow does not occur unless the precipitation rate exceeds the infiltration rate, an impermeable layer (e.g., road or hydrophobic layer) is present, or all surface storage and infiltration capaci-ties have been filled. Where these conditions occur and are continuous down the slope to the stream channel, overland flow contributes to streamflow relatively quickly after the onset of rain or snowmelt. Overland flow is most common in areas of rock outcrop, along roads, in areas of shallow and (or) wa-terlogged soil, on soils with reduced surface perme-ability caused by logging, grazing, or fire, and over densely frozen soil. The rate at which overland flow reaches a stream channel depends on the distance to the channel, vegetation density, surface rough-ness, and soil permeability downslope (Satterlund and Adams 1992). Overland flow in undisturbed forest soils with a well-developed litter layer is not common, especially on upper slopes that have a high
167
infiltration capacity and greater soil moisture storage capacity (i.e., soil water deficits are common).
Water that has infiltrated into the soil flows towards channels, adding to streamflow more slowly than water contributed at the surface. The most rapid delivery of water along subsurface flow paths occurs near the surface in areas where surficial materials are highly porous or where interconnected macro pores or preferential flow pathways occur through the soil. This is also referred to as interflow. Subsurface flows on lower slopes and in riparian areas can also be rapid because of less available storage (i.e., higher antecedent soil moisture storage) and proximity to stream channels.
Channel interception, surface runoff, and in-terflow are often referred to together as quickflow or stormflow. Deep subsurface flow or base flow, which is also referred to as delayed runoff, is water that drains from the landscape slowly and sustains streamflow during dry periods. This may include contributions from groundwater, saturated soil, and
unsaturated soil. The soil moisture or groundwater contributions to base flow are not always replaced during every storm or during snowmelt, as is the case with water moving along other flow paths.
Water can move from one flow pathway to another on its way downslope to a stream chan-nel. Therefore, small headwater streams, where flow pathways are short and storms deliver rainfall uni-formly across the watershed, are most responsive to rainfall events. These streams are also most affected by changes in flow pathways caused by disturbance, even though the proportion of precipitation that appears as streamflow differs from storm to storm. In larger watersheds, lag effects and differences in flow contributions from tributary streams compli-cate hydrologic response to precipitation, providing opportunities for desynchronization of flows from different parts of the watershed and potentially mod-erating hydrologic response and snowmelt-generated peak flows (Ward and Robinson 1989; Satterlund and Adams 1992).
summary
Hydrologic processes, including precipitation, in-terception, evaporation, and subsurface storage and flow, all affect water delivery to, storage in, and flow from forested watersheds. Each process, as affected by the weather, influences the quantity, timing, and variability of streamflow events. These events, in turn, affect slope and stream channel integrity,
stream ecology, water supplies, infrastructure, and the public. The consequences of forest disturbance, through natural events or human activity, on hydro-logic processes and streamflow are described in the next chapter (“The Effects of Forest Disturbance on Hydrologic Processes and Watershed Response”).
acknowledgements
The authors would like to thank Dr. Y. Alila (Uni-versity of British Columbia) for assistance with the section on Streamflow Frequency and Duration.

168
references
Adams, P.W., A.L. Flint, and R.L. Fredriksen. 1991. Long-term patterns in soil moisture and reveg-etation after a clearcut of a Douglas-fir forest in Oregon. For. Ecol. Manag. 41:249–263.
Adams, R.S., D.L. Spittlehouse, and R.D. Winkler. 1998. The snowmelt energy balance of a clear-cut, forest and juvenile stand. In: Proc. 23rd Conf. on Agric. and For. Meteorol., Nov. 2–6, 1998, Albuquerque, N.M. Am. Meteorol. Soc., Boston, Mass., pp. 54–57.
Allen, R.G., L.S. Pereira, D. Raes, and M. Smith (edi-tors). 1998. Crop evapotranspiration: guidelines for computing crop water requirements. U.N. Food Agric. Org., Rome, Italy. FAO Irrigation and Drainage Pap. FAO56. www.fao.org/docrep/X0490E/X0490E00.htm (Accessed March 2010).
Anderson, A.E. 2008. Patterns of water table dynam-ics and runoff generation in a watershed with preferential flow networks. PhD thesis, Univ. British Columbia, Vancouver, B.C.
Anderson, M.G. and T.P. Burt (editors). 1990. Pro-cess studies in hillslope hydrology. John Wiley and Sons Ltd., Chichester, U.K.
Anderson, S.P., W.E. Dietrich, D.R. Montgomery, R. Torres, M.E. Conrad, and K. Loague. 1997. Subsurface flow paths in a steep, unchanneled catchment. Water Resour. Res. 33:2637–2653.
Arain, M.A., T.A. Black, A.G. Barr, T.J. Griffis, K. Morgenstern, and Z. Nesic. 2003. Year-round observations of the energy and water vapour fluxes above a boreal black spruce forest. Hy-drol. Process. 17:3581–3600.
Austin, S.A. 1999. Streamflow response to forest management: a meta-analysis using published data and flow duration curves. MSc thesis. Colo. State Univ., Fort Collins, Colo.
Barrett, G. and O. Slaymaker. 1989. Identification, characterisation and hydrological implications of water repellency in mountain soils, southern B.C. Catena 16:477–489.
Beaudry, P.G. and D.L. Golding. 1983. Snowmelt dur-ing rain on snow in coastal British Columbia.
In: Proc. 51st Annu. West. Snow Conf., Van-couver, Wash., pp. 55–66.
Beaudry, P.G. and R.M. Sager. 1995. The water bal-ance of a coastal cedar hemlock ecosystem. In: Mountain hydrology, peaks and valleys in research applications. B.T. Guy and J. Barnard (editors). Can. Water Resour. Assoc., Cam-bridge, Ont., pp. 3–16.
Bengtsson, L. 1980. Evaporation from a snow cover: review and discussion of measurements. Nor-dic Hydrol. 11:221–234.
Bernier, P.Y. 1990. Wind speed and snow evaporation in a stand of juvenile lodgepole pine in Alberta. Can. J. For. Res. 20:309–314.
Berris, S.N. and R.D. Harr. 1987. Comparitive snow accumulation and melt during rainfall in for-ested and clear-cut plots in the Western Cas-cades of Oregon. Water Resour. Res. 23:135–142.
Beven, K. 2006. Streamflow generation processes: benchmark papers in hydrology. Int. Assoc. Hydrol. Sci., Wallingford, U.K.
Beven, K. and P. Germann. 1982. Macropores and water flow in soils. Water Resour. Res. 18:1311–1325.
Beven, K.J. 2001. Rainfall-runoff modelling: the primer. John Wiley and Sons, Chichester, U.K.
Black, T.A. and F.M. Kelliher. 1989. Processes con-trolling understorey evapotranspiration. Phil. Trans. R. Soc. Lond. B 324:207–231.
Bladon, K.D., U. Silins, S.M. Landhäusser, and V.J. Lieffers. 2006. Differential transpiration by three boreal tree species in response to in-creased evaporative demand after variable retention harvesting. Agric. For. Meteorol. 138:104–119.
Bohren, C.F. and D.B. Thorud. 1973. Two theoreti-cal models of radiation heat transfer between forest trees and snowpacks. Agric. Meteorol. 1(1973):3–16.
Bond, B.J., J.A. Jones, G. Moore, N. Phillips, D. Post, and J.J. McDonnell. 2002. The zone of vegeta-tion influence on baseflow revealed by diel

169
patterns of streamflow and vegetation water use in a headwater basin. Hydrol. Process. 16:1671–1677.
Bonell, M. 1993. Progress in the understanding of runoff generation dynamics in forests. J. Hydrol. 150:217–275.
_______. 1998. Selected challenges in runoff genera-tion research in forests from the hillslope to headwater drainage basin scale. J. Am. Water Resour. Assoc. 34:765–785.
Boon, S. 2007. Snow accumulation and ablation in a beetle-killed pine stand in northern interior British Columbia. B.C. J. Ecosyst. Manag. 8(3):1–13. www.forrex.org/publications/jem/ISS42/vol8_no3_art1.pdf (Accessed March 2010).
Brady, N.C. and R.R. Weil. 2007. The nature and properties of soil. 14th ed. Pearson Education, Upper Saddle River, N.J.
Bren, L.J. 1997. Effects of slope vegetation removal on the diurnal variations of a small mountain stream. Water Resour. Res. 33(2):321–331.
Burt, T.P. and W.T. Swank 1992. Flow frequency responses to hardwood-to-grass conversion and subsequent succession. Hydrol. Process. 6:179–188.
Buttle, J.M., I.F. Creed, and R.D. Moore. 2005. Advances in Canadian forest hydrology, 1999–2003. Hydrol. Process. 19:169–200.
Buttle, J.M. and D.J. McDonald. 2002. Coupled vertical and lateral preferential flow on a forested slope. Water Resour. Res. 38(5):1060. DOI:10.1029/2001WR000773.
Calder, I.R. 1990. Evaporation in the uplands. John Wiley and Sons, New York, N.Y.
_______. 1991. Microwave transmission, a new tool in forest hydrological research: comment. J. Hydrol. 125:311–312.
Carlyle-Moses, D.E. 2004. Throughfall, stemflow and interception loss fluxes from a semi-arid Sierra Madre Oriental matorral community. J. Arid Environ. 58:180–201.
Cheng, J.D. 1988. Subsurface stormflows in the highly permeable forested watersheds of south-
western British Columbia. J. Contam. Hydrol. 3:171–191.
Conway, H. and R. Benedict. 1994. Infiltration of water into snow. Water Resour. Res. 30:641–649.
Coulson, C.H. (editor). 1991. Manual of operational hydrology in British Columbia. 2nd ed. B.C. Min. Environ., Water Manag. Div., Hydrol. Sect., Victoria, B.C. www.for.gov.bc.ca/hfd/library/documents/bib65026.pdf (Accessed March 2010).
Crockford, R.H. and D.P. Richardson. 2000. Parti-tioning of rainfall into throughfall, stemflow and interception: effect of forest type, ground cover and climate. Hydrol. Process. 14:2903–2920.
Cunnane, C. 1989. Statistical distributions for flood frequency analysis. World Meteorol. Org., Oper. Hydrol. Rep. No. 33, WMO No. 718, Ge-neva, Switzerland.
Curran, M.P., B. Chapman, G.D. Hope, and D. Scott. 2006. Large scale erosion and flood after wild-fires: understanding the soil conditions. B.C. Min. For. Range, Res. Br., Victoria, B.C. Tech. Rep. No. 030. www.for.gov.bc.ca/hfd/pubs/Docs/Tr/Tr030.htm (Accessed March 2010).
Dahm, C.N., N.B. Grimm, P. Marmonier, H.M. Valett, and P. Vervier. 1998. Nutrient dynam-ics at the interface between surface waters and groundwaters. Freshwater Biol. 40:427–451.
Delzon, S. and D. Loustau. 2005. Age-related decline in stand water use: sap flow and transpiration in a pine forest chronosequence. Agric. For. Meterol. 129:105–119.
De Villiers, G. du T. 1982. Predictive models for est-imating net rainfall and interception losses in savanna vegetation. Water SA 8:208–212.
Devito, K.J., I.F. Creed, and C.J.D. Fraser. 2005. Controls on runoff from a partially harvested aspen-forested headwater catchment, Boreal Plain, Canada. Hydrol. Process. 19:3–25.
deVries, J.J. and T.L. Chow. 1978. Hydrologic behav-iour of a forested mountain soil in coastal Brit-ish Columbia. Water Resour. Res. 14:935–942.

170
Dingman, S.L. 2002. Physical hydrology. 2nd ed. Prentice Hall, Upper Saddle River, N.J.
Douglas, T. 2006. Review of groundwater-salmon interactions in British Columbia. Watershed Watch Salmon Soc. and Walter and Gordon Duncan Found. www.watershed-watch.org/publications/files/Groundwater+Salmon++hi+res+print.pdf (Accessed March 2010).
_______. 2008. Groundwater in British Columbia: management for fish and people. Streamline Watershed Manag. Bull. 11(2):20–24. www.forrex.org/publications/streamline/ ISS37/streamline_vol11_no2_art4.pdf (Accessed March 2010).
Dunford, E.G. and P.W. Fletcher. 1947. Effect of removal of stream-bank vegetation upon water yield. EOS: Trans. Am. Geophys. Union 28:105–110.
Dykes, A.P. 1997. Rainfall interception from a low-land tropical rainforest in Brunei. J. Hydrol. 200: 260–279.
Eaton, B.C., M. Church, and D. Ham. 2002. Scal-ing and regionalization of flood flows in British Columbia, Canada. Hydrol. Process. 16(16):3245–3263.
Eisenbies, M.H., W.M. Aust, J.A. Burger, and M.B. Adams. 2007. Forest operations, extreme flood-ing events, and considerations for hydrologic modeling in the Appalachians: a review. For. Ecol. Manag. 242:77–98.
El Adlouni, S., T.B.M.J. Ouarda, X. Zhang, R. Roy, and B. Bobée. 2007. Generalized maximum likelihood estimators for the nonstation-ary generalized extreme value model. Water Resour. Res. 43(3):W03410. DOI:10.1029/2005WR004545.
Fallas, J. 1982. Effects of clearcutting, vegetation regrowth, and reforestation on flow duration on three Coweeta experimental basins. MSc thesis. Univ. Michigan, Ann Arbor, Mich.
Fannin, R.J., J. Jaakkola, J.M.T. Wilkinson, and E.D. Hetherington. 2000. Hydrologic response of soils to precipitation at Carnation Creek, British Columbia, Canada. Water Resour. Res. 36(6):1481–1494.
Faria, D.A., J.W. Pomeroy, and R.L.H. Essery. 2000. Effect of covariance between ablation and snow water equivalent on depletion of snow-covered area in a forest. Hydrol. Process. 14:2683–2695.
Fisher, R.F. and D. Binkley. 2000. Ecology and man-agement of forest soils. 3rd ed. John Wiley and Sons, Inc. Chichester, U.K.
Fleming, R.L., T.A. Black, and R.S. Adams. 1996. Site preparation effects on Douglas-fir and lodge-pole pine water relations following planting in a pinegrass-dominated clearcut. For. Ecol. Manag. 83:47–60.
Geiger, R., R.H. Aron, and P. Todhunter. 1995. The climate near the ground. 5th ed. Harvard Univ. Press, Cambridge, Mass.
Giles, D.G., T.A. Black, and D.L. Spittlehouse. 1985. Determination of growing season soil water deficits on a forested slope using water balance analysis. Can. J. For. Res. 15:107–114.
Glickman, T.S. (editor). 2000. Glossary of meteorol-ogy. 2nd ed. Am. Meteorol. Soc., Boston, Mass.
Gray, D.M. 1970. Handbook on the principles of hydrology. Secretariat, Can. Natl. Comm. Int. Hydrol. Decade, Natl. Res. Counc. Can., Ot-tawa, Ont.
Gray, D.M. and D.H. Male (editors). 1981. Handbook of snow: principles, processes, management and use. Pergamon Press, Toronto, Ont.
Gray, D.M. and T.D. Prowse. 1993. Snow and floating ice. In: Handbook of hydrology. D.R. Maid-ment (editor). McGraw-Hill, Inc., New York, N.Y., pp. 7.1–7.58.
Haegeli, P. and D.M. McClung. 2007. Expanding the snow-climate classification with avalanche-relevant information: initial description of avalanche winter regimes for southwestern Canada. J. Glaciol. 54(181):266–276.
Hare, F.K. and M.K. Thomas. 1974. Climate Canada. Wiley, Toronto, Ont.
Harr, R.D. 1981. Some characteristics and conse-quences of snowmelt during rainfall in western Oregon. J. Hydrol. 52:277–304.

171
_______. 1982. Fog drip in the Bull Run munici-pal watershed, Oregon. Water Resour. Bull. 18:785–789.
_______. 1986. Effects of clearcutting on rain-on-snow runoff in western Oregon: a new look at old studies. Water Resour. Res. 22:1095–1100.
Hayashi, M. and D.O. Rosenberry. 2001. Effects of groundwater exchange on the hydrology and ecology of surface waters. J. Groundw. Hydrol. 43:327–341.
Hedstrom, N.R. and J.W. Pomeroy. 1998. Measure-ments and modelling of snow interception in the boreal forest. Hydrol. Process. 12:1611–1625.
Henderson, G.S. and D.L. Golding. 1983. The effect of slash burning on the water repellency of forest soils at Vancouver, British Columbia. Can. J. For. Res. 13:353–355.
Hendrickx, J.M.H. and M. Flury. 2001. Uniform and preferential flow mechanisms in the vadose zone. In: Conceptual models of flow and trans-port in the fractured vadose zone. Natl. Acad. Sci., Washington, D.C., pp. 149–187.
Hetherington, E.D. 1982. A first look at logging ef-fects on the hydrologic regime of Carnation Creek experimental watershed. In: Proc. Car-nation Creek Workshop: a 10-year review. G.F. Hartman (editor). Pac. Biol. Stn., Nanaimo, B.C., pp. 45–62.
Hewlett, J.D. 1982. Principles of forest hydrology. Univ. Georgia Press, Athens, Ga.
Hewlett, J.D. and A.R. Hibbert. 1967. Factors affect-ing the response of small watersheds to precip-itation in humid areas. In: Forest hydrology. W.E. Sopper and H.W. Lull (editors). Pergam-on, New York, N.Y., pp. 275–290.
Hillel, D. 1998. Environmental soil physics. Academ-ic Press, San Diego, Calif.
Hubbard, R.M., B.J. Bond, and M.G. Ryan. 1999. Evidence that hydraulic conductance limits photosynthesis in old Pinus ponderosa trees. Tree Physiol. 19:165–172.
Humphreys, E.P., T.A. Black, G.J. Ethier, G.B. Dre-witt, D.L. Spittlehouse, E.M. Jork, Z. Nesic, and N.J. Livingston. 2003. Annual and seasonal variability of sensible and latent heat fluxes above a coastal Douglas-fir forest, British
Columbia, Canada. Agric. For. Meteorol. 115:109–125.
Hutchinson, D.G. and R.D. Moore. 2000. Through-flow variability on a forested hillslope under-lain by compacted glacial till. Hydrol. Process. 14:1751–1766.
Ingraham, N.L. and R.A. Matthews. 1995. The importance of fog-drip water to vegetation: Point Reyes Peninsula, California. J. Hydrol. 164:269–285.
Irland, L.C. 1998. Ice storm 1998 and the forests of the Northeast. J. For. 96:32–40.
_______. 2000. Ice storms and forest impacts. Sci. Total Environ. 262:231–242.
Jackson, C.R. and T.W. Cundy. 1992. A model of transient, topographically driven, saturated subsurface flow. Water Resour. Res. 28:1417–1427.
Jassal, R.S., T.A. Black, D.L. Spittlehouse, C. Brüm-mer, and Z. Nesic. 2009. Evapotranspiration and water use efficiency in different-aged Pacific Northwest Douglas-fir stands. Agric. For. Meteorol. 149:1168–1178. DOI:10.1016/j.agrformet.2009.02.004.
Jordan, P. 1983. Meltwater movement in a deep snow-pack, 1, field observations. Water Resour. Res. 19:971–978.
Kattelmann, R. 1986. Measurements of snow layer water retention. In: Proc. Cold Regions Hydrol-ogy Symp. D.L. Kane (editor). Am. Water Re-sour. Assoc., Minneapolis, Minn., pp. 377–386.
Kelliher, F.M., T.A. Black, and D.T. Price. 1986. Esti-mating the effects of understory removal from a Douglas fir forest using a two-layered canopy evapotranspiration model. Water Resour. Res. 22:1891–1899.
Kelliher, F.M., R. Leuing, M.R. Raupach, and E.D. Schulze. 1995. Maximum conductances for evaporation from global vegetation types. Ag-ric. For. Meteorol. 73:1–16.
Kelliher, F.M., R. Leuing, and E.D. Schulze. 1993. Evaporation and canopy characteristics of coniferous forests and grasslands. Oecologia 95:153–163.
172
Kelliher, F.M., D. Whitehead, and D.S. Pollack. 1992. Rainfall interception by trees and slash in a young Pinus radiata D. Don stand. J. Hydrol. 131:187–204.
Kirkby, M.J. (editor). 1978. Hillslope hydrology. John Wiley and Sons. Chichester, U.K.
Kljun, N., T.A. Black, T.J. Griffis, A.G. Barr, D. Gaumont-Guay, K. Morgenstern, J.H. Mc-Caughey, and Z. Nesic. 2006. Response of net ecosystem productivity of three boreal forest stands to drought. Ecosystems 9:1128–1144.
Krishnan, P., T.A. Black, N.J. Grant, A.G. Barr, E.H. Hogg, R.S. Jassal, and K. Morgenstern. 2006. Impact of changing soil moisture distribu-tion on net ecosystem productivity of a boreal aspen forest during and following drought. Agric. For. Meteorol. 139:208–223.
Langham, E.J. 1981. Physics and properties of snow-cover. In: Handbook of snow: principles, pro-cesses, management and use. D.M. Gray and D.H. Male (editors). Pergamon Press, Toronto, Ont., pp. 275–337.
Leman, V.N. 1993. Spawning sites of chum salmon, Oncorhynchus keta: microhydrological regime and viability of progeny in redds (Kamchatka River basin). J. Ichthyol. 33:104–117.
Letey, J. 2001. Causes and consequences of fire-in-duced soil water repellency. Hydrol. Process. 15:2867–2875.
Levia, D.F. Jr. and E.E. Frost. 2006. Variability of throughfall volume and solute inputs in wood-ed ecosystems. Prog. Phys. Geogr. 30:605–632.
Link, T.E., M. Unsworth, and D. Marks. 2004. The dynamics of rainfall interception by a seasonal temperate rainforest. Agric. For. Meteorol. 124:171–191.
MacKenzie, W.H. and J.R. Moran. 2004. Wetlands of British Columbia: a guide to identification. B.C. Min. For., Res. Br., Victoria, B.C. Land Manag. Handb. No. 52. www.for.gov.bc.ca/hfd/pubs/Docs/Lmh/Lmh52.htm (Accessed March 2010).
Maidment, D.R. (editor). 1993. Handbook of hydrol-ogy. McGraw-Hill, Inc., New York, N.Y.
Male, D.H. and D.M. Gray. 1981. Snowcover ablation and runoff. In: Handbook of snow: principles,
processes, management and use. D.M. Gray and D.H. Male (editors). Pergamon Press, To-ronto, Ont., pp. 360–436.
Marks, D., J. Kimbal, D. Tingley, and T. Link. 1998. The sensitivity of snowmelt processes to climate conditions and forest cover during rain-on-snow: a case study of the 1996 Pacific Northwest flood. Hydrol. Process. 12:1569–1587.
McCaughey, J.H., B.D. Amiro, A.W. Robertson, and D.L. Spittlehouse. 1997. Forest environments. In: The surface climates of Canada. W.G. Bai-ley, T.R. Oke, and W.R. Rouse (editors). McGill-Queen’s Univ. Press, Montreal, Que. and Kingston, Ont., Can. Assoc. Geogr. Ser. Can. Geogr. No. 4, pp. 247–276.
McClung, D. and P. Schaerer. 2006. The avalanche handbook. The Mountaineers, Seattle, Wash.
McDonnell, J.J. 2003. Where does the water go when it rains? Moving beyond the variable source area concept of rainfall-runoff response. Hy-drol. Process. 17:1869–1875.
McKay, G.A. and D.M. Gray. 1981. The distribution of snowcover. In: Handbook of snow: prin-ciples, processes, management and use. D.M. Gray and D.H. Male (editors). Pergamon Press, Toronto, Ont., pp. 153–190.
McMinn, R.G. 1960. Water relations and forest distribution in the Douglas-fir region on Van-couver Island. Can. Dep. Agric., Div. For. Biol., Victoria, B.C. Publ. No. 1091.
McNabb, D.H., F. Gaweda, and H.A. Froelich. 1989. Infiltration, water repellency, and soil moisture content after broadcast burning a forest site in southwest Oregon. J. Soil Water Conserv. 44:87–90.
McNamara, J.P., D. Chandler, M. Seyfried, and S. Achet. 2005. Soil moisture states, lateral flow, and streamflow generation in a semi-arid, snowmelt-driven catchment. Hydrol. Process. 19:4023–4038.
Meinzer, O.E. 1923. Outline of ground-water hydrol-ogy. U.S. Geol. Surv., Washington, D.C. Water Supply Pap. No. 494.
Mellina, E., R.D. Moore, S.G. Hinch, J.S. Macdonald, and G. Pearson. 2002. Stream temperature re-sponses to clear-cut logging in British Colum-

173
bia: the moderating influences of groundwater and headwater lakes. Can. J. Fish. Aquat. Sci. 59:1886–1900.
Melloh, R.A., J.P. Hardy, R.E. Davis, and P.B. Robin-son. 2001. Spectral albedo/relectance of littered forest snow during the melt season. Hydrol. Process. 15:3409–3422.
Metcalfe, R.A. and J.M. Buttle. 1998. A statistical model of spatially distributed snowmelt rates in a boreal forest basin. Hydrol. Process. 12:1701–1722.
Miller, D.H. 1962. Snow in the trees: where does it go? In: Proc. 13th Annu. West. Snow Conf., April 16–18, 1962, Cheyenne, Wyo., pp. 21–27.
Molotch, N.P., P.D. Blanken, M.W. Williams, A.A. Turnipseed, R.K. Monson, and S.A. Margulis. 2007. Estimating sublimation of intercepted and sub-canopy snow using eddy covariance systems. Hydrol. Process. 21:1567–1575.
Moore, R.D., P. Sutherland, T. Gomi, and A. Dhakal. 2005. Thermal regime of a headwater stream within a clear-cut, coastal British Columbia, Canada. Hydrol. Process. 19:2591–2608.
Obedkoff, W. 1998. Streamflow in the Southern Interior region. B.C. Min. Environ., Lands and Parks, Victoria, B.C.
Oke, T.R. 1987. Boundary layer climates. 2nd ed. Methuen and Co., London, U.K.
Pearce, A.J., L.K. Rowe, and J.B. Stewart. 1980. Nighttime, wet canopy evaporation rates and the water balance of an evergreen mixed forest. Water Resour. Res. 16(5):955–959.
Pfeffer, W.T. and N.F. Humphrey. 1996. Determina-tion of timing and location of water move-ment and ice-layer formation by temperature measurements in sub-freezing snow. J. Glaciol. 42(141):292–304.
Phillips, D.W. 1990. The climates of Canada. Atmos. Environ. Serv., Ottawa, Ont.
Pierson, T.C. 1980. Piezometric response to rain-storms in forested hillslope drainage depres-sions. J. Hydrol. (N.Z.) 19:1–10.
Pike, R.G. and R. Scherer. 2004. Low flows in snowmelt-dominated watersheds. Streamline
Watershed Manag. Bull. 8(1):24–28. www.forrex.org/publications/streamline/ISS28/streamline_vol8_no1_art8.pdf (Accessed March 2010).
Plamondon, A.P., M. Prevost, and R.C. Naud. 1984. Interception de la pluie dans la sapiniere bou-leau blanc, Forêt Montmorency. Can. J. For. Res. 14:722–730.
Poff, N.L., J.D. Allan, M.B. Bain, J.R. Karr, K.L. Prestegaard, B. Richter, R. Sparks, and J. Stromberg. 1997. The natural flow regime: a new paradigm for riverine conservation and restoration. BioScience 47:769–784.
Pomeroy, J.W. and B.E. Goodison. 1997. Winter and snow. In: The surface climates of Canada. W.G. Bailey, T.R. Oke, and W.R. Rouse (editors). McGill-Queen’s Univ. Press, Montreal, Que., pp. 68–100.
Pomeroy, J.W. and D.M. Gray. 1995. Snowcover accumulation, relocation and management. Environ. Can., Saskatoon, Sask. Nat. Hydrol. Res. Instit. Sci. Rep. No.7.
Pomeroy, J.W., D.M. Gray, K.R. Shook, B. Toth, R.L.H. Essery, A. Pietroniro, and N. Hedstrom. 1998. An evaluation of snow accumulation and ablation processes for land surface modelling. Hydrol. Process. 12:2339–2367.
Power, G., R.S. Brown, and J.G. Imhof. 1999. Groundwater and fish: insights from northern North America. Hydrol. Process. 13:401–422.
Prévost, M., R. Barry, J. Stein, and A.P. Plamondon. 1991. Snowmelt modeling in a balsam fir forest: comparison between an energy balance model and other simplified models. Can. J. For. Res. 21:1–10.
Price, A.G. and D.E. Carlyle-Moses. 2003. Measure-ment and modelling of growing season canopy water fluxes in a mature mixed deciduous forest, southern Ontario, Canada. Agric. For. Meteorol. 119:69–85.
Price, A.G., K. Dunham, T. Carleton, and L. Band. 1997. Variability of water fluxes through the black spruce (Picea mariana) canopy and feather moss (Pleurozium schreberi) carpet in the boreal forest of northern Manitoba. J. Hydrol. 196:310–323.

174
Proulx, S. and J. Stein. 1997. Classification of meteo-rological conditions to assess the potential for concrete frost formation in boreal forest floors. Can. J. For. Res. 27:953–958.
Putuhena, W.M. and I. Cordery. 1996. Estimation of interception capacity of the forest floor. J. Hydrol. 180:283–299.
Pypker, T.G., B.J. Bond, T.E. Link, D. Marks, and M.H. Unsworth. 2005. The importance of canopy structure in controlling the intercep-tion loss of rainfall: examples from a young and an old-growth Douglas-fir forest. Agric. For. Meteorol. 130:113–129.
Rains, M.G., G.E. Fogg, T. Harter, R.A. Dahl-gren, and R.J. Williamson. 2006. The role of perched aquifers in hydrological connectivity and biogeochemical processes in vernal pool landscapes, Central Valley, California. Hydrol. Process. 20:1157–1175.
Redding, T.E. and K.J. Devito. 2008. Lateral flow thresholds for aspen forested hillslopes on the western boreal plain, Alberta, Canada. Hydrol. Process. 22:4287–4300 DOI:10.1002/hyp.7038.
Redding, T.E., K.D. Hannam, S.A. Quideau, and K.J. Devito. 2005. Particle density of aspen, spruce and pine forest floors in Alberta, Canada. Soil Sci. Soc. Am. J. 69:1503–1506.
Ritter, D.F., R.C. Kochel, and J.R. Miller. 2002. Process geomorphology. 4th ed. McGraw-Hill Companies Inc., New York, NY.
Rodenhuis, D., K.E. Bennett, A. Werner, T.Q. Mur-dock, and D. Bronaugh. 2007. Hydro-clima-tology and future climate impacts in British Columbia. Pac. Climate Impacts Consort., Univ. Victoria, Victoria, B.C.
Rose, C.W. 2004. An introduction to the environ-mental physics of soil, water and watersheds. Cambridge Univ. Press, New York, N.Y.
Rothacher, J. 1963. Net precipitation under a Doug-las-fir forest. For. Sci. 9:423–429.
Roulet, N.T., D.S. Munro and L. Mortsch. 1997. Wet-lands. In: The surface climates of Canada. W.G. Bailey, T.R. Oke, and W.R. Rouse (editors). McGill-Queen’s Univ. Press, Montreal, Que. And Kingston, Ont., Can. Assoc. Geogr. Ser. Can. Geogr. No. 4, pp. 149–171.
Rydin, H. and J. Jeglum. 2006. The biology of peat-lands. Oxford Univ. Press, New York, N.Y.
Satterlund, D.R. and P.W. Adams. 1992. Wildland watershed management. 2nd ed. John Wiley and Sons, Inc., New York, N.Y., pp. 164–185.
Schemenauer, R.S. 1986. Acidic deposition to forests: the 1985 chemistry of high elevation fog (CHEF) project. Atmos. Ocean 24:303–328.
Schemenauer, R.S., C.M. Banicc, and N. Urquizo. 1995. High elevation fog and precipitation chemistry in southern Quebec, Canada. At-mos. Environ. 29:2235–2252.
Schemenauer, R.S., M.O. Berry, and J.B. Maxwell. 1981. Snowfall formation. In: Handbook of snow: principles, processes, management and use. D.M. Gray and D.H. Male (editors). Per-gamon Press, Toronto, Ont., pp. 129–152.
Schertzer, W.M. 1997. Freshwater lakes. In: The surface climates of Canada. W.G. Bailey, T.R. Oke, and W.R. Rouse (editors). McGill-Queen’s Univ. Press, Montreal, Que. And Kingston, Ont., Can. Assoc. Geogr. Ser. Can. Geogr. No. 4, pp. 124–148.
Schmidt, R.A. and D.R. Gluns. 1991. Snowfall inter-ception on branches of three conifer species. Can. J. For. Res. 21:1262–1269.
Schmidt, R.A. and C.A. Troendle. 1992. Sublimation of intercepted snow as a global source of water vapor. In: Proc. 60th Annu. West. Snow Conf., April 14–16, 1992, Jackson, Wyo., pp. 1–9.
Scott, D. and R. Pike. 2003. Wildfires and watershed effects in the southern B.C. interior. Streamline Watershed Manag. Bull. 7(3):1–4. www.forrex.org/publications/streamline/ISS26/streamline_vol7_no3_art1.pdf (Accessed March 2010).
Scott, D.F. 1999. Managing riparian zone vegetation to sustain streamflow: results of paired catch-ment experiments in South Africa. Can. J. For. Res. 29:1149–1157.
Shuttleworth, W.J. 1989. Micrometeorology of tem-perate and tropical forests. Phil. Trans. R. Soc. Lond. B 324:299–334.
Sidle, R.C. 1984. Shallow groundwater fluctuations in unstable hillslopes of coastal Alaska. Zeits. Gletscher. Glazialgeol. 20:79–95.

175
Sidle, R.C. and H. Ochiai. 2006. Landslides: pro-cesses, prediction, and land use. Water Resour. Monogr. Vol. 18. Am. Geophys. Union, Wash-ington, D.C.
Sidle, R.C., Y. Tsuboyama, S. Noguchi, I. Hosoda, M. Fujieda, and T. Shimizu. 2000. Stormflow gen-eration in steep forested headwaters: a linked hydrogeomorphic paradigm. Hydrol. Process. 14:369–385.
Simonin, K., T.E. Kolb, M. Montes-Helu, and G.W. Koch. 2006. Restoration thinning and influ-ence of tree size and leaf area to sapwood area ratio on water relations of Pinus ponderosa. Tree Physiol. 26:493–503.
Smakhtin, V.U. 2001. Low flow hydrology: a review. J. Hydrol. 240:147–186.
Smerdon, B. and T. Redding. 2007. Groundwater: more than water below the ground. Streamline Watershed Manag. Bull. 10(2):1–6. www.forrex.org/publications/streamline/ISS35/Streamline_Vol10_No2_art1.pdf (Accessed March 2010).
Sollins, P., C.C. Grier, F.M. McCorison, K. Cromack Jr., R. Fogel, and R.L. Fredriksen. 1980. The internal element cycles of an old-growth Doug-las-fir ecosystem in western Oregon. Ecol. Monogr. 50:261–285.
Spittlehouse, D.L. 1989. Estimating evapotranspira-tion from land surfaces in B.C. In: Estimat-ing areal evapotranspiration. T.A. Black, D.L. Spittlehouse, M.D. Novak and D.T. Price (editors). Int. Assoc. Hydrol. Sci., Wallingford, U.K. Publ. No. 177, pp. 245–256.
_______. 1998a. Rainfall interception in young and mature coastal conifer forest. In: Mountains to sea: human interaction with the hydrological cycle. Y. Alila (editor). Proc. 51st Annu. Meet., Can. Water Resour. Assoc., Cambridge, Ont., pp. 40–44.
_______. 1998b. Rainfall interception in young and mature conifer forests in British Columbia. In: Proc. 23rd Conf. Agric. For. Meteorol., Nov. 2–6, 1998, Albuquerque, N.M. Am. Meteorol. Soc., Boston, Mass., pp. 171–174.
_______. 2002. Sap flow in old lodgepole pine trees. In: Proc. 25th Conf. Agric. For. Meteorol., May 20–24, 2002, Norfolk Va. Am. Meteorol. Soc., Boston, Mass., pp. 123–124.
_______. 2003. Water availability, climate change and the growth of Douglas-fir in the Georgia Basin. Can. Water Resour. J. 28(4):673–688.
_______. 2004. The climate and long-term water bal-ance of Fluxnet Canada’s coastal Douglas-fir forest. In: Proc. 26th Conf. Agric. For. Meteo-rol., Aug. 23–26, 2004, Vancouver, B.C. Am. Meteorol. Soc., Boston, Mass.
_______. 2006a. Annual water balance of high eleva-tion forests and clearcuts. In: Proc. 27th Conf. Agric. For. Meteorol., May 21–25, 2006, San Di-ego, Calif. Am. Meteorol. Soc., Boston, Mass.
_______. 2006b. Annual water balance of forests clearcuts and regenerating stands. In: Proc. Forest and Water in a Changing Environment, Beijing, China, Aug. 8–10, 2006.
Spittlehouse, D.L., R.S. Adams, and R.D. Winkler. 2004. Forest, edge, and opening microclimate at Sicamous Creek. B.C. Min. For., Res. Br., Victoria, B.C. Res. Rep. No. 24. www.for.gov.bc.ca/hfd/pubs/Docs/Rr/Rr24.htm (Accessed March 2010).
Spittlehouse, D.L. and T.A. Black. 1981. A growing season water balance model applied to two Douglas fir stands. Water Resour. Res. 17:1651–1656.
Spittlehouse, D.L. and R.D. Winkler. 2002. Model-ling snowmelt in a forest and clearcut. In: Proc. 25th Conf. Agric. For. Meteorol., May 20–24, 2002, Norfolk Va. Am. Meteorol. Soc., Boston, Mass., pp. 121–122.
_______. 2004. Snowmelt in a forest and clearcut. In: Proc. 72nd Annu.West. Snow Conf., Apr. 19–22, 2004, Richmond, B.C., pp. 33–43.
Stahli, M. 2005. Freezing and thawing phenomena in soils. In: Encyclopedia of hydrological sciences. M.G. Anderson (editor). John Wiley and Sons, Chichester, U.K., pp. 1069–1076.
Startsev, A.D. and D.H. McNabb. 2000. Effects of skidding on forest soil infiltration in west- central Alberta. Can. J. Soil Sci. 80:617–624.
Stieglitz, M., J. Shaman, J. McNamara, V. Engel, J. Shanley, and G.W. Kling. 2003. An approach to understanding hydrologic connectivity to the hillslope and the implications for nutri-ent transport. Global Biogeochem. Cy. 17:1105, DOI:10.1029/2003GB002041.

176
Story, A., R.D. Moore, and J.S. Macdonald. 2003. Stream temperatures in two shaded reaches below cutblocks and logging roads: down-stream cooling linked to subsurface hydrology. Can. J. For. Res. 33:1383–1396.
Tan, C.S. and T.A. Black. 1976. Factors affecting the canopy resistance of a Douglas-fir forest. Bound.-Lay. Meteorol. 10:475–488.
Tan, C.S., T.A. Black, and J.U. Nnyamah. 1978. A simple diffusion model of transpiration ap-plied to a thinned Douglas-fir stand. Ecology 59:1221–1229.
Tang, Z., J.L. Chambers, M.A. Sword Sayer, and J.P. Barnett. 2003. Seasonal photosynthesis and water relations of juvenile loblolly pine relative to stand density and canopy position. Trees 17:424–430.
Tarboton, D.G. 2003. Rainfall-runoff processes. Natl. Weather Serv., COMET Program. http://hydrology.neng.usu.edu/RRP/userdata/4/87/RainfallRunoffProcesses.pdf (Accessed March 2010).
Taylor, C.H. 1982. The effect on storm runoff re-sponse of seasonal variations in contributing zones in small watersheds. Nordic Hydrol. 13:165–182.
Teti, P. 2003. Relations between peak snow ac-cumulation and canopy density. For. Chron. 79(2):307–312.
Toews, D.A.A. and D.R. Gluns. 1986. Snow accumu-lation and ablation on adjacent forested and clearcut sites in southeastern British Columbia. In: Proc. 54th Annu.West. Snow Conf., April 15–17, 1985, Phoenix, Ariz., pp. 101–111.
Toth, J. 1962. A theory of groundwater motion in small drainage basins in Central Alberta, Canada. J. Geophys. Res. 67(11):4375–4387.
Troendle, C.A. 1970. Flow interval method for ana-lyzing timber harvesting effects on streamflow regimen. Water Resour. Res. 6(1):328–332.
Tromp-van Meerveld, H.J. and J.J. McDonnell. 2006. Threshold relations in subsurface stormflow: 2. The fill and spill hypothesis. Water Resour. Res. 42: DOI:10.1029/2004WR003800.
UNESCO and World Meterological Association, International Hydrology Programme. 1998. International glossary of hydrology. 2nd edi-tion. UNESCO, Paris, and World Meterological Association, Geneva. http://webworld.unesco.org/water/ihp/db/glossary/glu/aglo.htm (Ac-cessed March 2010).
Vertessy, R.A., F.G.R. Watson, and S.K. O’Sullivan. 2001. Factors determining relations between stand age and catchment water balance in mountain ash forests. For. Ecol. Manag. 143:13–26.
Wallace, J.M. and P.V. Hobbs. 1977. Atmospheric science. Academic Press, Inc. San Diego, Calif., pp. 181–199.
Ward, R.C. and M. Robinson. 1989. Principles of hydrology. 3rd ed. McGraw-Hill International, London, U.K.
Weiler, M., J.J. McDonnell, I. Tromp-Van Meerveld, and T. Uchida. 2005. Subsurface stormflow. In: Encyclopedia of hydrological sciences. M.G. Anderson (editor). John Wiley and Sons, Chichester, U.K., pp. 1719–1732.
Wheeler, K. 1987. Interception and redistribution of snow in a subalpine forest on a storm-by-storm basis. In: Proc. 55th Annu. West. Snow Conf., April 14–16, 1987, Vancouver, B.C., pp. 78–87.
Winkler, R.D. 2001. The effects of forest structure on snow accumulation and melt in south-central British Columbia. PhD thesis. Univ. British Columbia, Vancouver, B.C. http://hdl.handle.net/2429/13512 (Accessed March 2010).
Winkler, R.D., D. Gluns, and D. Golding. 2004. Identifying snow indices for forest planning in southern British Columbia. In: Proc. 72nd Annu. West. Snow Conf., April 19–22, 2004, Richmond, B.C., pp. 53–61.
Winkler, R.D. and R.D. Moore. 2006. Variability in snow accumulation patterns within forest stands on the interior plateau of British Colum-bia, Canada. Hydrol. Process. 20:3683–3695.
Winkler, R.D. and J. Roach. 2005. Snow accumula-tion in BC’s southern interior forests. Stream-line Watershed Manag. Bull. 9(1):1–5. www.forrex.org/publications/streamline/ISS30/

177
streamline_vol9_no1_art1.pdf (Accessed March 2010).
Winkler, R.D., D.L. Spittlehouse. and D.L. Golding. 2005. Measured differences in snow accumula-tion and melt among clearcut, juvenile, and mature forests in southern British Columbia. Hydrol. Process. 19:51–62.
Winter, T.C. 1999. Relation of streams, lakes, and wetlands to groundwater flow systems. Hydro-geol. J. 7(1):28–45.
Winter, T.C., D.O. Rosenberry, and J.W. LaBaugh. 2003. Where does the ground water in small watersheds come from? Ground Water 41(7):989–1000.
Wondzell, S.M., and J.G. King. 2003. Postfire ero-sional processes in the Pacific Northwest and Rocky Mountain regions. For. Ecol. Manag. 178:75–87.
Woo, M. and M.A Giesbrecht. 2000. Simulation of snowmelt in a subarctic spruce woodland: 1. Tree model. Water Resourc. Res. 36(8):2275–2285.
Woo, M., P. Marsh, and J.W. Pomeroy. 2000. Snow, frozen soils and permafrost hydrology in Canada, 1995–98. Hydrol. Process. 14:1591–1611.
