hydrological impacts of a changing climate on …
TRANSCRIPT

Annual Journal of Hydraulic Engineering, JSCE, Vol.57, 2013, February
HYDROLOGICAL IMPACTS OF A CHANGING CLIMATE ON FLOODS AND DROUGHTS IN
PHILIPPINE RIVER BASINS
Patricia Ann JARANILLA-SANCHEZ1, Toshio KOIKE2, Cho Thanda NYUNT3,
Mohammed RASMY1, Izumi HASEGAWA4, Akiko MATSUMURA5 and Daikichi
OGAWADA5
1Member of JSCE, Ph D., Research Associate, Dept. of Civil Engineering, University of Tokyo (Tokyo, Japan) 2 Member of JSCE, Ph.D., Professor, Department of Civil Engineering, University of Tokyo, (Tokyo, Japan) 3 Member of JSCE, Ph.D. student, Department of Civil Engineering, University of Tokyo, (Tokyo, Japan) 4 Researcher, M.Sc., Project Researcher, Dept. of Civil Engineering, University of Tokyo (Tokyo, Japan)
5 Researcher, Applied Hydraulics and Hydrology Group, Nippon Koei, (Ibaraki, Japan)
The development of new water sources to ensure more stable water supply for Metropolitan Manila is urgently needed especially with the changing climate. The objectives of this study are: 1) to develop hydrological models in 3 river basins (Angat, Kaliwa and Pampanga) surrounding Metro Manila; 2) to assess basin-scale hydrological impacts of climate change in terms of a) flooding trends and b) drought trends. Calibrations of the basins were performed in Angat dam inflows for Angat basin; and Pantabangan dam, Cabanatuan, Zaragoza, San Isidro and Arayat stream flows for Pampanga river basin. Soil moisture verification of Pampanga river basin utilized monthly surface soil moistures from both the LDAS-UT and hydrological model outputs in short vegetation areas. Incorporating bias corrected rainfall and other parameters from GCMs showed future flooding trends is virtually certain to increase while drought trends are as likely as not to increase in the uplands but very likely to increase in the flood plains.
Key Words : Hydrological impacts, WEB-DHM, surface soil moisture, Pampanga River Basin
1. INTRODUCTION Local residents of Metropolitan Manila area in the Philippines rely on the Angat Dam in the Angat River Basin for 97% of their domestic water resources. With the current population increase in Metropolitan Manila coupled with the looming threat of climate change, the Kaliwa and Pampanga river basin are some of the alternative water sources planned to supplement domestic water supply to Metro Manila. However, prior to building additional structures in these alternative basins, it is necessary to identify at first the projected impacts of extreme events such as floods and droughts resulting from climate change. The objective of this study is to assess the hydrological impacts of climate change on the water cycle into Metro Manila and its adjoining areas,
including Angat, Kaliwa and Pampanga river basins in terms of a) flooding trends and b) drought trends. To accomplish this, Hydrometeorological parameters (rainfall, temperature, short wave and long wave radiation) from the Global circulation models (GCMs) from the IPCC1 4th Assessment Report Coupled Model Intercomparison Project Phase three (CMIP3) archived in the Data and Integration Analysis System (DIAS) were used as forcing data to determine past and future climate change projections at the 3 river basins. Currently these models are state of the art tools used in determining climate change impacts in different parts of the world. Previous regional studies on climate change projections in the Asian monsoon region show that increases in greenhouse gases increased in mean precipitation and its variability.

However, studies show considerably inconclusive results for droughts.2 Selected General Circulation Models (GCMs) ensembles were incorporated into the Water and Energy Budget-Based Distributed Hydrological Model and 1981-2000 (past) versus 2046-2065 (future) impacts on floods and droughts were analyzed by focusing on climate change effects on surface flow. However, due to large uncertainties associated with GCMs, very large bias (especially in precipitation) need to be reduced and the mismatch of grid resolution between GCM outputs and basin-scale hydrological model inputs. Hence to minimize the errors resulting from these biases3,4,5, a 3-step bias correction was used prior to model output utilization. Spatial downscaling by bias correcting on 21 gauges with observed data were employed while temporal downscaling by using specimen hourly rainfall distribution for different intensities were used. Analysis of flooding trends were based on the analysis of the 10th percentile of peak flow trends while for drought, low flow was analyzed based on the 10th percentile of the 20-year past drought discharge (355th value descending order). Long-term drought intensity trends were analyzed using the standard anomaly Index (SA)6 applied to discharge flows in each basin to quantify (monthly scale) drought trends for the past versus the future. This index can be utilized to determine drought frequency and intensity using at least 20 years of monthly datasets from different hydrological parameters by fitting an appropriate distribution pattern to the monthly data and standardizing and categorizing the deviations from the mean with increasing dryness (if below 1). For this study, it is used to quantify drought for discharge. 2. METHODS There are several methods employed in this study: (a) Hydrological model development, calibration and validation by incorporating conveyance tunnels and other man-made hydrological structures that affect river flow, (b) GCM model selection, rainfall bias correction and downscaling using 21 rain gauges to represent the region, (c) incorporation of GCM meteorological parameters into the hydrological model and, (d) analysis of climate change trends for floods and droughts. (1) Study Area Three basins are considered in this study. Angat river basin (1,085km2), Kaliwa River Basin (included in the Agos river basin, 280km2) and Pampanga river basin (10,981 km2). Angat and
Kaliwa lie along the Cordillera Mountain ranges while Pampanga river basin lies along and on the western side of the ranges. This difference in location gives very distinct rainfall distribution in the largest basin compared to the other two. Angat river basin consists mostly of dense secondary forests (broadleaf deciduous trees); and clay and clay loam soils. The Umiray-Angat conveyance tunnel (available data: 2001-2010) was incorporated into the model calibration (2003) and validation (2001-2009). Kaliwa river basin consists of a combination of dense secondary forests and short vegetation; and clay loam soil. There are no streamflow gauges in this basin yet so natural flow is assumed in the whole river basin assuming similar soil parameters with nearby Angat river basin. On the other hand, the Pampanga river basin’s land use consists of mostly agriculture or C3 grasslands. The local soils consist of mostly clay loam, sandy clay loam, sandy loam and clay. The Casecnan trans-basin tunnel, Aurora trans-basin channel and Masiway spillway outflow were included in the simulations.
(2) Water and Energy Budget-based Distributed Hydrological Model (WEB-DHM) The WEB-DHM was developed by fully coupling a land-surface model, the simple biosphere scheme, (SiB2)7), with a geomorphology-based hydrological model (GBHM)8). The model enabled consistent descriptions of water, energy and CO2 fluxes at the basin scale. The model physically described ET using a biophysical land surface scheme for simultaneously simulating heat, moisture, and CO2 fluxes in the soil-vegetation-atmosphere transfer (SVAT) processes.9),10) Inputs into the model consist of static (constant) and dynamic (changing temporally) parameters. (a)Static parameters The digital elevation map was based on the 90-m Shuttle Radar Topographic Mission (SRTM) Digital Elevation Database (V4.1) produced by NASA but reprocessed by the CGIAR Consortium for Spatial Information (CTGIAR-CSI) re-projected from geographic to UTM (zone 51) and re-sampled to 500m x 500m grid size. Local land use map reclassified into SiB2 land use classification and local soil map reclassified to FAO classification were also re-sampled to 500m x 500m grid size and assumed to have a homogeneous land use and soil type for each grid. (b)Dynamic parameters Meteorological parameters from both local gauges (12 gauges) are: surface air temperature (K), relative humidity (%), total cloud cover (%),

downward long wave and short wave radiation flux at surface (W/m2). Temperature was temporally downscaled from daily to hourly using sine functions for 3 time slices (sunrise to time to maximum temperature (Ho), from Ho to sunset, and from sunset to sunrise of the next day) within 24 hours11). The downward solar radiation was estimated from sunshine duration, temperature and humidity using a hybrid model.12) Longwave radiation was estimated from temperature, relative humidity, pressure and solar radiation using the relationship between solar radiation and longwave radiation.13) Rainfall was from daily data in 12 meteorological gauge stations and 35 synoptic stations. These were spatially distributed and downscaled by inverse distance weighing interpolation (IDW). The Nash Coefficients(Nash)14) and relative errors(RE) were used in the calibrations of the 3 basins. Due to possible limitations of in-situ data availability, it is necessary to consider satellite-based rainfall products to be widely applied to catchment-scale impact studies. Soil moisture information in the Philippines is not readily available for all locations and time scales. (3) GCM Model Selection, Bias Correction and Data incorporation into WEB-DHM GCM model selection was based on the ability
of the GCM to represent regional climate of the area under investigation. Seven parameters were considered in selecting the appropriate GCMs that comprise the ensemble: precipitation, longwave radiation, sea surface temperature, sea level pressure, air temperature, meridional and zonal wind. A simple index counter was used for identifying the modes which had above average spatial correlation and below average RMSE prioritizing models with good rainfall patterns. The 6 models selected are: gfdl_cm2_0, gfdl_cm2_1, ipsl_cm4, ingv_echam4 and miroc3_2_medres. An improved 3-step bias correction method was used to correct rainfall15) to account for rainfall extremes, normal rainfall and no rain days while no bias correction was done for the other meteorological parameters (temperature, short wave and long wave radiation). Spatial downscaling was done by correcting the biases on each of 21 selected rain gauge data, temporally downscaling them using average hourly rainfall factors from several rain gauges and re-gridding the hourly rainfall data. Hence this method assumes that future rainfall will have similar climatology and distribution as that of past rainfall. Temperature, short wave and long wave radiation were based on similar patterns as those in observed data.
Fig.1. River network, land use and calibrations in Pampanga, Angat and Kaliwa river basins.

Annual Journal of Hydraulic Engineering, JSCE, VOL.42, 1998, February
(4) Land Data Assimilation System (LDAS-UT) Satellite-based low-frequency microwave brightness temperature is strongly affected by near-surface soil moisture so it can be assimilated into a land-surface model to improve modeling of soil moisture and the surface energy budget. Soil moisture verification in the basin used the Land Data Assimilation System developed by the University of Tokyo (LDAS-UT)16) to estimate soil moisture and surface temperature. LDAS-UT consists of a land surface model (LSM) and radiative transfer model (RTM) for calculating surface fluxes and soil moisture by estimating the microwave brightness temperature and utilizing an optimization scheme to determine optimal values of soil moisture by minimizing the difference between modeled and observed brightness temperature. 3. RESULTS (1) Calibration of the River Basin Calibration of Angat dam inflow was done by comparing dam inflows for the year 2003 , Nash=0.72, RE=23%) considering peak discharges and low flows. The observed records were originally collected as reservoir elevation so the low flows in the observed data had very large day to day variation. The difference in some of the peak flows are as a result of the simplification in the temporal downscaling of daily to hourly rainfall. Soil parameters were adjusted from baseline information available in the FAO global dataset. Currently there are no installed streamflow gauges in Kaliwa river basin. Hence calibration of this basin was done by assuming similar soil properties for the same soil types in Angat and Kaliwa. Calibration in the Pampanga river basin was done for 2002 upstream in Pantabangan dam (Nash=0.5, RE=3.8%), Cabanatuan (Nash=0.05, RE=83%), Zaragoza (Nash=0.35, RE=34%), San Isidro (Nash=0.22, RE=50%) and 2001 for Arayat streamflow gauge (Nash=0.31, RE=24%). Some of the very low Nash are due to the sparse distribution of poor quality rainfall data in some areas covering this river basin. (2) Temporal comparison of soil moisture
Fig.2 Comparison of surface soil moistures from LDAS-UT and
WEB-DHM in Zaragoza Station, Pampanga River Basin.
To supplement validation of calibrated WEB-DHM outputs, monthly surface soil moisture outputs of LDAS-UT were compared with surface soil moisture outputs from WEB-DHM. Results showed that the temporal behavior of soil moisture from basin scale hydrological modeling and larger scale estimation using LDAS-UT can be used to estimate large scale soil moisture of the area. RE was found to be 2.23%. Currently there are some differences in the transition between wet and dry season due primarily to: 1.) Coarser resolution grid of LDAS-UT as compared to that of WEB-DHM, 2.) differences in rainfall input between LDAS-UT (uses TRMM rainfall) and WEB-DHM (uses observed rainfall), and 3.)the scale of comparison between LDAS-UT(grid point) and WEB-DHM (basin average upstream of Zaragosa gauge). However, results show that the estimations of the regional surface soil moistures from LDAS-UT are very similar with those from basin scale hydrological simulations hence, they can be used to verify past basin scale soil moisture trends especially in areas with short vegetation in areas with no observed soil moistures. Further verification of these values should be done when soil moisture information become available in the future. Currently, the simulated soil moistures assimilated by LDAS-UT and simulated by WEB-DHM were not used to project future climate change effects on basin scale droughts since the focus of the study was mainly on the behavior of discharge during extreme events. (3) Peak flow Trends Peak flow trends can be good indicators of future floods. Results after ranking (in descending order) the past and future 20 years daily discharge show similar patterns can be expected in the near future. However, the 10th percentile peak daily discharges for Angat, Kaliwa and Pampanga river basins showed that all 6 models of each basin had higher peak discharges in the future. This indicates a virtually certain (100% probability) increase in possible flood events in the future. (Table 1, 2 and 3, column 1) In all the 3 basins, highest peak discharge can go from 1.5x to 6x increase from past values while the remaining 19 peak flows show only a slightly higher (1x) to double (2x) the past peak values. These simulations were under the assumption that climatology will be similar in the past and in the future. However, even after bias correction and temporal downscaling, only the intensities and frequency of the extreme events can be simulated. Further studies are still needed to improve the timing as to when the extreme events occur. Hence,
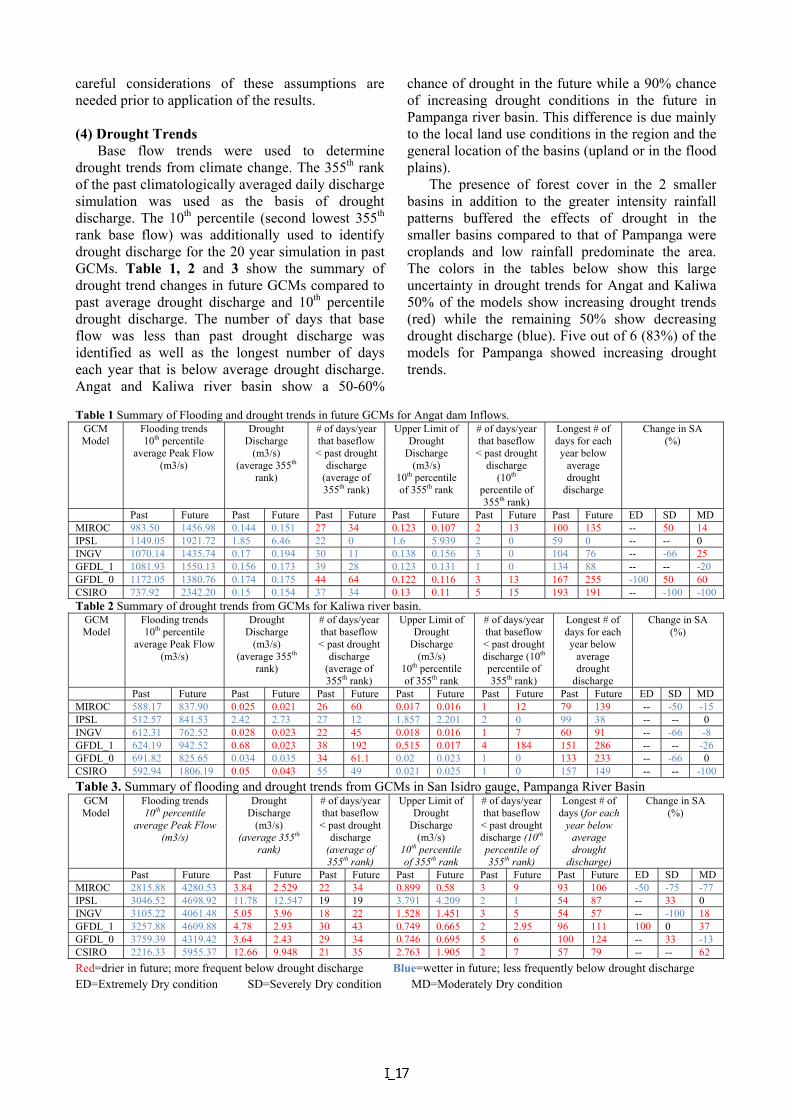
careful considerations of these assumptions are needed prior to application of the results. (4) Drought Trends Base flow trends were used to determine drought trends from climate change. The 355th rank of the past climatologically averaged daily discharge simulation was used as the basis of drought discharge. The 10th percentile (second lowest 355th rank base flow) was additionally used to identify drought discharge for the 20 year simulation in past GCMs. Table 1, 2 and 3 show the summary of drought trend changes in future GCMs compared to past average drought discharge and 10th percentile drought discharge. The number of days that base flow was less than past drought discharge was identified as well as the longest number of days each year that is below average drought discharge. Angat and Kaliwa river basin show a 50-60%
chance of drought in the future while a 90% chance of increasing drought conditions in the future in Pampanga river basin. This difference is due mainly to the local land use conditions in the region and the general location of the basins (upland or in the flood plains). The presence of forest cover in the 2 smaller basins in addition to the greater intensity rainfall patterns buffered the effects of drought in the smaller basins compared to that of Pampanga were croplands and low rainfall predominate the area. The colors in the tables below show this large uncertainty in drought trends for Angat and Kaliwa 50% of the models show increasing drought trends (red) while the remaining 50% show decreasing drought discharge (blue). Five out of 6 (83%) of the models for Pampanga showed increasing drought trends.
Table 1 Summary of Flooding and drought trends in future GCMs for Angat dam Inflows.
GCM Model
Flooding trends 10th percentile
average Peak Flow (m3/s)
Drought Discharge
(m3/s) (average 355th
rank)
# of days/year that baseflow < past drought
discharge (average of 355th rank)
Upper Limit of Drought
Discharge (m3/s)
10th percentile of 355th rank
# of days/year that baseflow < past drought
discharge (10th
percentile of 355th rank)
Longest # of days for each year below
average drought
discharge
Change in SA (%)
Past Future Past Future Past Future Past Future Past Future Past Future ED SD MD MIROC 983.50 1456.98 0.144 0.151 27 34 0.123 0.107 2 13 100 135 -- 50 14 IPSL 1149.05 1921.72 1.85 6.46 22 0 1.6 5.939 2 0 59 0 -- -- 0 INGV 1070.14 1435.74 0.17 0.194 30 11 0.138 0.156 3 0 104 76 -- -66 25 GFDL_1 1081.93 1550.13 0.156 0.173 39 28 0.123 0.131 1 0 134 88 -- -- -20 GFDL_0 1172.05 1380.76 0.174 0.175 44 64 0.122 0.116 3 13 167 255 -100 50 60 CSIRO 737.92 2342.20 0.15 0.154 37 34 0.13 0.11 5 15 193 191 -- -100 -100 Table 2 Summary of drought trends from GCMs for Kaliwa river basin.
GCM Model
Flooding trends 10th percentile
average Peak Flow (m3/s)
Drought Discharge
(m3/s) (average 355th
rank)
# of days/year that baseflow < past drought
discharge (average of 355th rank)
Upper Limit of Drought
Discharge (m3/s)
10th percentile of 355th rank
# of days/year that baseflow < past drought discharge (10th percentile of 355th rank)
Longest # of days for each year below
average drought
discharge
Change in SA (%)
Past Future Past Future Past Future Past Future Past Future Past Future ED SD MD MIROC 588.17 837.90 0.025 0.021 26 60 0.017 0.016 1 12 79 139 -- -50 -15 IPSL 512.57 841.53 2.42 2.73 27 12 1.857 2.201 2 0 99 38 -- -- 0 INGV 612.31 762.52 0.028 0.023 22 45 0.018 0.016 1 7 60 91 -- -66 -8 GFDL_1 624.19 942.52 0.68 0.023 38 192 0.515 0.017 4 184 151 286 -- -- -26 GFDL_0 691.82 825.65 0.034 0.035 34 61.1 0.02 0.023 1 0 133 233 -- -66 0 CSIRO 592.94 1806.19 0.05 0.043 55 49 0.021 0.025 1 0 157 149 -- -- -100
Table 3. Summary of flooding and drought trends from GCMs in San Isidro gauge, Pampanga River Basin GCM Model
Flooding trends 10th percentile
average Peak Flow (m3/s)
Drought Discharge
(m3/s) (average 355th
rank)
# of days/year that baseflow < past drought
discharge (average of 355th rank)
Upper Limit of Drought
Discharge (m3/s)
10th percentile of 355th rank
# of days/year that baseflow < past drought discharge (10th percentile of 355th rank)
Longest # of days (for each
year below average drought
discharge)
Change in SA (%)
Past Future Past Future Past Future Past Future Past Future Past Future ED SD MD MIROC 2815.88 4280.53 3.84 2.529 22 34 0.899 0.58 3 9 93 106 -50 -75 -77 IPSL 3046.52 4698.92 11.78 12.547 19 19 3.791 4.209 2 1 54 87 -- 33 0 INGV 3105.22 4061.48 5.05 3.96 18 22 1.528 1.451 3 5 54 57 -- -100 18 GFDL_1 3257.88 4609.88 4.78 2.93 30 43 0.749 0.665 2 2.95 96 111 100 0 37 GFDL_0 3759.39 4319.42 3.64 2.43 29 34 0.746 0.695 5 6 100 124 -- 33 -13 CSIRO 2216.33 5955.37 12.66 9.948 21 35 2.763 1.905 2 7 57 79 -- -- 62
Red=drier in future; more frequent below drought discharge Blue=wetter in future; less frequently below drought discharge ED=Extremely Dry condition SD=Severely Dry condition MD=Moderately Dry condition

Annual Journal of Hydraulic Engineering, JSCE, VOL.42, 1998, February
(5) Longer duration drought trends The SA drought index6) was used to project longer duration (at least 1 month) drying trends in the future (see SA trends in the last columns of Tables 1, 2, 3). For Angat, 3 models increase, 2 models remain the same and 1 model decreased while for Kaliwa, 4 models decreased while 2 models remained the same. Basin-scale average discharge for the entire Pampanga river basin showed that only miroc model increased in all SA categories while the rest showed different degrees of increase and decrease in the categories. The only difference is the presence of some extremely dry conditions in 3 of the models. 5. SUMMARY AND CONCLUSIONS Based on results from the 3 basins, it is virtually certain that larger floods will occur more often in the future. On the other hand, the results also suggested that severe droughts will very likely occur in the Pampanga river basin but about as likely as not in Angat and Kaliwa basins with local conditions playing a very important role in how floods and droughts affect them. However, careful consideration of uncertainty should be considered for water resource management planning factoring in future changes in climate in these basins. ACKNOWLEDGMENT: This research was implemented as part of a project of the Japan International Cooperation Agency (JICA) for “The study of Water Security Master Plan for Metro Manila and its Adjoining Areas”, Data Integration and Analysis System (DIAS) project 2011-2015 and the Research Program on Climate Change Adaptation (RECCA) project. REFERENCES 1) Intergovernmental Panel on Climate Change (IPCC):
Climate Change 2007: The Physical Science Basis, 996 pp., Cambridge Univ.Press, Cambridge, U. K, (2007),
2) Kim, D.W. and H.R. Byun: Predicting future pattern of Asian Drought under Global Warming Scenario. Theor. Appl. Climatol. 98:137-150, DOI10.1007/s00704-008-0100-y, 2009.
3) Ines A. V. M., and J. W. Hansen : Bias correction of daily GCM rainfall for crop simulation studies, Agricultural and Forest Meteorology, 138, 44-53, (2006),
4) Feddersen H., and U. Andersen: A method for statistical downscaling of seasonal ensemble predictions. Tellus, 57A, 398-408, (2005).
5) Sharma D, Das Gupta A, Babel MS: Spatial disaggregation of bias-corrected GCM precipitation for improved hydrologic simulation: Ping river basin,
Thailand. Hydrol Earth Sys Sci 11(4):1373–1390, (2007).
6) Jaranilla-Sanchez, P.A., L. Wang and T. Koike: Modelling the Hydrological responses of the Pampanga river basin, Philippines: A quantitative approach for identifying droughts, Water Resour. Res., doi: 10.1029/2010WR00972, 2011.
7). Sellers, P.J, L. Bounoua, G.J. Collatz, D.A. Randall, D.A. Dazlich, S.O. Los, J.A. Berry, I. Fung, C.J. Tucker, C.B. Field, and T.G. Jensen: Comparison of radiative and physiological effects of doubled atmospheric CO2 on climate. Science, 271, 1402-1406, doi:10.1126/science.271.5254.1402, 1996
8) Yang, D., T. Koike and H. Tanizawa: Application of a distributed hydrological model and weather radar observation for flood management in the upper Tone River of Japan, Hydrol. Process., 18, doi:10.1002/hyp.5752, 2004.
9) Wang, L. and T. Koike: Comparison of a Distributed Biosphere Hydrological Model with GBHM. Ann. Jour. Hydraul. Eng.-JSCE, pp.103-108, 2009.
10) Wang, L., T. Koike, K. Yang, T.J. Jackson, R. Bindlish and Yang, D.: Development of a distributed biosphere hydrological model and its evaluation with the Southern Great Plains Experiments (SGP97 and SGP99), J. Geophys. Res., Vol. 114, 2009.
11) Cessaraccio C., D. Spano, P. Duce and R.L. Snyder: An improved mode for determining degree day values from daily temperature data, Int. J. Biometeorol., Vol. 45, pp. 161-189, 2001.
12) Yang, K., T. Koike, B. Ye: Improving estimation of hourly, daily and monthly solar radiation by importing global datasets, Agricultural and Forest Meteorology, doi: 10.1016/j.agrformet.2006.02.001, 2006.
13) Crawford, T. and C. Duchon: An improved parameterization for estimating effective atmospheric emissivity for use in calculating daytime downwelling longwave radiation, J. Applied Meteorol., Vol. 38, pp.474-480, 1999.
14) Nash, J. E., and I.V. Sutcliffe: River Flow Forecasting through Conceptual Models Part I- A discussion of Principles, J. Hydrol., Vol 10, pp. 282-290, 1970.
15) Nyunt, C.T., P.A.J. Sanchez, A. Yamamoto, T. Nemoto, M. Kitsuregawa and T. Koike: Bias correction method for climate change impact assessments in the Philippines, Ann. Jour. Hydraul. Eng.-JSCE, Vol.57 (submitted).
16) Yang, K., T. Watanabe, T. Koike, X. Li, H. Fujii, K. Tamagawa, Y. Ma, and H. Ishikawa: Auto-calibration system developed to assimilate AMSR-E data into a land surface model for estimating soil moisture and the surface energy budget. J. Meteor. Soc. Japan, Vol.85A, pp.229-242, 2007.
(Received September 30, 2012)