hyperspectral imaging for food applications … · stephen marshall, timothy kelman, tong qiao,...
TRANSCRIPT

HYPERSPECTRAL IMAGING FOR FOOD APPLICATIONS
Stephen Marshall, Timothy Kelman, Tong Qiao, Paul Murray, Jaime Zabalza
Department of Electronic and Electrical Engineering, University of Strathclyde,Royal College Building, 204 George Street, Glasgow, G1 1XW, Scotland
ABSTRACTFood quality analysis is a key area where reliable, non-destructive and accurate measures are required. Hyperspec-tral imaging is a technology which meets all of these require-ments but only if appropriate signal processing techniquesare implemented. In this paper, a discussion of some ofthese state-of-the-art processing techniques is followed byan explanation of four different applications of hyperspectralimaging for food quality analysis: shelf life estimation ofbaked sponges; beef quality prediction; classification of Chi-nese tea leaves; and classification of rice grains. The first twoof these topics investigate the use of hyperspectral imagingto produce an objective measure about the quality of the foodsample. The final two studies are classification problems,where an unknown sample is assigned to one of a previouslydefined set of classes.
Index Terms— Signal Processing, Image Processing,Classifiers, Spectral Imaging
1. INTRODUCTION
Where conventional digital imaging devices capture light overone (greyscale) or three (red, green, blue) distinct portions ofthe electromagnetic spectrum, a hyperspectral imaging (HSI)system acquires light at hundreds or even thousands of differ-ent spectral bands. Similar to the way in which a spectrometerproduces a spectrum of the light captured at a single point, anHSI system produces a spectrum for each pixel in the image.This combination of spatial and spectral detail provides sig-nificantly more information about a scene. Historically, appli-cations of HSI have tended to be large and complex, such asremote sensing, wide area surveillance and aircraft-based sys-tems [1, 2]. Due to the price and size of HSI systems, it wasonly in these areas that the technology was a viable tool. Therecent reduction in both price and size, however, has made hy-perspectral imaging a more attractive option for lab based ap-plications such as forensic science [3] and, in particular, foodquality analysis [4]. In this paper, several analysis techniquesare explained before the results of four different implemen-tations of HSI in food based applications are explained. The
Thanks to Lightbody of Hamilton, Finsbury Food Group and QualityMeat Scotland
results show that HSI is a useful tool in food quality analysis.The rest of this paper is arranged as follows. In Sec-
tion 2, some state-of-the-art data analysis techniques forfeature extraction and data classification/prediction are dis-cussed. Based on which, 4 case studies for food analysis areintroduced in Sections 3-6, which cover shelf life estimationof baked sponges, beef quality prediction, classification ofChinese teas and rice classification using combined features.Finally, concluding remarks are presented in Section 7.
2. DATA ANALYSIS TECHNIQUES
This section contains overview of several different methodsof data analysis ranging from feature extraction and selectionthrough to classification.
2.1. Feature Extraction and Dimensionality Reduction
Conventional Principal Component Analysis (PCA) can beused as a method of both feature extraction and dimension-ality reduction, making it a common technique used in HSIanalysis [5]. In general, PCA transforms correlated data intouncorrelated components where only a few need to be re-tained to capture most of the variance within the data. Byrepresenting a dataset in a lower dimensional space in thisway, faster and more efficient analysis and classification canbe performed [6].
PCA operates by calculating the covariance matrix ofthe mean-adjusted dataset. Eigen decomposition of this co-variance matrix produces its corresponding Eigenvalues andEigenvectors. These Eigenvectors can then be used to trans-form the original dataset into an uncorrelated version. Bysorting the Eigenvalues into descending order and discardingthe smallest values, the corresponding Eigenvectors can betruncated leading to a much smaller representation of theoriginal dataset when transformed into the new subspace.
Conventional PCA suffers from two main drawbackswhen used for HSI. Firstly, the complete captured image isrequired before mean-adjustment can take place, preventingreal-time analysis. Secondly, the calculation of the covariancematrix for the the whole dataset is a computationally intensivetask. Structured Covariance PCA (SC-PCA) is one methodof overcoming these problems [7]. In SC-PCA the data is

split into sections and a partial covariance matrix is obtainedfor each section and then further processed as in conventionalPCA. These sections can either be pixels, bands, rows orcolumns of an HSI dataset which correspond to the com-mon ways in which HSI data is acquired allowing real-timeprocessing, or in the case of already captured data, parallelprocessing as each section can be processed individually.
Folded-PCA [6] is a another adaptation of conventionalPCA. If a hypercube has dimensions (x, y, λ) with x rows, ycolumns and λ bands, the data must be reshaped into a matrixof dimensions (x×y, λ). Each row of this matrix is treated asa vector as PCA is implemented. In Folded-PCA, each vectorin this matrix is converted to a 2D matrix. Similar to SC-PCA,partial covariance matrices are calculated for each of these 2Dsections. These can then be accumulated for Eigendecompos-tion and data projection. As a result, the computational costand memory requirements are lowered. Furthermore, sincelocal structures within the dataset can be exploited, Folded-PCA can out perform conventional PCA methods as a featureextraction method for classification problems.
Since HSI data is prone to noise, the performance of anysubsequent classification can suffer. In [8] Singular SpectrumAnalysis (SSA) is demonstrated to be an effective means ofimproving classification in a remote sensing problem. SSAoperates by extraction of trends and periodic components;finding structures in short time series and envelopes of os-cillation signals. In [9] SSA is extended to operate on 2Dfeatures.
2.2. Data Prediction and Classification
To make decisions based on captured HSI data, some formof classification is often required. Two popular methods ofHSI classification are Artificial Neural Networks (ANNs) andSupport Vector Machines (SVMs).
ANNs are computational models based on the operationof a biological central nervous system. ANNs consist ofnodes (‘neurons’) linked by weighted connections. Thesenodes compute values based on inputs. Training of a ANNis performed by adjusting these weightings until the errorbetween the ground truth and network output is minimised.This makes them ideal for classification problems involvingHSI data [10].
SVMs are a popular classification technique for HSI prob-lems [11]. SVMs aim to classify two-class data by findingthe optimum hyperplane which separates the data. Almost al-ways, the data is not immediately linearly separable in thisway, so a technique known as the kernel trick [12] is requiredto map the data into a higher dimension before classification.Although a binary classifier, multiple instances can be com-bined in one against one or one against all fashion to achievemulti-class classification.
Fig. 1: VNIR HSI System
3. SHELF LIFE ESTIMATION OF BAKED SPONGES
In the baking industry, organoleptic testing is used to deter-mine the eating quality of baked sponges. This testing is car-ried out by skilled human tasters (usually bakery staff) whoeat sponges of varying ages and assign each one a score. Byrepeating this process over a period of time with sponges allfrom a single batch, the relationship between the eating qual-ity and the age of a sponge is quantified. Based on this infor-mation, an age at which a sponge is no longer acceptable toeat can be determined, i.e. its shelf life.
This organoleptic testing process is used across the bakingindustry for quality analysis of a large number of products. Itis, however, a very subjective test, and many external factorscan affect a person’s sense of taste. There are several otherdrawbacks such as requiring the same staff to be present forthe tasting each day and a limitation on the number of prod-ucts that can be tested by a single person in a single tastingsession.
The aim of this study is to produce an objective, accurateand repeatable measure of the quality of a baked sponge us-ing a visible/near infrared (VNIR) HSI system. The systemused has a spectral range of 400 nm - 1000 nm and is shownin Figure 1. By analysing the change in reflectance as a func-tion of time at 970 nm, a known water absorption band [13],the reduction water content (i.e. drying out) of a sponge canbe estimated. This is shown in Figures 2(a) and 2(b), wherethe reflectance at 970 nm is clearly increasing for both spongetypes as they get older. Although the reflectance at all wave-lengths is increasing, it is more apparent around 970 nm. Bynormalising and inverting these reflectance values, a decreas-ing score is produced. To test the correlation between thisscore and sponge quality, a batch of chocolate and a batch ofvanilla sponges were produced. A different one of each ofthese sponges was imaged each day for a period of 30 days.Simultaneously, a different one of each of these sponges wasorganoleptically scored by a tasting panel. When compared,the scores produced by the tasting panel show a strong rela-tionship with the scores produced from the HSI data as shown

Wavelength (nm)
400 500 600 700 800 900 1000
Inte
nsity
250
300
350
400
450
500
550
600Vanilla Sponge Spectral Profile
Day 9
Day 8
Day 5
Day1
(a)Wavelength (nm)
400 500 600 700 800 900 1000
Inte
nsity
200
250
300
350
400
450
500
550
600Choclate Sponge Spectral Profile
Day 9
Day 8
Day 5
Day1
(b)
0 5 10 15 20 25 300
0.1
0.2
0.3
0.4
0.5
0.6
0.7
0.8
0.9
1
Day Number
Normalised Appearance, Taste and Texture and 970 nm for Vanilla Sponge
Appearance
Taste
Texture
980 nm
(c)
0 5 10 15 20 25 300
0.1
0.2
0.3
0.4
0.5
0.6
0.7
0.8
0.9
1Normalised Appearance, Taste and Texture and 970 nm for Chocolate Sponge
Day Number
Appearance
Taste
Texture
980 nm
(d)
Fig. 2: HSI of Baked Sponges (a) Spectral profile ageing vanillasponge (b) Spectral profile ageing chocolate sponge (c) HSI scoresproduced from reflectance at 970 nm compared with organolepticdata for vanilla sponge (d) HSI scores produced from reflectance at
970 nm compared with organoleptic data for chocolate sponge.
in Figures 2(c) and 2(d). This shows that HSI data has thepotential provide an objective, non-destructive score for thequality of a baked sponge which could be used to estimateshelf life.
4. HSI FOR BEEF QUALITY PREDICTION
As is well known, Scottish meat has a high international repu-tation for its eating quality. For meat industries, identificationof the quality of their products before they enter the marketis crucial. The perception of consumers on meat eating qual-ity is usually influenced by three factors: tenderness, juicinessand flavour. However, measurement of these factors is usuallycostly, time-consuming and destructive, which is infeasiblefor meat industries.
As a non-destructive approach, near-infrared spectroscopy(NIRS) has shown its potential in evaluating meat quality overthe past a few decades [14, 15]. In spite of this, due to its lowspatial resolution, this technique might not be accurate whenevaluating meat with non-homogeneous composition. Thisstudy looks at HSI as an alternative method for determiningmeat quality.
A total of 858 cattle from 4 Scottish commercial abattoirswere randomly selected from the production line. Each car-cass was allowed to age for 2 days, before a piece of steak wasremoved for imaging, using a visible HSI system followed byan NIRS system with working wavelengths of 490 - 863 nmand 501 - 2200 nm respectively. Then each steak was halved,with one half being aged for another 5 days and the other half
System ncal R2cal nval R2val RPDval
NIRS 644 0.42 214 0.36 1.22HSI 644 0.7 214 0.44 1.38
Table 1: Comparison of prediction performance for pH14
being aged for a further 12 days. Ultimate pH and slice shearforce (SSF) were measured as quality references after ageingwas completed.
The lean reflectance spectra were extracted from each hy-percube and a median spectrum was acquired for each steak.For both HSI and NIRS spectra, reflectance was converted toabsorbance to linearise the relationship between the concen-tration of an absorbing compound and the absorption spec-trum. The whole data set was split into the training set andthe testing set, where an SVM was applied to the training setto construct prediction equations. The performance was eval-uated on the training set. It is proved in [15] that partial leastsquares regression (PLSR), which is the most common regres-sion method researchers tend to use, underperforms SVM forbeef quality evaluation using NIRS. Since SVMs are subjectto the curse of dimensionality, PCA was used for both dimen-sionality reduction and feature extraction. For the SVM, theRadial Basis Function (RBF) kernel was selected and the op-timal parameters were determined using a grid-search with 4-fold cross-validation. In order to split the data set, each qual-ity attribute was sorted in ascending order. Then every 4thsample was selected into the validation set and the rest wasallocated to the calibration set. In this way, the validation setwould be a representative of the calibration set, with similaraverage value, standard deviation and range. The predictionperformance was evaluated by the coefficient of determina-tion (R2) and the ratio of performance to deviation (RPD), i.e.the ratio of standard error in prediction to the sample standarddeviation.
For most of the quality attributes, HSI offers higher pre-diction accuracies by comparing R2 and RPD. Ultimate pHwith 14 days ageing (pH14) is given for comparison in Ta-ble 1. Further results from this study are explained in [16]and similar research has also been done with lamb, where HSIagain shows great potential for quality analysis [17].
5. CLASSIFICATION OF CHINESE TEA SAMPLES
In this section, a process for classification of five types of Chi-nese tea is documented. Due to the popularity of tea con-sumption and the varying prices and qualities between dif-ferent brands, some form of analysis and classification is re-quired to verify the product being sold. While conventionalmethods rely on subjective input from domain experts, HSIprovides an objective and consistent measure, even when theexamined samples appear (to the human eye) almost identicalto each other.
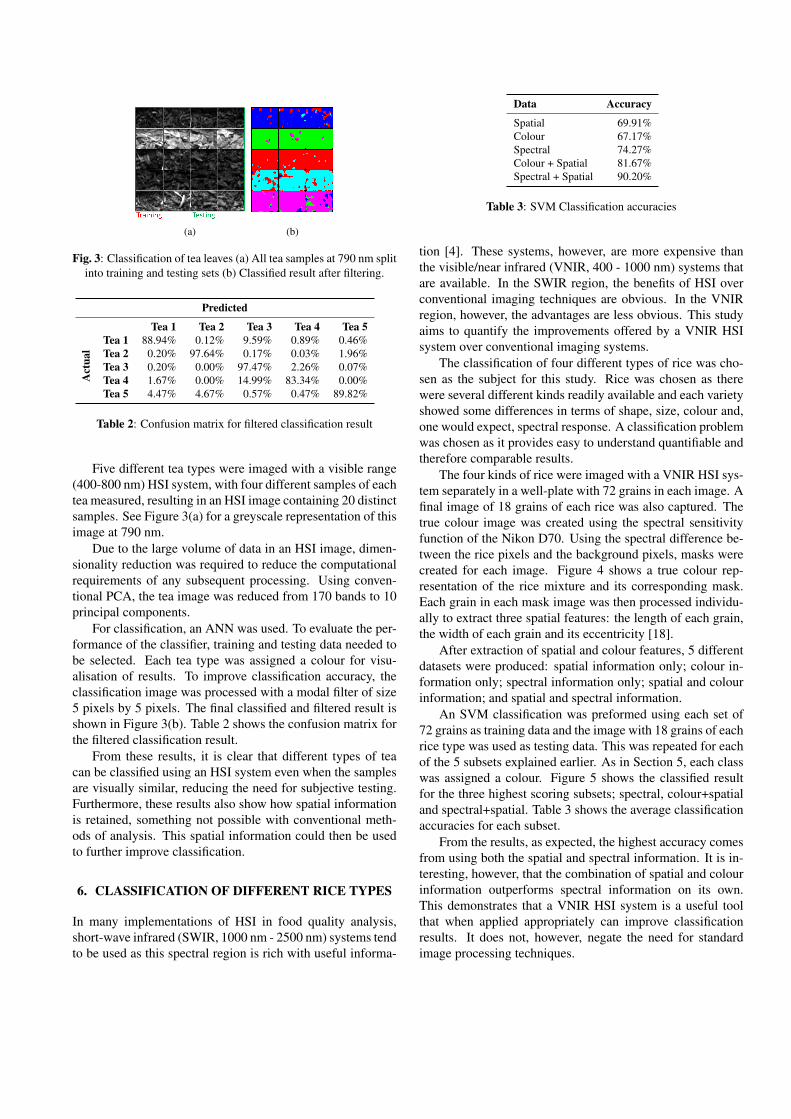
(a) (b)
Fig. 3: Classification of tea leaves (a) All tea samples at 790 nm splitinto training and testing sets (b) Classified result after filtering.
Predicted
Tea 1 Tea 2 Tea 3 Tea 4 Tea 5
Act
ual
Tea 1 88.94% 0.12% 9.59% 0.89% 0.46%Tea 2 0.20% 97.64% 0.17% 0.03% 1.96%Tea 3 0.20% 0.00% 97.47% 2.26% 0.07%Tea 4 1.67% 0.00% 14.99% 83.34% 0.00%Tea 5 4.47% 4.67% 0.57% 0.47% 89.82%
Table 2: Confusion matrix for filtered classification result
Five different tea types were imaged with a visible range(400-800 nm) HSI system, with four different samples of eachtea measured, resulting in an HSI image containing 20 distinctsamples. See Figure 3(a) for a greyscale representation of thisimage at 790 nm.
Due to the large volume of data in an HSI image, dimen-sionality reduction was required to reduce the computationalrequirements of any subsequent processing. Using conven-tional PCA, the tea image was reduced from 170 bands to 10principal components.
For classification, an ANN was used. To evaluate the per-formance of the classifier, training and testing data needed tobe selected. Each tea type was assigned a colour for visu-alisation of results. To improve classification accuracy, theclassification image was processed with a modal filter of size5 pixels by 5 pixels. The final classified and filtered result isshown in Figure 3(b). Table 2 shows the confusion matrix forthe filtered classification result.
From these results, it is clear that different types of teacan be classified using an HSI system even when the samplesare visually similar, reducing the need for subjective testing.Furthermore, these results also show how spatial informationis retained, something not possible with conventional meth-ods of analysis. This spatial information could then be usedto further improve classification.
6. CLASSIFICATION OF DIFFERENT RICE TYPES
In many implementations of HSI in food quality analysis,short-wave infrared (SWIR, 1000 nm - 2500 nm) systems tendto be used as this spectral region is rich with useful informa-
Data Accuracy
Spatial 69.91%Colour 67.17%Spectral 74.27%Colour + Spatial 81.67%Spectral + Spatial 90.20%
Table 3: SVM Classification accuracies
tion [4]. These systems, however, are more expensive thanthe visible/near infrared (VNIR, 400 - 1000 nm) systems thatare available. In the SWIR region, the benefits of HSI overconventional imaging techniques are obvious. In the VNIRregion, however, the advantages are less obvious. This studyaims to quantify the improvements offered by a VNIR HSIsystem over conventional imaging systems.
The classification of four different types of rice was cho-sen as the subject for this study. Rice was chosen as therewere several different kinds readily available and each varietyshowed some differences in terms of shape, size, colour and,one would expect, spectral response. A classification problemwas chosen as it provides easy to understand quantifiable andtherefore comparable results.
The four kinds of rice were imaged with a VNIR HSI sys-tem separately in a well-plate with 72 grains in each image. Afinal image of 18 grains of each rice was also captured. Thetrue colour image was created using the spectral sensitivityfunction of the Nikon D70. Using the spectral difference be-tween the rice pixels and the background pixels, masks werecreated for each image. Figure 4 shows a true colour rep-resentation of the rice mixture and its corresponding mask.Each grain in each mask image was then processed individu-ally to extract three spatial features: the length of each grain,the width of each grain and its eccentricity [18].
After extraction of spatial and colour features, 5 differentdatasets were produced: spatial information only; colour in-formation only; spectral information only; spatial and colourinformation; and spatial and spectral information.
An SVM classification was preformed using each set of72 grains as training data and the image with 18 grains of eachrice type was used as testing data. This was repeated for eachof the 5 subsets explained earlier. As in Section 5, each classwas assigned a colour. Figure 5 shows the classified resultfor the three highest scoring subsets; spectral, colour+spatialand spectral+spatial. Table 3 shows the average classificationaccuracies for each subset.
From the results, as expected, the highest accuracy comesfrom using both the spatial and spectral information. It is in-teresting, however, that the combination of spatial and colourinformation outperforms spectral information on its own.This demonstrates that a VNIR HSI system is a useful toolthat when applied appropriately can improve classificationresults. It does not, however, negate the need for standardimage processing techniques.

(a) (b)
Fig. 4: Mixture of different kinds of rice (a) True colour representa-tion (b) Corresponding extracted mask image
(a) (b) (c)
Fig. 5: SVM Classification results (a) Spectral information (b)Colour and spatial information (c) Spectral and spatial information
7. CONCLUSION
This paper has provided an overview of some of the populardata analysis techniques used in HSI and some of the associ-ated recent developments. Four different studies of applica-tions using HSI for food analysis were then presented, demon-strating the benefits offered by HSI when compared alterna-tive methods such as organoleptic testing as well other othertechnologies such as spectroscopy and conventional digitalimaging. Often, any measure of food quality is either sub-jective, e.g.based on the opinions of a skilled tasting panel, ordestructive, e.g. the destructive test used to determine meattenderness. The studies on sponges and beef have demon-strated that HSI has to the potential to either replace or aug-ment these techniques which would result in significant bene-fits for the industry. The classifications of Chinese tea leavesand rice grains show how HSI can be used to differentiate be-tween visually similar samples. This has potential to assist ina process where counterfeit products are a threat to a manu-facturing business.
REFERENCES
[1] A. F. H. Goetz, G. Vane, et al., “Imaging spectrometry forearth remote sensing,” Science, 1985.
[2] H. Ren and C. Chang, “Automatic spectral target recognition
in hyperspectral imagery,” Aerospace and Electronic Systems,IEEE Transactions on, 2003.
[3] K. Gill, J. Ren, et al., “Quality-assured fingerprint image en-hancement and extraction using hyperspectral imaging,” in 4thInternational Conference on Imaging for Crime Detection andPrevention, 2011.
[4] D. Wu and D. Sun, “Advanced applications of hyperspectralimaging technology for food quality and safety analysis andassessment: A review - part ii: Applications,” Innovative FoodScience & Emerging Technologies, 2013.
[5] J. Ren, J. Zabalza, et al., “Effective feature extraction anddata reduction with hyperspectral imaging in remote sensing,”IEEE Signal Processing Magazine, 2014.
[6] J. Zabalza, J. Ren, et al., “Novel folded-pca for improved fea-ture extraction and data reduction with hyperspectral imagingand sar in remote sensing,” ISPRS Journal of Photogrammetryand Remote Sensing.
[7] J. Zabalza, J. Ren, et al., “Structured covariance principalcomponent analysis for real-time onsite feature extraction anddimensionality reduction in hyperspectral imaging,” AppliedOptics, 2014.
[8] J. Zabalza, J. Ren, et al., “Singular spectrum analysis for effec-tive feature extraction in hyperspectral imaging,” IEEE Geo-science and Remote Sensing Letters.
[9] J. Zabalza, J. Ren, et al., “Novel two dimensional singu-lar spectrum analysis for effective feature extraction and dataclassification in hyperspectral imaging,” IEEE Transactionson Geoscience and Remote Sensing.
[10] P. K. Goel, S. O. Prasher, et al., “Classification of hyper-spectral data by decision trees and artificial neural networksto identify weed stress and nitrogen status of corn,” Comput-ers and Electronics in Agriculture, 2003.
[11] F. Melgani and L. Bruzzone, “Classification of hyperspectralremote sensing images with support vector machines,” IEEETransactions on Geoscience and Remote Sensing, 2004.
[12] T. Hofmann, B. Schlkopf, et al., “Kernel methods in machinelearning,” Ann. Statist., 2008.
[13] P. J. Curran, “Remote sensing of foliar chemistry,” RemoteSensing of the Environment, 1989.
[14] B Savenije, GH Geesink, JGP Van der Palen, and G Hemke,“Prediction of pork quality using visible/near-infrared re-flectance spectroscopy,” Meat Science, 2006.
[15] T. Qiao, J. Ren, et al., “Quantitative prediction of beef qualityusing visible and NIR spectroscopy with large data samplesunder industry conditions,” Journal of Applied Spectroscopy,2015.
[16] T. Qiao, J. Ren, et al., “Comparison between near infraredspectroscopy and hyperspectral imaging in predicting beef eat-ing quality,” in Hyperspectral Imaging Conference, Coventry,UK, 2014.
[17] T. Qiao, J. Ren, et al., “Prediction of lamb eating quality usinghyperspectral imaging,” in 2nd Conference on Optical Char-acterization of Materials, Karlsruhe, Germany, 2015.
[18] X. Ben, W. Meng, et al., “Dual-ellipse fitting approach forrobust gait periodicity detection,” Neurocomputing, 2012.