i a study of 23 palestinian villages in the central
TRANSCRIPT

i
A Study of 23 Palestinian Villages in the Central District of the West Bank
with Special Reference to the Needs of Persons with Disabilities
II
The Central Regional Committee for Rehabilitation
II
(Patients Friends SocietyRamallah land Palestine Health CouncilJerusalem) II
Ii
II
I I
Ii
Ii
II
I I
II
III
October 1995
i
Community Based Rehabilitation Workers I Naimeh Siam Firial Shehadeh
Nawal al-Qadi Hiam al-Sayes Tahrir Nofal Janan Samhan Lamia al-Sheikh Nida Hammad
I
I Field Work Supervisors Valid Hamdan Abdul Sami al-Sheikh
j
Project Manager Majed Abdul Fattah
I
I Regional Committee Representatives
Ghazi Hanania Patients Friends Society
I I
Coordinator of Diakonia CBR Projects Ghada Harami
I Director of Dlakonla CDR Projects Ivan Magnuson
IDiakonia Consultant to CDR Project Ulrike Pars6n
I Computer Coding Supervisor Hala SalemIAtieh - Birzeit University
Computer Coding Janaan Barghouthi - Birzeit University
I Analysis of Report and Writing
I
Ghada Harami Ulrike Parson i I
List of Participants in Central Area Study
Inam Abu Hasma Fatima al-Sayes Shamieh Sroor
Khaled Qrei Palestine Health Council
Rita Giacaman Birzeit University
I Table of Contents I
I
I 10 Introduction 11 Community Based Rehabilitation (CBR) pI 12 The Initiation of the CBR Project p4
I I
20 The Survey 21 A Brief Description of the Study Area p5 22 Survey Methodology p7
30 Gene~al Description of Survey Population 31 Estimates of Population Size and Rate of Disability p9 32 Distribution of Population by Origin pl0 oJoJ Distribution of Population by Gender p12 34 Household Size p13
i 40 Socio-Economic Status of Survey Population 41 Work Patterns amongst Household Heads p16 42 Educational Attainment amongst Household Heads p18 43 Homb Ownership Patterns p25 44 Crowding Rates p26 45 Wealth Status p30
50 DesJiPtion of the Population of Persons with Disabilities 51 Distribution by Gender p38 52 Distnbution by Age p40 53 Duration and Types of Disabilities p42 54 Daily Living Skills p46 55 Community Integration p47 56 Service Provision for Disabled People p52 57 Difficulties Faced by the Families of Disabled People p55 58 Gender p58
I
60 sunhnary and Conclusions 61 Summary of Study Findings p61 62 Priorities for CBR Programs p63
I
I APPENDIX I Overall Characteristics of the 23 Central Area Villages p66 APPENDIX II-A Characteristics of Beit Dr al-Tahta Catchment Area p70 APPENDIX II-B Characteristics of Nilin Catchment Area 174 APPENDIX Characteristics of Kharbathat Bani Hareth Catchment Area p78
10 INTRODUCTION
11 Community Based Rehabilitation (CBR) I
This study signals the initiation of the third regional model for community based rehabilitation in Palestine The first model was established in the Gaia Strip during the period 1990-1991 At the time 9 nonshygovernmental organisations working in the area of either primary health care or disability rehabilitation joined hands in order to address local needs They eventually formed themselves into the Gaza National Committee for
Rehabilitation with the aim of overseeing the piloting of community based bull I
rehabilitation (CBR) programmes to complement existing secondary services The experience of the Gaza Committee in institutional coordination and modelling was the first in the country Although the context in the Gaza Strip differs from that of the West Bank this experience nevertheless proved to be important as a model around which the initiation of the Central National Committee for Rehabilitation (CNCR) on the West Bank took place
Parallel to the developments in the Gaza Strip the Central National
Committee for Rehabilitation in the West Bank was formed during the same period Composed of all the major non-governmental organisations working in the area of disability rehabilitation the CNCR in the West Bank decided
I
on a different organisational approach from that of the Gaza Committee for a variety of reasons the institutional base in the West Bank was wider than that in Gaza with different institutions in the West Bank already developing appropriate locally-tailored programmes to rehabilitate the disabled within their communities and the activities of the CNCR were due to take place in a
Study of 23 Villages in the Central District 2
larger and more diverse geographical area Thus the CNCR took a coordinating role creating regional committees - comprised of 9 nonshygovernmental organisations working in the three regions of the country the north the centre and the south - responsible for planning and implementing pilot projects in their respective regions
I I
At the onset international trainers were brought in to train staff in the technical skills that formed the main part of the course which was based on the WorId Health Organisation manual Rehabilitation in the Community This training focused on improving the daily living activities of the disabled although selected measures to encourage social integration were also discussed in brief The manual provided a basic reference tool including a simple and workable system of supervision animation and reporting although it i needed to be adapted constantly as the projects moved from one region to the other As the Gaza project was developing the experience accumulated assisted in developing improved curricula for the project in the northern region Moreover channels of communications began to develop between the first two projects During the development of the central region project - which is the subject of this survey - both the Gazan and northern projects experience were utilised in the planning and the initiation phases local trainers with cumulative experience were used to train the CBR workers field training of the central area workers included visits and training on site in rhe north and in Gaza and a general network of support and information exchange developed
I
i Recently the central area project joined the other projects to provide
support to ithe newly emerging project in the south of the country While the overall CBR scheme initially relied mainly on international experts to provide the technical component of the training today a core team of local trainers is visibly and actively in place This year a new project is expected to be launched in the Nablus region of the country where training is expected to be carried out I completely by local staff In addition to this transfer of training skills from I international to local staff the training has been and continues to be adapted by local experience giving the national CBR project a good chance to sustain itself and continue its work
I I
I I
3 itrict
)k a nonshy the uing
the Ion [his led ilso 19 a ng Jne [lce the lop on ern ~s
3R ng nd
je
le Ie IS )e Ie g o d
i
I I
Study of 23 Villages in the Central District
I At another level a network is gradually being built from the bottom
upwards with the CBR workers in all the country as key participants Regular meetings among the different projects in the different regions are currently taking place during this stage at project manager level In this forum experience is exchanged problems are discussed policies and plans are formulated and a general vision for the future development of the CBR projects in the West Bank and Gaza Strip is being worked out While the CNCR and the Gaza Regional Committee continue to provide guiding logistic and other forms of support to the other projects they are being developed with the CBR workers and project managers in a way that allows them the opportunity to develop the policies and plans for the national scheme as well as for their own local schemes The workers today see themselves not only within the context of their own project and region but also in a national framework I
1
This national programme is presently offering the opportunity to implement different types of activities all geared towards assisting the disabled not only in physical but in other ways as well particularly in relation to their fundamental civil and human rights as equal citizens The Palestinian Union of Disabled People is informally linked to the CBR projectinitiated by i
I
a few founding members around the same time as the CBR projects began While the two bodies are independent they work together in parallel ways with extensive coordination and cooperation The task of the CBR projects is to assist disabled people in their attempt to gain the same rights as any other citizen of the region Within the context of this mutually beneficial relationship the CBR projects assist the Union in implementing different schemes Those include the identification of disabled people encouragement to join the Union and logistic and technical assistance including assistance in building a democratic organisational structure from the base upwards At the moment the Union is preparing to hold national general elections ih which the CBR projects are providing an important supportive role at the regional levels
I I
It should be mentioned that through the building of this experience I
logistic technical and financial support was provided to the projects by Diakonia a Swedish organisation that provides consultation services by
j I
I I
Study of 23 Villages in the Central District 4
drawing in local and international experts to the field Today a positive coordination and cooperation among different international aid agencies is taking place all geared to support the national level project At this stage Diakonia is co-operating with the Norwegian Association of the Disabled and the Swedish Palestine Solidarity Group Cooperation is taking different forms including financial support and technical assistance that includes capacity building and the training of local human resources The representatives of these organisations have never worked independently of local institutions instead participating with local experts in discussion and debate ensuring an informed direction for both the projects and for future plans It is in this sense that a partnership between international and local non-governmental organisations has yielded a specific approach to development work in the occupied territories an approach that is firmly based in the utilisation of local expertise and knowledge to avoid the pitfalls of both inappropriate imported strategies and of organisational structures built independently of local skills and resources
12 The Initiation of the CBR Project I
With the Central Regional Committee for Rehabilitations links with the central area villages well established as a result of the provision of institutional rehabilitation services in the urban centre of Ramallah the Committee was compelled to complement these services with rehabilitation in the community Guided by the experience generated by the different regional committees in establishing CBR projects in the Gaza and northern region of the West Bank the Central Committee began with the training of 15 CBR workers This training was accredited by Bethlehem University and was held in the middle part of 1993 The course followed similar lines to the courses launched by the Gaza National Committee and the Northern Regional Committee with the technical component once again based on the World Health Organisation manual Rehabilitation in the Community modified to suit the local context Once the training was completed additional training in survey methodology was provided to the prospective CBR workers with this practical training completed before the survey was formally begun
5 rict
tive S IS
ige and ent des rhe of md ure leal to
aly ills res
he of he In
ial of ~R
ld es al ld to In
IS
I
II
I Study of 23 Villages in the Central District
20 THE SURVEY
21 A Brief Description of the Study Area
I Located in the Ramallah District of the central region of the West Bank
this cluster of 23 villages is located near the border with Israel (the 1967 armistice line or Green Line) at distances ranging from 20 and up to 40 kilometres i from the Ramallah urban area Before 1948 these villages belonged to the Lid and Ramleh areas of Mandate Palestine As is the case with other border villages the 1948 war and the creation of the State of Israel resulted in some of the inhabitants of these villages losing eitheror a combination of their homes their land their extended family land and many therefore their source of livelihood Such families were given semi-refugee status by the United Nations Relief and Works Agency (UNRWA) which continues up to the present day the organisation providing selected basic services to a proportion of the families living in these communities
I
One ~ould have thought that the fact these villages are located in the
central area of the West Bank would mean that they are relatively more developed I than the villages of the lenin district in the north for instance In fact these villages strike one as being as deprived as are the villages in other West Bank districts certainly in terms of the availability and quality of basic services within communities even in central villages While the large majority of the villages in this survey have a piped water supply electricity and probably better transportation access to the urban centre they nevertheless continue to lack most other basic services including the absence of telephone connections in the typical hinterland fashion
i
II
Study of 23 Villages in the Central District 6
With the main road at the entrance of each of these villages paved other roads remain largely unpaved Houses are clustered in the typical West Bank highland fashion with the central part of town occupied by older stone houses where older households live and the peripheral areas occupied by r
I
newly built houses occupied by younger couples Houses built out of concrete are found relatively rarely in the original central parts of villages increasing in number as one moves towards the periphery of the village
I While these villages used to rely mainly on agriculture as a main mode of
subsistence even in the recent past today agriculture does not contribute much to the communal income The large majority of males are wage workers It i~ believed that over 90 percent of those workers used to work
I
inside Israel or in Israeli settlements built on village confiscated land As is the case with other border villages especially and with the West Bank as a whole economic hardship hit these villages in unprecedented ways following
I
the Gulf War and the subsequent closure of Israel to Palestinian wage labour As a result these communities have become impoverished during the past 3-4 years Indeed the sudden change in the financial status of families is evident with clear past indicators of wealth juxtaposed next to the present reality of financial difficulty well built stone houses containing families presently unable to make ends meet In this most recent economic period the class and financial homogenisation that resulted from wage labour in Israel appears to be disappearing and an increasing gulf between rich and poor within communities is reappearing in some areas there are increasing signs of dire poverty iI
I During the period of the Uprising (also known as the Intifada a popular
uprising of the Palestinian people against military occupation that began in December 187) almost all of these villages maintained a high level of political acti~ity and resistance perhaps partially due to the nearby presence of settlers and in response to the continual land confiscation that the Israeli occupation authorities required to pursue its settlement policy In some communities) such as Beit Sira the settlement literally faces the village the
I
two opposing communities divided only by a small road Womens committees were also very active in this region before and during the period
I I
i I
Study of 23 Villages in the Central District 7
I of the Uprising Today however the level of political activity in these
ber communities has been dramatically reduced as is the case in the other areas mk of the West Bank
i me by Although these villages are located close to the Ramallah urban area they ete in fact score low on virtually every indicator of service provision and mg development Despite differences among the different catchment areas and
between central and peripheral villages of the central region one can only describe these communities as under-developed and deprived Schools are
of extremely badly maintained badly equipped and often too crowded There lte are a few maternal and child health clinics that used to be operated by the ige Israeli occupation authorities and which have been handed over to the new irk Palestinian National Authority (PNA) These clinics have suffered the years
IS of deprivation under military control only to be handed over to the PNA in a I
~ a state that requires major effort and funds to improve them Some private I
ng clinics exist in these communities while others are operated by local and If international non-governmental organisations This however hardly fulfils 1-4 the basic need that exists There are extremely limited services for pre-school It children and the situation is even worse for disabled children While some of youth and sport clubs are located in central villages the peripheral villages in ly catchment areas lack any such centres of activity whatsoever Overall the ad situation i~ these villages is not dramatically different from that of the Jenin to Area villages or in fact other rural areas of the West Bank
iIn I re I I
22 Survey Methodology ar
IIII As is the case with the other CBR projects the survey questionnaire
of comprised i two parts one pertaining to all households within the 23 communities and another pertaining to the disabled their problems an
~li assessment i of their abilities to cope with daily life and an assessment of their
Ie relative integration into societal activities The field work was completed
Ie during the latter part of 1993 and during 1994 At the end of the survey s period the CBR workers already had basic data pertaining to the disabled at
d hand that allowed them to launch the project immediately without delay
II
I
II
8 [ Study of 23 Villages in the Central District
I Becaus1e of logistic problems it was not possible for the survey team to
compile information pertaining to all the households in the communities although it was possible to interview almost all of the disabled and gather the needed information about their indivdual situations needs and problems
I
The information obtained from the survey was coded to prepare it to be processed by computer The Standard Package for the Social Sciences (SPSS) statistical analysis package was then used to analyse the data The statistical results were then combined with the narrative report of the workers and supervisors in order to prepare this report
I
For the purpose of analysis and representing the general geographic service and socio-economic relationships among the different communities the 23 villages were divided into three catchment areas each catchment area including a central village where the transport telephone and service network services the other communities within the catchment area The name of the central village has been used to represent the catchment area Thus the Beit Ur al-Tahta catchment area included Beit Sira al-Tireh Saffa Beit Ur alshyFoqa Beit Liqia and Kharbathat Misbah Nilins catchment area included Qibia al-Midieh Budrus and Shubtin Kharbathat Bani Hariths catchment area included Ras Karkar Deir Qaddis Bilin Kufr Nimeh Beit Nuba Deir Ammar Deir Ibzi al-Janieh Beit Illu and Jammalah
9
r trict
m to ties ~ the
o be )55)
tical and
hie ies uea -ork the Beit alshyded lent )eir
Study of 23Villages in the Central District
I
I I I
30 GENERAL DESCRIPTION OF SURVEY POPULATION
I
31 Estimates of Population Size and Rate ofi
Disability I
i Due tb logistic problems associated with entering and surveying all the
households in the survey area it is impossible to accurately ascertain the size of the population and the overall percentage of disability found in these 23 communities What can be ascertained is that there are at least 1056 disabled people in these communities that require some sort of rehabilitation assistance as it was reasonably well established that the survey team obtained
I
basic and reliable information about almost all of the disabled people living in these conkIunities but not all the households What can be said about the population is equivocal the field workers succeeded in surveying 4793 households which did not include all the households where disabled people live That] is while information related to disabled people is almost complete
I
information pertaining to their households is not However it was possible to calculate the average family size for the surveyed households found to be 69 persons per household
I
I
To e~timate population size we examined the community based I
rehabilitation programme records These indicated that there are 5255 families registered as having been contacted by the CBRproject and living in these communities However the Health Development Information Project
J I i
I
i I
I I
10 Study of 23 Villages in the Central District
I estimates the population in these villages to be around 40000 persons
I
therefore we have estimated that the CBR project succeeded in reaching about 80 percent of the households found in these communities and the majority of disabled community members who require rehabilitation services Based on HDIPs estimation of population it is reasonable to conclude that the rate of disability in this community is around 26 percent of the total population
I
I 32 Distribution of Population by Origin
I
I The population in these villages was found to be mostly homogenous
with the majority of the population - 87 percent - composed of original inhabitants and the remaining 13 percent holding refugee status (See Appendix I) The percentage of refugees in all three catchment areas were similar making up 14 percent of the Beit Ur Catchment Area and 12 percent in both the Nilin and Kharbatha catchment areas The majority of these villages are located close to the 1948 armistice line Many lived in the villages where they still live today but their agricultural land became part of the State of Israel in the post-1948 period Those were granted refugee or semi refugee status by the United Nations Relief and Works Agency (UNRWA) as they had technically lost their livelihood andor their homes
I
with their land being on one side of the border and domicile on the other This explains the presence of the relatively large proportion of refugees in some of these villages 6 percent of the population in Ras Karkar 5 percent in Deir Qaddis 18 percent in Nilin 9 percent in Beit Sira 75 percent in al-
I
Tireh 9 percent in Satta 12 percent in Beit Ur al-Tahta 8 percent in Beit Liqia 100 percent in Beit Nuba 53 percent in Deir Ammar 56 percent in Budrus 8 percent in Beit Illu 6 percent in Kharbathat Bani Hareth and 7 percent in Kharbathat Misbah Note however that the percentage of refugees
I
I i
1 Barghouthi M and Daibes 1 Infrastructure and Health Services in the West
Bank Guidelines for Health Care Planning the Health Development Information Project Ramallah 1993 pp314-316
11 rict
1S1
lout yof l on ~ of
iUS
nal See ere ent ese the of or
ICY
es er in
ent alshyieit in
i 7 ~es
est
ion
Study of 23 V~llages in the Central District
I I
in the area las a whole is close to the percentage found for the lenin area villages - 1~ percent - the focus of a similar study- to this in 1992-93 and
where a CBR project is in full operation today However this is a considerably lower proportion of refugees than figures cited for the West Bank Oust over one quarter of the population) and the Gaza Strip (roughly two-thirds of the populatiom This is because generally speaking refugees
tend to live] in concentrations within refugee camps and only a relatively small proportion were settled in the urban and rural communities of the area
I I
Population origin and refugee status are significant factors in the initiation and operation of a community based rehabilitation programme for disabled people in that those holding refugee status and their families have access to UNRWA services - especially health educational and social
I
services - that are crucial for the viability of rehabilitation within the community iIt should be noted that UNRWA services are free of charge are able to reach all refugees and are often more developed than those offered by the governmental sector This is understandable in view of the years of military rule and the associated neglect of the public sector that has taken
I
place since 1967 In areas where there are no refugees the population has had to rely on severely curtailed governmental services and on the expanding nationalist iNG04 service delivery system Although this NGO network did
succeed in ideveloping an infrastructure of services a new rather well developed and appropriate approach to service provision and an infrastructure of resistance to occupation it has not and could not have been able to fulfil the needs everywhere particularly in remote and rural
I
i
2 Giacamari R and Jarrar A A Study of 22 Palestinian Villages in the Jenin
District with Special Reference to the Needs of Persons with DisabilitiesThe Northern Regional Committee for Rehabilitation 1994 p14 Henceforth called the Jenin Study
3 Heiberg M and Ovensen eds Palestinian Society in Gaza West Bank and I
Arab East Jerusalem A Survey of Living Conditions FAFO- Report 151 May 1993 p360 Henceforth called FAFO Survey
4 Non-Govemmental Organisation
Study of 23 Villages in the Central District12
cornmunmes because of its nature limitations of finances and context Thus although the central area of the West Bank is known to be privileged to have a network ofPalestinian NGO services focusing on rural areas it is important to note that areas such as the communities that we have studied continue to be deprived 1 of basic services This is a result of the fact that few of the central area services are adequately linked to rural communities with the needed infrastructure including referral procedures This is important in that the success or failure of the CBR programme will also depend on the ability of the programme to link with existing communities basic services or to develop them where absent
I
I I
33 Distribution of Population by Gender
I The overall ratio of males to females in the study population was found to
be almost as expected world-wide with 499 percent of the population composed of females These results are very close to those obtained in the FAFOs Palestinian Society in Gaza West Bank and Arab Jerusalem A Survey of Living Conditions where adult females over the age of 15 years composed 50 percent of the population However theFAFO study also noted a slight over-representation of males in the ages 60 years or alders while an
analysis of PAFO infant mortality data also indicates a slight overshyrepresentation of males in the infant and early childhood years This
information indicates that despite an overall gender distribution that is almost equal in these villages discrimination against women and girls leading to premature death relative to males cannot be ruled out but cannot be ascertained either However the FAFO results draw attention to undue female infant death as well as the premature death of women in older age relative to imen in the same age category This is important as we have
i
I S FAFO Survey opcit pp44-45 See original footnote for complete reference
i i
6 This analysis of infant mortality differences by sex was conducted by Rita
Giacaman utilizing the PAPO Survey data set
13
i
II
II
II
I Study of 23 Villages in the Central District
II
I hus we ant ~ to the the hat ity to
consistently observed the presence of a higher number of males with disabilities in comparison to females as the CBR projects continue to encompass new areas and as communities continue to be surveyed Such results indicate a need to pay special attention to women girls and especially disabled females when operating community based rehabilitation projects
34 Household Size
i The average household size within the overall survey population was
found to be a somewhat surprising high of 69 persons compared to 65 persons per household for the lenin district villages7 As with the lenin
j
to peripheral ones with an average of 66 members in central village families
Nilinvillages the central villages of Kharbathat Bani Hareth and Beit Ur al-Tahta found to have relatively smaller family size than the were a
on
settingexposed-I
and 7 members in peripheral village families perhaps an indication of the he within which central village members live relative to more A peripheral ones
lfS
ed It is I
generally assumed that northern area rural communities tend to be an more under-developed than central area ones mostly because the central area er- of the West Bank offers the possibilities of access to a variety of services lIS including educational and health institutions Within the context of this )st assumption one would have expected smaller family sizes for central area 1to villages as family size is often linked to general exposure improved
1ij
be ue e ve
Ieducational levels and general state of including access to services However it appears that such assumptions are
development within communities
not corroborated by the results of this study Field workers through observation d~ring the period of research in the villages and presently as
I 7 Jenin Study lopcit p15 See original footnote for complete reference
II
8 Exposed in~ this context means a proximity to urban life and its associated
lifestyles and ways of thinking iIi
1
Study of 23 Villages in the Central District 14
they are launching the project have come to believe that despite the I
proximity of these central area villages to main town centres and an abundance of services accessibility continues to be a major problem Clearly the scope of this study does not allow for an adequate explanation of this larger-than-expected family size in these villages although we have discussed the relationship between family size and educational level at a later stage in this report
I
Comparing family sizes in the different catchment areas with the average number ofchildren per household revealed the following
I TABLE 1 I
I Average Household Size and Number of Children by Catchment Area
I
Beit fUr al-Tahta Nilin Kharbatha
I
Average number of household member
i
7 65 71
Average number of 33 35 36 children
As the table above indicates the catchment area with the largest family size Kharbathat Bani Hareth with 71 persons per family is also the area with the largest number of children 36 However this tendency of higher family size and a higher number of children does not surface in the other catchment areas with Nilin having the lowest household size but not the lowest average number of children and with Beit Dr having a family size of
i
9 Kharbathat Bani Hareth has been shortened toKharbatha here and in future
tables
15
iI
I
II
Study of 23 Villages in the Central District strict
IiI
7 - almost that of Kharbatha - but the lowest average number of children One d an the
possible explanation of these results could be the presence of a larger arly proportion of extended families in Beit Ur when compared with the other f this catchment areas and higher fertility in Kharbathat relative to the other areas issed ge in
erage
lffiily area igher other Jt the ize of
future
16 Study of 23 Villages in the Central District
I
I
40 SOCIO-ECONOMIC STATUS OF SURVEY POPITLATION
I The sobo-economic status of the communities surveyed was examined
utilising selected socio-economic indicators including work and educational patterns of male and female heads of households crowding rates home
I
ownership I house type and wealth status Wealth status of individual households i was then cross-tabulated with various indicators to examine the relationships of the different indicators to each other I
I
I 41 Work Patterns amongst Household Heads
i
I Of the4793 surveyed households 8 percent reported that no one in their
household i
I
was working at the time of the survey in contrast to a high of 12 percent that was reported for the Jenin area villages Comparison of the two
I populations should be approached with caution as the two studies were conducted I a year apart from each other However this data suggests a lower rate of unemployment in the central area villages relative to the Jenin district It could be argued that the central area of the West Bank offers more work opportunities for labourers within the West Bank relative to the Jenin district and therefore relieves some of the economic tensions arising from the closure of Jerusalem and the consequent sudden isolation of many wage workers from their livelihood in Israel
i i
10 Jenin Study opcit p18 See original footnote for complete reference
17
r strict
nined tional home idual ie the
their of 12 e two
were lower strict work istrict osure from
I Study of 23 YiIIages in the Central District
I
I Among the adult male heads of households surveyed a high of 59 percent
worked as iwage labourers in an unskilled and semi-skilled capacity only 7 percent reported that they were farmers 16 percent worked as white collar workers or in unemployed at study where a
I indicating that continues to
a private capacity and 18 percent reported that they were the time of the survey These results contrast with the lenin
high of 18 percentreported that they worked in farming11
the economic base of the communities in the lenin Region include agriculture as an important source of income and
livelihood while in the central area communities wage labour predominates as a primary mode of income generation There were no appreciable differences in work patterns among the different catchment areas nor between central and peripheral villages Thus overall it appears that farming composed a very small proportion of the activities and livelihood of all 23 communities regardless of location or linkage to their central village and that on the whole these are communities of primarily wage labourers who seek work either in the urban areas of the West Bank or in Israel and who minimally rely on other modes of generating income within their communities
Examining patterns of work for female household heads we found that as expected the majority of female heads reported not working at all for pay rather working as full time home-makers while 4 percent reported that they worked part time or during their leisure time on knitting andlor embroidery
I earning some income this way The rest - 1 percent - worked in farming or as unskilled Iabourers Again comparisons with the Jenin villages are important in that IiI percent of the Jenin female heads of households reported that they worked as
farmers These results reinforce the notion that the Jenin villages
rely on farming and agricultural production as a relatively important mode of earning income in contrast to the central area villages which appear to have moved more substantially into wage labour in the West Bank and Israeli
Imarkets I
I
I 11 Jenin Study opcit ppl8-19 See original footnote for complete reference
Study of 23 Villages in the Central District 18
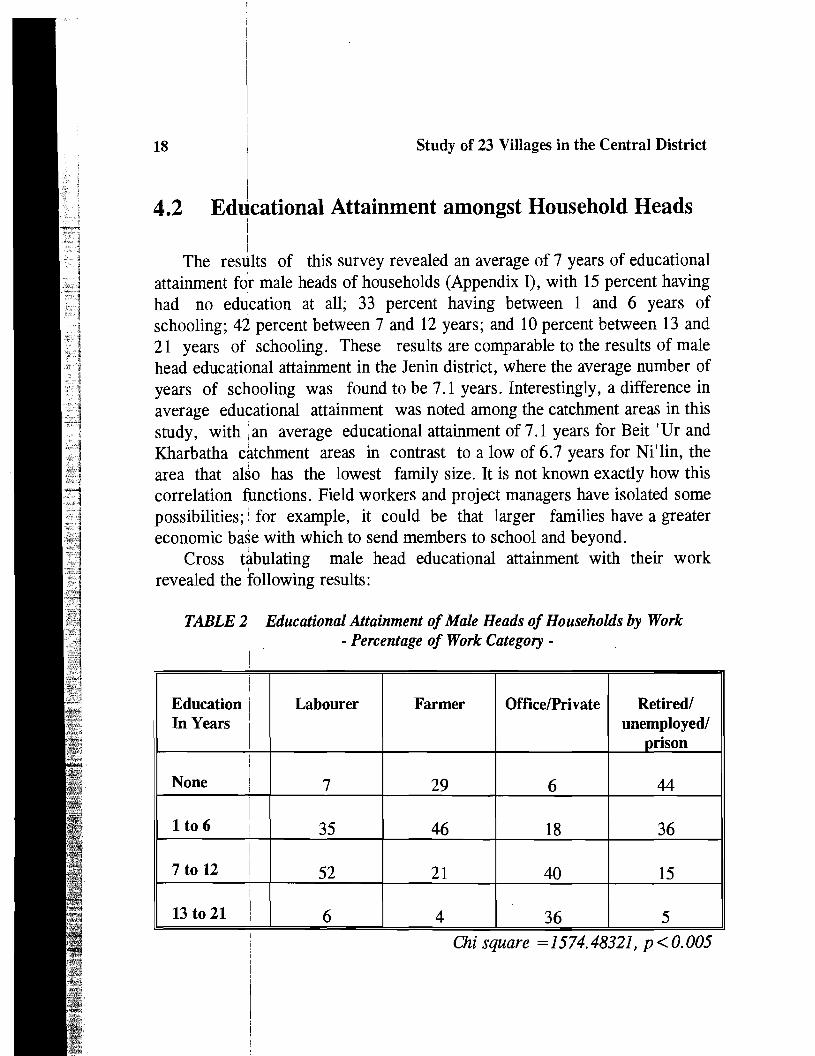
42 Educational Attainment amongst Household Heads i II
The results of this survey revealed an average of 7 years of educational attainment for male heads of households (Appendix I) with 15 percent having had no education at all 33 percent having between 1 and 6 years of schooling 42 percent between 7 and 12 years and 10 percent between 13 and 21 years of schooling These results are comparable to the results of male head educational attainment in the Jenin district where the average number of years of schooling was found to be 71 years Interestingly a difference in average educational attainment was noted among the catchment areas in this study with i an average educational attainment of 71 years for Beit I Urand Kharbatha catchment areas in contrast to a low of 67 years for Nilin the area that also has the lowest family size It is not known exactly how this correlation functions Field workers and project managers have isolated some
I
possibilities i for example it could be that larger families have a greater economic base with which to send members to school and beyond
Cross tabulating male head educational attainment with their work I
revealed the following results I
TABLE 2iI EducationalAttainment of Male Heads of Households by Work I - Percentage of Work Category shy
Education In Years
I
Labourer Farmer OfficelPrivate Retired unemployed
orison I
None I I 7 29 6 44 1
I
1 to 6 I 35 46 18 36
7 to 12 I 52 21 40 15 I
I
13 to 21 I 6 4 36 5
Chi square =1574 48321 P lt0005
19 ct
al 19 )f ld le )f n LS
d le lS
le r
k
Study of 23 Vnlages in the Central District
Labourer Farmer I
Yea-s d Eduabn by ~ercertage Yea-s d Eduabn by Percertage
il1tosli
~----I
71012
RetiredlUnempoyedlPrison YeCls d Eduabn by Percertage YeCls d Eduabn by Percertage
~-I
I
I36D1 i i
71012
I~
I Note thatthe table indicates that the highest proportion of those who have
no education at all are in the category of retiredunemployed with 44 percent having no education at all in contrast to 7 percent for labourers and 6 percent for officeprivate work respectively and 29 percent for farmers Given that it is known that many of those who work in farming are in fact
I
older it appears that those with minimal education represent the older generation and that educational attainment has gradually improved in recent years These results are consistent with the FAFO study results on
i i
I
OfficelPrivate
Study of 23 Villages in the Central District 20
educational patterns over time and relevant to both the West Bank and Gaza Stripl
Cross-tabulating educational attainment and type of work also shows a significant association with 55 percent of those who have a post high school education working in white collar jobs or privately in contrast to 34 percent of those with the same educational attainment who work as labourers and 4 percent among farmers (Chi square = 157448321 plt0005) Although a statistically significant association it is important to note that while education might determine type of work education itself is often found to be dependent on wealth status That is as an intermediate variable education can operate on its own determining type of work but educations influence on type of work can also be a reflection of class or wealth category We will have a chance to examine the relationship of work education and wealth at a later stage in this report
I Examining the relationship of educational attainment to the location of
these communities - central versus peripheral villages - as a measure of accessibility to services we found a significant relationship noting a better educational attainment of male heads of central villages relative to peripheral ones Specifically we found that 14 percent of central area village male heads of households stating that they had no education at all in contrast to 15 percent in peripheral villages - probably older people and reflecting the past rather than the present 27 percent having between 1 and 6 years of schooling in central villages in contrast to 34 percent in peripheral villages 47 percent having between 7 and 12 years of schooling in central villages in contrast to 41 percent in peripheral villages and 12 percent having more than 12 years of schooling in central villages relative to 10 percent in peripheral villages (Chi square = 1869292 P = lt 0005)
f
II
IIII
12 FAFO Survey opcit pp136-137 See original footnote for complete reference
rict Study of 23 Vlllages in the Central District 21 i
iaza
EducabnalAttairmeri ci Male Heeds Percertage ci vilIage bcation category
solIS a Legnd
1001 [Iill Periiral
cent CS1tralD40Id 4 zh e
tion 30 Ient rate e of 20
ve a ater
10
n of o
-middot middot middot
e of ~tter
eral I ads These tesults indicate that access to educational facilities in central ) 15 villages is superior to peripheral ones particularly as students approach past secondary school and university age Indeed these central villages do house
of secondary schools that cater to the needs of not only the students of their es village but I the students of nearby villages as well However difficulties in in i transport and having to move from one village to another for schooling shyhan i I
mostly secondary - appears to have a negative impact on educational eral I attainment Ireinforcing existing notions of the need to have services
accessible and within communities for effective provision and universal
I access
I As expected female heads of households were found to have considerablyI I lower education than their husbands with a mean of 42 years for females in tbull contrast to I 7 years for males This is surprising in that the average
co--shy
--0shyII bull
~H~
m1
m
II bullbull
II iiii
m
~ - I middot1 middot I I H middot
bull II I II bull
I
I I I I N01e 1-6 ~alS 7-12YEaS 12+~ars
Educaticnal Ala rrrent
educationalIce i t 4
if
iattainment for female house heads of the lenin district was found i
I i
Study of 23 Villages in the Central District 22 I I I
to be 47 yeats 13 These results continue to reinforce the need to raise
questions regarding the prevailing assumptions that central area villages are advantaged in terms of service provision and relative to the north or the south of the West Bank These results unfortunately suggest that despite the
I
relative abundance of general services including education health and transport in the central area such services do not appear to affect the rural communities concentrated as they are in the towns and leaving rural communities in a more under-developed state than is generally assumed
We found Ia significant association between female heads of households educational attainment and where these women live where once again the Nilin catchment area women fare worse than the others
i
TABLE 3 Educational Attainment of Female Heads of Households
I by Catchment Area I - Percentage of Catchment Area Category-
I
Educational IJevel I
in Years I
None
1-6
7-12
13-16
I
BeitDr Nilin Kharbatha
38 43 39
30 35 31
30 20 27
2 2 3
Chi Square =3477647 p= lt0005
i
13 Jenin Study opcit p24 See original footnote for complete reference
23 ict
rse
ire ith he nd ral ral
Is he
J5
Study of 23 Villages in the Central District
I The above table demonstrates that the highest percentage of female heads
of households is found in the Nilin area with 43 percent having had no education at all in contrast to 39 percent for Kharbatha and 38 percent for Beit Ur Similarly only 20 percent of Nilins female heads have had between 7 and 12 years of schooling in contrast to 27 percent for Kharbatha and 30 percent for Beit Ur While it is clear from these and earlier results in this study that the Ni lin area stands out one cannot conclude from this data that the educational levels of Nilin are inferior to the other catchment areas
This is because this data on education pertains only to female heads of households land does not include information pertaining to all ages As it stands it would be safe to state that in comparison with the educational status
of women of similar social standing - ie other female heads - the data suggests that the Nilin catchment area lags behind the others In this sense a picture begins to emerge where the Nilin area can be seen as a priority area for the activities of the central area CBR project
I i Educatonal Anairmert of Ferrale Heads I Percenta9= ri Ccichmert Area CaEgJry
50-+--------------- shy
0 Ho6
g 7to 12
D 1310 16 NflinEilitUr
20
30 -t---------gt r--=------t~ur1----
40-+---------il~-------
Le~nd
m Nme
I I
24 Study of 23 Villages in the Central District
I I
Examining the educational attainment of female heads of households in relation to i whether their domicile is in a central or peripheral village we
I
found that as is the case with male heads central village female heads have a significantly higher educational attainment than peripheral village ones with 35 percent of central area women having no education at all in contrast to 41 percent in peripheral villages and 29 percent of central area villages having I had between 7 and 12 years of schooling in contrast to 27 percent among peripheral village ones (Chi square = 1021184 p=0016) This relationship I
Iis weaker than the relationship between education and catchment area In addition it must be remembered that the overall level of educational I attainment for the central area female heads of households is considerably ilow That is although we note differences in locales in general terms all of the women heads of households in the central area appear to be educationally compromised relative to other areas I
IFerrale Hwsehecd Educational Attairment j
I Percentage ~ Village LocafQ1 f50i-T---------------r-------_~
40-t------
304-----
20+------
10+---shy
0+----shy
Le~nd
o R1ripreral A IIa~s
o Caltral Allage
middot bullbull I bullbullbullbullbullmiddot
bull I I bullbull I bull I bull
Ncne
-middot middot middot middot middot middot middot bull bullbull bull I bullbull --~-middot middot middot middot middot middot middot
~---~-----~--middot bull bullbullbull I bullbullbullbull middot bullbull bull bullbullbull bull I
I bullbullbullbullbullbullbull bull bull I bullbullbullbullbullbullmiddot middot middot middot middot middot middot
--------L--~---middot middot
YearsofEtlucaticn
Overall idata on educational attainment of both male and female heads of households indicate a relative deprivation in the Nilin catchment area and
25 rict
~m
we e a ith 41
mg mg hip In
nal bly of
Illy
I I I
I
I Study of 23 Villages in the Central District
peripheral areas relative to central ones This alerts the CBR project to the need to pay I a special attention to these deprived areas as education is so often shown t to be an important determinant of the health and well being of the family particularly the health and well being of disabled family members
I 43 Home Ownership Patterns
Consistent with what is normally found in villages in the West Bank this survey demonstrates that the large majority of inhabitants own their homes Specifically lit was found that 95 percent of the surveyed families owned their homes 14 percent rented them and 1 percent lived in homes owned by their extend~d families (Appendix I) This contrasts with the FAFO data that indicates thatl 26 probably reflecting villages 14 I
I
I 100
percent of the homes included in their survey were rented a considerably higher rate of home rentals in towns than
CentrallyeneaHome ONnershp Patterns Otvnership Categcry bfPercentlge
80 -
-60
40 -
20 -
o HOllEOMer Tenlllnl
OM-erSlip Ca1egcry
Farril)ltlMlef torre i
14 FAFO Survey opcit pp131-154 See original footnote for complete i
reference II
i
of nd
Study of 23 Villages in the Central District26
Examining home ownership by catchment area we found very similar results with 194 percent home ownership for Nilin 95 percent for Beit Ur and 97 percent for Kharbatha (Appendices lIA lIB and lIC) An interesting
I
finding was made when comparing home ownership between central and peripheral villages We found that 8 percent of the homes in central village were rented I in contrast to 36 percent of homes in peripheral villages (Chi square =3286540 p= lt0000) Note that in the lenin district villages no observable differences in home ownership patterns were noted between central and peripheral villages 15 If home rentals is one of the measures of
community d~velopment including the opening up to people from outside the community the presence of market and other such relations then these reinforce the notion that central area villages are more developed communities (With a relatively increased access to the outside world possibly in the initial phases of urhanisation
I I
44 crOlding Rates Ii
Overall ~3 percent of the surveyed houses had 1-2 rooms and 47 I
percent had between 3 and 8 rooms The mean was 26 rooms per household lower than the average of 3 rooms per household for Jenin
I I
While the lenin study showed minimal differences in the number of rooms per household among the different catchment areas substantial differences were noted in this survey Specifically we found that while 48 percent of the houses in the I Beit Ur catchment area had 1-2 rooms 53 percent of the houses in Kharbatha and a high of 61 percent of the houses in the Nilin catchment area lhad the same number
I
I I
15 Jenin Studyopcit p26 See original footnote for complete reference
16 Jenin Study lOp cit p26 See original footnote for complete reference
27
Study of 23 Villages in the Central Districttrict ~ I
i
nilar IU r sting and Ilage (Chi no veen ~s of
~ the hese
I
bullbullbullbullbullbullbullbull I bull I bullbullbullbullbullbullbullbullbullbullbull I bullbullbullbullbullbull I bullbullbullbullbullbullbullbullbullbullbullbullbullbullbullbullbullbullbullbullbullbullibly t bull bull bull bull bull bull bull bull bull bull bull bullbullbullbull I bullbullbull
Central Plea CrONding Rates Percerra ge a f house size by rooms
[1-2 roomsll 530
[ bullbullbull bull
I------- f
~--0 - bullbullbullbullbullbullbullbullbullbullbullbullbullbullbullbullbull I bullbullbullbullbullbullbullbullbullbullbull I bullbullbull
bull bull bull bull I bull I bullbullbullbullbullbullbullbullbullbullbullbullbullbullbull I bullbullbullbullbull I bull I bull ~ iped
----gt-gt-- 3-8 rooms -------bullbullbullbullbullbullbullbullbullbullbullbullbullbullbullbull 470 bullbullbullbullbullbullbullbullbullbullbullbullbullbullbullbull
~ ~ ~ ~
bullbullbull bullbull bullbullbullbullbullbullbullbullbullbullbullbullbullbull bullbullbullbullbullbullbull Ymiddot
~ ImiddotmiddotmiddotmiddotI- ~~~~r
Crowding by Catchment Area 147 I Percenla ge a f houses wi1h 1-2 rooms
old
Jms Ices
Il -r---- shy
- - shy iii--shy
-+shy
c-shy itl- r
4J
1the
3)
the I J)lin
1~ i
d Ktaibatla Nlin
Catdme rt area Bert LX
Dividing the total number of persons living in a household by the total number of rooms - to obtain crowding rates - revealed that overall 38
28 Study of 23 Villages in the Central District
I percent of the surveyed households had a crowding rate of 1-2 persons per
I
room 29 ipercent a rate of between 21 and 3 and 33 percent had a rate of between ~I and 18 persons per room In contrast 50 percent of the households in the lenin villages had a crowding rate of 1-2 persons per room 38 percent with a crowding rate of between 21 and 4 and a low of 12 percent with between 41 and 12 persons per room 17 Clearly central area families
live in more overcrowded houses than those in the lenin district villagesI
CrOdin~ Rates by Region CrQvdng Rates by Region I Jen~-rea Central gtlea
~ ~ ~~-(thTI2IT]rt~~ middotmiddot)middotn~middotgt
middotiiiimiddot~jliiiiimiddot [1
ji1=1BOl L230~J
These results once again point to the need be very careful about prevailing i assumptions of states of development and also alert us to the need
I
to take into consideration the importance of the urban versus the rural setting when studying the socio-economic status of the Palestinian communities in different regions
I Crowding rates differed significantly between the three catchment areas
I 17 Jenin Study opcit p26 See original footnote for complete reference
29 trict
s per te of 0 the
raquoom rcent lilies
gion
about
i ~eed i~till ues ill
eas
Study of 23 Villages in the Central District I
I
I TABLE 4
Crowding Rates by Catchment Area - Percentage of Catchment Area Category shy
I
Crowding Rate (personsroom) Beit Ur Nilin Kharbatha
1-2 41 37 35
21-3 27 28 31
31-18 32 35 34
Chi square =1373177 p=O008
The above table demonstrates that in terms of crowding rates Beit Dr catchment area fares best with 41 percent of the households having a crowding rate of 1-2 persons per room and with 32 percent of the households having between 31 and 18 persons per room Kharbatha and Nilin appear to be similar with 35 percent and 37 percent of households with 1-2 persons per room and 34 percent and 35 percent with between 31 and 18 persons per room respectively Thus although Nilin had the lowest average total number of rooms in its households when compared with the other two areas its crowding rate becomes about the same as for Kharbatha area because of its lower family size It should be mentioned here that there were no differences in crowding rates between central and peripheral villages
I
I
I i I
I
I
I
I
Ibullbull
Ibull l i i i 1middot
30 Study of 23 Villages in the Central District
I
~rowding Rates by Catchrrent Plea I ~~~~cl~~~~h~
I 00
If
10
Legml
II 10-20o o 21-30Nllin lthartetha o 31-180CatchmertArea
I
I45 Wealth Status
I The assessment of wealth status for these communities relative to each
other was completed by the field workersrehabilitation workers This took place by categorising a number of factors that are locally thought to be indicators of wealth Those included the amount of land owned by the family the I type of house that they live in including the materials used to build the house the total number of rooms in the house and furniture fixtures and any electrical equipment that the family owns
An exiination of the data pertaining to wealthstatus revealed that 13 percent of Ithe surveyed households were doing well by local standards 46 percent were barely managing and 41 percent are unable to manage Regional
BeiUr
-----
I
rict Study of 23iillages in the Central District 31
variations Jere noted where once again the Nilin catchment area fared less 1
well than the other two areas we found that 13 percent of the Beit Dr and 13 percent of the Kharbatha households were doing well in contrast to 9 percent in the Nilin catchment area while 40 percent of households in Beit Ur and 411 percent in Kharbatha were unable to manage in contrast to 47
I
percent among Nilin households (Chi square = 2078826 p= lt0005) The differences in wealth status between central and peripheral villages were also significant ~lthough less pronounced 10 percent doing well in the central villages in contrast to 13 percent in peripheral ones and 44 percent unable to manage in tentral area villages in contrast to 41 percent in peripheral ones18
(Chi square r704642 p=O029)
W3alth Status by Areas and Location Percertage of Wealth Category
5O-ri--------------------- shy
I
----I40
3Ol ----II bull II
bull
I
--~20- -
10 shy shy __-=-ach ook ) be the Ctntral
d to ure
t 13 46 IX Note that peripheral area anal
I
1 ] middot middot middotmiddot middotmiddotmiddot middot middot middot middot middot middot middot middot middot middot middot middot middot middot middot middot middot
Legnd
Ii DdnglJlkllt3 Barely Mtraging
1- 0 UrabletoMmcgew
1-
D1-----1
middot middot middot middot middot middot middot middot middot middotmiddotmiddot middot middot
middot middot middot middot middot middot Feuroripreral IltharlBtra Cctctllrent JlrEBIlocction
ampit Ur Nrlin
communities seem to be doing slightly better on the
wealth status scale than central area ones These results remain unexplainedI 1
i
I I
I ~
I
32 i Study of 23 Villages in the Central District
I On the lwhole however while all households that are categorised as
I
unable to manage require the special attention of the CBR projects Nilin appears to he even more of a priority than the other catchment areas I
Jespecially as poverty can have a negative impact on the outcome of disability i
in these communities t I Ii ~
Looking [at the relationship of wealth to the educational status of male and female heads of households we found a significant and strong association
I
hetween the two variables with increasing educational status with wealth II I
- Percentage of Wealth Category -
I
I Doing well Barely managing Unable to manage I
No educatioh at all 8 11 22
1-6 years 31 34 33
7-12 years 46 43 37 I I
13-21 years I 15 12 8
Chi square = J48 84665 J = lt 0005
I
IiTABLE 5
Education of Male Heads of Households by Wealth Status
I
The above table clearly shows that the more educated male heads of households ~re also the wealthier with 8 percent of those who are doing well with no education at all in contrast to 11 percent among those who are harely
I
managing and a high of 22 percent among those who are unahle to manage Likewise 15 percent of those doing well have 13 or more years of schooling in contrast to 12 percent among those who are barely managing and 8 percent
I
among those who are unable to manage i
33
05
t
as In
s ty
ld m
mge
of ell ly ~e
i I
I I
Studv of 23 Villages in the Central District
Education and Vlealth Status of Males eo Percenlageofvkallh Category
~ i ~-l
~ co irg ell
Bcr ely rraragrg -
D U1 etJeto rrm ltg3
i ~=--i middot
middot middot middot middot -- middot middot middot middot middotmiddot middot middot
c-- middot middot middot middot middot middot middot middot middot middotmiddot - -
No edua tim
middotl4J
middot middot middot middot 3J middot middot middot middot middot middot middot middotmiddot middot middot middot middot middot middot middot 10 middot middot middot middot middot middot
middotmiddot shyo
~-shy middot middot middot middot
1 to 6~as 7 to 12 years 13 to 21 ~as
I I
Examining the relationship between educational levels of female heads of households and wealth status revealed similar results with the more educated being the wealthier 33 percent of the well off had no education at all in contrast to 46 percent among those who are unable to manage In this case 34 percent of the well off had 7-12 years of schooling in contrast to 23 percent
I
among those who are unable to manage (Chi square = 6671126 p= lt 0005) Clearly it is beyond the scope of this study to determine whether it is wealth that determines education or whether it is education that leads to the generation of a good income For the purposes of this study it is sufficient to note the relationship between these two variables highlighting their importance onthe prospects for disabled people in these communities
i I I
Attempting to assess the relationship of wealth to an indicator of good living conditions according to local standards we related the type of building materials used in the construction of a house to household wealth status We
34 I
Study of 23 Villages in the Central District
I
found thJt those who live in stone houses tended to be better off than those who live in houses made out of concrete with a total of 24 percent of the houses built with stone Forty-eight percent of the well off lived in stones houses in contrast to 24 percent of those who reported being only able to barely manage and 17 percent of those who reported being unable to manage (Chi square = 22495139 P = lt0005) It therefore appears that in these communities a relatively reliable indicator of family wealth is the material used in the construction of the familys house
Central Area Wealth Status Housebold Wea~h Stctus tyen Percent3ge
I
b middot middot middot middot middot middot middot middot middot middot middotmiddot middot middotmiddotmiddot middot middot middot
middot middot middot middot middotmiddotmiddot middot middot middot middot middot middot middot middot middot middot middot middot middot middotmiddot middot middot middot middot middotmiddot middotmiddot middot middot middot middot middot middotmiddot middot middotmiddot middot middot middot middotmiddot middot middot middot middotmiddot middotmiddot middot middot middot middot middotmiddotmiddotmiddot middot middot middot middot middot middot middotmiddot middotmiddot middot middotmiddot middot middot middotmiddot middotmiddot middot middotmiddot middot middot middotmiddotmiddotmiddot middot middotmiddotmiddot middot middotmiddot middot middotmiddot
middot middot middot I middot middot middot i middot middot middot middotmiddot middotmiddotmiddotmiddotI middot middot middot 10-shy30 middotmiddot middot middot 1 I
middot middot middot middot middot I middot middot middot middotI-shy20 middot middotmiddot middot middot middotmiddotmiddotmiddot middot middot middot middot middot middotI middot middot middotI
r
middot middot middot middot middotmiddotmiddot middotmiddot middot middot middot middotmiddot middot middot middot -shy
middot middot middotmiddot middot middot middot middotmiddot middotmiddot middotmiddotmiddot middot middot middot middot middot middot middot middot middot middot p I I I
~
Ddngwell B3rely rrBl1lging Ul1lbleto rTBncge llkath Sctus
I Likewise looking at patterns of association between wealth status and
crowding in the homes we found a strong association between the two variables with a pattern of rising crowding with decreasing wealth with 55 percent of those doing well living in homes of 1-2 persons per room in
I
contrast to 40 percent among those barely able to manage and 34 percent among those who are unable to manage Likewise a low of 20 percent of those doing
well were found to be living in homes with over 3 persons and
up to 18 per room in contrast to 27 percent among those who are barely managing and a high of 40 percent among those who are not able to manage
35 Study of 23 Villages in the Central District trict
(Chi square = 10189049 p= lt0005) Clearly the level of crowding in fthe hose
the home appears to he one of the indicators of wealth [ones I
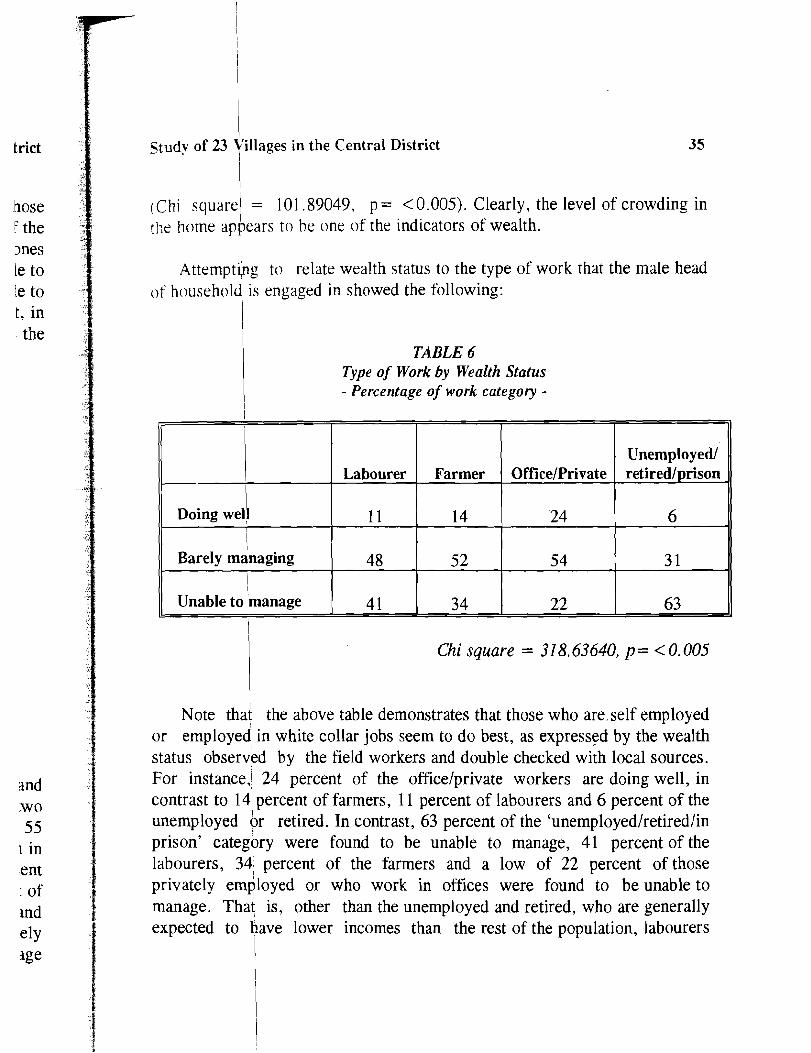
Attempting to relate wealth status to the type of work that the male head
e to le to
of household is engaged in showed the following t in the
TABLE 6 Type of Work by Wealth Status - Percentage of work category shy
Unemployed Labourer retiredprisonFarmer OfficePrivate
I
Doing wel~ 11 14 24 6 I I
Barely managing 48 3152 54 i I
Unable to manage 22 6341 34
md wo
1 in ent of md ely age
Chi square = 31863640 p= lt0005
Note that the above table demonstrates that those who are self employed or employed in white collar jobs seem to do best as expressed by the wealth status observed by the field workers and double checked with local sources For instance 24 percent of the officeprivate workers are doing well in
I
contrast to 14 percent of farmers 11 percent of labourers and 6 percent of the unemployed or retired In contrast 63 percent of the unemployedretiredin prison category were found to be unable to manage 41 percent of the labourers 34 percent of the farmers and a low of 22 percent of those privately employed or who work in offices were found to be unable to manage That is other than the unemployed and retired who are generally
I expected to have lower incomes than the rest of the population labourers
I
I
55
36 Study of 23 Villages in the Central District
I
appear to be the worst off followed hy farmers and then office workers or workers in private enterprises
I
Type of Wgtrk by Wealth StatusI
I Percertaga of Vbrllt Category 170
Leyenld
I Ddngwell00 shy
Barely rraraging~I 0j50 -
I140
0 0
130 I
120
110
~=l 1----shyo
Urabletorra~e r----c
ql l
--2C-
I 1-1 t I
I
r-
Ii shy
i i
I I
LalDurEf Farrm afmPria1e REiirEdfU1erTfledfrison lkJrk Ccteggtry
I Looking at wealth status relative to the total number of persons working
at home lindicares that the higher the number of employed household I
members the greater the likelihood of that household being able to manage and doing well
I TrtBLE 7 Wealth Status by Number of Employed per Household
I - Percentage of Number of Employed Category shy
I None working 1 working 2-5 working
I Doing well 3 12 22
Barely a61e to manage 18 47 56 i
Unable to manage 79 41 22
middot
middot middot
37 istrict
ers or
rking ehold mage
I
I Study of 23 tillages in the Central District
Chi square = 29712707 P= lt 0005
WStatus by No of Employed per Hhold of No of Bnploje d Category
I ff)l---------===--------------------
I----------------f
1-------1 middotr-----Imiddot---~middot
1--------1 bull
1 Mlkirg t-bri EmpOfgj Qie~ry
o -----YiN--r+-----~-Ib re Mlkirg
I As the above table demonstrates there is a clear pattern of increasing
wealth with the increase in the number of people working in the household with a low of 3 percent of the households with none working doing well in contrast to 12 percent with one person working and 22 percent with 2-5
I
persons working In contrast 79 percent of the households with no one working are unable to manage in contrast to 41 percent for household with one person working and a low of 22 percent for those with 2-5 persons working As i~ the case with the Jenin district villages this data indicates that household income in these communities is primarily determined by wage work rather than for instance agricultural production land ownership or
I
remittance money from abroad
I ~1-+----1
6J +-----1 I I
~I+-------1
4)1-t--------1
3Jrl------j
JJ 1
I 10---1
I I
Legrd
1m Coirgwe
8 Bcrely ITBragrg o U1lttje to JT1al~
bull bull I bull
bullbullbull r-- shy
middot middot I-~-----JmiddotmiddotmiddotmiddotL--shy
middot
38 Study of 23 Villages in the Central District
I
I
50 DESCRIPTION OF THE POPULATION OF PERSONS WITH DISABILITIES
II
I With 1956 persons with disabilities interviewed in this survey and based
on HDIPs population estimates we estimate the rate of disability in these communities I to be about 26 percent overall and within what we believe to 1 be the national average of 2-3 percent (See Appendix I) Appendices IIA to lIe also demonstrate that there were some differences in the rates of disability among the different catchment areas Note for instance that the highest rate of disability was found in the Kharbathat Bani Hareth catchment area with a total of 32 percent rate of disability in contrast to 25 for Beit Dr and a low of 21 percent for Nilin the catchment area that was found to be the most
I
socio-economically deprived in this survey Perhaps the results can be seen in terms of community deprivation leading to premature deaths among disabled people as one of the explanations for the lower rate of disability in Nilin area relative to the other areas As for the higher disability rates in Kharbatha area those remain unexplained
I
I 51 Distribution by Gender
i
I In line with the results obtained in both the Gaza Strip and lenin studies
a difference in disability rates between males and females was noted with 56 percent of the disabled in the three catchment areas being male and 44 percent female Separating the different catchment areas we note a similar pattern although the differences among the catchment areas is not statistically significant II
I I
urlct
ased hese Ie to A to iility rate
ith a low
nost n in bled area atha
lies h 56 d 44 nilar ally
39StudYof 23 Villages in the Central District bull I
I
TABLE 8 Disability by Sex and Catchment Area
- Percentage of Catchment Area Category -
Beit Ur Nilin Kharbatha
Males 55 59 55
Females 45 41 45
I Di~ability by Sex and Catchment Area
1
P ercenta ge 0 f eaten rren t Prea eategory ~
legrd
g Maes U Femaes
---Oraquoraquo---------J~~___~_____--l-~~~___J
Nlin Krartniha CaldmertArEB
ri shy~
Given t~at women in the survey population compose 499 percent of the population it
can only he concluded that the missing females have not been
included in the surveyor alternatively they may have suffered the combined effects of disability and the discrimination against women in Palestinian
I
~o Study of 23 Villages in the Central District
society leading to their premature death We will have a chance to examine the remaining data from this gender perspective later below
I
I
i I
52 Distribution by Age
I
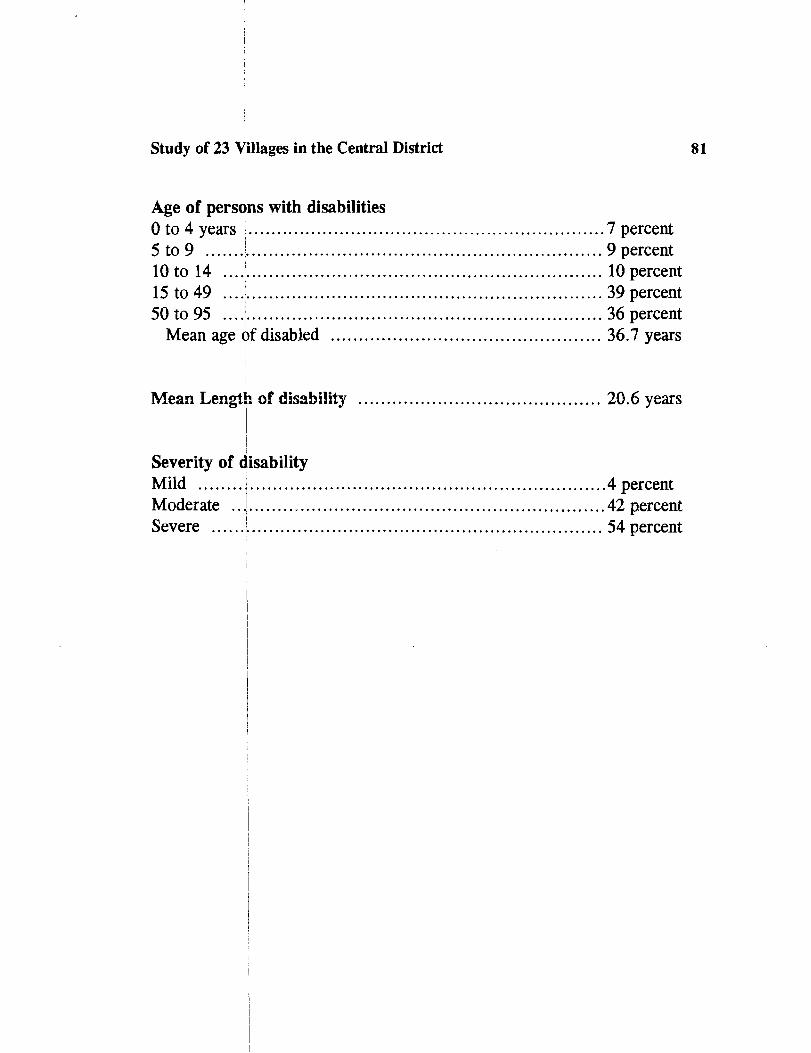
The age of persons with disabilities included in this survey ranged between a few months of age to 95 years old The mean age was found to be
I
I359 years (Appendix I) rather higher than the mean age of 296 years for the disabled of the lenin district This reflects the higher proportion of 1 older people found in this survey relative the lenin one In this survey 29 percent of the disabled were under the age of 15 35 percent were between ] the ages of 15 and 49 and a high of 36 percent were aged 50 years or older in contrast to 26 percent of the lenin district disabled being 50 years or older
I II Aga Distribution in tre Central Area I Percer1agl ci Pje Ehket
I
j I
I I I
II I I
I
I
I I
I i I
19 Jenin Study opcit p3 See original footnote for complete reference
41 StudY of 23 Villages in the Central District strict
I j
rmine Compari~g this survey data to data on age for the West Bank and Gaza Snip we find that people 65 years or older compose not more than 4-6 percent of the population 20 In contrast in this study they compose 15
percent of the population While one would expect that as mortality is reduced within any population the rate of old age disabilities rises it is not clear if these results are merely a reflection of increased longevity They could also 1 be interpreted in terms of the severity of conditions within which disabled people live leading to their early death and skewing the disability nged picture towards the normal disabilities of old age They could also reflect the to be rising problem for the aged in these communities and in the area as a whole s for resulting f~om the demographic transition where as average life expectancy m of rises special services for older people - including the fitting of hearing aids 129 and glasses - are not being implemented to cater to these newly emerging Neen needs that reflect the transition that these communities are undergoing This lder data indicates the need to look further into disability care for the elderly lder especially lif contrasted with information pertaining to disability types that will follow
While I no appreciable differences in the age distribution of disabled people was noted when comparing the different catchment areas we found significanf differences between central and peripheral locales Six percent of disabled people in central areas were found to be under the age of 15 years in contrast to 8 percent in peripheral areas 12 percent between 5-14 in the central areas in contrast to a high of 24 percent in peripheral ones 47 percent between 15-59 in central areas in contrast to 44 percent in peripheral ones an~ 35 percent of disabled people in central areas found to be 60 years of over I in contrast to 25 percent in peripheral areas (Chi square = 1900316 P lt0005) These results indicate that the rates of disabilities in
j
the age bracket of 0-4 years are about the same The differences begin to I
appear sharply in the 5-14 years bracket with double the rate of disability in I
peripheral areas than in the central ones This may suggest either that peripheral area disabled children die prematurely because of lack of assistance or that they are exposed to a disabling environment more so than disabled
i
20 FAFO Survey opcit p44 See original footnote for complete reference I I
r I
r I
Study of 23 Villages in the Central District ~2
children in the central area In the age category 15-59 years the rates of disability are about the same for central and peripheral areas However differences again begin to appear among those aged 60 years or over with 35 I percent of the central area disabled falling into this category in contrast to 25 percent among peripheral area disabled I
III
On the whole this data suggests that the CBR project needs to take into account the ispecial needs of older disabled people especially in the central
I area villagd while at the same time focusing on disability early in life I particularly ih the peripheral villages f
t I53 DUfation and Types of Disabilities II
IThe mean duration of disabilities in these communities was found to be I
20 years with 21 percent of the disabled reporting having had the disability I
for 0-4 years 17 percent for 5-9 years 23 percent for 10-19 years and a high of 39 dercent with disabilities for 20 years or more
I
Duration of Disability Percertaoe ci lgt(Je BrakEi
1D-19yw rsl
I I
I
I I
I
I
rict Study of 23 Villages in the Central District middotB i
i I
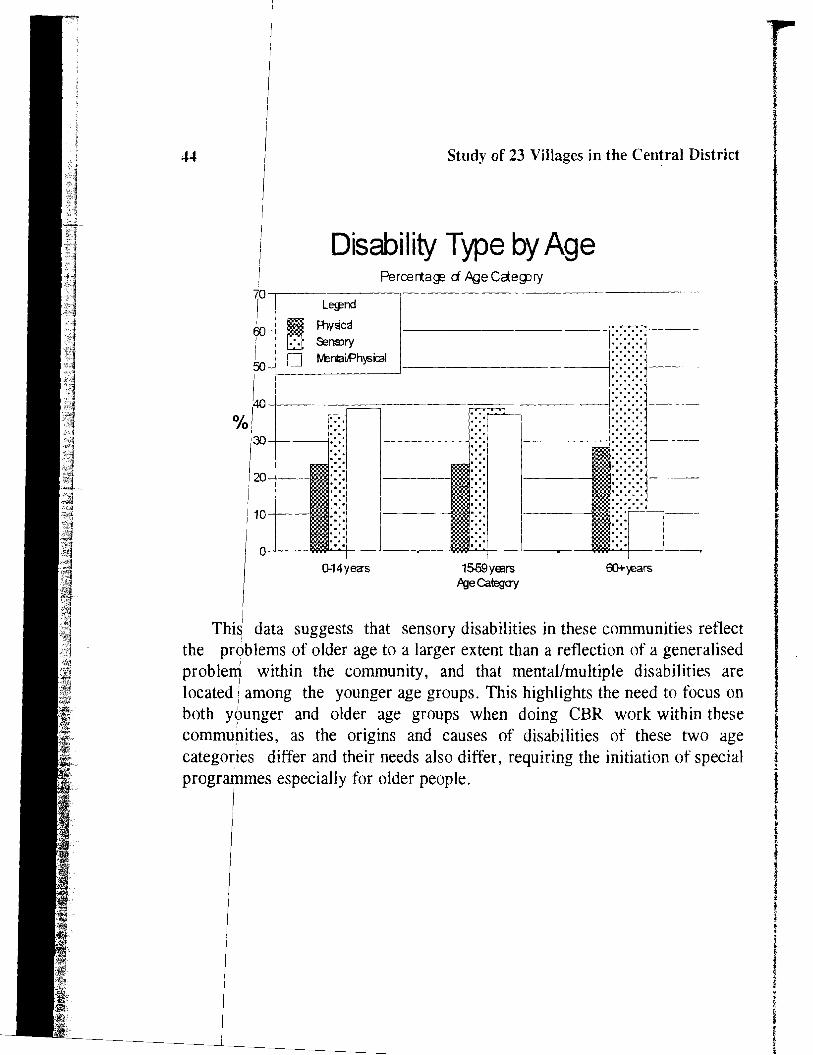
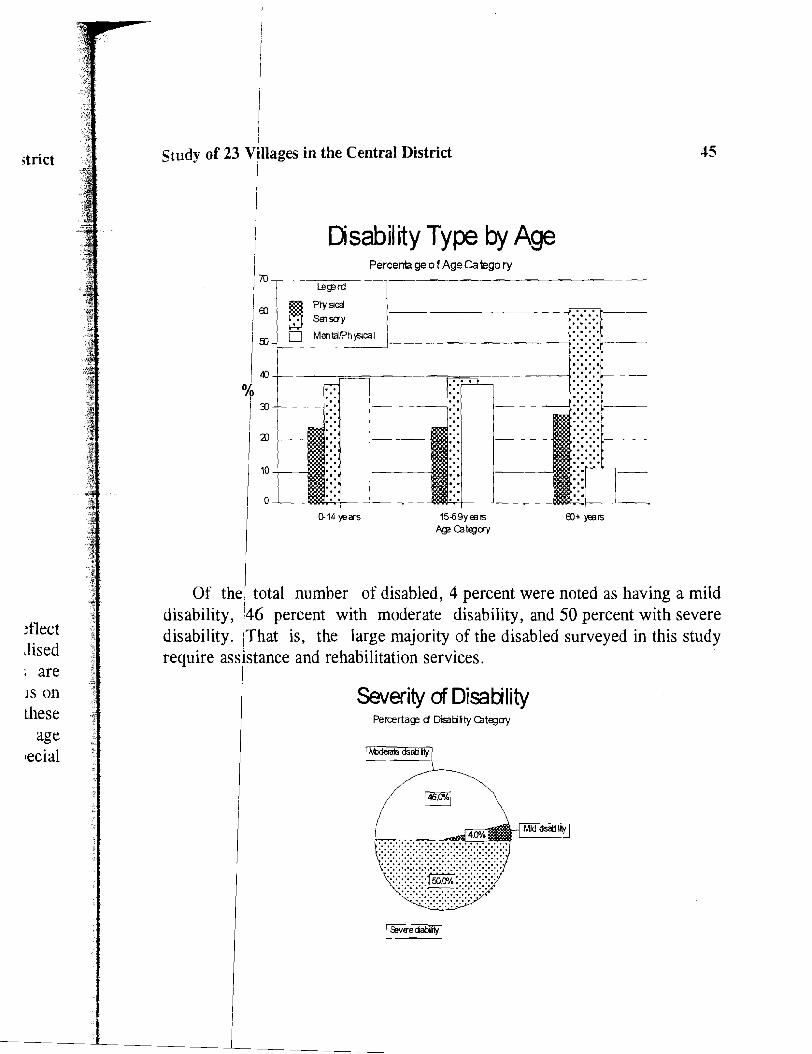
s of In total 25 percent of the disabilities were related to movement a high of ver 44 percent were related to disabilities of the sensory type - visual hearing 1 35 and speech -I and 31 percent were multiple in nature with mixed mental ) 25 learning difficulties as well as seizures and physical symptoms associated
with mental disability There were no differences in disability type either by catchment area or locale - central versus peripheral villages - however
into attempting to relate age to the type of disability revealed the following ural life
I I
) be ility ld a
i I
I
The abdve table
TABLE 9 Disability Type by Age
- Percentage of Age Category shy
I I
I
I
Physical I
I
I
Sensory I I I
Mentalphysical
0-14 years 15-59 years 60 years or more
24 24 28
37 39 61
39 37 11
Chi square = 7297256 P lt0005
demonstrates that there is no appreciable difference in the rate of physical disability by age with 24 percent for those 0-14 years old 24 percent for those 15-59 years old and 28 percent for those aged 60 years or 0ier The picture changes with sensory disabilities where we have a low of 37 Ipercent of those between 0 and 14-years-old who suffer from sensory disabilities in contrast to 39 percent for those aged 15-59 and a high of 61 percent for those aged 60 years or over In contrast mentalmultiple disabilities tare more common with the younger age groups with 39 percent of those between 0 and 14-years-old suffering from mentalmultiple disabilities 37 percent among those aged between 15 and 59-years-old and a
I
low of 11 percent among those who are aged 60 years or older
I
----
Study of 23 Villages in the Central District 44
Disability Type by Age I Percertaps d AQe CaegHy I
Le~nd
Ii Fhysca IG ~r1S)ry o fventlitPhysical
I-------1bullbull -shy
bull bull I bullmiddot middot
1559yEBr5 60+ years bull PgeCategay
D-14yecrs
45 strict
eflect lised are lS on these
age ecial
j
I Study of 23 Villages in the Central District
II
i Disability Type by Age I Percenla ge 0 f Age Ca lego ry70 --r-~----------~---I leg=rd
I6) ~ Pty sica I [3 Senscry
IED ~O_Mentatfhj5lcal
I
I 3J --+------1
-~
~--~------i
I LX) -------===---------o==
-
1---
Iz 10
o ()14 yeltrs 15-69yeelS 6)+ WIS
AgcatEglYY
Of the total number of disabled 4 percent were noted as having a mild I
disability 46 percent with moderate disability and 50 percent with severe disability That is the large majority of the disabled surveyed in this study require assistance and rehabilitation services
I Severity ofDisablity
Percertage d Disati~ty CltEglYY
IIgtAxJerre dslti itt I
~
~~~~ ~~~~~ ~ ~~~~jJ~ll~ ~ ~~~~~)~ ~ ~~~ ~ ~
iiI II
I I
II
IiI
46
54
Study of 23 Villages in the Central District
Daily Living Skills
TABLE 10 Petformance of Daily Living Skills - Number of Persons by Skill Level shy
Unable to or help
Performs with Difficulty Perform
Eats 36
Cleans
60
87
Toilet
160
114 64
Dresses 78150
II
I
IiIIII
IIII
I
Sits
I
III 2559
I
II
iI
I
I
Ii
I
Stands 68 53
Moves inside house 46
Movesl outside house
94
104 123
WaUG ten steps 103 63 i
Understands instruction 121 41
Expresses needs 40
Understands sign language
89
94 27
Uses ISign language 32
Lip-reads
109
4356
I
I
47
I i I i I f
I Study of 23 Villages in the Central District rict
I I I bull bull
The above table demonstrates that among those where the question IS
relevant a fotal of 2139 different daily living skills need to be learned by these disabled persons with an average of 21 skills per disabled person living in the~e communities These results indicate the need for CBR projects
I
that can actively take part in assisting the disabled in performing activities of daily living1 releasing pressures off the disabled as well as their caretakers
Iwho are usually women I
55 cokmunity IntegrationI
I The degree to which persons with disabilities are integrated into their
community [was measured by the level of participation of disabled people in a variety of family social and educational activities Analysis of the data on children revealed the following
I T1BLE 11 Selected Social Activities of Children with Disabilities
I PERCENT OF TOTAL ACTIVIT~
NUMBER OF CHILDREN I I
Plays regularly with peer children lt 15 71
I Plays as a younger childwith younger 19 children I
IDoes not play at all 10
I I
I I
6-I8 years old goes to school regularly 52
I Went to school as a younger childno 4 homework
INo 35I
I i
Special rehabilitation school 9
I
rIfI
II
I
I IIii
48 Study of 23 Villages in the Central District
I The above table is interesting in more than one respect Firstly 10
percent of children do not play at all 19 percent play with younger childrenas ia younger child and 71 percent play regularly This contrasts with the Jenin data where a high 25 percent of the children were found not to play at all 21 percent were found to playas younger children and 54 percent were found to play regularly Although it is impossible to ascertain with accuracy the causesI of these differences between the different areas the data suggests that children in the central area communities are relatively more integrated than in theIJenin area assuming a similar degree of disablement
The above table also shows that 52 percent of the central area disahled children go to school 4 percent go to school as younger peers 9 percent go to special rehabilitation schools and a high of 35 percent do not go to school at all In lenin it was found that 43 percent of children go to school regularly 5 percent as younger children 7 percent with no homework and a high of 44 percent do not go to school These results do reinforce the suggestion that due to the accessihility of services in the central area shy
Imiddot
I
special rehabilitation schools for instance - in addition to other factors such as knowledge and exposure to alternative services for disabled people disabled children in the central area are relatively more integrated than the lenin area Nevertheless these results also demonstrate that a high proportion of children with disahilities do not have access to school and do not play
I adequately making children a priority for the CBR project operating in the area I
Examining this data in terms of the community in which these children
live wf noted a significant difference among the children in terms of attendance of school hy catchment area
I
49 ct
lO er th ly re -y ts ~d
~d
~o
01 01 a
he l shy
h e he m ay he
en of
Study of 23 Villages in the Central District
TABLE 12 Childrens School Attendance by Catchment Area
- Percentage of Catchment Area Category -
Beit Dr Nilin Kharbatha
I Yes go to school 51 41 36
I As younger or no homework 1 9 6
No 43 44 43
Special I
rehabilitation school 5 6 15
I I
Chi square = 2086095 p lt 0005
The above table shows that 51 percent of the disabled children of Beit Dr go to school normally in contrast to 41 percent in Nilin and a low of 36 percent in Kharbatha The lowest level of school attendance in Kharbatha can be explained in terms of the children there attendinghaving access to rehabilitation school with 15 percent of the children attending such schools in contrast to 6 percent in Nilin and 5 percent in Beit Dr In contrast 43 percent of the children of Beit Dr do not go to school at all compared to 43 percent fori Kharbatha and 44 percent for Nilin Thus it appears that Nilins children ar~ a priority for action
I
I
I
r 50 Study of 23 Villages in the Central District
I
School Attendance by Catchment Area Percen1a ge0 f Catch rrent Catsgory
8J----r----------~----_r_-~=-~
------------1
e I Goas to sctcd Y(lJrgerlro hl lrelMfkI I
middot middot middot i
10
JJ
Ngt CatdmertArm CatEgay
Le~rd
o 8ErtU e Nlin
E3 KIBboth a
A rather interesting and inexplicable relationship was noted between the rate of att~ndance of disabled children in schools and whether the locale is a
central or peripheral village Usually the assumption is that because central village families have access to schooling more so than peripheral ones one would expect that central village disabled children would be more integrated in schools than in peripheral villages However in this survey it was found that a high of 50 percent of central area village children do not go to school I at all in contrast to 33 percent for peripheral village children (Chi square = 1O7879 p= 029) These results suggest that factors other than accessibility are operational here impeding access of central village disabled children tq schools Stigma is believed to be a factor by field workers who have observed that stigma associated with disability is more strongly felt I among fa~ilies living in central villages relative to peripheral ones We will have a chance to examine this question later in this analysis
I
I Examining the data on social integration for the disabled population as a
whole wei find the following II I i I
I
51
i
iI
t
- Percentage of Total Population of Disabled shy
ACTIVITY PERCENTAGE OF TOTAL
Regularly joins family activities 90
Sometimes i 6
Not at all 4
III
i II
I
I
II
i
III
j
I
I I
i
ii
Regularly joins social activities 68
Sometimesi 15
Not at all I 17
Regularly Ihas jobincome 20
Sometimek has jobincome 8
No job or income 78
I
a I
III
1
1 )
t
I
i Study of 23 Villages in the Central District
TABLE 13 Selected Social Activities of Persons with Disabilities
The lbove table contrast with the Jenin area villages in that while 90 percent
I olf the disabled stated that they regularly join family activities in this
survey only 62 percent of the lenin area disabled responded positively to the
1
IiiII
52 Study of 23 Villages in the Central District
I
III
I III
question Additionally 68 percent of the disahled in this survey reported regularly joining social activities in their community in contrast to only 29 percent of the disabled in the lenin area These results demonstrate a significant difference in the integration of disahled people with the central area disabled appearing to he rather more integrated into community life than the lenin villages Even when it comes to having a job or regular area income the difference is clearly in favour of the central area villages with 20percent of the disabled in the central area reporting having a regular job or income in contrast to only 8 percent among the disabled of the lenin area These results were consistent across different age categories where children adults and older people appeared to have a similar pattern of integration indicators riegating an explanation of these results in terms of age Given also that th~ large majority of the disabled in this population are suffering from moderate to severe disabilities it does not make sense to suggest that they are better integrated than other disabled because their disabilities are of the mild type
I
I Examining the level of integration in terms of catchment areas we found
a significant but weak relationship denoting that Nilin area disabled are less integrated socially than the other areas with 72 percent of the Beit Ur area disabled stating that they regularly join social activities in contrast to 68
I
III
percent of Kharbathas disabled and a low of 60 percent for Nilins disabled The relationship disappeared when relating catchment to family activities While care must be taken not to make out of this data more than it can yield these results suggest that Ni lin disabled people are less socially integrated than the rest in consistency with the previous findings pointing to Nilin disabled people as a priority for action
Service Provision for Disabled People 56
I On the whole a high of 81 percent of the disabled of these communities
had sought services related to their disabilities in the past in contrast to a
I
II
low of 57 percent for the lenin area villages Of those who received services the large i majority - 91 percent - received medical or medically related
53 iet
ed 29
a raj an lar 20 or a n on en 19 lat of
Id ss ~a
8 1 s I ~d
III
s a d
Study of 23 Villages in the Central District
services such as operations special tests medications or physiotherapy and only 9 perce~t received rehabilitation services and training Interestingly only 4 reported that they had sought Arabic Medicine for a cure There were no appreciable differences in the receipt of services among the catchment areas
i i
Examining the receipt of service in terms of the community in which the disabled live there were significant differences noted with a high of 27 percent never having received any service in Nilin in contrast to 18 percent for Beit Dr I and 17 percent for Kharbatha with 70 percent of the Beit Dr disabled having had medically related services in contrast to 71 percent for Nilin and 79 percent for Kharbatha and a high of 12 percent of the Beit Dr disabled having received rehabilitation services in contrast to a low of 3 percent for Ni lin and 4 percent for Kharbatha (Chi square = 343195 P = lt 0005)
Receipt of Services tJy Catctrrent Area
Percena ge 0 f SeN ce Category I aJ 7-r--------------==-------r--------------
Legmir i
4)+----1
70H- _i m BatU I
I EDci--------- shy
I i
9]H----------shy I 4J-+--__~ _ I 3)-t--~-~----
I I
I 10
o
I Sa-vire Qt ~ ay
o Nlin
o Ktarbaha
Malicas av ire
I A simdar pattern was noted when comparing central and peripheral
villages 21 percent had no services 66 percent had medical services and 13
54 Study of 23 Villages in the Central District
percent had rehabilitation services for the central villages as opposed to 19 percent with no services 75 percent with medical and 6 percent with rehabilitation services for the peripheral villages (Chi square = 107879 P =003) These results indicate that although the large majority did receive I some form of service services accessible to disabled people remain mostly of the medical type and identification of the difference needs of service for this population required a concerted effort from the part of the CBR team to uncover with the aim of fulfilling them These results also demonstrate that peripheral areas have relatively less access to services even of the medical variety than the central ones with this highlighted once again in the Nitlin area as a whole
r
I I
Receipt of Services by Village Location 1
Pe rcerta~ d servi ceCltiegory 80--------------------------~
Le~nd
70-+------------1 II Ca1t rallliDages
o Feripteral vaiagES 100-+--------shy
i i 50-+--------shyr
i 40-+--------- shy
30-+--------shy
20-1-shy
10-+-shy
o No9ll4ce Rdlabilitaticn reNcervedical-raataI el4ce
SeNceCcteggtry
I
55 strict Study of 23 Villages in the Central District
to 19 57 Difficulties Faced by the Families of Disabled with
People879 I
Izeive I
When families were asked about the types of problems they faced as a this ly of
result of having disabled family members a high of 31 percent stated that m to they have no problem Of those who thought they had problems a low of 9 that percent believed that they had problems related to access to medical services
Iical or the search for a cure 15 percent denoted financial matters - such as an rilin income or job for the disabled person - as a major problem affecting family
life and a I
high of 40 percent noted that their problem is psychosocial the stigma or Ipsychological and social complications of disability making family life difficult Interestingly 5 percent noted that they have a problem in having educational access for disabled people and a high of 32 percent noted that daily physical difficulties in handling the disabled were the biggest
problems would face
Perceived Disabil~y-Related Protiems Percertags ci Reooted Prctgtlem
I Wediall-raatEd I
Educaticnal access
I Rnarciall-~mBit
FSyhcsocial
56 Study of 23 Villages in the Central District
Relating these responses to the age of the disabled person we find that psychosocial problems affect families with disabled children or adults to a much larger extent than families with disabled older people with 40 percent of families with disabled children and 49 percent of families with disabled members between 15-59 years noting psychosocial problems as important in contrast to 19 percent among families with disabled people who are 60 years or older Interestingly problems related to the physical difficulties of limited access to technical aids such as hearing aids and wheelchairs and the physical difficulties encountered by women in dealing with this situation were more strongly pronounced among families with older disabled people 59 percent of the families of disabled people who are 60 years or older noted this as a primary problem in contrast to 30 percent among families of disabled children and 24 percent among families of disabled adults 15-59 years (Chi quare = 4755373 P lt0005)
Perceived Importance of Problems Percertage d ~e Bracket
oo--------------------~--------_ L~nd
1m FSChaodal p-obkms irrpat3nto coosstl1echrical aidsirrpolta-rtso-+-shy
60
i 4O-+-shy
I I
i
I 20--t-- shyI
I
0---- shy
1559years 6O+-~ars fgtgeBlac~t
i
Clearly this data suggests that physical difficulties encountered by women - who are the caretakers of the disabled in Palestinian society - relate mostly to the presence of disabled older people and secondarily to children while stigma felt by the family that causes social and psychological problems
0-14yea-s I
I Il I i I
Ibull
57 rict
hat oa ent led III
ars ted the )n Ie ed of 59
Iy te
1
IS
I
Study of 23 Villages in the Central District I
i I I
is more pronounced among families of disabled adults and to a lesser extent children These results are consistent with the prevailing understanding that old age brings with it disabilities that are not the fault of the family but rather part of the ordinary life cycle while other disabilities carry with them blame disabled known
shame and the consequent psychosocial trauma not only for the child but for the entire family as well Indeed it is ordinarily
I
that the presence of disabled children within the family can compromise the marriage options of females within that family It is to this extent that I the disability stigma is felt in this society emphasising the importance for the CBR projects to systematically work on awareness building and consciousness change as the core of any community based disability rehabilitation project 21
I
I
Examining psychosocial problems - or stigma - on its own and relating responses pertaining to stigma to the locale where families live we found a pattern of difference among the different communities where a low of 31 percent of NiIin catchment area families noted stigma as a major problem in contrast to 40 percent among the Beit I Dr villages and a high of 45 percent among the Kharbatha catchment area villages Although these differences were not found to be statistically significant they potentiate the views of the field workers who believe that increasing urbanisation opening up to the urban area and modernisation increase the feelings of stigma related to disability among families These views appear to be consistent with the results of I this study that denote that the Ni lin catchment area is the least developed I of the areas The field worker observations are also potentiated by the finding that stigma is more strongly felt by families living in central villages relative to peripheral ones where a high of 48 percent of central village families reported stigma as a main problem they encounter in contrast to a low of 38 percent among peripheral village families
I
I i
I 21 It sh9uld be noted here that the responses obtained from disabled people relating
to the problem they face were complete for only one third of the disabled making it impossible to analyse the data adequately
I II
I
58 Study of 23 Villages in the Central District
58 Gender
As Appendices I IIA lIB and lIe indicate disabled males outnumbered disabled females in the communities overall and in each of the catchment areas with 56 percent of the disabled being male and 44 percent being female This contrasts with the proportion of women relative to men in these communities where women were found to compose 499 percent of the total population This discrepancy in the ratio of males to females requires further
I
study Although one can argue that this could be explained by a higher rate of disability among males because of biological as well as social or work reasons it could also be argued that the combined effects of being disabled and being female in Palestinian society could be leading to the premature death of disabled females Although it is beyond the scope of this study to examine the way in which gender articulates with disability to produce specific physical as well as mentallife condition effects on disabled women an attempt was made to compare the conditions of sexes given the limitation of available data and with the perspective of identifying priorities for action
There were no relationships between sex and disability rate by catchment area nor by centralperipheral village locale Likewise there were no relationships found between the sex of the disabled and their abilities in the activities of daily living That is theoretically given similar abilities disabled males and females should rate similarly in social integration indicators given that no determinant other than the disability itself is operational However cross-tabulating social integration indicators by sex revealed significant differences in social integration levels between males and females in favour of males and as follows
Study of 23 Villages in the Central District ct
TABLE 14 Social Integration Indicators by Sex of Disabled Person
- Percentage of Sex Category shy
~d
at
19 e al ~r
Males Females
PLAY - FOR CHILDREN ONLY
Yes 66 52I
As younger I 13 22 No I 21 26I
Chi square =74921 p=002 i
GOES TO SCHOOL-FOR CIDLDREN OF SCHOOL AGE 6 TO 18 YEARS-Yes i 48 42 As younger 1 0 No homework 6 0 No i 37 50 Special rehabilitation school 7 8
Chi square =1182295 p =0018
JOINS SOCIAL ACTIVITIES
Yes
73 62
Sometimes 13 18 No i 14 20
Chi square =132354 p= lt0005 i
RECEIVED SERVICES
Yes I 83 79 No services at all 17 21
Chi square =404255 p=0044
l
n
It
o e
1
S
(
I
60 Study of 23 Villages in the Central District
As the above table demonstrates and given similar abilities between disabled males and females in these communities women tend to consistently be at a disadvantage Notice for instance that 21 percent of disabled male children do not play at all in contrast to 26 percent among disabled females 37 percent of disabled male children do not go to school at all compare with a high of 50 percent for disabled females 14 percent of disabled males do not join social activities at all compared with 20 percent of disabled females and 17 percent of disabled male children have not received any service at all compared with 21 percent of disabled females These results clearly demonstrate the impact of gender relations on disability specifically highlighting the negative impact on the integration level of females relative to males These results reiterate the need to view and define disabled women as a priority for the activities of the CBR project
i
I
IIIIIiiI I
i
61 rict
een itly lale es ha not md all rly lly rve len
I Study of 23 Villages in the Central District
60 SUMMARY AND CONCLUSIONS
61 Summary of Study Findings I
This study was based on data collected in a house-to-house survey conducted in 23 villages in the central area of the West Bank A total of 4793 households were visited representing about 80 percent of the total number of households in these communities The average family size was found to be 69 persons per family for the visited households The large
I
majority were found to be original inhabitants of the area while 13 percent were refugees The male to female ratio was almost identical with females
representing ~99 percent of the population
I
Despite the proximity of these villages to the Ramallah urban area and to Jerusalem they nevertheless continue to suffer serious socio-economic problems and general underdevelopment With the majority of household heads working as wage labourers these villages today suffer the economic crunch that resulted from the closure of the occupied territories and the resultant inability of wage workers to enter Israel in search of wage labour opportunities
j
The overall educational attainment of male and female househeads was found to be generally low with an average of 7 years of schooling formales relative to a lower 42 years for females
I
I This survey succeeded in identifying 1056 disabled people living in these
communities Of those 56 percent were males and 44 percent females once
1 I
62 Study of 23 Villages in the Central District
again replicating the pattern observed in the northern region of the West Bank and in the Gaza Strip where disabled males outnumber disabled females and suggesting a pattern of discrimination against disabled females leading to premature death The mean age of the disabled was found to be 359 years considerably higher than the mean found for the northern area villages and for the G~a Strip and with a high of 36 percent of the disabled population being 50 years or older The data pertaining to the length of the period of being disabled was also generally indicative of the prevalence of disabilities of longer term duration with a high of 39 percent of the disabled reporting having had their disabilities for 20 or more years 23 percent for 10-19 years 17 percent [for 5-9 years and 21 percent for 0-4 years The majority of the disabled were found to suffer from moderate and severe disabilities with only 4 percent denoting their disability as of the mild type and indicating the need for CBR projects in these communities
In total 25 percent of the disabilities were related to movement a high of 44 percent i were related to the sensory system - sight hearing and speech shy
I
and 31 percent were multiple in nature mental mixed with other types of disabilities This pattern generally replicates the trend already found in the north of I the West Bank and in the Gaza Strip except for the overshyrepresentation of sensory disabilities within this population Controlling for age the data revealed that the majority of sensory disabilities pertained to older people and therefore should be categorised as the expected disabilities of old age rather than due to the specific circumstances of this particular population i Although one can also question the reasons for the apparent differences I in the rate of disability of old age among the different population studied in the West Bank and Gaza Strip unfortunately the answer to such a question is beyond the scope of this particular study
i
I What is important is to note is that overall a total of 2 139 daily living
skills are still not performed either adequately or at all by these disabled people Moreover the data also confirms the problem of the isolation of disabled people because of a combination of physical difficulties and social stigma and requiring immediate attention in the area of social integration
Study of 23 Villages in the Central District 63iet
programmes This is especially important in the case of disabled children and nk disabled women and girls who neither play nor go to school nor participate
to rrd
in communal life as equally as other members of their society and is
s definitely considered as a matter of priority I
ld in
Overall that data obtained in this study related to the general well being Jf of disabled I people and their families confirms the need for immediate
~s
assistance in the form of rehabilitation programmes focusing on not only 19 physical problems and their solution but also psychosocial problems leading
~
to isolation of disabled persons in these communities le h e
62 Priorities for eBR Programs
f
In line with the above findings it is recommended that f
1 The central area CBR programme takes the shape of not only individual assistance within homes but also the shape of communal education and action On the one hand the disabled people of the central area need assistance to solve their physical problems On the other hand an attempt to gradually change the negative perceptions of communities towards disability shystigma and shame - is very much part of disability rehabilitation in addition to being a fundamental human right
2 The CBR programme also takes into serious consideration the finding I
that a rather high percentage of the disabled in these communities are older people Given that old age can often lead to disability but that society perceives this type of disability in different ways than disabilities caused by other factors - certainly less stigmatising than disabilities occurring due to other causes - it is important that the programme is developed to fulfil this special need Specifically given that the largest percentage of disability
64 Study of 23 Villages in the Central District
related to the sensory system it is imperative that the central area programme links to accessible and affordable secondary services that are well linked into a network of assistance with the CBR programme and can therefore
adequately provide the needed technical aids as well as other forms of assistance needed by this older disabled population Indeed this is an emerging national priority not only because of the specific findings of this study but also because of the gradual change in the nature and relations within and around the Palestinian family Increasingly Palestinian families are becoming nuclear - about two-thirds of the families were found to be nuclear families in the West Bank and Gaza Strip by the FAFO study - more and more women - the traditional caretakers of older people - are moving into the labour force by virtue of economic necessity Yet there is no systematic and parallel evolution of networks of services and assistance to older people during these transitional times In other words it is precisely such groups that fall through the cracks in care systems during periods of change and it is precisely such groups that the CBR programme should pay special attention to
3 That the programme takes into serious consideration the special problems of disabled women and girls as gender relations in Palestinian society compound the effects of disability and pose a double burden on disabled women compared to disabled men That is it is highly recommended that the programme specifically focuses on the needs of disabled women and girls as a priority and as a high risk group
I
4 Finally disability rehabilitation is not merely a programme of assistance The Palestinian experience has developed in such a way that it is also a programme that is directed towards guaranteeing the fundamental human rights of disabled people In this vein an active involvement in animating and assisting the disabled and their families to speak forr
themselves to form their advocacy groups and call for the recognising of their rights is also very much part of the tasks of the staff in this emerging programme In this area consolidating relations with unions for the disabled is a task as imperative as conducting the technical practical work Through such an approach to disability rehabilitation that combines the technical with
Study of 23 Villages in the Central District 65
the human rights component the stage IS set for the central area CBR programme I s success in its endeavours
66 Study of 23 Villages in the Central District
APPENDIX I
Overall Characteristics of the 23 Central Area Villages
i III
Surveyed households Total number of households surveyed 4793 Estimated actual22 number of households
in the 23 communities of the central area studied 5800 Percentage of households surveyed 83 percent
Gender breakdown in surveyed household population Total population of surveyed households 33186
Males 1 16641 Females 1 16545
I
Percentage females 499 percent Children ( lt 15 years of age) 17035
Percentage children 51 percent
Mean household size 69 II
I
I Population origin Original inhabitants 87 percent Refugees 13 percent r
I
22 Based on HDIPs estimated total population of 40000 for the area and 69 for
average family size - see later in Appendix 1 II
III
I I
67 Study of 23 Villages in the Central District
Work of male household heads Unskilledsemi-skilled labourer 59 percent Private work 8 percent Office work- white collar 8 percent Farmer 7percent Unemployed in prison or retired - no work 18 percent
i
I
Education of male household heads None 15 percent 1-6 years 33 percent 7-12 years 42 percent 13-21 years 10 percent
Mean educational attainment 7 years
I
Work of female household head Homemaker 94 percent Embroidery and knitting in the informal sectorpart time 4 percent Farmer ~
I
I percent I
Other 1 percent I i I I
i
Education of female household heads None 40 percent 1
1-6 years J 31 percent I
7-12 years 27 percent 13-16 years i 2 percent
Mean educational attainment 42 years
I
Total number working in household None 8 percent One person 78 percent 2-5 persons 14 percent
68 Study of 23 Villages in the Central District
Home ownership Own ~ 95 percent Rent
Ibull 4 percent
Family owned 1 percent
Total number of rooms in house Up to 2 rbullbullbullbullbullbullbullbullbullbullbullbullbullbullbullbullbullbullbullbullbullbullbullbullbullbullbullbullbullbullbullbullbullbullbullbullbullbullbullbullbullbullbullbullbullbullbullbullbullbullbullbullbullbullbullbullbullbullbullbullbullbull 53 percent 3 to 4 41 percent r
5 to 8 1 6 percent Mean number of rooms in house 26 rooms
House type i Stone 24 percent Concrete 75 percent
Household wealth status Doing very well by village standards 12 percent Managing 46 percent Barely able to manage 42 percent
Disabled persons Total disabled 1056 Estimated percentage disability in these communuies- 26 percent
Number of disabled persons by households Households with one person disabled 67 percent Households with more than one person disabled 33 percent
I
23 Based 011 HOIPs population estimate of 40000 persons
Study of 23 Villages in the Central District 69
Gender of persons with disabilities Male Female
56 percent 44 percent
Age of persons with disabilities o to 4 years 5 to 9 10 to 14 15 to 49 50 to 95
Mean age of disabled
7 percent 11 percent 11 percent 35 percent 36 percent 359 years
Length of disability o to 4 years 5 to 9 years l 10 to 19 years 20 or more years
Mean years disabled
21 percent 17 percent 23 percent 39 percent 20 years
Severity of disability Mild Moderate Severe
4 percent 46 percent 50 percent
i
I
70 Study of 23 Villages in the Central District
APPENDIX II-A
Characteristics of Beit Ur al-Tahta Catchment Area
(Beit Ur al-Tahta Beit Sira AI-Tireh Saffa Beit fUr al-Foqa i Beit Liqia and Kharbathat Misbah)
I Surveyed hou~eholds Total number of households surveyed 1911 Total population of surveyed households 13293
Males 66141
Females rI
6679 Percentage females ~ 50 percent
Children ~ 15 years of age 6947 Perc~ntage children 52 percent
I I
Mean household size 7 persons
Population origin Original inhabitants 86 percent Refugees 14 percent
Work of male household heads Unskilledsemi-skilled labourer 60 percent Private work 9 percent
Office work- white collar 7 percent Farmer 7 percent Unemployed prison or retired- no work 17 percent
71Study of 23 Villages in the Central District
Education of male household heads None ibullbullbullbullbullbullbullbullbullbullbullbullbullbullbullbullbullbullbullbullbullbullbullbullbullbullbullbullbullbullbullbullbullbullbullbullbullbullbullbullbullbullbullbullbullbullbullbullbullbullbullbullbullbullbullbullbullbullbull 13 percent 1-6 years 33 percent 7-12 years i bull bull bull bull bull bull bull bull bull bull bull bull bull bull bull bull bull bull bull bull bull bull bull bull bull bull bull bull bull bull bull bull bull bull bull bull bull bull bull bull bull bull bull bull bull bull bull bull bull bull bull bull bull bull bull bull bullbull 44 percent 13-21 years 10 percent 1 bullbullbullbullbullbullbullbullbullbullbullbullbullbullbullbullbullbullbullbullbullbullbullbullbullbullbullbullbullbullbullbullbullbullbullbullbullbullbullbullbullbullbullbullbullbullbullbullbullbullbullbullbullbullbullbullbullbullbull
Mean educational attainment 71 years I I I I i
Work of female household heads Homemaker
I
90 percent Embroidery and knitting in the informal sectorpart time 9 percent Private work jbullbullbullbullbull 1 percent
I I I
Education of female household head None Jbullbullbullbullbullbullbullbullbullbullbullbullbullbullbullbullbullbullbullbullbullbullbullbullbullbullbullbullbullbullbull 38 percent 1-6 years i bullbullbullbullbullbullbullbullbullbullbullbullbullbullbullbullbullbullbullbullbullbullbullbullbullbullbullbullbullbullbullbullbullbullbullbullbullbullbullbullbullbullbullbullbullbullbullbullbullbullbullbullbullbullbullbullbullbullbullbull 30 percent 7-12 years 30 percent 13-16 years 2 percent
Mean educational attainment 44 years
Total numberworking in household I
None 7 percent 1
I
One person 77 percent 2-5 persons 16 percent r
1
i Home ownership Own bullbullbullbullbullbullbullbullbullbullbullbullbullbullbullbullbullbull 95 percent Rent ~
i 5 percent
Family owned none
Study of 23 Villages in the Central District 72
Total number of rooms in house Up to 2 48 percent 3 to 4 43 percent 5 to 8 9 percent
Mean number of rooms in house 27 rooms
House type Stone 17 percent Concrete 83 percent
Household wealth status Doing very well by village standards Managing J
Barely able t9 manage
13 percent 47 percent 40 percent
I Disabled persons Total disabled Estimated percentage disability in these communities-f
474 25 percent
Number of disabled persons by households Households with one person disabled Households with more than one person disabled
68 percent 32 percent
73 Study of 23 Villages in the Central District
Age of persons with disabilities o to 4 years 5 to 9 10 to 14 15 to 49 50 to 95
Mean age of disabled I I i
Mean Length of disability j
i Severity of disability Mild Moderate 1
Severe ~
7 percent 13 percent 11 percent 34 percent 35 percent 351 years
196 years
3 percent 49 percent
48 percent
bull
74 Study of 23 Villages in the Central District
APPENDIX II-B
Characteristics of Nilin Catchment Area (Nilin Qibia al-Midieh Budrus and Shubtin)
Households Surveyed Total number of households surveyed 1035 Total population of surveyed households 6752
Males 3433 Females bullbullbullbullbullbullbullbullbullbullbullbullbullbullbullbullbullbullbullbullbullbullbullbullbullbullbullbullbullbullbullbullbullbullbullbullbullbullbullbullbullbullbullbullbullbullbullbullbullbullbullbullbullbullbullbullbullbullbullbullbullbull 3319
Percentage females 492 percent Children laquo 15 years of age) 3606
Percentage children 534 percent
Mean household size 65 persons
Population origin Original inhabitants 88 percent Refugees 12 percent
Work of male household heads Unskilledsemi-skilled labourer 59 percent Private work 8 percent Office work - white collar 7 percent Farmer 7 percent Unemployed in prison or retired - no work 19 percent
75 Study of 23 Villages in the Central District
Education of male household heads None 17 percent 1-6 years 35 percent 7-12 years jbullbullbullbullbullbull 38 percent 13-21 years 10 percent
Mean educational attainment 67 years
Work of female household heads Homemaker 97 percent Embroidery and knitting in the informal sectorpart time 2 percent Other - office private and farmer 1 percent
Education of female household head None 43 percent 1-6 years 35 percent 1
7-12 years ~ 20 percent 13-16 years 2 percent bull
Mean educational attainment 37 years
Total number working in household None 9 percent One person 83 percent 2-4 persons 8 percent
Home ownership Own 94 percent Rent 6 percent
Study of 23 Villages in the Central District 76
Total number of rooms in house Up to 2 61 percent 3 to 4 i 35 percent 5 to 8 4 percent
Mean number of rooms in house 239 rooms
House type Stone 15 percent Concrete i 85 percent
I Household wealth status Doing very well by village standards 10 percent Managing 43 percent Barely able to manage 47 percent
Disabled persons Total disabled 199 Estimated percentage disability in these communities-gt 21 percent
Households with one person disabled 69 percent Households with more than one person disabled 31 percent
Sex of persons with disabilities Male 59 percent Female bullbullbullbullbull bullbullbullbullbullbullbullbullbull 41 percent
25 Based on HDI~s population estimate of 9330 persons
77 Study of 23 Villages in the Central District
Age of persons with disabilities o to 4 years 7 percent 5 to 9 11 percent 10 to 14 14 percent 15 to 49 31 percent 50 to 95 37 percent
Mean age ofdisabled 363 years
Mean Length of disability 201 years
i I
Severity of disability Mild ) 7 percent Moderate 45 percent Severe 48 percent
~
Study of 23 Villages in the Central District 78
APPENDIX II-C
Characteristics of Kharbathat Bani Hareth Catchment Area
(Kharbathat Bani Hareth Ras Karkar Deir Qaddis Bilin Kufr Nimeh Beit Nuba Deir Ammar Deir Ibzi
al-Janieh Beit Illu and Jammalah)
Surveyed Households Total number of households surveyed 1847 Total population of surveyed households 13141
Males 6595 Females 1 6546
Percentage females 498 percent Children laquo 15 years of age) 6562
Percentage children 499 percent
Mean household size 71 persons
I I
i I
Population origin Original inhabitants 88 percent Refugees 12 percent
Work of male household heads Unskilledsemi-skilled labourer 59 percent Private work 7 percent Office work- white collar 9 percent Farmer 7 percent Unemployed in prison or retired- no work 18 percent
79 Study of 23 Villages in the Central District iet
Education of male household heads None 16 percent 1-6 years 31 percent 7-12 years 42 percent 13-21 years 11 percent
Mean educational attainment 71 years
Work of female household heads Homemaker 97 percent Embroidery and knitting in the informal sectorIpart time 1 percent Other - office private an farmer 2 percent
i
Education of female household heads None 39 percent 1-6 years j bullbullbullbullbullbullbullbullbullbullbullbullbullbullbullbullbullbullbullbullbullbullbullbullbullbullbullbullbullbullbullbullbullbullbullbullbullbullbullbullbullbullbullbullbullbullbullbullbullbullbullbullbullbullbullbullbullbullbullbullbullbullbull 31 percent 7-12 years 27 percent 13-16 years 3 percent
Mean educational attainment 44 years i
I i
Total number working in household None 8 percent One person 77 percent 2-4 persons 15 percent
Home ownership Own jbullbullbullbullbullbullbullbullbullbullbullbullbullbullbullbullbullbullbullbullbullbull97 percent Rent 3 percent
80 Study of 23 Villages in the Central District
Total number of rooms in house Up to 2 53 percent 3 to 4 ~ 42 percent 5 to 8 t 5 percent
Mean number of rooms in house 25 rooms
House type Stone i bull 35 percent
i Concrete Jbullbullbullbullbullbullbullbullbullbullbullbullbullbullbullbullbullbullbullbullbullbullbullbullbullbullbullbullbullbullbullbullbullbullbullbullbullbullbullbullbullbullbullbullbullbullbullbullbullbullbullbullbullbullbullbullbullbull 65 percent
i
i I
Household wealth status Doing very well by village standards 13 percent Managing 46 percent Barely able to manage 41 percent
Disabled persons Total disabled 383 Estimated percentage disability in these communities-s 32 percent
Households with one person disabled 66 percent Households with more than one person disabled 34 percent
Gender of persons with disabilities Male ~ 55 percent Female 45 percent
26 Based on HDIPs population estimate of 12000 persons
81 Study of 23 Vlllages in the Central District
I
Age of persons with disabilities oto 4 years 7 percent 5 to 9 ibullbullbullbullbullbullbullbullbullbullbullbullbullbullbullbullbullbullbullbullbullbullbullbullbullbullbullbullbullbullbullbullbullbullbullbullbullbullbullbullbullbullbullbullbullbullbullbullbullbullbullbullbullbullbullbullbullbullbullbullbullbullbull 9 percent 10 to 14 10percent 15 to 49 39 percent 50 to 95 36 percent
Mean age of disabled 367 years
Mean Length of disability 206 years
I i
Severity of disability Mild 4 percent Moderate 42 percent Severe 54 percent

i
Community Based Rehabilitation Workers I Naimeh Siam Firial Shehadeh
Nawal al-Qadi Hiam al-Sayes Tahrir Nofal Janan Samhan Lamia al-Sheikh Nida Hammad
I
I Field Work Supervisors Valid Hamdan Abdul Sami al-Sheikh
j
Project Manager Majed Abdul Fattah
I
I Regional Committee Representatives
Ghazi Hanania Patients Friends Society
I I
Coordinator of Diakonia CBR Projects Ghada Harami
I Director of Dlakonla CDR Projects Ivan Magnuson
IDiakonia Consultant to CDR Project Ulrike Pars6n
I Computer Coding Supervisor Hala SalemIAtieh - Birzeit University
Computer Coding Janaan Barghouthi - Birzeit University
I Analysis of Report and Writing
I
Ghada Harami Ulrike Parson i I
List of Participants in Central Area Study
Inam Abu Hasma Fatima al-Sayes Shamieh Sroor
Khaled Qrei Palestine Health Council
Rita Giacaman Birzeit University
I Table of Contents I
I
I 10 Introduction 11 Community Based Rehabilitation (CBR) pI 12 The Initiation of the CBR Project p4
I I
20 The Survey 21 A Brief Description of the Study Area p5 22 Survey Methodology p7
30 Gene~al Description of Survey Population 31 Estimates of Population Size and Rate of Disability p9 32 Distribution of Population by Origin pl0 oJoJ Distribution of Population by Gender p12 34 Household Size p13
i 40 Socio-Economic Status of Survey Population 41 Work Patterns amongst Household Heads p16 42 Educational Attainment amongst Household Heads p18 43 Homb Ownership Patterns p25 44 Crowding Rates p26 45 Wealth Status p30
50 DesJiPtion of the Population of Persons with Disabilities 51 Distribution by Gender p38 52 Distnbution by Age p40 53 Duration and Types of Disabilities p42 54 Daily Living Skills p46 55 Community Integration p47 56 Service Provision for Disabled People p52 57 Difficulties Faced by the Families of Disabled People p55 58 Gender p58
I
60 sunhnary and Conclusions 61 Summary of Study Findings p61 62 Priorities for CBR Programs p63
I
I APPENDIX I Overall Characteristics of the 23 Central Area Villages p66 APPENDIX II-A Characteristics of Beit Dr al-Tahta Catchment Area p70 APPENDIX II-B Characteristics of Nilin Catchment Area 174 APPENDIX Characteristics of Kharbathat Bani Hareth Catchment Area p78
10 INTRODUCTION
11 Community Based Rehabilitation (CBR) I
This study signals the initiation of the third regional model for community based rehabilitation in Palestine The first model was established in the Gaia Strip during the period 1990-1991 At the time 9 nonshygovernmental organisations working in the area of either primary health care or disability rehabilitation joined hands in order to address local needs They eventually formed themselves into the Gaza National Committee for
Rehabilitation with the aim of overseeing the piloting of community based bull I
rehabilitation (CBR) programmes to complement existing secondary services The experience of the Gaza Committee in institutional coordination and modelling was the first in the country Although the context in the Gaza Strip differs from that of the West Bank this experience nevertheless proved to be important as a model around which the initiation of the Central National Committee for Rehabilitation (CNCR) on the West Bank took place
Parallel to the developments in the Gaza Strip the Central National
Committee for Rehabilitation in the West Bank was formed during the same period Composed of all the major non-governmental organisations working in the area of disability rehabilitation the CNCR in the West Bank decided
I
on a different organisational approach from that of the Gaza Committee for a variety of reasons the institutional base in the West Bank was wider than that in Gaza with different institutions in the West Bank already developing appropriate locally-tailored programmes to rehabilitate the disabled within their communities and the activities of the CNCR were due to take place in a
Study of 23 Villages in the Central District 2
larger and more diverse geographical area Thus the CNCR took a coordinating role creating regional committees - comprised of 9 nonshygovernmental organisations working in the three regions of the country the north the centre and the south - responsible for planning and implementing pilot projects in their respective regions
I I
At the onset international trainers were brought in to train staff in the technical skills that formed the main part of the course which was based on the WorId Health Organisation manual Rehabilitation in the Community This training focused on improving the daily living activities of the disabled although selected measures to encourage social integration were also discussed in brief The manual provided a basic reference tool including a simple and workable system of supervision animation and reporting although it i needed to be adapted constantly as the projects moved from one region to the other As the Gaza project was developing the experience accumulated assisted in developing improved curricula for the project in the northern region Moreover channels of communications began to develop between the first two projects During the development of the central region project - which is the subject of this survey - both the Gazan and northern projects experience were utilised in the planning and the initiation phases local trainers with cumulative experience were used to train the CBR workers field training of the central area workers included visits and training on site in rhe north and in Gaza and a general network of support and information exchange developed
I
i Recently the central area project joined the other projects to provide
support to ithe newly emerging project in the south of the country While the overall CBR scheme initially relied mainly on international experts to provide the technical component of the training today a core team of local trainers is visibly and actively in place This year a new project is expected to be launched in the Nablus region of the country where training is expected to be carried out I completely by local staff In addition to this transfer of training skills from I international to local staff the training has been and continues to be adapted by local experience giving the national CBR project a good chance to sustain itself and continue its work
I I
I I
3 itrict
)k a nonshy the uing
the Ion [his led ilso 19 a ng Jne [lce the lop on ern ~s
3R ng nd
je
le Ie IS )e Ie g o d
i
I I
Study of 23 Villages in the Central District
I At another level a network is gradually being built from the bottom
upwards with the CBR workers in all the country as key participants Regular meetings among the different projects in the different regions are currently taking place during this stage at project manager level In this forum experience is exchanged problems are discussed policies and plans are formulated and a general vision for the future development of the CBR projects in the West Bank and Gaza Strip is being worked out While the CNCR and the Gaza Regional Committee continue to provide guiding logistic and other forms of support to the other projects they are being developed with the CBR workers and project managers in a way that allows them the opportunity to develop the policies and plans for the national scheme as well as for their own local schemes The workers today see themselves not only within the context of their own project and region but also in a national framework I
1
This national programme is presently offering the opportunity to implement different types of activities all geared towards assisting the disabled not only in physical but in other ways as well particularly in relation to their fundamental civil and human rights as equal citizens The Palestinian Union of Disabled People is informally linked to the CBR projectinitiated by i
I
a few founding members around the same time as the CBR projects began While the two bodies are independent they work together in parallel ways with extensive coordination and cooperation The task of the CBR projects is to assist disabled people in their attempt to gain the same rights as any other citizen of the region Within the context of this mutually beneficial relationship the CBR projects assist the Union in implementing different schemes Those include the identification of disabled people encouragement to join the Union and logistic and technical assistance including assistance in building a democratic organisational structure from the base upwards At the moment the Union is preparing to hold national general elections ih which the CBR projects are providing an important supportive role at the regional levels
I I
It should be mentioned that through the building of this experience I
logistic technical and financial support was provided to the projects by Diakonia a Swedish organisation that provides consultation services by
j I
I I
Study of 23 Villages in the Central District 4
drawing in local and international experts to the field Today a positive coordination and cooperation among different international aid agencies is taking place all geared to support the national level project At this stage Diakonia is co-operating with the Norwegian Association of the Disabled and the Swedish Palestine Solidarity Group Cooperation is taking different forms including financial support and technical assistance that includes capacity building and the training of local human resources The representatives of these organisations have never worked independently of local institutions instead participating with local experts in discussion and debate ensuring an informed direction for both the projects and for future plans It is in this sense that a partnership between international and local non-governmental organisations has yielded a specific approach to development work in the occupied territories an approach that is firmly based in the utilisation of local expertise and knowledge to avoid the pitfalls of both inappropriate imported strategies and of organisational structures built independently of local skills and resources
12 The Initiation of the CBR Project I
With the Central Regional Committee for Rehabilitations links with the central area villages well established as a result of the provision of institutional rehabilitation services in the urban centre of Ramallah the Committee was compelled to complement these services with rehabilitation in the community Guided by the experience generated by the different regional committees in establishing CBR projects in the Gaza and northern region of the West Bank the Central Committee began with the training of 15 CBR workers This training was accredited by Bethlehem University and was held in the middle part of 1993 The course followed similar lines to the courses launched by the Gaza National Committee and the Northern Regional Committee with the technical component once again based on the World Health Organisation manual Rehabilitation in the Community modified to suit the local context Once the training was completed additional training in survey methodology was provided to the prospective CBR workers with this practical training completed before the survey was formally begun
5 rict
tive S IS
ige and ent des rhe of md ure leal to
aly ills res
he of he In
ial of ~R
ld es al ld to In
IS
I
II
I Study of 23 Villages in the Central District
20 THE SURVEY
21 A Brief Description of the Study Area
I Located in the Ramallah District of the central region of the West Bank
this cluster of 23 villages is located near the border with Israel (the 1967 armistice line or Green Line) at distances ranging from 20 and up to 40 kilometres i from the Ramallah urban area Before 1948 these villages belonged to the Lid and Ramleh areas of Mandate Palestine As is the case with other border villages the 1948 war and the creation of the State of Israel resulted in some of the inhabitants of these villages losing eitheror a combination of their homes their land their extended family land and many therefore their source of livelihood Such families were given semi-refugee status by the United Nations Relief and Works Agency (UNRWA) which continues up to the present day the organisation providing selected basic services to a proportion of the families living in these communities
I
One ~ould have thought that the fact these villages are located in the
central area of the West Bank would mean that they are relatively more developed I than the villages of the lenin district in the north for instance In fact these villages strike one as being as deprived as are the villages in other West Bank districts certainly in terms of the availability and quality of basic services within communities even in central villages While the large majority of the villages in this survey have a piped water supply electricity and probably better transportation access to the urban centre they nevertheless continue to lack most other basic services including the absence of telephone connections in the typical hinterland fashion
i
II
Study of 23 Villages in the Central District 6
With the main road at the entrance of each of these villages paved other roads remain largely unpaved Houses are clustered in the typical West Bank highland fashion with the central part of town occupied by older stone houses where older households live and the peripheral areas occupied by r
I
newly built houses occupied by younger couples Houses built out of concrete are found relatively rarely in the original central parts of villages increasing in number as one moves towards the periphery of the village
I While these villages used to rely mainly on agriculture as a main mode of
subsistence even in the recent past today agriculture does not contribute much to the communal income The large majority of males are wage workers It i~ believed that over 90 percent of those workers used to work
I
inside Israel or in Israeli settlements built on village confiscated land As is the case with other border villages especially and with the West Bank as a whole economic hardship hit these villages in unprecedented ways following
I
the Gulf War and the subsequent closure of Israel to Palestinian wage labour As a result these communities have become impoverished during the past 3-4 years Indeed the sudden change in the financial status of families is evident with clear past indicators of wealth juxtaposed next to the present reality of financial difficulty well built stone houses containing families presently unable to make ends meet In this most recent economic period the class and financial homogenisation that resulted from wage labour in Israel appears to be disappearing and an increasing gulf between rich and poor within communities is reappearing in some areas there are increasing signs of dire poverty iI
I During the period of the Uprising (also known as the Intifada a popular
uprising of the Palestinian people against military occupation that began in December 187) almost all of these villages maintained a high level of political acti~ity and resistance perhaps partially due to the nearby presence of settlers and in response to the continual land confiscation that the Israeli occupation authorities required to pursue its settlement policy In some communities) such as Beit Sira the settlement literally faces the village the
I
two opposing communities divided only by a small road Womens committees were also very active in this region before and during the period
I I
i I
Study of 23 Villages in the Central District 7
I of the Uprising Today however the level of political activity in these
ber communities has been dramatically reduced as is the case in the other areas mk of the West Bank
i me by Although these villages are located close to the Ramallah urban area they ete in fact score low on virtually every indicator of service provision and mg development Despite differences among the different catchment areas and
between central and peripheral villages of the central region one can only describe these communities as under-developed and deprived Schools are
of extremely badly maintained badly equipped and often too crowded There lte are a few maternal and child health clinics that used to be operated by the ige Israeli occupation authorities and which have been handed over to the new irk Palestinian National Authority (PNA) These clinics have suffered the years
IS of deprivation under military control only to be handed over to the PNA in a I
~ a state that requires major effort and funds to improve them Some private I
ng clinics exist in these communities while others are operated by local and If international non-governmental organisations This however hardly fulfils 1-4 the basic need that exists There are extremely limited services for pre-school It children and the situation is even worse for disabled children While some of youth and sport clubs are located in central villages the peripheral villages in ly catchment areas lack any such centres of activity whatsoever Overall the ad situation i~ these villages is not dramatically different from that of the Jenin to Area villages or in fact other rural areas of the West Bank
iIn I re I I
22 Survey Methodology ar
IIII As is the case with the other CBR projects the survey questionnaire
of comprised i two parts one pertaining to all households within the 23 communities and another pertaining to the disabled their problems an
~li assessment i of their abilities to cope with daily life and an assessment of their
Ie relative integration into societal activities The field work was completed
Ie during the latter part of 1993 and during 1994 At the end of the survey s period the CBR workers already had basic data pertaining to the disabled at
d hand that allowed them to launch the project immediately without delay
II
I
II
8 [ Study of 23 Villages in the Central District
I Becaus1e of logistic problems it was not possible for the survey team to
compile information pertaining to all the households in the communities although it was possible to interview almost all of the disabled and gather the needed information about their indivdual situations needs and problems
I
The information obtained from the survey was coded to prepare it to be processed by computer The Standard Package for the Social Sciences (SPSS) statistical analysis package was then used to analyse the data The statistical results were then combined with the narrative report of the workers and supervisors in order to prepare this report
I
For the purpose of analysis and representing the general geographic service and socio-economic relationships among the different communities the 23 villages were divided into three catchment areas each catchment area including a central village where the transport telephone and service network services the other communities within the catchment area The name of the central village has been used to represent the catchment area Thus the Beit Ur al-Tahta catchment area included Beit Sira al-Tireh Saffa Beit Ur alshyFoqa Beit Liqia and Kharbathat Misbah Nilins catchment area included Qibia al-Midieh Budrus and Shubtin Kharbathat Bani Hariths catchment area included Ras Karkar Deir Qaddis Bilin Kufr Nimeh Beit Nuba Deir Ammar Deir Ibzi al-Janieh Beit Illu and Jammalah
9
r trict
m to ties ~ the
o be )55)
tical and
hie ies uea -ork the Beit alshyded lent )eir
Study of 23Villages in the Central District
I
I I I
30 GENERAL DESCRIPTION OF SURVEY POPULATION
I
31 Estimates of Population Size and Rate ofi
Disability I
i Due tb logistic problems associated with entering and surveying all the
households in the survey area it is impossible to accurately ascertain the size of the population and the overall percentage of disability found in these 23 communities What can be ascertained is that there are at least 1056 disabled people in these communities that require some sort of rehabilitation assistance as it was reasonably well established that the survey team obtained
I
basic and reliable information about almost all of the disabled people living in these conkIunities but not all the households What can be said about the population is equivocal the field workers succeeded in surveying 4793 households which did not include all the households where disabled people live That] is while information related to disabled people is almost complete
I
information pertaining to their households is not However it was possible to calculate the average family size for the surveyed households found to be 69 persons per household
I
I
To e~timate population size we examined the community based I
rehabilitation programme records These indicated that there are 5255 families registered as having been contacted by the CBRproject and living in these communities However the Health Development Information Project
J I i
I
i I
I I
10 Study of 23 Villages in the Central District
I estimates the population in these villages to be around 40000 persons
I
therefore we have estimated that the CBR project succeeded in reaching about 80 percent of the households found in these communities and the majority of disabled community members who require rehabilitation services Based on HDIPs estimation of population it is reasonable to conclude that the rate of disability in this community is around 26 percent of the total population
I
I 32 Distribution of Population by Origin
I
I The population in these villages was found to be mostly homogenous
with the majority of the population - 87 percent - composed of original inhabitants and the remaining 13 percent holding refugee status (See Appendix I) The percentage of refugees in all three catchment areas were similar making up 14 percent of the Beit Ur Catchment Area and 12 percent in both the Nilin and Kharbatha catchment areas The majority of these villages are located close to the 1948 armistice line Many lived in the villages where they still live today but their agricultural land became part of the State of Israel in the post-1948 period Those were granted refugee or semi refugee status by the United Nations Relief and Works Agency (UNRWA) as they had technically lost their livelihood andor their homes
I
with their land being on one side of the border and domicile on the other This explains the presence of the relatively large proportion of refugees in some of these villages 6 percent of the population in Ras Karkar 5 percent in Deir Qaddis 18 percent in Nilin 9 percent in Beit Sira 75 percent in al-
I
Tireh 9 percent in Satta 12 percent in Beit Ur al-Tahta 8 percent in Beit Liqia 100 percent in Beit Nuba 53 percent in Deir Ammar 56 percent in Budrus 8 percent in Beit Illu 6 percent in Kharbathat Bani Hareth and 7 percent in Kharbathat Misbah Note however that the percentage of refugees
I
I i
1 Barghouthi M and Daibes 1 Infrastructure and Health Services in the West
Bank Guidelines for Health Care Planning the Health Development Information Project Ramallah 1993 pp314-316
11 rict
1S1
lout yof l on ~ of
iUS
nal See ere ent ese the of or
ICY
es er in
ent alshyieit in
i 7 ~es
est
ion
Study of 23 V~llages in the Central District
I I
in the area las a whole is close to the percentage found for the lenin area villages - 1~ percent - the focus of a similar study- to this in 1992-93 and
where a CBR project is in full operation today However this is a considerably lower proportion of refugees than figures cited for the West Bank Oust over one quarter of the population) and the Gaza Strip (roughly two-thirds of the populatiom This is because generally speaking refugees
tend to live] in concentrations within refugee camps and only a relatively small proportion were settled in the urban and rural communities of the area
I I
Population origin and refugee status are significant factors in the initiation and operation of a community based rehabilitation programme for disabled people in that those holding refugee status and their families have access to UNRWA services - especially health educational and social
I
services - that are crucial for the viability of rehabilitation within the community iIt should be noted that UNRWA services are free of charge are able to reach all refugees and are often more developed than those offered by the governmental sector This is understandable in view of the years of military rule and the associated neglect of the public sector that has taken
I
place since 1967 In areas where there are no refugees the population has had to rely on severely curtailed governmental services and on the expanding nationalist iNG04 service delivery system Although this NGO network did
succeed in ideveloping an infrastructure of services a new rather well developed and appropriate approach to service provision and an infrastructure of resistance to occupation it has not and could not have been able to fulfil the needs everywhere particularly in remote and rural
I
i
2 Giacamari R and Jarrar A A Study of 22 Palestinian Villages in the Jenin
District with Special Reference to the Needs of Persons with DisabilitiesThe Northern Regional Committee for Rehabilitation 1994 p14 Henceforth called the Jenin Study
3 Heiberg M and Ovensen eds Palestinian Society in Gaza West Bank and I
Arab East Jerusalem A Survey of Living Conditions FAFO- Report 151 May 1993 p360 Henceforth called FAFO Survey
4 Non-Govemmental Organisation
Study of 23 Villages in the Central District12
cornmunmes because of its nature limitations of finances and context Thus although the central area of the West Bank is known to be privileged to have a network ofPalestinian NGO services focusing on rural areas it is important to note that areas such as the communities that we have studied continue to be deprived 1 of basic services This is a result of the fact that few of the central area services are adequately linked to rural communities with the needed infrastructure including referral procedures This is important in that the success or failure of the CBR programme will also depend on the ability of the programme to link with existing communities basic services or to develop them where absent
I
I I
33 Distribution of Population by Gender
I The overall ratio of males to females in the study population was found to
be almost as expected world-wide with 499 percent of the population composed of females These results are very close to those obtained in the FAFOs Palestinian Society in Gaza West Bank and Arab Jerusalem A Survey of Living Conditions where adult females over the age of 15 years composed 50 percent of the population However theFAFO study also noted a slight over-representation of males in the ages 60 years or alders while an
analysis of PAFO infant mortality data also indicates a slight overshyrepresentation of males in the infant and early childhood years This
information indicates that despite an overall gender distribution that is almost equal in these villages discrimination against women and girls leading to premature death relative to males cannot be ruled out but cannot be ascertained either However the FAFO results draw attention to undue female infant death as well as the premature death of women in older age relative to imen in the same age category This is important as we have
i
I S FAFO Survey opcit pp44-45 See original footnote for complete reference
i i
6 This analysis of infant mortality differences by sex was conducted by Rita
Giacaman utilizing the PAPO Survey data set
13
i
II
II
II
I Study of 23 Villages in the Central District
II
I hus we ant ~ to the the hat ity to
consistently observed the presence of a higher number of males with disabilities in comparison to females as the CBR projects continue to encompass new areas and as communities continue to be surveyed Such results indicate a need to pay special attention to women girls and especially disabled females when operating community based rehabilitation projects
34 Household Size
i The average household size within the overall survey population was
found to be a somewhat surprising high of 69 persons compared to 65 persons per household for the lenin district villages7 As with the lenin
j
to peripheral ones with an average of 66 members in central village families
Nilinvillages the central villages of Kharbathat Bani Hareth and Beit Ur al-Tahta found to have relatively smaller family size than the were a
on
settingexposed-I
and 7 members in peripheral village families perhaps an indication of the he within which central village members live relative to more A peripheral ones
lfS
ed It is I
generally assumed that northern area rural communities tend to be an more under-developed than central area ones mostly because the central area er- of the West Bank offers the possibilities of access to a variety of services lIS including educational and health institutions Within the context of this )st assumption one would have expected smaller family sizes for central area 1to villages as family size is often linked to general exposure improved
1ij
be ue e ve
Ieducational levels and general state of including access to services However it appears that such assumptions are
development within communities
not corroborated by the results of this study Field workers through observation d~ring the period of research in the villages and presently as
I 7 Jenin Study lopcit p15 See original footnote for complete reference
II
8 Exposed in~ this context means a proximity to urban life and its associated
lifestyles and ways of thinking iIi
1
Study of 23 Villages in the Central District 14
they are launching the project have come to believe that despite the I
proximity of these central area villages to main town centres and an abundance of services accessibility continues to be a major problem Clearly the scope of this study does not allow for an adequate explanation of this larger-than-expected family size in these villages although we have discussed the relationship between family size and educational level at a later stage in this report
I
Comparing family sizes in the different catchment areas with the average number ofchildren per household revealed the following
I TABLE 1 I
I Average Household Size and Number of Children by Catchment Area
I
Beit fUr al-Tahta Nilin Kharbatha
I
Average number of household member
i
7 65 71
Average number of 33 35 36 children
As the table above indicates the catchment area with the largest family size Kharbathat Bani Hareth with 71 persons per family is also the area with the largest number of children 36 However this tendency of higher family size and a higher number of children does not surface in the other catchment areas with Nilin having the lowest household size but not the lowest average number of children and with Beit Dr having a family size of
i
9 Kharbathat Bani Hareth has been shortened toKharbatha here and in future
tables
15
iI
I
II
Study of 23 Villages in the Central District strict
IiI
7 - almost that of Kharbatha - but the lowest average number of children One d an the
possible explanation of these results could be the presence of a larger arly proportion of extended families in Beit Ur when compared with the other f this catchment areas and higher fertility in Kharbathat relative to the other areas issed ge in
erage
lffiily area igher other Jt the ize of
future
16 Study of 23 Villages in the Central District
I
I
40 SOCIO-ECONOMIC STATUS OF SURVEY POPITLATION
I The sobo-economic status of the communities surveyed was examined
utilising selected socio-economic indicators including work and educational patterns of male and female heads of households crowding rates home
I
ownership I house type and wealth status Wealth status of individual households i was then cross-tabulated with various indicators to examine the relationships of the different indicators to each other I
I
I 41 Work Patterns amongst Household Heads
i
I Of the4793 surveyed households 8 percent reported that no one in their
household i
I
was working at the time of the survey in contrast to a high of 12 percent that was reported for the Jenin area villages Comparison of the two
I populations should be approached with caution as the two studies were conducted I a year apart from each other However this data suggests a lower rate of unemployment in the central area villages relative to the Jenin district It could be argued that the central area of the West Bank offers more work opportunities for labourers within the West Bank relative to the Jenin district and therefore relieves some of the economic tensions arising from the closure of Jerusalem and the consequent sudden isolation of many wage workers from their livelihood in Israel
i i
10 Jenin Study opcit p18 See original footnote for complete reference
17
r strict
nined tional home idual ie the
their of 12 e two
were lower strict work istrict osure from
I Study of 23 YiIIages in the Central District
I
I Among the adult male heads of households surveyed a high of 59 percent
worked as iwage labourers in an unskilled and semi-skilled capacity only 7 percent reported that they were farmers 16 percent worked as white collar workers or in unemployed at study where a
I indicating that continues to
a private capacity and 18 percent reported that they were the time of the survey These results contrast with the lenin
high of 18 percentreported that they worked in farming11
the economic base of the communities in the lenin Region include agriculture as an important source of income and
livelihood while in the central area communities wage labour predominates as a primary mode of income generation There were no appreciable differences in work patterns among the different catchment areas nor between central and peripheral villages Thus overall it appears that farming composed a very small proportion of the activities and livelihood of all 23 communities regardless of location or linkage to their central village and that on the whole these are communities of primarily wage labourers who seek work either in the urban areas of the West Bank or in Israel and who minimally rely on other modes of generating income within their communities
Examining patterns of work for female household heads we found that as expected the majority of female heads reported not working at all for pay rather working as full time home-makers while 4 percent reported that they worked part time or during their leisure time on knitting andlor embroidery
I earning some income this way The rest - 1 percent - worked in farming or as unskilled Iabourers Again comparisons with the Jenin villages are important in that IiI percent of the Jenin female heads of households reported that they worked as
farmers These results reinforce the notion that the Jenin villages
rely on farming and agricultural production as a relatively important mode of earning income in contrast to the central area villages which appear to have moved more substantially into wage labour in the West Bank and Israeli
Imarkets I
I
I 11 Jenin Study opcit ppl8-19 See original footnote for complete reference
Study of 23 Villages in the Central District 18
42 Educational Attainment amongst Household Heads i II
The results of this survey revealed an average of 7 years of educational attainment for male heads of households (Appendix I) with 15 percent having had no education at all 33 percent having between 1 and 6 years of schooling 42 percent between 7 and 12 years and 10 percent between 13 and 21 years of schooling These results are comparable to the results of male head educational attainment in the Jenin district where the average number of years of schooling was found to be 71 years Interestingly a difference in average educational attainment was noted among the catchment areas in this study with i an average educational attainment of 71 years for Beit I Urand Kharbatha catchment areas in contrast to a low of 67 years for Nilin the area that also has the lowest family size It is not known exactly how this correlation functions Field workers and project managers have isolated some
I
possibilities i for example it could be that larger families have a greater economic base with which to send members to school and beyond
Cross tabulating male head educational attainment with their work I
revealed the following results I
TABLE 2iI EducationalAttainment of Male Heads of Households by Work I - Percentage of Work Category shy
Education In Years
I
Labourer Farmer OfficelPrivate Retired unemployed
orison I
None I I 7 29 6 44 1
I
1 to 6 I 35 46 18 36
7 to 12 I 52 21 40 15 I
I
13 to 21 I 6 4 36 5
Chi square =1574 48321 P lt0005
19 ct
al 19 )f ld le )f n LS
d le lS
le r
k
Study of 23 Vnlages in the Central District
Labourer Farmer I
Yea-s d Eduabn by ~ercertage Yea-s d Eduabn by Percertage
il1tosli
~----I
71012
RetiredlUnempoyedlPrison YeCls d Eduabn by Percertage YeCls d Eduabn by Percertage
~-I
I
I36D1 i i
71012
I~
I Note thatthe table indicates that the highest proportion of those who have
no education at all are in the category of retiredunemployed with 44 percent having no education at all in contrast to 7 percent for labourers and 6 percent for officeprivate work respectively and 29 percent for farmers Given that it is known that many of those who work in farming are in fact
I
older it appears that those with minimal education represent the older generation and that educational attainment has gradually improved in recent years These results are consistent with the FAFO study results on
i i
I
OfficelPrivate
Study of 23 Villages in the Central District 20
educational patterns over time and relevant to both the West Bank and Gaza Stripl
Cross-tabulating educational attainment and type of work also shows a significant association with 55 percent of those who have a post high school education working in white collar jobs or privately in contrast to 34 percent of those with the same educational attainment who work as labourers and 4 percent among farmers (Chi square = 157448321 plt0005) Although a statistically significant association it is important to note that while education might determine type of work education itself is often found to be dependent on wealth status That is as an intermediate variable education can operate on its own determining type of work but educations influence on type of work can also be a reflection of class or wealth category We will have a chance to examine the relationship of work education and wealth at a later stage in this report
I Examining the relationship of educational attainment to the location of
these communities - central versus peripheral villages - as a measure of accessibility to services we found a significant relationship noting a better educational attainment of male heads of central villages relative to peripheral ones Specifically we found that 14 percent of central area village male heads of households stating that they had no education at all in contrast to 15 percent in peripheral villages - probably older people and reflecting the past rather than the present 27 percent having between 1 and 6 years of schooling in central villages in contrast to 34 percent in peripheral villages 47 percent having between 7 and 12 years of schooling in central villages in contrast to 41 percent in peripheral villages and 12 percent having more than 12 years of schooling in central villages relative to 10 percent in peripheral villages (Chi square = 1869292 P = lt 0005)
f
II
IIII
12 FAFO Survey opcit pp136-137 See original footnote for complete reference
rict Study of 23 Vlllages in the Central District 21 i
iaza
EducabnalAttairmeri ci Male Heeds Percertage ci vilIage bcation category
solIS a Legnd
1001 [Iill Periiral
cent CS1tralD40Id 4 zh e
tion 30 Ient rate e of 20
ve a ater
10
n of o
-middot middot middot
e of ~tter
eral I ads These tesults indicate that access to educational facilities in central ) 15 villages is superior to peripheral ones particularly as students approach past secondary school and university age Indeed these central villages do house
of secondary schools that cater to the needs of not only the students of their es village but I the students of nearby villages as well However difficulties in in i transport and having to move from one village to another for schooling shyhan i I
mostly secondary - appears to have a negative impact on educational eral I attainment Ireinforcing existing notions of the need to have services
accessible and within communities for effective provision and universal
I access
I As expected female heads of households were found to have considerablyI I lower education than their husbands with a mean of 42 years for females in tbull contrast to I 7 years for males This is surprising in that the average
co--shy
--0shyII bull
~H~
m1
m
II bullbull
II iiii
m
~ - I middot1 middot I I H middot
bull II I II bull
I
I I I I N01e 1-6 ~alS 7-12YEaS 12+~ars
Educaticnal Ala rrrent
educationalIce i t 4
if
iattainment for female house heads of the lenin district was found i
I i
Study of 23 Villages in the Central District 22 I I I
to be 47 yeats 13 These results continue to reinforce the need to raise
questions regarding the prevailing assumptions that central area villages are advantaged in terms of service provision and relative to the north or the south of the West Bank These results unfortunately suggest that despite the
I
relative abundance of general services including education health and transport in the central area such services do not appear to affect the rural communities concentrated as they are in the towns and leaving rural communities in a more under-developed state than is generally assumed
We found Ia significant association between female heads of households educational attainment and where these women live where once again the Nilin catchment area women fare worse than the others
i
TABLE 3 Educational Attainment of Female Heads of Households
I by Catchment Area I - Percentage of Catchment Area Category-
I
Educational IJevel I
in Years I
None
1-6
7-12
13-16
I
BeitDr Nilin Kharbatha
38 43 39
30 35 31
30 20 27
2 2 3
Chi Square =3477647 p= lt0005
i
13 Jenin Study opcit p24 See original footnote for complete reference
23 ict
rse
ire ith he nd ral ral
Is he
J5
Study of 23 Villages in the Central District
I The above table demonstrates that the highest percentage of female heads
of households is found in the Nilin area with 43 percent having had no education at all in contrast to 39 percent for Kharbatha and 38 percent for Beit Ur Similarly only 20 percent of Nilins female heads have had between 7 and 12 years of schooling in contrast to 27 percent for Kharbatha and 30 percent for Beit Ur While it is clear from these and earlier results in this study that the Ni lin area stands out one cannot conclude from this data that the educational levels of Nilin are inferior to the other catchment areas
This is because this data on education pertains only to female heads of households land does not include information pertaining to all ages As it stands it would be safe to state that in comparison with the educational status
of women of similar social standing - ie other female heads - the data suggests that the Nilin catchment area lags behind the others In this sense a picture begins to emerge where the Nilin area can be seen as a priority area for the activities of the central area CBR project
I i Educatonal Anairmert of Ferrale Heads I Percenta9= ri Ccichmert Area CaEgJry
50-+--------------- shy
0 Ho6
g 7to 12
D 1310 16 NflinEilitUr
20
30 -t---------gt r--=------t~ur1----
40-+---------il~-------
Le~nd
m Nme
I I
24 Study of 23 Villages in the Central District
I I
Examining the educational attainment of female heads of households in relation to i whether their domicile is in a central or peripheral village we
I
found that as is the case with male heads central village female heads have a significantly higher educational attainment than peripheral village ones with 35 percent of central area women having no education at all in contrast to 41 percent in peripheral villages and 29 percent of central area villages having I had between 7 and 12 years of schooling in contrast to 27 percent among peripheral village ones (Chi square = 1021184 p=0016) This relationship I
Iis weaker than the relationship between education and catchment area In addition it must be remembered that the overall level of educational I attainment for the central area female heads of households is considerably ilow That is although we note differences in locales in general terms all of the women heads of households in the central area appear to be educationally compromised relative to other areas I
IFerrale Hwsehecd Educational Attairment j
I Percentage ~ Village LocafQ1 f50i-T---------------r-------_~
40-t------
304-----
20+------
10+---shy
0+----shy
Le~nd
o R1ripreral A IIa~s
o Caltral Allage
middot bullbull I bullbullbullbullbullmiddot
bull I I bullbull I bull I bull
Ncne
-middot middot middot middot middot middot middot bull bullbull bull I bullbull --~-middot middot middot middot middot middot middot
~---~-----~--middot bull bullbullbull I bullbullbullbull middot bullbull bull bullbullbull bull I
I bullbullbullbullbullbullbull bull bull I bullbullbullbullbullbullmiddot middot middot middot middot middot middot
--------L--~---middot middot
YearsofEtlucaticn
Overall idata on educational attainment of both male and female heads of households indicate a relative deprivation in the Nilin catchment area and
25 rict
~m
we e a ith 41
mg mg hip In
nal bly of
Illy
I I I
I
I Study of 23 Villages in the Central District
peripheral areas relative to central ones This alerts the CBR project to the need to pay I a special attention to these deprived areas as education is so often shown t to be an important determinant of the health and well being of the family particularly the health and well being of disabled family members
I 43 Home Ownership Patterns
Consistent with what is normally found in villages in the West Bank this survey demonstrates that the large majority of inhabitants own their homes Specifically lit was found that 95 percent of the surveyed families owned their homes 14 percent rented them and 1 percent lived in homes owned by their extend~d families (Appendix I) This contrasts with the FAFO data that indicates thatl 26 probably reflecting villages 14 I
I
I 100
percent of the homes included in their survey were rented a considerably higher rate of home rentals in towns than
CentrallyeneaHome ONnershp Patterns Otvnership Categcry bfPercentlge
80 -
-60
40 -
20 -
o HOllEOMer Tenlllnl
OM-erSlip Ca1egcry
Farril)ltlMlef torre i
14 FAFO Survey opcit pp131-154 See original footnote for complete i
reference II
i
of nd
Study of 23 Villages in the Central District26
Examining home ownership by catchment area we found very similar results with 194 percent home ownership for Nilin 95 percent for Beit Ur and 97 percent for Kharbatha (Appendices lIA lIB and lIC) An interesting
I
finding was made when comparing home ownership between central and peripheral villages We found that 8 percent of the homes in central village were rented I in contrast to 36 percent of homes in peripheral villages (Chi square =3286540 p= lt0000) Note that in the lenin district villages no observable differences in home ownership patterns were noted between central and peripheral villages 15 If home rentals is one of the measures of
community d~velopment including the opening up to people from outside the community the presence of market and other such relations then these reinforce the notion that central area villages are more developed communities (With a relatively increased access to the outside world possibly in the initial phases of urhanisation
I I
44 crOlding Rates Ii
Overall ~3 percent of the surveyed houses had 1-2 rooms and 47 I
percent had between 3 and 8 rooms The mean was 26 rooms per household lower than the average of 3 rooms per household for Jenin
I I
While the lenin study showed minimal differences in the number of rooms per household among the different catchment areas substantial differences were noted in this survey Specifically we found that while 48 percent of the houses in the I Beit Ur catchment area had 1-2 rooms 53 percent of the houses in Kharbatha and a high of 61 percent of the houses in the Nilin catchment area lhad the same number
I
I I
15 Jenin Studyopcit p26 See original footnote for complete reference
16 Jenin Study lOp cit p26 See original footnote for complete reference
27
Study of 23 Villages in the Central Districttrict ~ I
i
nilar IU r sting and Ilage (Chi no veen ~s of
~ the hese
I
bullbullbullbullbullbullbullbull I bull I bullbullbullbullbullbullbullbullbullbullbull I bullbullbullbullbullbull I bullbullbullbullbullbullbullbullbullbullbullbullbullbullbullbullbullbullbullbullbullbullibly t bull bull bull bull bull bull bull bull bull bull bull bullbullbullbull I bullbullbull
Central Plea CrONding Rates Percerra ge a f house size by rooms
[1-2 roomsll 530
[ bullbullbull bull
I------- f
~--0 - bullbullbullbullbullbullbullbullbullbullbullbullbullbullbullbullbull I bullbullbullbullbullbullbullbullbullbullbull I bullbullbull
bull bull bull bull I bull I bullbullbullbullbullbullbullbullbullbullbullbullbullbullbull I bullbullbullbullbull I bull I bull ~ iped
----gt-gt-- 3-8 rooms -------bullbullbullbullbullbullbullbullbullbullbullbullbullbullbullbull 470 bullbullbullbullbullbullbullbullbullbullbullbullbullbullbullbull
~ ~ ~ ~
bullbullbull bullbull bullbullbullbullbullbullbullbullbullbullbullbullbullbull bullbullbullbullbullbullbull Ymiddot
~ ImiddotmiddotmiddotmiddotI- ~~~~r
Crowding by Catchment Area 147 I Percenla ge a f houses wi1h 1-2 rooms
old
Jms Ices
Il -r---- shy
- - shy iii--shy
-+shy
c-shy itl- r
4J
1the
3)
the I J)lin
1~ i
d Ktaibatla Nlin
Catdme rt area Bert LX
Dividing the total number of persons living in a household by the total number of rooms - to obtain crowding rates - revealed that overall 38
28 Study of 23 Villages in the Central District
I percent of the surveyed households had a crowding rate of 1-2 persons per
I
room 29 ipercent a rate of between 21 and 3 and 33 percent had a rate of between ~I and 18 persons per room In contrast 50 percent of the households in the lenin villages had a crowding rate of 1-2 persons per room 38 percent with a crowding rate of between 21 and 4 and a low of 12 percent with between 41 and 12 persons per room 17 Clearly central area families
live in more overcrowded houses than those in the lenin district villagesI
CrOdin~ Rates by Region CrQvdng Rates by Region I Jen~-rea Central gtlea
~ ~ ~~-(thTI2IT]rt~~ middotmiddot)middotn~middotgt
middotiiiimiddot~jliiiiimiddot [1
ji1=1BOl L230~J
These results once again point to the need be very careful about prevailing i assumptions of states of development and also alert us to the need
I
to take into consideration the importance of the urban versus the rural setting when studying the socio-economic status of the Palestinian communities in different regions
I Crowding rates differed significantly between the three catchment areas
I 17 Jenin Study opcit p26 See original footnote for complete reference
29 trict
s per te of 0 the
raquoom rcent lilies
gion
about
i ~eed i~till ues ill
eas
Study of 23 Villages in the Central District I
I
I TABLE 4
Crowding Rates by Catchment Area - Percentage of Catchment Area Category shy
I
Crowding Rate (personsroom) Beit Ur Nilin Kharbatha
1-2 41 37 35
21-3 27 28 31
31-18 32 35 34
Chi square =1373177 p=O008
The above table demonstrates that in terms of crowding rates Beit Dr catchment area fares best with 41 percent of the households having a crowding rate of 1-2 persons per room and with 32 percent of the households having between 31 and 18 persons per room Kharbatha and Nilin appear to be similar with 35 percent and 37 percent of households with 1-2 persons per room and 34 percent and 35 percent with between 31 and 18 persons per room respectively Thus although Nilin had the lowest average total number of rooms in its households when compared with the other two areas its crowding rate becomes about the same as for Kharbatha area because of its lower family size It should be mentioned here that there were no differences in crowding rates between central and peripheral villages
I
I
I i I
I
I
I
I
Ibullbull
Ibull l i i i 1middot
30 Study of 23 Villages in the Central District
I
~rowding Rates by Catchrrent Plea I ~~~~cl~~~~h~
I 00
If
10
Legml
II 10-20o o 21-30Nllin lthartetha o 31-180CatchmertArea
I
I45 Wealth Status
I The assessment of wealth status for these communities relative to each
other was completed by the field workersrehabilitation workers This took place by categorising a number of factors that are locally thought to be indicators of wealth Those included the amount of land owned by the family the I type of house that they live in including the materials used to build the house the total number of rooms in the house and furniture fixtures and any electrical equipment that the family owns
An exiination of the data pertaining to wealthstatus revealed that 13 percent of Ithe surveyed households were doing well by local standards 46 percent were barely managing and 41 percent are unable to manage Regional
BeiUr
-----
I
rict Study of 23iillages in the Central District 31
variations Jere noted where once again the Nilin catchment area fared less 1
well than the other two areas we found that 13 percent of the Beit Dr and 13 percent of the Kharbatha households were doing well in contrast to 9 percent in the Nilin catchment area while 40 percent of households in Beit Ur and 411 percent in Kharbatha were unable to manage in contrast to 47
I
percent among Nilin households (Chi square = 2078826 p= lt0005) The differences in wealth status between central and peripheral villages were also significant ~lthough less pronounced 10 percent doing well in the central villages in contrast to 13 percent in peripheral ones and 44 percent unable to manage in tentral area villages in contrast to 41 percent in peripheral ones18
(Chi square r704642 p=O029)
W3alth Status by Areas and Location Percertage of Wealth Category
5O-ri--------------------- shy
I
----I40
3Ol ----II bull II
bull
I
--~20- -
10 shy shy __-=-ach ook ) be the Ctntral
d to ure
t 13 46 IX Note that peripheral area anal
I
1 ] middot middot middotmiddot middotmiddotmiddot middot middot middot middot middot middot middot middot middot middot middot middot middot middot middot middot middot
Legnd
Ii DdnglJlkllt3 Barely Mtraging
1- 0 UrabletoMmcgew
1-
D1-----1
middot middot middot middot middot middot middot middot middot middotmiddotmiddot middot middot
middot middot middot middot middot middot Feuroripreral IltharlBtra Cctctllrent JlrEBIlocction
ampit Ur Nrlin
communities seem to be doing slightly better on the
wealth status scale than central area ones These results remain unexplainedI 1
i
I I
I ~
I
32 i Study of 23 Villages in the Central District
I On the lwhole however while all households that are categorised as
I
unable to manage require the special attention of the CBR projects Nilin appears to he even more of a priority than the other catchment areas I
Jespecially as poverty can have a negative impact on the outcome of disability i
in these communities t I Ii ~
Looking [at the relationship of wealth to the educational status of male and female heads of households we found a significant and strong association
I
hetween the two variables with increasing educational status with wealth II I
- Percentage of Wealth Category -
I
I Doing well Barely managing Unable to manage I
No educatioh at all 8 11 22
1-6 years 31 34 33
7-12 years 46 43 37 I I
13-21 years I 15 12 8
Chi square = J48 84665 J = lt 0005
I
IiTABLE 5
Education of Male Heads of Households by Wealth Status
I
The above table clearly shows that the more educated male heads of households ~re also the wealthier with 8 percent of those who are doing well with no education at all in contrast to 11 percent among those who are harely
I
managing and a high of 22 percent among those who are unahle to manage Likewise 15 percent of those doing well have 13 or more years of schooling in contrast to 12 percent among those who are barely managing and 8 percent
I
among those who are unable to manage i
33
05
t
as In
s ty
ld m
mge
of ell ly ~e
i I
I I
Studv of 23 Villages in the Central District
Education and Vlealth Status of Males eo Percenlageofvkallh Category
~ i ~-l
~ co irg ell
Bcr ely rraragrg -
D U1 etJeto rrm ltg3
i ~=--i middot
middot middot middot middot -- middot middot middot middot middotmiddot middot middot
c-- middot middot middot middot middot middot middot middot middot middotmiddot - -
No edua tim
middotl4J
middot middot middot middot 3J middot middot middot middot middot middot middot middotmiddot middot middot middot middot middot middot middot 10 middot middot middot middot middot middot
middotmiddot shyo
~-shy middot middot middot middot
1 to 6~as 7 to 12 years 13 to 21 ~as
I I
Examining the relationship between educational levels of female heads of households and wealth status revealed similar results with the more educated being the wealthier 33 percent of the well off had no education at all in contrast to 46 percent among those who are unable to manage In this case 34 percent of the well off had 7-12 years of schooling in contrast to 23 percent
I
among those who are unable to manage (Chi square = 6671126 p= lt 0005) Clearly it is beyond the scope of this study to determine whether it is wealth that determines education or whether it is education that leads to the generation of a good income For the purposes of this study it is sufficient to note the relationship between these two variables highlighting their importance onthe prospects for disabled people in these communities
i I I
Attempting to assess the relationship of wealth to an indicator of good living conditions according to local standards we related the type of building materials used in the construction of a house to household wealth status We
34 I
Study of 23 Villages in the Central District
I
found thJt those who live in stone houses tended to be better off than those who live in houses made out of concrete with a total of 24 percent of the houses built with stone Forty-eight percent of the well off lived in stones houses in contrast to 24 percent of those who reported being only able to barely manage and 17 percent of those who reported being unable to manage (Chi square = 22495139 P = lt0005) It therefore appears that in these communities a relatively reliable indicator of family wealth is the material used in the construction of the familys house
Central Area Wealth Status Housebold Wea~h Stctus tyen Percent3ge
I
b middot middot middot middot middot middot middot middot middot middot middotmiddot middot middotmiddotmiddot middot middot middot
middot middot middot middot middotmiddotmiddot middot middot middot middot middot middot middot middot middot middot middot middot middot middotmiddot middot middot middot middot middotmiddot middotmiddot middot middot middot middot middot middotmiddot middot middotmiddot middot middot middot middotmiddot middot middot middot middotmiddot middotmiddot middot middot middot middot middotmiddotmiddotmiddot middot middot middot middot middot middot middotmiddot middotmiddot middot middotmiddot middot middot middotmiddot middotmiddot middot middotmiddot middot middot middotmiddotmiddotmiddot middot middotmiddotmiddot middot middotmiddot middot middotmiddot
middot middot middot I middot middot middot i middot middot middot middotmiddot middotmiddotmiddotmiddotI middot middot middot 10-shy30 middotmiddot middot middot 1 I
middot middot middot middot middot I middot middot middot middotI-shy20 middot middotmiddot middot middot middotmiddotmiddotmiddot middot middot middot middot middot middotI middot middot middotI
r
middot middot middot middot middotmiddotmiddot middotmiddot middot middot middot middotmiddot middot middot middot -shy
middot middot middotmiddot middot middot middot middotmiddot middotmiddot middotmiddotmiddot middot middot middot middot middot middot middot middot middot middot p I I I
~
Ddngwell B3rely rrBl1lging Ul1lbleto rTBncge llkath Sctus
I Likewise looking at patterns of association between wealth status and
crowding in the homes we found a strong association between the two variables with a pattern of rising crowding with decreasing wealth with 55 percent of those doing well living in homes of 1-2 persons per room in
I
contrast to 40 percent among those barely able to manage and 34 percent among those who are unable to manage Likewise a low of 20 percent of those doing
well were found to be living in homes with over 3 persons and
up to 18 per room in contrast to 27 percent among those who are barely managing and a high of 40 percent among those who are not able to manage
35 Study of 23 Villages in the Central District trict
(Chi square = 10189049 p= lt0005) Clearly the level of crowding in fthe hose
the home appears to he one of the indicators of wealth [ones I
Attempting to relate wealth status to the type of work that the male head
e to le to
of household is engaged in showed the following t in the
TABLE 6 Type of Work by Wealth Status - Percentage of work category shy
Unemployed Labourer retiredprisonFarmer OfficePrivate
I
Doing wel~ 11 14 24 6 I I
Barely managing 48 3152 54 i I
Unable to manage 22 6341 34
md wo
1 in ent of md ely age
Chi square = 31863640 p= lt0005
Note that the above table demonstrates that those who are self employed or employed in white collar jobs seem to do best as expressed by the wealth status observed by the field workers and double checked with local sources For instance 24 percent of the officeprivate workers are doing well in
I
contrast to 14 percent of farmers 11 percent of labourers and 6 percent of the unemployed or retired In contrast 63 percent of the unemployedretiredin prison category were found to be unable to manage 41 percent of the labourers 34 percent of the farmers and a low of 22 percent of those privately employed or who work in offices were found to be unable to manage That is other than the unemployed and retired who are generally
I expected to have lower incomes than the rest of the population labourers
I
I
55
36 Study of 23 Villages in the Central District
I
appear to be the worst off followed hy farmers and then office workers or workers in private enterprises
I
Type of Wgtrk by Wealth StatusI
I Percertaga of Vbrllt Category 170
Leyenld
I Ddngwell00 shy
Barely rraraging~I 0j50 -
I140
0 0
130 I
120
110
~=l 1----shyo
Urabletorra~e r----c
ql l
--2C-
I 1-1 t I
I
r-
Ii shy
i i
I I
LalDurEf Farrm afmPria1e REiirEdfU1erTfledfrison lkJrk Ccteggtry
I Looking at wealth status relative to the total number of persons working
at home lindicares that the higher the number of employed household I
members the greater the likelihood of that household being able to manage and doing well
I TrtBLE 7 Wealth Status by Number of Employed per Household
I - Percentage of Number of Employed Category shy
I None working 1 working 2-5 working
I Doing well 3 12 22
Barely a61e to manage 18 47 56 i
Unable to manage 79 41 22
middot
middot middot
37 istrict
ers or
rking ehold mage
I
I Study of 23 tillages in the Central District
Chi square = 29712707 P= lt 0005
WStatus by No of Employed per Hhold of No of Bnploje d Category
I ff)l---------===--------------------
I----------------f
1-------1 middotr-----Imiddot---~middot
1--------1 bull
1 Mlkirg t-bri EmpOfgj Qie~ry
o -----YiN--r+-----~-Ib re Mlkirg
I As the above table demonstrates there is a clear pattern of increasing
wealth with the increase in the number of people working in the household with a low of 3 percent of the households with none working doing well in contrast to 12 percent with one person working and 22 percent with 2-5
I
persons working In contrast 79 percent of the households with no one working are unable to manage in contrast to 41 percent for household with one person working and a low of 22 percent for those with 2-5 persons working As i~ the case with the Jenin district villages this data indicates that household income in these communities is primarily determined by wage work rather than for instance agricultural production land ownership or
I
remittance money from abroad
I ~1-+----1
6J +-----1 I I
~I+-------1
4)1-t--------1
3Jrl------j
JJ 1
I 10---1
I I
Legrd
1m Coirgwe
8 Bcrely ITBragrg o U1lttje to JT1al~
bull bull I bull
bullbullbull r-- shy
middot middot I-~-----JmiddotmiddotmiddotmiddotL--shy
middot
38 Study of 23 Villages in the Central District
I
I
50 DESCRIPTION OF THE POPULATION OF PERSONS WITH DISABILITIES
II
I With 1956 persons with disabilities interviewed in this survey and based
on HDIPs population estimates we estimate the rate of disability in these communities I to be about 26 percent overall and within what we believe to 1 be the national average of 2-3 percent (See Appendix I) Appendices IIA to lIe also demonstrate that there were some differences in the rates of disability among the different catchment areas Note for instance that the highest rate of disability was found in the Kharbathat Bani Hareth catchment area with a total of 32 percent rate of disability in contrast to 25 for Beit Dr and a low of 21 percent for Nilin the catchment area that was found to be the most
I
socio-economically deprived in this survey Perhaps the results can be seen in terms of community deprivation leading to premature deaths among disabled people as one of the explanations for the lower rate of disability in Nilin area relative to the other areas As for the higher disability rates in Kharbatha area those remain unexplained
I
I 51 Distribution by Gender
i
I In line with the results obtained in both the Gaza Strip and lenin studies
a difference in disability rates between males and females was noted with 56 percent of the disabled in the three catchment areas being male and 44 percent female Separating the different catchment areas we note a similar pattern although the differences among the catchment areas is not statistically significant II
I I
urlct
ased hese Ie to A to iility rate
ith a low
nost n in bled area atha
lies h 56 d 44 nilar ally
39StudYof 23 Villages in the Central District bull I
I
TABLE 8 Disability by Sex and Catchment Area
- Percentage of Catchment Area Category -
Beit Ur Nilin Kharbatha
Males 55 59 55
Females 45 41 45
I Di~ability by Sex and Catchment Area
1
P ercenta ge 0 f eaten rren t Prea eategory ~
legrd
g Maes U Femaes
---Oraquoraquo---------J~~___~_____--l-~~~___J
Nlin Krartniha CaldmertArEB
ri shy~
Given t~at women in the survey population compose 499 percent of the population it
can only he concluded that the missing females have not been
included in the surveyor alternatively they may have suffered the combined effects of disability and the discrimination against women in Palestinian
I
~o Study of 23 Villages in the Central District
society leading to their premature death We will have a chance to examine the remaining data from this gender perspective later below
I
I
i I
52 Distribution by Age
I
The age of persons with disabilities included in this survey ranged between a few months of age to 95 years old The mean age was found to be
I
I359 years (Appendix I) rather higher than the mean age of 296 years for the disabled of the lenin district This reflects the higher proportion of 1 older people found in this survey relative the lenin one In this survey 29 percent of the disabled were under the age of 15 35 percent were between ] the ages of 15 and 49 and a high of 36 percent were aged 50 years or older in contrast to 26 percent of the lenin district disabled being 50 years or older
I II Aga Distribution in tre Central Area I Percer1agl ci Pje Ehket
I
j I
I I I
II I I
I
I
I I
I i I
19 Jenin Study opcit p3 See original footnote for complete reference
41 StudY of 23 Villages in the Central District strict
I j
rmine Compari~g this survey data to data on age for the West Bank and Gaza Snip we find that people 65 years or older compose not more than 4-6 percent of the population 20 In contrast in this study they compose 15
percent of the population While one would expect that as mortality is reduced within any population the rate of old age disabilities rises it is not clear if these results are merely a reflection of increased longevity They could also 1 be interpreted in terms of the severity of conditions within which disabled people live leading to their early death and skewing the disability nged picture towards the normal disabilities of old age They could also reflect the to be rising problem for the aged in these communities and in the area as a whole s for resulting f~om the demographic transition where as average life expectancy m of rises special services for older people - including the fitting of hearing aids 129 and glasses - are not being implemented to cater to these newly emerging Neen needs that reflect the transition that these communities are undergoing This lder data indicates the need to look further into disability care for the elderly lder especially lif contrasted with information pertaining to disability types that will follow
While I no appreciable differences in the age distribution of disabled people was noted when comparing the different catchment areas we found significanf differences between central and peripheral locales Six percent of disabled people in central areas were found to be under the age of 15 years in contrast to 8 percent in peripheral areas 12 percent between 5-14 in the central areas in contrast to a high of 24 percent in peripheral ones 47 percent between 15-59 in central areas in contrast to 44 percent in peripheral ones an~ 35 percent of disabled people in central areas found to be 60 years of over I in contrast to 25 percent in peripheral areas (Chi square = 1900316 P lt0005) These results indicate that the rates of disabilities in
j
the age bracket of 0-4 years are about the same The differences begin to I
appear sharply in the 5-14 years bracket with double the rate of disability in I
peripheral areas than in the central ones This may suggest either that peripheral area disabled children die prematurely because of lack of assistance or that they are exposed to a disabling environment more so than disabled
i
20 FAFO Survey opcit p44 See original footnote for complete reference I I
r I
r I
Study of 23 Villages in the Central District ~2
children in the central area In the age category 15-59 years the rates of disability are about the same for central and peripheral areas However differences again begin to appear among those aged 60 years or over with 35 I percent of the central area disabled falling into this category in contrast to 25 percent among peripheral area disabled I
III
On the whole this data suggests that the CBR project needs to take into account the ispecial needs of older disabled people especially in the central
I area villagd while at the same time focusing on disability early in life I particularly ih the peripheral villages f
t I53 DUfation and Types of Disabilities II
IThe mean duration of disabilities in these communities was found to be I
20 years with 21 percent of the disabled reporting having had the disability I
for 0-4 years 17 percent for 5-9 years 23 percent for 10-19 years and a high of 39 dercent with disabilities for 20 years or more
I
Duration of Disability Percertaoe ci lgt(Je BrakEi
1D-19yw rsl
I I
I
I I
I
I
rict Study of 23 Villages in the Central District middotB i
i I
s of In total 25 percent of the disabilities were related to movement a high of ver 44 percent were related to disabilities of the sensory type - visual hearing 1 35 and speech -I and 31 percent were multiple in nature with mixed mental ) 25 learning difficulties as well as seizures and physical symptoms associated
with mental disability There were no differences in disability type either by catchment area or locale - central versus peripheral villages - however
into attempting to relate age to the type of disability revealed the following ural life
I I
) be ility ld a
i I
I
The abdve table
TABLE 9 Disability Type by Age
- Percentage of Age Category shy
I I
I
I
Physical I
I
I
Sensory I I I
Mentalphysical
0-14 years 15-59 years 60 years or more
24 24 28
37 39 61
39 37 11
Chi square = 7297256 P lt0005
demonstrates that there is no appreciable difference in the rate of physical disability by age with 24 percent for those 0-14 years old 24 percent for those 15-59 years old and 28 percent for those aged 60 years or 0ier The picture changes with sensory disabilities where we have a low of 37 Ipercent of those between 0 and 14-years-old who suffer from sensory disabilities in contrast to 39 percent for those aged 15-59 and a high of 61 percent for those aged 60 years or over In contrast mentalmultiple disabilities tare more common with the younger age groups with 39 percent of those between 0 and 14-years-old suffering from mentalmultiple disabilities 37 percent among those aged between 15 and 59-years-old and a
I
low of 11 percent among those who are aged 60 years or older
I
----
Study of 23 Villages in the Central District 44
Disability Type by Age I Percertaps d AQe CaegHy I
Le~nd
Ii Fhysca IG ~r1S)ry o fventlitPhysical
I-------1bullbull -shy
bull bull I bullmiddot middot
1559yEBr5 60+ years bull PgeCategay
D-14yecrs
45 strict
eflect lised are lS on these
age ecial
j
I Study of 23 Villages in the Central District
II
i Disability Type by Age I Percenla ge 0 f Age Ca lego ry70 --r-~----------~---I leg=rd
I6) ~ Pty sica I [3 Senscry
IED ~O_Mentatfhj5lcal
I
I 3J --+------1
-~
~--~------i
I LX) -------===---------o==
-
1---
Iz 10
o ()14 yeltrs 15-69yeelS 6)+ WIS
AgcatEglYY
Of the total number of disabled 4 percent were noted as having a mild I
disability 46 percent with moderate disability and 50 percent with severe disability That is the large majority of the disabled surveyed in this study require assistance and rehabilitation services
I Severity ofDisablity
Percertage d Disati~ty CltEglYY
IIgtAxJerre dslti itt I
~
~~~~ ~~~~~ ~ ~~~~jJ~ll~ ~ ~~~~~)~ ~ ~~~ ~ ~
iiI II
I I
II
IiI
46
54
Study of 23 Villages in the Central District
Daily Living Skills
TABLE 10 Petformance of Daily Living Skills - Number of Persons by Skill Level shy
Unable to or help
Performs with Difficulty Perform
Eats 36
Cleans
60
87
Toilet
160
114 64
Dresses 78150
II
I
IiIIII
IIII
I
Sits
I
III 2559
I
II
iI
I
I
Ii
I
Stands 68 53
Moves inside house 46
Movesl outside house
94
104 123
WaUG ten steps 103 63 i
Understands instruction 121 41
Expresses needs 40
Understands sign language
89
94 27
Uses ISign language 32
Lip-reads
109
4356
I
I
47
I i I i I f
I Study of 23 Villages in the Central District rict
I I I bull bull
The above table demonstrates that among those where the question IS
relevant a fotal of 2139 different daily living skills need to be learned by these disabled persons with an average of 21 skills per disabled person living in the~e communities These results indicate the need for CBR projects
I
that can actively take part in assisting the disabled in performing activities of daily living1 releasing pressures off the disabled as well as their caretakers
Iwho are usually women I
55 cokmunity IntegrationI
I The degree to which persons with disabilities are integrated into their
community [was measured by the level of participation of disabled people in a variety of family social and educational activities Analysis of the data on children revealed the following
I T1BLE 11 Selected Social Activities of Children with Disabilities
I PERCENT OF TOTAL ACTIVIT~
NUMBER OF CHILDREN I I
Plays regularly with peer children lt 15 71
I Plays as a younger childwith younger 19 children I
IDoes not play at all 10
I I
I I
6-I8 years old goes to school regularly 52
I Went to school as a younger childno 4 homework
INo 35I
I i
Special rehabilitation school 9
I
rIfI
II
I
I IIii
48 Study of 23 Villages in the Central District
I The above table is interesting in more than one respect Firstly 10
percent of children do not play at all 19 percent play with younger childrenas ia younger child and 71 percent play regularly This contrasts with the Jenin data where a high 25 percent of the children were found not to play at all 21 percent were found to playas younger children and 54 percent were found to play regularly Although it is impossible to ascertain with accuracy the causesI of these differences between the different areas the data suggests that children in the central area communities are relatively more integrated than in theIJenin area assuming a similar degree of disablement
The above table also shows that 52 percent of the central area disahled children go to school 4 percent go to school as younger peers 9 percent go to special rehabilitation schools and a high of 35 percent do not go to school at all In lenin it was found that 43 percent of children go to school regularly 5 percent as younger children 7 percent with no homework and a high of 44 percent do not go to school These results do reinforce the suggestion that due to the accessihility of services in the central area shy
Imiddot
I
special rehabilitation schools for instance - in addition to other factors such as knowledge and exposure to alternative services for disabled people disabled children in the central area are relatively more integrated than the lenin area Nevertheless these results also demonstrate that a high proportion of children with disahilities do not have access to school and do not play
I adequately making children a priority for the CBR project operating in the area I
Examining this data in terms of the community in which these children
live wf noted a significant difference among the children in terms of attendance of school hy catchment area
I
49 ct
lO er th ly re -y ts ~d
~d
~o
01 01 a
he l shy
h e he m ay he
en of
Study of 23 Villages in the Central District
TABLE 12 Childrens School Attendance by Catchment Area
- Percentage of Catchment Area Category -
Beit Dr Nilin Kharbatha
I Yes go to school 51 41 36
I As younger or no homework 1 9 6
No 43 44 43
Special I
rehabilitation school 5 6 15
I I
Chi square = 2086095 p lt 0005
The above table shows that 51 percent of the disabled children of Beit Dr go to school normally in contrast to 41 percent in Nilin and a low of 36 percent in Kharbatha The lowest level of school attendance in Kharbatha can be explained in terms of the children there attendinghaving access to rehabilitation school with 15 percent of the children attending such schools in contrast to 6 percent in Nilin and 5 percent in Beit Dr In contrast 43 percent of the children of Beit Dr do not go to school at all compared to 43 percent fori Kharbatha and 44 percent for Nilin Thus it appears that Nilins children ar~ a priority for action
I
I
I
r 50 Study of 23 Villages in the Central District
I
School Attendance by Catchment Area Percen1a ge0 f Catch rrent Catsgory
8J----r----------~----_r_-~=-~
------------1
e I Goas to sctcd Y(lJrgerlro hl lrelMfkI I
middot middot middot i
10
JJ
Ngt CatdmertArm CatEgay
Le~rd
o 8ErtU e Nlin
E3 KIBboth a
A rather interesting and inexplicable relationship was noted between the rate of att~ndance of disabled children in schools and whether the locale is a
central or peripheral village Usually the assumption is that because central village families have access to schooling more so than peripheral ones one would expect that central village disabled children would be more integrated in schools than in peripheral villages However in this survey it was found that a high of 50 percent of central area village children do not go to school I at all in contrast to 33 percent for peripheral village children (Chi square = 1O7879 p= 029) These results suggest that factors other than accessibility are operational here impeding access of central village disabled children tq schools Stigma is believed to be a factor by field workers who have observed that stigma associated with disability is more strongly felt I among fa~ilies living in central villages relative to peripheral ones We will have a chance to examine this question later in this analysis
I
I Examining the data on social integration for the disabled population as a
whole wei find the following II I i I
I
51
i
iI
t
- Percentage of Total Population of Disabled shy
ACTIVITY PERCENTAGE OF TOTAL
Regularly joins family activities 90
Sometimes i 6
Not at all 4
III
i II
I
I
II
i
III
j
I
I I
i
ii
Regularly joins social activities 68
Sometimesi 15
Not at all I 17
Regularly Ihas jobincome 20
Sometimek has jobincome 8
No job or income 78
I
a I
III
1
1 )
t
I
i Study of 23 Villages in the Central District
TABLE 13 Selected Social Activities of Persons with Disabilities
The lbove table contrast with the Jenin area villages in that while 90 percent
I olf the disabled stated that they regularly join family activities in this
survey only 62 percent of the lenin area disabled responded positively to the
1
IiiII
52 Study of 23 Villages in the Central District
I
III
I III
question Additionally 68 percent of the disahled in this survey reported regularly joining social activities in their community in contrast to only 29 percent of the disabled in the lenin area These results demonstrate a significant difference in the integration of disahled people with the central area disabled appearing to he rather more integrated into community life than the lenin villages Even when it comes to having a job or regular area income the difference is clearly in favour of the central area villages with 20percent of the disabled in the central area reporting having a regular job or income in contrast to only 8 percent among the disabled of the lenin area These results were consistent across different age categories where children adults and older people appeared to have a similar pattern of integration indicators riegating an explanation of these results in terms of age Given also that th~ large majority of the disabled in this population are suffering from moderate to severe disabilities it does not make sense to suggest that they are better integrated than other disabled because their disabilities are of the mild type
I
I Examining the level of integration in terms of catchment areas we found
a significant but weak relationship denoting that Nilin area disabled are less integrated socially than the other areas with 72 percent of the Beit Ur area disabled stating that they regularly join social activities in contrast to 68
I
III
percent of Kharbathas disabled and a low of 60 percent for Nilins disabled The relationship disappeared when relating catchment to family activities While care must be taken not to make out of this data more than it can yield these results suggest that Ni lin disabled people are less socially integrated than the rest in consistency with the previous findings pointing to Nilin disabled people as a priority for action
Service Provision for Disabled People 56
I On the whole a high of 81 percent of the disabled of these communities
had sought services related to their disabilities in the past in contrast to a
I
II
low of 57 percent for the lenin area villages Of those who received services the large i majority - 91 percent - received medical or medically related
53 iet
ed 29
a raj an lar 20 or a n on en 19 lat of
Id ss ~a
8 1 s I ~d
III
s a d
Study of 23 Villages in the Central District
services such as operations special tests medications or physiotherapy and only 9 perce~t received rehabilitation services and training Interestingly only 4 reported that they had sought Arabic Medicine for a cure There were no appreciable differences in the receipt of services among the catchment areas
i i
Examining the receipt of service in terms of the community in which the disabled live there were significant differences noted with a high of 27 percent never having received any service in Nilin in contrast to 18 percent for Beit Dr I and 17 percent for Kharbatha with 70 percent of the Beit Dr disabled having had medically related services in contrast to 71 percent for Nilin and 79 percent for Kharbatha and a high of 12 percent of the Beit Dr disabled having received rehabilitation services in contrast to a low of 3 percent for Ni lin and 4 percent for Kharbatha (Chi square = 343195 P = lt 0005)
Receipt of Services tJy Catctrrent Area
Percena ge 0 f SeN ce Category I aJ 7-r--------------==-------r--------------
Legmir i
4)+----1
70H- _i m BatU I
I EDci--------- shy
I i
9]H----------shy I 4J-+--__~ _ I 3)-t--~-~----
I I
I 10
o
I Sa-vire Qt ~ ay
o Nlin
o Ktarbaha
Malicas av ire
I A simdar pattern was noted when comparing central and peripheral
villages 21 percent had no services 66 percent had medical services and 13
54 Study of 23 Villages in the Central District
percent had rehabilitation services for the central villages as opposed to 19 percent with no services 75 percent with medical and 6 percent with rehabilitation services for the peripheral villages (Chi square = 107879 P =003) These results indicate that although the large majority did receive I some form of service services accessible to disabled people remain mostly of the medical type and identification of the difference needs of service for this population required a concerted effort from the part of the CBR team to uncover with the aim of fulfilling them These results also demonstrate that peripheral areas have relatively less access to services even of the medical variety than the central ones with this highlighted once again in the Nitlin area as a whole
r
I I
Receipt of Services by Village Location 1
Pe rcerta~ d servi ceCltiegory 80--------------------------~
Le~nd
70-+------------1 II Ca1t rallliDages
o Feripteral vaiagES 100-+--------shy
i i 50-+--------shyr
i 40-+--------- shy
30-+--------shy
20-1-shy
10-+-shy
o No9ll4ce Rdlabilitaticn reNcervedical-raataI el4ce
SeNceCcteggtry
I
55 strict Study of 23 Villages in the Central District
to 19 57 Difficulties Faced by the Families of Disabled with
People879 I
Izeive I
When families were asked about the types of problems they faced as a this ly of
result of having disabled family members a high of 31 percent stated that m to they have no problem Of those who thought they had problems a low of 9 that percent believed that they had problems related to access to medical services
Iical or the search for a cure 15 percent denoted financial matters - such as an rilin income or job for the disabled person - as a major problem affecting family
life and a I
high of 40 percent noted that their problem is psychosocial the stigma or Ipsychological and social complications of disability making family life difficult Interestingly 5 percent noted that they have a problem in having educational access for disabled people and a high of 32 percent noted that daily physical difficulties in handling the disabled were the biggest
problems would face
Perceived Disabil~y-Related Protiems Percertags ci Reooted Prctgtlem
I Wediall-raatEd I
Educaticnal access
I Rnarciall-~mBit
FSyhcsocial
56 Study of 23 Villages in the Central District
Relating these responses to the age of the disabled person we find that psychosocial problems affect families with disabled children or adults to a much larger extent than families with disabled older people with 40 percent of families with disabled children and 49 percent of families with disabled members between 15-59 years noting psychosocial problems as important in contrast to 19 percent among families with disabled people who are 60 years or older Interestingly problems related to the physical difficulties of limited access to technical aids such as hearing aids and wheelchairs and the physical difficulties encountered by women in dealing with this situation were more strongly pronounced among families with older disabled people 59 percent of the families of disabled people who are 60 years or older noted this as a primary problem in contrast to 30 percent among families of disabled children and 24 percent among families of disabled adults 15-59 years (Chi quare = 4755373 P lt0005)
Perceived Importance of Problems Percertage d ~e Bracket
oo--------------------~--------_ L~nd
1m FSChaodal p-obkms irrpat3nto coosstl1echrical aidsirrpolta-rtso-+-shy
60
i 4O-+-shy
I I
i
I 20--t-- shyI
I
0---- shy
1559years 6O+-~ars fgtgeBlac~t
i
Clearly this data suggests that physical difficulties encountered by women - who are the caretakers of the disabled in Palestinian society - relate mostly to the presence of disabled older people and secondarily to children while stigma felt by the family that causes social and psychological problems
0-14yea-s I
I Il I i I
Ibull
57 rict
hat oa ent led III
ars ted the )n Ie ed of 59
Iy te
1
IS
I
Study of 23 Villages in the Central District I
i I I
is more pronounced among families of disabled adults and to a lesser extent children These results are consistent with the prevailing understanding that old age brings with it disabilities that are not the fault of the family but rather part of the ordinary life cycle while other disabilities carry with them blame disabled known
shame and the consequent psychosocial trauma not only for the child but for the entire family as well Indeed it is ordinarily
I
that the presence of disabled children within the family can compromise the marriage options of females within that family It is to this extent that I the disability stigma is felt in this society emphasising the importance for the CBR projects to systematically work on awareness building and consciousness change as the core of any community based disability rehabilitation project 21
I
I
Examining psychosocial problems - or stigma - on its own and relating responses pertaining to stigma to the locale where families live we found a pattern of difference among the different communities where a low of 31 percent of NiIin catchment area families noted stigma as a major problem in contrast to 40 percent among the Beit I Dr villages and a high of 45 percent among the Kharbatha catchment area villages Although these differences were not found to be statistically significant they potentiate the views of the field workers who believe that increasing urbanisation opening up to the urban area and modernisation increase the feelings of stigma related to disability among families These views appear to be consistent with the results of I this study that denote that the Ni lin catchment area is the least developed I of the areas The field worker observations are also potentiated by the finding that stigma is more strongly felt by families living in central villages relative to peripheral ones where a high of 48 percent of central village families reported stigma as a main problem they encounter in contrast to a low of 38 percent among peripheral village families
I
I i
I 21 It sh9uld be noted here that the responses obtained from disabled people relating
to the problem they face were complete for only one third of the disabled making it impossible to analyse the data adequately
I II
I
58 Study of 23 Villages in the Central District
58 Gender
As Appendices I IIA lIB and lIe indicate disabled males outnumbered disabled females in the communities overall and in each of the catchment areas with 56 percent of the disabled being male and 44 percent being female This contrasts with the proportion of women relative to men in these communities where women were found to compose 499 percent of the total population This discrepancy in the ratio of males to females requires further
I
study Although one can argue that this could be explained by a higher rate of disability among males because of biological as well as social or work reasons it could also be argued that the combined effects of being disabled and being female in Palestinian society could be leading to the premature death of disabled females Although it is beyond the scope of this study to examine the way in which gender articulates with disability to produce specific physical as well as mentallife condition effects on disabled women an attempt was made to compare the conditions of sexes given the limitation of available data and with the perspective of identifying priorities for action
There were no relationships between sex and disability rate by catchment area nor by centralperipheral village locale Likewise there were no relationships found between the sex of the disabled and their abilities in the activities of daily living That is theoretically given similar abilities disabled males and females should rate similarly in social integration indicators given that no determinant other than the disability itself is operational However cross-tabulating social integration indicators by sex revealed significant differences in social integration levels between males and females in favour of males and as follows
Study of 23 Villages in the Central District ct
TABLE 14 Social Integration Indicators by Sex of Disabled Person
- Percentage of Sex Category shy
~d
at
19 e al ~r
Males Females
PLAY - FOR CHILDREN ONLY
Yes 66 52I
As younger I 13 22 No I 21 26I
Chi square =74921 p=002 i
GOES TO SCHOOL-FOR CIDLDREN OF SCHOOL AGE 6 TO 18 YEARS-Yes i 48 42 As younger 1 0 No homework 6 0 No i 37 50 Special rehabilitation school 7 8
Chi square =1182295 p =0018
JOINS SOCIAL ACTIVITIES
Yes
73 62
Sometimes 13 18 No i 14 20
Chi square =132354 p= lt0005 i
RECEIVED SERVICES
Yes I 83 79 No services at all 17 21
Chi square =404255 p=0044
l
n
It
o e
1
S
(
I
60 Study of 23 Villages in the Central District
As the above table demonstrates and given similar abilities between disabled males and females in these communities women tend to consistently be at a disadvantage Notice for instance that 21 percent of disabled male children do not play at all in contrast to 26 percent among disabled females 37 percent of disabled male children do not go to school at all compare with a high of 50 percent for disabled females 14 percent of disabled males do not join social activities at all compared with 20 percent of disabled females and 17 percent of disabled male children have not received any service at all compared with 21 percent of disabled females These results clearly demonstrate the impact of gender relations on disability specifically highlighting the negative impact on the integration level of females relative to males These results reiterate the need to view and define disabled women as a priority for the activities of the CBR project
i
I
IIIIIiiI I
i
61 rict
een itly lale es ha not md all rly lly rve len
I Study of 23 Villages in the Central District
60 SUMMARY AND CONCLUSIONS
61 Summary of Study Findings I
This study was based on data collected in a house-to-house survey conducted in 23 villages in the central area of the West Bank A total of 4793 households were visited representing about 80 percent of the total number of households in these communities The average family size was found to be 69 persons per family for the visited households The large
I
majority were found to be original inhabitants of the area while 13 percent were refugees The male to female ratio was almost identical with females
representing ~99 percent of the population
I
Despite the proximity of these villages to the Ramallah urban area and to Jerusalem they nevertheless continue to suffer serious socio-economic problems and general underdevelopment With the majority of household heads working as wage labourers these villages today suffer the economic crunch that resulted from the closure of the occupied territories and the resultant inability of wage workers to enter Israel in search of wage labour opportunities
j
The overall educational attainment of male and female househeads was found to be generally low with an average of 7 years of schooling formales relative to a lower 42 years for females
I
I This survey succeeded in identifying 1056 disabled people living in these
communities Of those 56 percent were males and 44 percent females once
1 I
62 Study of 23 Villages in the Central District
again replicating the pattern observed in the northern region of the West Bank and in the Gaza Strip where disabled males outnumber disabled females and suggesting a pattern of discrimination against disabled females leading to premature death The mean age of the disabled was found to be 359 years considerably higher than the mean found for the northern area villages and for the G~a Strip and with a high of 36 percent of the disabled population being 50 years or older The data pertaining to the length of the period of being disabled was also generally indicative of the prevalence of disabilities of longer term duration with a high of 39 percent of the disabled reporting having had their disabilities for 20 or more years 23 percent for 10-19 years 17 percent [for 5-9 years and 21 percent for 0-4 years The majority of the disabled were found to suffer from moderate and severe disabilities with only 4 percent denoting their disability as of the mild type and indicating the need for CBR projects in these communities
In total 25 percent of the disabilities were related to movement a high of 44 percent i were related to the sensory system - sight hearing and speech shy
I
and 31 percent were multiple in nature mental mixed with other types of disabilities This pattern generally replicates the trend already found in the north of I the West Bank and in the Gaza Strip except for the overshyrepresentation of sensory disabilities within this population Controlling for age the data revealed that the majority of sensory disabilities pertained to older people and therefore should be categorised as the expected disabilities of old age rather than due to the specific circumstances of this particular population i Although one can also question the reasons for the apparent differences I in the rate of disability of old age among the different population studied in the West Bank and Gaza Strip unfortunately the answer to such a question is beyond the scope of this particular study
i
I What is important is to note is that overall a total of 2 139 daily living
skills are still not performed either adequately or at all by these disabled people Moreover the data also confirms the problem of the isolation of disabled people because of a combination of physical difficulties and social stigma and requiring immediate attention in the area of social integration
Study of 23 Villages in the Central District 63iet
programmes This is especially important in the case of disabled children and nk disabled women and girls who neither play nor go to school nor participate
to rrd
in communal life as equally as other members of their society and is
s definitely considered as a matter of priority I
ld in
Overall that data obtained in this study related to the general well being Jf of disabled I people and their families confirms the need for immediate
~s
assistance in the form of rehabilitation programmes focusing on not only 19 physical problems and their solution but also psychosocial problems leading
~
to isolation of disabled persons in these communities le h e
62 Priorities for eBR Programs
f
In line with the above findings it is recommended that f
1 The central area CBR programme takes the shape of not only individual assistance within homes but also the shape of communal education and action On the one hand the disabled people of the central area need assistance to solve their physical problems On the other hand an attempt to gradually change the negative perceptions of communities towards disability shystigma and shame - is very much part of disability rehabilitation in addition to being a fundamental human right
2 The CBR programme also takes into serious consideration the finding I
that a rather high percentage of the disabled in these communities are older people Given that old age can often lead to disability but that society perceives this type of disability in different ways than disabilities caused by other factors - certainly less stigmatising than disabilities occurring due to other causes - it is important that the programme is developed to fulfil this special need Specifically given that the largest percentage of disability
64 Study of 23 Villages in the Central District
related to the sensory system it is imperative that the central area programme links to accessible and affordable secondary services that are well linked into a network of assistance with the CBR programme and can therefore
adequately provide the needed technical aids as well as other forms of assistance needed by this older disabled population Indeed this is an emerging national priority not only because of the specific findings of this study but also because of the gradual change in the nature and relations within and around the Palestinian family Increasingly Palestinian families are becoming nuclear - about two-thirds of the families were found to be nuclear families in the West Bank and Gaza Strip by the FAFO study - more and more women - the traditional caretakers of older people - are moving into the labour force by virtue of economic necessity Yet there is no systematic and parallel evolution of networks of services and assistance to older people during these transitional times In other words it is precisely such groups that fall through the cracks in care systems during periods of change and it is precisely such groups that the CBR programme should pay special attention to
3 That the programme takes into serious consideration the special problems of disabled women and girls as gender relations in Palestinian society compound the effects of disability and pose a double burden on disabled women compared to disabled men That is it is highly recommended that the programme specifically focuses on the needs of disabled women and girls as a priority and as a high risk group
I
4 Finally disability rehabilitation is not merely a programme of assistance The Palestinian experience has developed in such a way that it is also a programme that is directed towards guaranteeing the fundamental human rights of disabled people In this vein an active involvement in animating and assisting the disabled and their families to speak forr
themselves to form their advocacy groups and call for the recognising of their rights is also very much part of the tasks of the staff in this emerging programme In this area consolidating relations with unions for the disabled is a task as imperative as conducting the technical practical work Through such an approach to disability rehabilitation that combines the technical with
Study of 23 Villages in the Central District 65
the human rights component the stage IS set for the central area CBR programme I s success in its endeavours
66 Study of 23 Villages in the Central District
APPENDIX I
Overall Characteristics of the 23 Central Area Villages
i III
Surveyed households Total number of households surveyed 4793 Estimated actual22 number of households
in the 23 communities of the central area studied 5800 Percentage of households surveyed 83 percent
Gender breakdown in surveyed household population Total population of surveyed households 33186
Males 1 16641 Females 1 16545
I
Percentage females 499 percent Children ( lt 15 years of age) 17035
Percentage children 51 percent
Mean household size 69 II
I
I Population origin Original inhabitants 87 percent Refugees 13 percent r
I
22 Based on HDIPs estimated total population of 40000 for the area and 69 for
average family size - see later in Appendix 1 II
III
I I
67 Study of 23 Villages in the Central District
Work of male household heads Unskilledsemi-skilled labourer 59 percent Private work 8 percent Office work- white collar 8 percent Farmer 7percent Unemployed in prison or retired - no work 18 percent
i
I
Education of male household heads None 15 percent 1-6 years 33 percent 7-12 years 42 percent 13-21 years 10 percent
Mean educational attainment 7 years
I
Work of female household head Homemaker 94 percent Embroidery and knitting in the informal sectorpart time 4 percent Farmer ~
I
I percent I
Other 1 percent I i I I
i
Education of female household heads None 40 percent 1
1-6 years J 31 percent I
7-12 years 27 percent 13-16 years i 2 percent
Mean educational attainment 42 years
I
Total number working in household None 8 percent One person 78 percent 2-5 persons 14 percent
68 Study of 23 Villages in the Central District
Home ownership Own ~ 95 percent Rent
Ibull 4 percent
Family owned 1 percent
Total number of rooms in house Up to 2 rbullbullbullbullbullbullbullbullbullbullbullbullbullbullbullbullbullbullbullbullbullbullbullbullbullbullbullbullbullbullbullbullbullbullbullbullbullbullbullbullbullbullbullbullbullbullbullbullbullbullbullbullbullbullbullbullbullbullbullbullbullbull 53 percent 3 to 4 41 percent r
5 to 8 1 6 percent Mean number of rooms in house 26 rooms
House type i Stone 24 percent Concrete 75 percent
Household wealth status Doing very well by village standards 12 percent Managing 46 percent Barely able to manage 42 percent
Disabled persons Total disabled 1056 Estimated percentage disability in these communuies- 26 percent
Number of disabled persons by households Households with one person disabled 67 percent Households with more than one person disabled 33 percent
I
23 Based 011 HOIPs population estimate of 40000 persons
Study of 23 Villages in the Central District 69
Gender of persons with disabilities Male Female
56 percent 44 percent
Age of persons with disabilities o to 4 years 5 to 9 10 to 14 15 to 49 50 to 95
Mean age of disabled
7 percent 11 percent 11 percent 35 percent 36 percent 359 years
Length of disability o to 4 years 5 to 9 years l 10 to 19 years 20 or more years
Mean years disabled
21 percent 17 percent 23 percent 39 percent 20 years
Severity of disability Mild Moderate Severe
4 percent 46 percent 50 percent
i
I
70 Study of 23 Villages in the Central District
APPENDIX II-A
Characteristics of Beit Ur al-Tahta Catchment Area
(Beit Ur al-Tahta Beit Sira AI-Tireh Saffa Beit fUr al-Foqa i Beit Liqia and Kharbathat Misbah)
I Surveyed hou~eholds Total number of households surveyed 1911 Total population of surveyed households 13293
Males 66141
Females rI
6679 Percentage females ~ 50 percent
Children ~ 15 years of age 6947 Perc~ntage children 52 percent
I I
Mean household size 7 persons
Population origin Original inhabitants 86 percent Refugees 14 percent
Work of male household heads Unskilledsemi-skilled labourer 60 percent Private work 9 percent
Office work- white collar 7 percent Farmer 7 percent Unemployed prison or retired- no work 17 percent
71Study of 23 Villages in the Central District
Education of male household heads None ibullbullbullbullbullbullbullbullbullbullbullbullbullbullbullbullbullbullbullbullbullbullbullbullbullbullbullbullbullbullbullbullbullbullbullbullbullbullbullbullbullbullbullbullbullbullbullbullbullbullbullbullbullbullbullbullbullbullbull 13 percent 1-6 years 33 percent 7-12 years i bull bull bull bull bull bull bull bull bull bull bull bull bull bull bull bull bull bull bull bull bull bull bull bull bull bull bull bull bull bull bull bull bull bull bull bull bull bull bull bull bull bull bull bull bull bull bull bull bull bull bull bull bull bull bull bull bullbull 44 percent 13-21 years 10 percent 1 bullbullbullbullbullbullbullbullbullbullbullbullbullbullbullbullbullbullbullbullbullbullbullbullbullbullbullbullbullbullbullbullbullbullbullbullbullbullbullbullbullbullbullbullbullbullbullbullbullbullbullbullbullbullbullbullbullbullbull
Mean educational attainment 71 years I I I I i
Work of female household heads Homemaker
I
90 percent Embroidery and knitting in the informal sectorpart time 9 percent Private work jbullbullbullbullbull 1 percent
I I I
Education of female household head None Jbullbullbullbullbullbullbullbullbullbullbullbullbullbullbullbullbullbullbullbullbullbullbullbullbullbullbullbullbullbullbull 38 percent 1-6 years i bullbullbullbullbullbullbullbullbullbullbullbullbullbullbullbullbullbullbullbullbullbullbullbullbullbullbullbullbullbullbullbullbullbullbullbullbullbullbullbullbullbullbullbullbullbullbullbullbullbullbullbullbullbullbullbullbullbullbullbull 30 percent 7-12 years 30 percent 13-16 years 2 percent
Mean educational attainment 44 years
Total numberworking in household I
None 7 percent 1
I
One person 77 percent 2-5 persons 16 percent r
1
i Home ownership Own bullbullbullbullbullbullbullbullbullbullbullbullbullbullbullbullbullbull 95 percent Rent ~
i 5 percent
Family owned none
Study of 23 Villages in the Central District 72
Total number of rooms in house Up to 2 48 percent 3 to 4 43 percent 5 to 8 9 percent
Mean number of rooms in house 27 rooms
House type Stone 17 percent Concrete 83 percent
Household wealth status Doing very well by village standards Managing J
Barely able t9 manage
13 percent 47 percent 40 percent
I Disabled persons Total disabled Estimated percentage disability in these communities-f
474 25 percent
Number of disabled persons by households Households with one person disabled Households with more than one person disabled
68 percent 32 percent
73 Study of 23 Villages in the Central District
Age of persons with disabilities o to 4 years 5 to 9 10 to 14 15 to 49 50 to 95
Mean age of disabled I I i
Mean Length of disability j
i Severity of disability Mild Moderate 1
Severe ~
7 percent 13 percent 11 percent 34 percent 35 percent 351 years
196 years
3 percent 49 percent
48 percent
bull
74 Study of 23 Villages in the Central District
APPENDIX II-B
Characteristics of Nilin Catchment Area (Nilin Qibia al-Midieh Budrus and Shubtin)
Households Surveyed Total number of households surveyed 1035 Total population of surveyed households 6752
Males 3433 Females bullbullbullbullbullbullbullbullbullbullbullbullbullbullbullbullbullbullbullbullbullbullbullbullbullbullbullbullbullbullbullbullbullbullbullbullbullbullbullbullbullbullbullbullbullbullbullbullbullbullbullbullbullbullbullbullbullbullbullbullbullbull 3319
Percentage females 492 percent Children laquo 15 years of age) 3606
Percentage children 534 percent
Mean household size 65 persons
Population origin Original inhabitants 88 percent Refugees 12 percent
Work of male household heads Unskilledsemi-skilled labourer 59 percent Private work 8 percent Office work - white collar 7 percent Farmer 7 percent Unemployed in prison or retired - no work 19 percent
75 Study of 23 Villages in the Central District
Education of male household heads None 17 percent 1-6 years 35 percent 7-12 years jbullbullbullbullbullbull 38 percent 13-21 years 10 percent
Mean educational attainment 67 years
Work of female household heads Homemaker 97 percent Embroidery and knitting in the informal sectorpart time 2 percent Other - office private and farmer 1 percent
Education of female household head None 43 percent 1-6 years 35 percent 1
7-12 years ~ 20 percent 13-16 years 2 percent bull
Mean educational attainment 37 years
Total number working in household None 9 percent One person 83 percent 2-4 persons 8 percent
Home ownership Own 94 percent Rent 6 percent
Study of 23 Villages in the Central District 76
Total number of rooms in house Up to 2 61 percent 3 to 4 i 35 percent 5 to 8 4 percent
Mean number of rooms in house 239 rooms
House type Stone 15 percent Concrete i 85 percent
I Household wealth status Doing very well by village standards 10 percent Managing 43 percent Barely able to manage 47 percent
Disabled persons Total disabled 199 Estimated percentage disability in these communities-gt 21 percent
Households with one person disabled 69 percent Households with more than one person disabled 31 percent
Sex of persons with disabilities Male 59 percent Female bullbullbullbullbull bullbullbullbullbullbullbullbullbull 41 percent
25 Based on HDI~s population estimate of 9330 persons
77 Study of 23 Villages in the Central District
Age of persons with disabilities o to 4 years 7 percent 5 to 9 11 percent 10 to 14 14 percent 15 to 49 31 percent 50 to 95 37 percent
Mean age ofdisabled 363 years
Mean Length of disability 201 years
i I
Severity of disability Mild ) 7 percent Moderate 45 percent Severe 48 percent
~
Study of 23 Villages in the Central District 78
APPENDIX II-C
Characteristics of Kharbathat Bani Hareth Catchment Area
(Kharbathat Bani Hareth Ras Karkar Deir Qaddis Bilin Kufr Nimeh Beit Nuba Deir Ammar Deir Ibzi
al-Janieh Beit Illu and Jammalah)
Surveyed Households Total number of households surveyed 1847 Total population of surveyed households 13141
Males 6595 Females 1 6546
Percentage females 498 percent Children laquo 15 years of age) 6562
Percentage children 499 percent
Mean household size 71 persons
I I
i I
Population origin Original inhabitants 88 percent Refugees 12 percent
Work of male household heads Unskilledsemi-skilled labourer 59 percent Private work 7 percent Office work- white collar 9 percent Farmer 7 percent Unemployed in prison or retired- no work 18 percent
79 Study of 23 Villages in the Central District iet
Education of male household heads None 16 percent 1-6 years 31 percent 7-12 years 42 percent 13-21 years 11 percent
Mean educational attainment 71 years
Work of female household heads Homemaker 97 percent Embroidery and knitting in the informal sectorIpart time 1 percent Other - office private an farmer 2 percent
i
Education of female household heads None 39 percent 1-6 years j bullbullbullbullbullbullbullbullbullbullbullbullbullbullbullbullbullbullbullbullbullbullbullbullbullbullbullbullbullbullbullbullbullbullbullbullbullbullbullbullbullbullbullbullbullbullbullbullbullbullbullbullbullbullbullbullbullbullbullbullbullbullbull 31 percent 7-12 years 27 percent 13-16 years 3 percent
Mean educational attainment 44 years i
I i
Total number working in household None 8 percent One person 77 percent 2-4 persons 15 percent
Home ownership Own jbullbullbullbullbullbullbullbullbullbullbullbullbullbullbullbullbullbullbullbullbullbull97 percent Rent 3 percent
80 Study of 23 Villages in the Central District
Total number of rooms in house Up to 2 53 percent 3 to 4 ~ 42 percent 5 to 8 t 5 percent
Mean number of rooms in house 25 rooms
House type Stone i bull 35 percent
i Concrete Jbullbullbullbullbullbullbullbullbullbullbullbullbullbullbullbullbullbullbullbullbullbullbullbullbullbullbullbullbullbullbullbullbullbullbullbullbullbullbullbullbullbullbullbullbullbullbullbullbullbullbullbullbullbullbullbullbullbull 65 percent
i
i I
Household wealth status Doing very well by village standards 13 percent Managing 46 percent Barely able to manage 41 percent
Disabled persons Total disabled 383 Estimated percentage disability in these communities-s 32 percent
Households with one person disabled 66 percent Households with more than one person disabled 34 percent
Gender of persons with disabilities Male ~ 55 percent Female 45 percent
26 Based on HDIPs population estimate of 12000 persons
81 Study of 23 Vlllages in the Central District
I
Age of persons with disabilities oto 4 years 7 percent 5 to 9 ibullbullbullbullbullbullbullbullbullbullbullbullbullbullbullbullbullbullbullbullbullbullbullbullbullbullbullbullbullbullbullbullbullbullbullbullbullbullbullbullbullbullbullbullbullbullbullbullbullbullbullbullbullbullbullbullbullbullbullbullbullbullbull 9 percent 10 to 14 10percent 15 to 49 39 percent 50 to 95 36 percent
Mean age of disabled 367 years
Mean Length of disability 206 years
I i
Severity of disability Mild 4 percent Moderate 42 percent Severe 54 percent

II
I
II
8 [ Study of 23 Villages in the Central District
I Becaus1e of logistic problems it was not possible for the survey team to
compile information pertaining to all the households in the communities although it was possible to interview almost all of the disabled and gather the needed information about their indivdual situations needs and problems
I
The information obtained from the survey was coded to prepare it to be processed by computer The Standard Package for the Social Sciences (SPSS) statistical analysis package was then used to analyse the data The statistical results were then combined with the narrative report of the workers and supervisors in order to prepare this report
I
For the purpose of analysis and representing the general geographic service and socio-economic relationships among the different communities the 23 villages were divided into three catchment areas each catchment area including a central village where the transport telephone and service network services the other communities within the catchment area The name of the central village has been used to represent the catchment area Thus the Beit Ur al-Tahta catchment area included Beit Sira al-Tireh Saffa Beit Ur alshyFoqa Beit Liqia and Kharbathat Misbah Nilins catchment area included Qibia al-Midieh Budrus and Shubtin Kharbathat Bani Hariths catchment area included Ras Karkar Deir Qaddis Bilin Kufr Nimeh Beit Nuba Deir Ammar Deir Ibzi al-Janieh Beit Illu and Jammalah
9
r trict
m to ties ~ the
o be )55)
tical and
hie ies uea -ork the Beit alshyded lent )eir
Study of 23Villages in the Central District
I
I I I
30 GENERAL DESCRIPTION OF SURVEY POPULATION
I
31 Estimates of Population Size and Rate ofi
Disability I
i Due tb logistic problems associated with entering and surveying all the
households in the survey area it is impossible to accurately ascertain the size of the population and the overall percentage of disability found in these 23 communities What can be ascertained is that there are at least 1056 disabled people in these communities that require some sort of rehabilitation assistance as it was reasonably well established that the survey team obtained
I
basic and reliable information about almost all of the disabled people living in these conkIunities but not all the households What can be said about the population is equivocal the field workers succeeded in surveying 4793 households which did not include all the households where disabled people live That] is while information related to disabled people is almost complete
I
information pertaining to their households is not However it was possible to calculate the average family size for the surveyed households found to be 69 persons per household
I
I
To e~timate population size we examined the community based I
rehabilitation programme records These indicated that there are 5255 families registered as having been contacted by the CBRproject and living in these communities However the Health Development Information Project
J I i
I
i I
I I
10 Study of 23 Villages in the Central District
I estimates the population in these villages to be around 40000 persons
I
therefore we have estimated that the CBR project succeeded in reaching about 80 percent of the households found in these communities and the majority of disabled community members who require rehabilitation services Based on HDIPs estimation of population it is reasonable to conclude that the rate of disability in this community is around 26 percent of the total population
I
I 32 Distribution of Population by Origin
I
I The population in these villages was found to be mostly homogenous
with the majority of the population - 87 percent - composed of original inhabitants and the remaining 13 percent holding refugee status (See Appendix I) The percentage of refugees in all three catchment areas were similar making up 14 percent of the Beit Ur Catchment Area and 12 percent in both the Nilin and Kharbatha catchment areas The majority of these villages are located close to the 1948 armistice line Many lived in the villages where they still live today but their agricultural land became part of the State of Israel in the post-1948 period Those were granted refugee or semi refugee status by the United Nations Relief and Works Agency (UNRWA) as they had technically lost their livelihood andor their homes
I
with their land being on one side of the border and domicile on the other This explains the presence of the relatively large proportion of refugees in some of these villages 6 percent of the population in Ras Karkar 5 percent in Deir Qaddis 18 percent in Nilin 9 percent in Beit Sira 75 percent in al-
I
Tireh 9 percent in Satta 12 percent in Beit Ur al-Tahta 8 percent in Beit Liqia 100 percent in Beit Nuba 53 percent in Deir Ammar 56 percent in Budrus 8 percent in Beit Illu 6 percent in Kharbathat Bani Hareth and 7 percent in Kharbathat Misbah Note however that the percentage of refugees
I
I i
1 Barghouthi M and Daibes 1 Infrastructure and Health Services in the West
Bank Guidelines for Health Care Planning the Health Development Information Project Ramallah 1993 pp314-316
11 rict
1S1
lout yof l on ~ of
iUS
nal See ere ent ese the of or
ICY
es er in
ent alshyieit in
i 7 ~es
est
ion
Study of 23 V~llages in the Central District
I I
in the area las a whole is close to the percentage found for the lenin area villages - 1~ percent - the focus of a similar study- to this in 1992-93 and
where a CBR project is in full operation today However this is a considerably lower proportion of refugees than figures cited for the West Bank Oust over one quarter of the population) and the Gaza Strip (roughly two-thirds of the populatiom This is because generally speaking refugees
tend to live] in concentrations within refugee camps and only a relatively small proportion were settled in the urban and rural communities of the area
I I
Population origin and refugee status are significant factors in the initiation and operation of a community based rehabilitation programme for disabled people in that those holding refugee status and their families have access to UNRWA services - especially health educational and social
I
services - that are crucial for the viability of rehabilitation within the community iIt should be noted that UNRWA services are free of charge are able to reach all refugees and are often more developed than those offered by the governmental sector This is understandable in view of the years of military rule and the associated neglect of the public sector that has taken
I
place since 1967 In areas where there are no refugees the population has had to rely on severely curtailed governmental services and on the expanding nationalist iNG04 service delivery system Although this NGO network did
succeed in ideveloping an infrastructure of services a new rather well developed and appropriate approach to service provision and an infrastructure of resistance to occupation it has not and could not have been able to fulfil the needs everywhere particularly in remote and rural
I
i
2 Giacamari R and Jarrar A A Study of 22 Palestinian Villages in the Jenin
District with Special Reference to the Needs of Persons with DisabilitiesThe Northern Regional Committee for Rehabilitation 1994 p14 Henceforth called the Jenin Study
3 Heiberg M and Ovensen eds Palestinian Society in Gaza West Bank and I
Arab East Jerusalem A Survey of Living Conditions FAFO- Report 151 May 1993 p360 Henceforth called FAFO Survey
4 Non-Govemmental Organisation
Study of 23 Villages in the Central District12
cornmunmes because of its nature limitations of finances and context Thus although the central area of the West Bank is known to be privileged to have a network ofPalestinian NGO services focusing on rural areas it is important to note that areas such as the communities that we have studied continue to be deprived 1 of basic services This is a result of the fact that few of the central area services are adequately linked to rural communities with the needed infrastructure including referral procedures This is important in that the success or failure of the CBR programme will also depend on the ability of the programme to link with existing communities basic services or to develop them where absent
I
I I
33 Distribution of Population by Gender
I The overall ratio of males to females in the study population was found to
be almost as expected world-wide with 499 percent of the population composed of females These results are very close to those obtained in the FAFOs Palestinian Society in Gaza West Bank and Arab Jerusalem A Survey of Living Conditions where adult females over the age of 15 years composed 50 percent of the population However theFAFO study also noted a slight over-representation of males in the ages 60 years or alders while an
analysis of PAFO infant mortality data also indicates a slight overshyrepresentation of males in the infant and early childhood years This
information indicates that despite an overall gender distribution that is almost equal in these villages discrimination against women and girls leading to premature death relative to males cannot be ruled out but cannot be ascertained either However the FAFO results draw attention to undue female infant death as well as the premature death of women in older age relative to imen in the same age category This is important as we have
i
I S FAFO Survey opcit pp44-45 See original footnote for complete reference
i i
6 This analysis of infant mortality differences by sex was conducted by Rita
Giacaman utilizing the PAPO Survey data set
13
i
II
II
II
I Study of 23 Villages in the Central District
II
I hus we ant ~ to the the hat ity to
consistently observed the presence of a higher number of males with disabilities in comparison to females as the CBR projects continue to encompass new areas and as communities continue to be surveyed Such results indicate a need to pay special attention to women girls and especially disabled females when operating community based rehabilitation projects
34 Household Size
i The average household size within the overall survey population was
found to be a somewhat surprising high of 69 persons compared to 65 persons per household for the lenin district villages7 As with the lenin
j
to peripheral ones with an average of 66 members in central village families
Nilinvillages the central villages of Kharbathat Bani Hareth and Beit Ur al-Tahta found to have relatively smaller family size than the were a
on
settingexposed-I
and 7 members in peripheral village families perhaps an indication of the he within which central village members live relative to more A peripheral ones
lfS
ed It is I
generally assumed that northern area rural communities tend to be an more under-developed than central area ones mostly because the central area er- of the West Bank offers the possibilities of access to a variety of services lIS including educational and health institutions Within the context of this )st assumption one would have expected smaller family sizes for central area 1to villages as family size is often linked to general exposure improved
1ij
be ue e ve
Ieducational levels and general state of including access to services However it appears that such assumptions are
development within communities
not corroborated by the results of this study Field workers through observation d~ring the period of research in the villages and presently as
I 7 Jenin Study lopcit p15 See original footnote for complete reference
II
8 Exposed in~ this context means a proximity to urban life and its associated
lifestyles and ways of thinking iIi
1
Study of 23 Villages in the Central District 14
they are launching the project have come to believe that despite the I
proximity of these central area villages to main town centres and an abundance of services accessibility continues to be a major problem Clearly the scope of this study does not allow for an adequate explanation of this larger-than-expected family size in these villages although we have discussed the relationship between family size and educational level at a later stage in this report
I
Comparing family sizes in the different catchment areas with the average number ofchildren per household revealed the following
I TABLE 1 I
I Average Household Size and Number of Children by Catchment Area
I
Beit fUr al-Tahta Nilin Kharbatha
I
Average number of household member
i
7 65 71
Average number of 33 35 36 children
As the table above indicates the catchment area with the largest family size Kharbathat Bani Hareth with 71 persons per family is also the area with the largest number of children 36 However this tendency of higher family size and a higher number of children does not surface in the other catchment areas with Nilin having the lowest household size but not the lowest average number of children and with Beit Dr having a family size of
i
9 Kharbathat Bani Hareth has been shortened toKharbatha here and in future
tables
15
iI
I
II
Study of 23 Villages in the Central District strict
IiI
7 - almost that of Kharbatha - but the lowest average number of children One d an the
possible explanation of these results could be the presence of a larger arly proportion of extended families in Beit Ur when compared with the other f this catchment areas and higher fertility in Kharbathat relative to the other areas issed ge in
erage
lffiily area igher other Jt the ize of
future
16 Study of 23 Villages in the Central District
I
I
40 SOCIO-ECONOMIC STATUS OF SURVEY POPITLATION
I The sobo-economic status of the communities surveyed was examined
utilising selected socio-economic indicators including work and educational patterns of male and female heads of households crowding rates home
I
ownership I house type and wealth status Wealth status of individual households i was then cross-tabulated with various indicators to examine the relationships of the different indicators to each other I
I
I 41 Work Patterns amongst Household Heads
i
I Of the4793 surveyed households 8 percent reported that no one in their
household i
I
was working at the time of the survey in contrast to a high of 12 percent that was reported for the Jenin area villages Comparison of the two
I populations should be approached with caution as the two studies were conducted I a year apart from each other However this data suggests a lower rate of unemployment in the central area villages relative to the Jenin district It could be argued that the central area of the West Bank offers more work opportunities for labourers within the West Bank relative to the Jenin district and therefore relieves some of the economic tensions arising from the closure of Jerusalem and the consequent sudden isolation of many wage workers from their livelihood in Israel
i i
10 Jenin Study opcit p18 See original footnote for complete reference
17
r strict
nined tional home idual ie the
their of 12 e two
were lower strict work istrict osure from
I Study of 23 YiIIages in the Central District
I
I Among the adult male heads of households surveyed a high of 59 percent
worked as iwage labourers in an unskilled and semi-skilled capacity only 7 percent reported that they were farmers 16 percent worked as white collar workers or in unemployed at study where a
I indicating that continues to
a private capacity and 18 percent reported that they were the time of the survey These results contrast with the lenin
high of 18 percentreported that they worked in farming11
the economic base of the communities in the lenin Region include agriculture as an important source of income and
livelihood while in the central area communities wage labour predominates as a primary mode of income generation There were no appreciable differences in work patterns among the different catchment areas nor between central and peripheral villages Thus overall it appears that farming composed a very small proportion of the activities and livelihood of all 23 communities regardless of location or linkage to their central village and that on the whole these are communities of primarily wage labourers who seek work either in the urban areas of the West Bank or in Israel and who minimally rely on other modes of generating income within their communities
Examining patterns of work for female household heads we found that as expected the majority of female heads reported not working at all for pay rather working as full time home-makers while 4 percent reported that they worked part time or during their leisure time on knitting andlor embroidery
I earning some income this way The rest - 1 percent - worked in farming or as unskilled Iabourers Again comparisons with the Jenin villages are important in that IiI percent of the Jenin female heads of households reported that they worked as
farmers These results reinforce the notion that the Jenin villages
rely on farming and agricultural production as a relatively important mode of earning income in contrast to the central area villages which appear to have moved more substantially into wage labour in the West Bank and Israeli
Imarkets I
I
I 11 Jenin Study opcit ppl8-19 See original footnote for complete reference
Study of 23 Villages in the Central District 18
42 Educational Attainment amongst Household Heads i II
The results of this survey revealed an average of 7 years of educational attainment for male heads of households (Appendix I) with 15 percent having had no education at all 33 percent having between 1 and 6 years of schooling 42 percent between 7 and 12 years and 10 percent between 13 and 21 years of schooling These results are comparable to the results of male head educational attainment in the Jenin district where the average number of years of schooling was found to be 71 years Interestingly a difference in average educational attainment was noted among the catchment areas in this study with i an average educational attainment of 71 years for Beit I Urand Kharbatha catchment areas in contrast to a low of 67 years for Nilin the area that also has the lowest family size It is not known exactly how this correlation functions Field workers and project managers have isolated some
I
possibilities i for example it could be that larger families have a greater economic base with which to send members to school and beyond
Cross tabulating male head educational attainment with their work I
revealed the following results I
TABLE 2iI EducationalAttainment of Male Heads of Households by Work I - Percentage of Work Category shy
Education In Years
I
Labourer Farmer OfficelPrivate Retired unemployed
orison I
None I I 7 29 6 44 1
I
1 to 6 I 35 46 18 36
7 to 12 I 52 21 40 15 I
I
13 to 21 I 6 4 36 5
Chi square =1574 48321 P lt0005
19 ct
al 19 )f ld le )f n LS
d le lS
le r
k
Study of 23 Vnlages in the Central District
Labourer Farmer I
Yea-s d Eduabn by ~ercertage Yea-s d Eduabn by Percertage
il1tosli
~----I
71012
RetiredlUnempoyedlPrison YeCls d Eduabn by Percertage YeCls d Eduabn by Percertage
~-I
I
I36D1 i i
71012
I~
I Note thatthe table indicates that the highest proportion of those who have
no education at all are in the category of retiredunemployed with 44 percent having no education at all in contrast to 7 percent for labourers and 6 percent for officeprivate work respectively and 29 percent for farmers Given that it is known that many of those who work in farming are in fact
I
older it appears that those with minimal education represent the older generation and that educational attainment has gradually improved in recent years These results are consistent with the FAFO study results on
i i
I
OfficelPrivate
Study of 23 Villages in the Central District 20
educational patterns over time and relevant to both the West Bank and Gaza Stripl
Cross-tabulating educational attainment and type of work also shows a significant association with 55 percent of those who have a post high school education working in white collar jobs or privately in contrast to 34 percent of those with the same educational attainment who work as labourers and 4 percent among farmers (Chi square = 157448321 plt0005) Although a statistically significant association it is important to note that while education might determine type of work education itself is often found to be dependent on wealth status That is as an intermediate variable education can operate on its own determining type of work but educations influence on type of work can also be a reflection of class or wealth category We will have a chance to examine the relationship of work education and wealth at a later stage in this report
I Examining the relationship of educational attainment to the location of
these communities - central versus peripheral villages - as a measure of accessibility to services we found a significant relationship noting a better educational attainment of male heads of central villages relative to peripheral ones Specifically we found that 14 percent of central area village male heads of households stating that they had no education at all in contrast to 15 percent in peripheral villages - probably older people and reflecting the past rather than the present 27 percent having between 1 and 6 years of schooling in central villages in contrast to 34 percent in peripheral villages 47 percent having between 7 and 12 years of schooling in central villages in contrast to 41 percent in peripheral villages and 12 percent having more than 12 years of schooling in central villages relative to 10 percent in peripheral villages (Chi square = 1869292 P = lt 0005)
f
II
IIII
12 FAFO Survey opcit pp136-137 See original footnote for complete reference
rict Study of 23 Vlllages in the Central District 21 i
iaza
EducabnalAttairmeri ci Male Heeds Percertage ci vilIage bcation category
solIS a Legnd
1001 [Iill Periiral
cent CS1tralD40Id 4 zh e
tion 30 Ient rate e of 20
ve a ater
10
n of o
-middot middot middot
e of ~tter
eral I ads These tesults indicate that access to educational facilities in central ) 15 villages is superior to peripheral ones particularly as students approach past secondary school and university age Indeed these central villages do house
of secondary schools that cater to the needs of not only the students of their es village but I the students of nearby villages as well However difficulties in in i transport and having to move from one village to another for schooling shyhan i I
mostly secondary - appears to have a negative impact on educational eral I attainment Ireinforcing existing notions of the need to have services
accessible and within communities for effective provision and universal
I access
I As expected female heads of households were found to have considerablyI I lower education than their husbands with a mean of 42 years for females in tbull contrast to I 7 years for males This is surprising in that the average
co--shy
--0shyII bull
~H~
m1
m
II bullbull
II iiii
m
~ - I middot1 middot I I H middot
bull II I II bull
I
I I I I N01e 1-6 ~alS 7-12YEaS 12+~ars
Educaticnal Ala rrrent
educationalIce i t 4
if
iattainment for female house heads of the lenin district was found i
I i
Study of 23 Villages in the Central District 22 I I I
to be 47 yeats 13 These results continue to reinforce the need to raise
questions regarding the prevailing assumptions that central area villages are advantaged in terms of service provision and relative to the north or the south of the West Bank These results unfortunately suggest that despite the
I
relative abundance of general services including education health and transport in the central area such services do not appear to affect the rural communities concentrated as they are in the towns and leaving rural communities in a more under-developed state than is generally assumed
We found Ia significant association between female heads of households educational attainment and where these women live where once again the Nilin catchment area women fare worse than the others
i
TABLE 3 Educational Attainment of Female Heads of Households
I by Catchment Area I - Percentage of Catchment Area Category-
I
Educational IJevel I
in Years I
None
1-6
7-12
13-16
I
BeitDr Nilin Kharbatha
38 43 39
30 35 31
30 20 27
2 2 3
Chi Square =3477647 p= lt0005
i
13 Jenin Study opcit p24 See original footnote for complete reference
23 ict
rse
ire ith he nd ral ral
Is he
J5
Study of 23 Villages in the Central District
I The above table demonstrates that the highest percentage of female heads
of households is found in the Nilin area with 43 percent having had no education at all in contrast to 39 percent for Kharbatha and 38 percent for Beit Ur Similarly only 20 percent of Nilins female heads have had between 7 and 12 years of schooling in contrast to 27 percent for Kharbatha and 30 percent for Beit Ur While it is clear from these and earlier results in this study that the Ni lin area stands out one cannot conclude from this data that the educational levels of Nilin are inferior to the other catchment areas
This is because this data on education pertains only to female heads of households land does not include information pertaining to all ages As it stands it would be safe to state that in comparison with the educational status
of women of similar social standing - ie other female heads - the data suggests that the Nilin catchment area lags behind the others In this sense a picture begins to emerge where the Nilin area can be seen as a priority area for the activities of the central area CBR project
I i Educatonal Anairmert of Ferrale Heads I Percenta9= ri Ccichmert Area CaEgJry
50-+--------------- shy
0 Ho6
g 7to 12
D 1310 16 NflinEilitUr
20
30 -t---------gt r--=------t~ur1----
40-+---------il~-------
Le~nd
m Nme
I I
24 Study of 23 Villages in the Central District
I I
Examining the educational attainment of female heads of households in relation to i whether their domicile is in a central or peripheral village we
I
found that as is the case with male heads central village female heads have a significantly higher educational attainment than peripheral village ones with 35 percent of central area women having no education at all in contrast to 41 percent in peripheral villages and 29 percent of central area villages having I had between 7 and 12 years of schooling in contrast to 27 percent among peripheral village ones (Chi square = 1021184 p=0016) This relationship I
Iis weaker than the relationship between education and catchment area In addition it must be remembered that the overall level of educational I attainment for the central area female heads of households is considerably ilow That is although we note differences in locales in general terms all of the women heads of households in the central area appear to be educationally compromised relative to other areas I
IFerrale Hwsehecd Educational Attairment j
I Percentage ~ Village LocafQ1 f50i-T---------------r-------_~
40-t------
304-----
20+------
10+---shy
0+----shy
Le~nd
o R1ripreral A IIa~s
o Caltral Allage
middot bullbull I bullbullbullbullbullmiddot
bull I I bullbull I bull I bull
Ncne
-middot middot middot middot middot middot middot bull bullbull bull I bullbull --~-middot middot middot middot middot middot middot
~---~-----~--middot bull bullbullbull I bullbullbullbull middot bullbull bull bullbullbull bull I
I bullbullbullbullbullbullbull bull bull I bullbullbullbullbullbullmiddot middot middot middot middot middot middot
--------L--~---middot middot
YearsofEtlucaticn
Overall idata on educational attainment of both male and female heads of households indicate a relative deprivation in the Nilin catchment area and
25 rict
~m
we e a ith 41
mg mg hip In
nal bly of
Illy
I I I
I
I Study of 23 Villages in the Central District
peripheral areas relative to central ones This alerts the CBR project to the need to pay I a special attention to these deprived areas as education is so often shown t to be an important determinant of the health and well being of the family particularly the health and well being of disabled family members
I 43 Home Ownership Patterns
Consistent with what is normally found in villages in the West Bank this survey demonstrates that the large majority of inhabitants own their homes Specifically lit was found that 95 percent of the surveyed families owned their homes 14 percent rented them and 1 percent lived in homes owned by their extend~d families (Appendix I) This contrasts with the FAFO data that indicates thatl 26 probably reflecting villages 14 I
I
I 100
percent of the homes included in their survey were rented a considerably higher rate of home rentals in towns than
CentrallyeneaHome ONnershp Patterns Otvnership Categcry bfPercentlge
80 -
-60
40 -
20 -
o HOllEOMer Tenlllnl
OM-erSlip Ca1egcry
Farril)ltlMlef torre i
14 FAFO Survey opcit pp131-154 See original footnote for complete i
reference II
i
of nd
Study of 23 Villages in the Central District26
Examining home ownership by catchment area we found very similar results with 194 percent home ownership for Nilin 95 percent for Beit Ur and 97 percent for Kharbatha (Appendices lIA lIB and lIC) An interesting
I
finding was made when comparing home ownership between central and peripheral villages We found that 8 percent of the homes in central village were rented I in contrast to 36 percent of homes in peripheral villages (Chi square =3286540 p= lt0000) Note that in the lenin district villages no observable differences in home ownership patterns were noted between central and peripheral villages 15 If home rentals is one of the measures of
community d~velopment including the opening up to people from outside the community the presence of market and other such relations then these reinforce the notion that central area villages are more developed communities (With a relatively increased access to the outside world possibly in the initial phases of urhanisation
I I
44 crOlding Rates Ii
Overall ~3 percent of the surveyed houses had 1-2 rooms and 47 I
percent had between 3 and 8 rooms The mean was 26 rooms per household lower than the average of 3 rooms per household for Jenin
I I
While the lenin study showed minimal differences in the number of rooms per household among the different catchment areas substantial differences were noted in this survey Specifically we found that while 48 percent of the houses in the I Beit Ur catchment area had 1-2 rooms 53 percent of the houses in Kharbatha and a high of 61 percent of the houses in the Nilin catchment area lhad the same number
I
I I
15 Jenin Studyopcit p26 See original footnote for complete reference
16 Jenin Study lOp cit p26 See original footnote for complete reference
27
Study of 23 Villages in the Central Districttrict ~ I
i
nilar IU r sting and Ilage (Chi no veen ~s of
~ the hese
I
bullbullbullbullbullbullbullbull I bull I bullbullbullbullbullbullbullbullbullbullbull I bullbullbullbullbullbull I bullbullbullbullbullbullbullbullbullbullbullbullbullbullbullbullbullbullbullbullbullbullibly t bull bull bull bull bull bull bull bull bull bull bull bullbullbullbull I bullbullbull
Central Plea CrONding Rates Percerra ge a f house size by rooms
[1-2 roomsll 530
[ bullbullbull bull
I------- f
~--0 - bullbullbullbullbullbullbullbullbullbullbullbullbullbullbullbullbull I bullbullbullbullbullbullbullbullbullbullbull I bullbullbull
bull bull bull bull I bull I bullbullbullbullbullbullbullbullbullbullbullbullbullbullbull I bullbullbullbullbull I bull I bull ~ iped
----gt-gt-- 3-8 rooms -------bullbullbullbullbullbullbullbullbullbullbullbullbullbullbullbull 470 bullbullbullbullbullbullbullbullbullbullbullbullbullbullbullbull
~ ~ ~ ~
bullbullbull bullbull bullbullbullbullbullbullbullbullbullbullbullbullbullbull bullbullbullbullbullbullbull Ymiddot
~ ImiddotmiddotmiddotmiddotI- ~~~~r
Crowding by Catchment Area 147 I Percenla ge a f houses wi1h 1-2 rooms
old
Jms Ices
Il -r---- shy
- - shy iii--shy
-+shy
c-shy itl- r
4J
1the
3)
the I J)lin
1~ i
d Ktaibatla Nlin
Catdme rt area Bert LX
Dividing the total number of persons living in a household by the total number of rooms - to obtain crowding rates - revealed that overall 38
28 Study of 23 Villages in the Central District
I percent of the surveyed households had a crowding rate of 1-2 persons per
I
room 29 ipercent a rate of between 21 and 3 and 33 percent had a rate of between ~I and 18 persons per room In contrast 50 percent of the households in the lenin villages had a crowding rate of 1-2 persons per room 38 percent with a crowding rate of between 21 and 4 and a low of 12 percent with between 41 and 12 persons per room 17 Clearly central area families
live in more overcrowded houses than those in the lenin district villagesI
CrOdin~ Rates by Region CrQvdng Rates by Region I Jen~-rea Central gtlea
~ ~ ~~-(thTI2IT]rt~~ middotmiddot)middotn~middotgt
middotiiiimiddot~jliiiiimiddot [1
ji1=1BOl L230~J
These results once again point to the need be very careful about prevailing i assumptions of states of development and also alert us to the need
I
to take into consideration the importance of the urban versus the rural setting when studying the socio-economic status of the Palestinian communities in different regions
I Crowding rates differed significantly between the three catchment areas
I 17 Jenin Study opcit p26 See original footnote for complete reference
29 trict
s per te of 0 the
raquoom rcent lilies
gion
about
i ~eed i~till ues ill
eas
Study of 23 Villages in the Central District I
I
I TABLE 4
Crowding Rates by Catchment Area - Percentage of Catchment Area Category shy
I
Crowding Rate (personsroom) Beit Ur Nilin Kharbatha
1-2 41 37 35
21-3 27 28 31
31-18 32 35 34
Chi square =1373177 p=O008
The above table demonstrates that in terms of crowding rates Beit Dr catchment area fares best with 41 percent of the households having a crowding rate of 1-2 persons per room and with 32 percent of the households having between 31 and 18 persons per room Kharbatha and Nilin appear to be similar with 35 percent and 37 percent of households with 1-2 persons per room and 34 percent and 35 percent with between 31 and 18 persons per room respectively Thus although Nilin had the lowest average total number of rooms in its households when compared with the other two areas its crowding rate becomes about the same as for Kharbatha area because of its lower family size It should be mentioned here that there were no differences in crowding rates between central and peripheral villages
I
I
I i I
I
I
I
I
Ibullbull
Ibull l i i i 1middot
30 Study of 23 Villages in the Central District
I
~rowding Rates by Catchrrent Plea I ~~~~cl~~~~h~
I 00
If
10
Legml
II 10-20o o 21-30Nllin lthartetha o 31-180CatchmertArea
I
I45 Wealth Status
I The assessment of wealth status for these communities relative to each
other was completed by the field workersrehabilitation workers This took place by categorising a number of factors that are locally thought to be indicators of wealth Those included the amount of land owned by the family the I type of house that they live in including the materials used to build the house the total number of rooms in the house and furniture fixtures and any electrical equipment that the family owns
An exiination of the data pertaining to wealthstatus revealed that 13 percent of Ithe surveyed households were doing well by local standards 46 percent were barely managing and 41 percent are unable to manage Regional
BeiUr
-----
I
rict Study of 23iillages in the Central District 31
variations Jere noted where once again the Nilin catchment area fared less 1
well than the other two areas we found that 13 percent of the Beit Dr and 13 percent of the Kharbatha households were doing well in contrast to 9 percent in the Nilin catchment area while 40 percent of households in Beit Ur and 411 percent in Kharbatha were unable to manage in contrast to 47
I
percent among Nilin households (Chi square = 2078826 p= lt0005) The differences in wealth status between central and peripheral villages were also significant ~lthough less pronounced 10 percent doing well in the central villages in contrast to 13 percent in peripheral ones and 44 percent unable to manage in tentral area villages in contrast to 41 percent in peripheral ones18
(Chi square r704642 p=O029)
W3alth Status by Areas and Location Percertage of Wealth Category
5O-ri--------------------- shy
I
----I40
3Ol ----II bull II
bull
I
--~20- -
10 shy shy __-=-ach ook ) be the Ctntral
d to ure
t 13 46 IX Note that peripheral area anal
I
1 ] middot middot middotmiddot middotmiddotmiddot middot middot middot middot middot middot middot middot middot middot middot middot middot middot middot middot middot
Legnd
Ii DdnglJlkllt3 Barely Mtraging
1- 0 UrabletoMmcgew
1-
D1-----1
middot middot middot middot middot middot middot middot middot middotmiddotmiddot middot middot
middot middot middot middot middot middot Feuroripreral IltharlBtra Cctctllrent JlrEBIlocction
ampit Ur Nrlin
communities seem to be doing slightly better on the
wealth status scale than central area ones These results remain unexplainedI 1
i
I I
I ~
I
32 i Study of 23 Villages in the Central District
I On the lwhole however while all households that are categorised as
I
unable to manage require the special attention of the CBR projects Nilin appears to he even more of a priority than the other catchment areas I
Jespecially as poverty can have a negative impact on the outcome of disability i
in these communities t I Ii ~
Looking [at the relationship of wealth to the educational status of male and female heads of households we found a significant and strong association
I
hetween the two variables with increasing educational status with wealth II I
- Percentage of Wealth Category -
I
I Doing well Barely managing Unable to manage I
No educatioh at all 8 11 22
1-6 years 31 34 33
7-12 years 46 43 37 I I
13-21 years I 15 12 8
Chi square = J48 84665 J = lt 0005
I
IiTABLE 5
Education of Male Heads of Households by Wealth Status
I
The above table clearly shows that the more educated male heads of households ~re also the wealthier with 8 percent of those who are doing well with no education at all in contrast to 11 percent among those who are harely
I
managing and a high of 22 percent among those who are unahle to manage Likewise 15 percent of those doing well have 13 or more years of schooling in contrast to 12 percent among those who are barely managing and 8 percent
I
among those who are unable to manage i
33
05
t
as In
s ty
ld m
mge
of ell ly ~e
i I
I I
Studv of 23 Villages in the Central District
Education and Vlealth Status of Males eo Percenlageofvkallh Category
~ i ~-l
~ co irg ell
Bcr ely rraragrg -
D U1 etJeto rrm ltg3
i ~=--i middot
middot middot middot middot -- middot middot middot middot middotmiddot middot middot
c-- middot middot middot middot middot middot middot middot middot middotmiddot - -
No edua tim
middotl4J
middot middot middot middot 3J middot middot middot middot middot middot middot middotmiddot middot middot middot middot middot middot middot 10 middot middot middot middot middot middot
middotmiddot shyo
~-shy middot middot middot middot
1 to 6~as 7 to 12 years 13 to 21 ~as
I I
Examining the relationship between educational levels of female heads of households and wealth status revealed similar results with the more educated being the wealthier 33 percent of the well off had no education at all in contrast to 46 percent among those who are unable to manage In this case 34 percent of the well off had 7-12 years of schooling in contrast to 23 percent
I
among those who are unable to manage (Chi square = 6671126 p= lt 0005) Clearly it is beyond the scope of this study to determine whether it is wealth that determines education or whether it is education that leads to the generation of a good income For the purposes of this study it is sufficient to note the relationship between these two variables highlighting their importance onthe prospects for disabled people in these communities
i I I
Attempting to assess the relationship of wealth to an indicator of good living conditions according to local standards we related the type of building materials used in the construction of a house to household wealth status We
34 I
Study of 23 Villages in the Central District
I
found thJt those who live in stone houses tended to be better off than those who live in houses made out of concrete with a total of 24 percent of the houses built with stone Forty-eight percent of the well off lived in stones houses in contrast to 24 percent of those who reported being only able to barely manage and 17 percent of those who reported being unable to manage (Chi square = 22495139 P = lt0005) It therefore appears that in these communities a relatively reliable indicator of family wealth is the material used in the construction of the familys house
Central Area Wealth Status Housebold Wea~h Stctus tyen Percent3ge
I
b middot middot middot middot middot middot middot middot middot middot middotmiddot middot middotmiddotmiddot middot middot middot
middot middot middot middot middotmiddotmiddot middot middot middot middot middot middot middot middot middot middot middot middot middot middotmiddot middot middot middot middot middotmiddot middotmiddot middot middot middot middot middot middotmiddot middot middotmiddot middot middot middot middotmiddot middot middot middot middotmiddot middotmiddot middot middot middot middot middotmiddotmiddotmiddot middot middot middot middot middot middot middotmiddot middotmiddot middot middotmiddot middot middot middotmiddot middotmiddot middot middotmiddot middot middot middotmiddotmiddotmiddot middot middotmiddotmiddot middot middotmiddot middot middotmiddot
middot middot middot I middot middot middot i middot middot middot middotmiddot middotmiddotmiddotmiddotI middot middot middot 10-shy30 middotmiddot middot middot 1 I
middot middot middot middot middot I middot middot middot middotI-shy20 middot middotmiddot middot middot middotmiddotmiddotmiddot middot middot middot middot middot middotI middot middot middotI
r
middot middot middot middot middotmiddotmiddot middotmiddot middot middot middot middotmiddot middot middot middot -shy
middot middot middotmiddot middot middot middot middotmiddot middotmiddot middotmiddotmiddot middot middot middot middot middot middot middot middot middot middot p I I I
~
Ddngwell B3rely rrBl1lging Ul1lbleto rTBncge llkath Sctus
I Likewise looking at patterns of association between wealth status and
crowding in the homes we found a strong association between the two variables with a pattern of rising crowding with decreasing wealth with 55 percent of those doing well living in homes of 1-2 persons per room in
I
contrast to 40 percent among those barely able to manage and 34 percent among those who are unable to manage Likewise a low of 20 percent of those doing
well were found to be living in homes with over 3 persons and
up to 18 per room in contrast to 27 percent among those who are barely managing and a high of 40 percent among those who are not able to manage
35 Study of 23 Villages in the Central District trict
(Chi square = 10189049 p= lt0005) Clearly the level of crowding in fthe hose
the home appears to he one of the indicators of wealth [ones I
Attempting to relate wealth status to the type of work that the male head
e to le to
of household is engaged in showed the following t in the
TABLE 6 Type of Work by Wealth Status - Percentage of work category shy
Unemployed Labourer retiredprisonFarmer OfficePrivate
I
Doing wel~ 11 14 24 6 I I
Barely managing 48 3152 54 i I
Unable to manage 22 6341 34
md wo
1 in ent of md ely age
Chi square = 31863640 p= lt0005
Note that the above table demonstrates that those who are self employed or employed in white collar jobs seem to do best as expressed by the wealth status observed by the field workers and double checked with local sources For instance 24 percent of the officeprivate workers are doing well in
I
contrast to 14 percent of farmers 11 percent of labourers and 6 percent of the unemployed or retired In contrast 63 percent of the unemployedretiredin prison category were found to be unable to manage 41 percent of the labourers 34 percent of the farmers and a low of 22 percent of those privately employed or who work in offices were found to be unable to manage That is other than the unemployed and retired who are generally
I expected to have lower incomes than the rest of the population labourers
I
I
55
36 Study of 23 Villages in the Central District
I
appear to be the worst off followed hy farmers and then office workers or workers in private enterprises
I
Type of Wgtrk by Wealth StatusI
I Percertaga of Vbrllt Category 170
Leyenld
I Ddngwell00 shy
Barely rraraging~I 0j50 -
I140
0 0
130 I
120
110
~=l 1----shyo
Urabletorra~e r----c
ql l
--2C-
I 1-1 t I
I
r-
Ii shy
i i
I I
LalDurEf Farrm afmPria1e REiirEdfU1erTfledfrison lkJrk Ccteggtry
I Looking at wealth status relative to the total number of persons working
at home lindicares that the higher the number of employed household I
members the greater the likelihood of that household being able to manage and doing well
I TrtBLE 7 Wealth Status by Number of Employed per Household
I - Percentage of Number of Employed Category shy
I None working 1 working 2-5 working
I Doing well 3 12 22
Barely a61e to manage 18 47 56 i
Unable to manage 79 41 22
middot
middot middot
37 istrict
ers or
rking ehold mage
I
I Study of 23 tillages in the Central District
Chi square = 29712707 P= lt 0005
WStatus by No of Employed per Hhold of No of Bnploje d Category
I ff)l---------===--------------------
I----------------f
1-------1 middotr-----Imiddot---~middot
1--------1 bull
1 Mlkirg t-bri EmpOfgj Qie~ry
o -----YiN--r+-----~-Ib re Mlkirg
I As the above table demonstrates there is a clear pattern of increasing
wealth with the increase in the number of people working in the household with a low of 3 percent of the households with none working doing well in contrast to 12 percent with one person working and 22 percent with 2-5
I
persons working In contrast 79 percent of the households with no one working are unable to manage in contrast to 41 percent for household with one person working and a low of 22 percent for those with 2-5 persons working As i~ the case with the Jenin district villages this data indicates that household income in these communities is primarily determined by wage work rather than for instance agricultural production land ownership or
I
remittance money from abroad
I ~1-+----1
6J +-----1 I I
~I+-------1
4)1-t--------1
3Jrl------j
JJ 1
I 10---1
I I
Legrd
1m Coirgwe
8 Bcrely ITBragrg o U1lttje to JT1al~
bull bull I bull
bullbullbull r-- shy
middot middot I-~-----JmiddotmiddotmiddotmiddotL--shy
middot
38 Study of 23 Villages in the Central District
I
I
50 DESCRIPTION OF THE POPULATION OF PERSONS WITH DISABILITIES
II
I With 1956 persons with disabilities interviewed in this survey and based
on HDIPs population estimates we estimate the rate of disability in these communities I to be about 26 percent overall and within what we believe to 1 be the national average of 2-3 percent (See Appendix I) Appendices IIA to lIe also demonstrate that there were some differences in the rates of disability among the different catchment areas Note for instance that the highest rate of disability was found in the Kharbathat Bani Hareth catchment area with a total of 32 percent rate of disability in contrast to 25 for Beit Dr and a low of 21 percent for Nilin the catchment area that was found to be the most
I
socio-economically deprived in this survey Perhaps the results can be seen in terms of community deprivation leading to premature deaths among disabled people as one of the explanations for the lower rate of disability in Nilin area relative to the other areas As for the higher disability rates in Kharbatha area those remain unexplained
I
I 51 Distribution by Gender
i
I In line with the results obtained in both the Gaza Strip and lenin studies
a difference in disability rates between males and females was noted with 56 percent of the disabled in the three catchment areas being male and 44 percent female Separating the different catchment areas we note a similar pattern although the differences among the catchment areas is not statistically significant II
I I
urlct
ased hese Ie to A to iility rate
ith a low
nost n in bled area atha
lies h 56 d 44 nilar ally
39StudYof 23 Villages in the Central District bull I
I
TABLE 8 Disability by Sex and Catchment Area
- Percentage of Catchment Area Category -
Beit Ur Nilin Kharbatha
Males 55 59 55
Females 45 41 45
I Di~ability by Sex and Catchment Area
1
P ercenta ge 0 f eaten rren t Prea eategory ~
legrd
g Maes U Femaes
---Oraquoraquo---------J~~___~_____--l-~~~___J
Nlin Krartniha CaldmertArEB
ri shy~
Given t~at women in the survey population compose 499 percent of the population it
can only he concluded that the missing females have not been
included in the surveyor alternatively they may have suffered the combined effects of disability and the discrimination against women in Palestinian
I
~o Study of 23 Villages in the Central District
society leading to their premature death We will have a chance to examine the remaining data from this gender perspective later below
I
I
i I
52 Distribution by Age
I
The age of persons with disabilities included in this survey ranged between a few months of age to 95 years old The mean age was found to be
I
I359 years (Appendix I) rather higher than the mean age of 296 years for the disabled of the lenin district This reflects the higher proportion of 1 older people found in this survey relative the lenin one In this survey 29 percent of the disabled were under the age of 15 35 percent were between ] the ages of 15 and 49 and a high of 36 percent were aged 50 years or older in contrast to 26 percent of the lenin district disabled being 50 years or older
I II Aga Distribution in tre Central Area I Percer1agl ci Pje Ehket
I
j I
I I I
II I I
I
I
I I
I i I
19 Jenin Study opcit p3 See original footnote for complete reference
41 StudY of 23 Villages in the Central District strict
I j
rmine Compari~g this survey data to data on age for the West Bank and Gaza Snip we find that people 65 years or older compose not more than 4-6 percent of the population 20 In contrast in this study they compose 15
percent of the population While one would expect that as mortality is reduced within any population the rate of old age disabilities rises it is not clear if these results are merely a reflection of increased longevity They could also 1 be interpreted in terms of the severity of conditions within which disabled people live leading to their early death and skewing the disability nged picture towards the normal disabilities of old age They could also reflect the to be rising problem for the aged in these communities and in the area as a whole s for resulting f~om the demographic transition where as average life expectancy m of rises special services for older people - including the fitting of hearing aids 129 and glasses - are not being implemented to cater to these newly emerging Neen needs that reflect the transition that these communities are undergoing This lder data indicates the need to look further into disability care for the elderly lder especially lif contrasted with information pertaining to disability types that will follow
While I no appreciable differences in the age distribution of disabled people was noted when comparing the different catchment areas we found significanf differences between central and peripheral locales Six percent of disabled people in central areas were found to be under the age of 15 years in contrast to 8 percent in peripheral areas 12 percent between 5-14 in the central areas in contrast to a high of 24 percent in peripheral ones 47 percent between 15-59 in central areas in contrast to 44 percent in peripheral ones an~ 35 percent of disabled people in central areas found to be 60 years of over I in contrast to 25 percent in peripheral areas (Chi square = 1900316 P lt0005) These results indicate that the rates of disabilities in
j
the age bracket of 0-4 years are about the same The differences begin to I
appear sharply in the 5-14 years bracket with double the rate of disability in I
peripheral areas than in the central ones This may suggest either that peripheral area disabled children die prematurely because of lack of assistance or that they are exposed to a disabling environment more so than disabled
i
20 FAFO Survey opcit p44 See original footnote for complete reference I I
r I
r I
Study of 23 Villages in the Central District ~2
children in the central area In the age category 15-59 years the rates of disability are about the same for central and peripheral areas However differences again begin to appear among those aged 60 years or over with 35 I percent of the central area disabled falling into this category in contrast to 25 percent among peripheral area disabled I
III
On the whole this data suggests that the CBR project needs to take into account the ispecial needs of older disabled people especially in the central
I area villagd while at the same time focusing on disability early in life I particularly ih the peripheral villages f
t I53 DUfation and Types of Disabilities II
IThe mean duration of disabilities in these communities was found to be I
20 years with 21 percent of the disabled reporting having had the disability I
for 0-4 years 17 percent for 5-9 years 23 percent for 10-19 years and a high of 39 dercent with disabilities for 20 years or more
I
Duration of Disability Percertaoe ci lgt(Je BrakEi
1D-19yw rsl
I I
I
I I
I
I
rict Study of 23 Villages in the Central District middotB i
i I
s of In total 25 percent of the disabilities were related to movement a high of ver 44 percent were related to disabilities of the sensory type - visual hearing 1 35 and speech -I and 31 percent were multiple in nature with mixed mental ) 25 learning difficulties as well as seizures and physical symptoms associated
with mental disability There were no differences in disability type either by catchment area or locale - central versus peripheral villages - however
into attempting to relate age to the type of disability revealed the following ural life
I I
) be ility ld a
i I
I
The abdve table
TABLE 9 Disability Type by Age
- Percentage of Age Category shy
I I
I
I
Physical I
I
I
Sensory I I I
Mentalphysical
0-14 years 15-59 years 60 years or more
24 24 28
37 39 61
39 37 11
Chi square = 7297256 P lt0005
demonstrates that there is no appreciable difference in the rate of physical disability by age with 24 percent for those 0-14 years old 24 percent for those 15-59 years old and 28 percent for those aged 60 years or 0ier The picture changes with sensory disabilities where we have a low of 37 Ipercent of those between 0 and 14-years-old who suffer from sensory disabilities in contrast to 39 percent for those aged 15-59 and a high of 61 percent for those aged 60 years or over In contrast mentalmultiple disabilities tare more common with the younger age groups with 39 percent of those between 0 and 14-years-old suffering from mentalmultiple disabilities 37 percent among those aged between 15 and 59-years-old and a
I
low of 11 percent among those who are aged 60 years or older
I
----
Study of 23 Villages in the Central District 44
Disability Type by Age I Percertaps d AQe CaegHy I
Le~nd
Ii Fhysca IG ~r1S)ry o fventlitPhysical
I-------1bullbull -shy
bull bull I bullmiddot middot
1559yEBr5 60+ years bull PgeCategay
D-14yecrs
45 strict
eflect lised are lS on these
age ecial
j
I Study of 23 Villages in the Central District
II
i Disability Type by Age I Percenla ge 0 f Age Ca lego ry70 --r-~----------~---I leg=rd
I6) ~ Pty sica I [3 Senscry
IED ~O_Mentatfhj5lcal
I
I 3J --+------1
-~
~--~------i
I LX) -------===---------o==
-
1---
Iz 10
o ()14 yeltrs 15-69yeelS 6)+ WIS
AgcatEglYY
Of the total number of disabled 4 percent were noted as having a mild I
disability 46 percent with moderate disability and 50 percent with severe disability That is the large majority of the disabled surveyed in this study require assistance and rehabilitation services
I Severity ofDisablity
Percertage d Disati~ty CltEglYY
IIgtAxJerre dslti itt I
~
~~~~ ~~~~~ ~ ~~~~jJ~ll~ ~ ~~~~~)~ ~ ~~~ ~ ~
iiI II
I I
II
IiI
46
54
Study of 23 Villages in the Central District
Daily Living Skills
TABLE 10 Petformance of Daily Living Skills - Number of Persons by Skill Level shy
Unable to or help
Performs with Difficulty Perform
Eats 36
Cleans
60
87
Toilet
160
114 64
Dresses 78150
II
I
IiIIII
IIII
I
Sits
I
III 2559
I
II
iI
I
I
Ii
I
Stands 68 53
Moves inside house 46
Movesl outside house
94
104 123
WaUG ten steps 103 63 i
Understands instruction 121 41
Expresses needs 40
Understands sign language
89
94 27
Uses ISign language 32
Lip-reads
109
4356
I
I
47
I i I i I f
I Study of 23 Villages in the Central District rict
I I I bull bull
The above table demonstrates that among those where the question IS
relevant a fotal of 2139 different daily living skills need to be learned by these disabled persons with an average of 21 skills per disabled person living in the~e communities These results indicate the need for CBR projects
I
that can actively take part in assisting the disabled in performing activities of daily living1 releasing pressures off the disabled as well as their caretakers
Iwho are usually women I
55 cokmunity IntegrationI
I The degree to which persons with disabilities are integrated into their
community [was measured by the level of participation of disabled people in a variety of family social and educational activities Analysis of the data on children revealed the following
I T1BLE 11 Selected Social Activities of Children with Disabilities
I PERCENT OF TOTAL ACTIVIT~
NUMBER OF CHILDREN I I
Plays regularly with peer children lt 15 71
I Plays as a younger childwith younger 19 children I
IDoes not play at all 10
I I
I I
6-I8 years old goes to school regularly 52
I Went to school as a younger childno 4 homework
INo 35I
I i
Special rehabilitation school 9
I
rIfI
II
I
I IIii
48 Study of 23 Villages in the Central District
I The above table is interesting in more than one respect Firstly 10
percent of children do not play at all 19 percent play with younger childrenas ia younger child and 71 percent play regularly This contrasts with the Jenin data where a high 25 percent of the children were found not to play at all 21 percent were found to playas younger children and 54 percent were found to play regularly Although it is impossible to ascertain with accuracy the causesI of these differences between the different areas the data suggests that children in the central area communities are relatively more integrated than in theIJenin area assuming a similar degree of disablement
The above table also shows that 52 percent of the central area disahled children go to school 4 percent go to school as younger peers 9 percent go to special rehabilitation schools and a high of 35 percent do not go to school at all In lenin it was found that 43 percent of children go to school regularly 5 percent as younger children 7 percent with no homework and a high of 44 percent do not go to school These results do reinforce the suggestion that due to the accessihility of services in the central area shy
Imiddot
I
special rehabilitation schools for instance - in addition to other factors such as knowledge and exposure to alternative services for disabled people disabled children in the central area are relatively more integrated than the lenin area Nevertheless these results also demonstrate that a high proportion of children with disahilities do not have access to school and do not play
I adequately making children a priority for the CBR project operating in the area I
Examining this data in terms of the community in which these children
live wf noted a significant difference among the children in terms of attendance of school hy catchment area
I
49 ct
lO er th ly re -y ts ~d
~d
~o
01 01 a
he l shy
h e he m ay he
en of
Study of 23 Villages in the Central District
TABLE 12 Childrens School Attendance by Catchment Area
- Percentage of Catchment Area Category -
Beit Dr Nilin Kharbatha
I Yes go to school 51 41 36
I As younger or no homework 1 9 6
No 43 44 43
Special I
rehabilitation school 5 6 15
I I
Chi square = 2086095 p lt 0005
The above table shows that 51 percent of the disabled children of Beit Dr go to school normally in contrast to 41 percent in Nilin and a low of 36 percent in Kharbatha The lowest level of school attendance in Kharbatha can be explained in terms of the children there attendinghaving access to rehabilitation school with 15 percent of the children attending such schools in contrast to 6 percent in Nilin and 5 percent in Beit Dr In contrast 43 percent of the children of Beit Dr do not go to school at all compared to 43 percent fori Kharbatha and 44 percent for Nilin Thus it appears that Nilins children ar~ a priority for action
I
I
I
r 50 Study of 23 Villages in the Central District
I
School Attendance by Catchment Area Percen1a ge0 f Catch rrent Catsgory
8J----r----------~----_r_-~=-~
------------1
e I Goas to sctcd Y(lJrgerlro hl lrelMfkI I
middot middot middot i
10
JJ
Ngt CatdmertArm CatEgay
Le~rd
o 8ErtU e Nlin
E3 KIBboth a
A rather interesting and inexplicable relationship was noted between the rate of att~ndance of disabled children in schools and whether the locale is a
central or peripheral village Usually the assumption is that because central village families have access to schooling more so than peripheral ones one would expect that central village disabled children would be more integrated in schools than in peripheral villages However in this survey it was found that a high of 50 percent of central area village children do not go to school I at all in contrast to 33 percent for peripheral village children (Chi square = 1O7879 p= 029) These results suggest that factors other than accessibility are operational here impeding access of central village disabled children tq schools Stigma is believed to be a factor by field workers who have observed that stigma associated with disability is more strongly felt I among fa~ilies living in central villages relative to peripheral ones We will have a chance to examine this question later in this analysis
I
I Examining the data on social integration for the disabled population as a
whole wei find the following II I i I
I
51
i
iI
t
- Percentage of Total Population of Disabled shy
ACTIVITY PERCENTAGE OF TOTAL
Regularly joins family activities 90
Sometimes i 6
Not at all 4
III
i II
I
I
II
i
III
j
I
I I
i
ii
Regularly joins social activities 68
Sometimesi 15
Not at all I 17
Regularly Ihas jobincome 20
Sometimek has jobincome 8
No job or income 78
I
a I
III
1
1 )
t
I
i Study of 23 Villages in the Central District
TABLE 13 Selected Social Activities of Persons with Disabilities
The lbove table contrast with the Jenin area villages in that while 90 percent
I olf the disabled stated that they regularly join family activities in this
survey only 62 percent of the lenin area disabled responded positively to the
1
IiiII
52 Study of 23 Villages in the Central District
I
III
I III
question Additionally 68 percent of the disahled in this survey reported regularly joining social activities in their community in contrast to only 29 percent of the disabled in the lenin area These results demonstrate a significant difference in the integration of disahled people with the central area disabled appearing to he rather more integrated into community life than the lenin villages Even when it comes to having a job or regular area income the difference is clearly in favour of the central area villages with 20percent of the disabled in the central area reporting having a regular job or income in contrast to only 8 percent among the disabled of the lenin area These results were consistent across different age categories where children adults and older people appeared to have a similar pattern of integration indicators riegating an explanation of these results in terms of age Given also that th~ large majority of the disabled in this population are suffering from moderate to severe disabilities it does not make sense to suggest that they are better integrated than other disabled because their disabilities are of the mild type
I
I Examining the level of integration in terms of catchment areas we found
a significant but weak relationship denoting that Nilin area disabled are less integrated socially than the other areas with 72 percent of the Beit Ur area disabled stating that they regularly join social activities in contrast to 68
I
III
percent of Kharbathas disabled and a low of 60 percent for Nilins disabled The relationship disappeared when relating catchment to family activities While care must be taken not to make out of this data more than it can yield these results suggest that Ni lin disabled people are less socially integrated than the rest in consistency with the previous findings pointing to Nilin disabled people as a priority for action
Service Provision for Disabled People 56
I On the whole a high of 81 percent of the disabled of these communities
had sought services related to their disabilities in the past in contrast to a
I
II
low of 57 percent for the lenin area villages Of those who received services the large i majority - 91 percent - received medical or medically related
53 iet
ed 29
a raj an lar 20 or a n on en 19 lat of
Id ss ~a
8 1 s I ~d
III
s a d
Study of 23 Villages in the Central District
services such as operations special tests medications or physiotherapy and only 9 perce~t received rehabilitation services and training Interestingly only 4 reported that they had sought Arabic Medicine for a cure There were no appreciable differences in the receipt of services among the catchment areas
i i
Examining the receipt of service in terms of the community in which the disabled live there were significant differences noted with a high of 27 percent never having received any service in Nilin in contrast to 18 percent for Beit Dr I and 17 percent for Kharbatha with 70 percent of the Beit Dr disabled having had medically related services in contrast to 71 percent for Nilin and 79 percent for Kharbatha and a high of 12 percent of the Beit Dr disabled having received rehabilitation services in contrast to a low of 3 percent for Ni lin and 4 percent for Kharbatha (Chi square = 343195 P = lt 0005)
Receipt of Services tJy Catctrrent Area
Percena ge 0 f SeN ce Category I aJ 7-r--------------==-------r--------------
Legmir i
4)+----1
70H- _i m BatU I
I EDci--------- shy
I i
9]H----------shy I 4J-+--__~ _ I 3)-t--~-~----
I I
I 10
o
I Sa-vire Qt ~ ay
o Nlin
o Ktarbaha
Malicas av ire
I A simdar pattern was noted when comparing central and peripheral
villages 21 percent had no services 66 percent had medical services and 13
54 Study of 23 Villages in the Central District
percent had rehabilitation services for the central villages as opposed to 19 percent with no services 75 percent with medical and 6 percent with rehabilitation services for the peripheral villages (Chi square = 107879 P =003) These results indicate that although the large majority did receive I some form of service services accessible to disabled people remain mostly of the medical type and identification of the difference needs of service for this population required a concerted effort from the part of the CBR team to uncover with the aim of fulfilling them These results also demonstrate that peripheral areas have relatively less access to services even of the medical variety than the central ones with this highlighted once again in the Nitlin area as a whole
r
I I
Receipt of Services by Village Location 1
Pe rcerta~ d servi ceCltiegory 80--------------------------~
Le~nd
70-+------------1 II Ca1t rallliDages
o Feripteral vaiagES 100-+--------shy
i i 50-+--------shyr
i 40-+--------- shy
30-+--------shy
20-1-shy
10-+-shy
o No9ll4ce Rdlabilitaticn reNcervedical-raataI el4ce
SeNceCcteggtry
I
55 strict Study of 23 Villages in the Central District
to 19 57 Difficulties Faced by the Families of Disabled with
People879 I
Izeive I
When families were asked about the types of problems they faced as a this ly of
result of having disabled family members a high of 31 percent stated that m to they have no problem Of those who thought they had problems a low of 9 that percent believed that they had problems related to access to medical services
Iical or the search for a cure 15 percent denoted financial matters - such as an rilin income or job for the disabled person - as a major problem affecting family
life and a I
high of 40 percent noted that their problem is psychosocial the stigma or Ipsychological and social complications of disability making family life difficult Interestingly 5 percent noted that they have a problem in having educational access for disabled people and a high of 32 percent noted that daily physical difficulties in handling the disabled were the biggest
problems would face
Perceived Disabil~y-Related Protiems Percertags ci Reooted Prctgtlem
I Wediall-raatEd I
Educaticnal access
I Rnarciall-~mBit
FSyhcsocial
56 Study of 23 Villages in the Central District
Relating these responses to the age of the disabled person we find that psychosocial problems affect families with disabled children or adults to a much larger extent than families with disabled older people with 40 percent of families with disabled children and 49 percent of families with disabled members between 15-59 years noting psychosocial problems as important in contrast to 19 percent among families with disabled people who are 60 years or older Interestingly problems related to the physical difficulties of limited access to technical aids such as hearing aids and wheelchairs and the physical difficulties encountered by women in dealing with this situation were more strongly pronounced among families with older disabled people 59 percent of the families of disabled people who are 60 years or older noted this as a primary problem in contrast to 30 percent among families of disabled children and 24 percent among families of disabled adults 15-59 years (Chi quare = 4755373 P lt0005)
Perceived Importance of Problems Percertage d ~e Bracket
oo--------------------~--------_ L~nd
1m FSChaodal p-obkms irrpat3nto coosstl1echrical aidsirrpolta-rtso-+-shy
60
i 4O-+-shy
I I
i
I 20--t-- shyI
I
0---- shy
1559years 6O+-~ars fgtgeBlac~t
i
Clearly this data suggests that physical difficulties encountered by women - who are the caretakers of the disabled in Palestinian society - relate mostly to the presence of disabled older people and secondarily to children while stigma felt by the family that causes social and psychological problems
0-14yea-s I
I Il I i I
Ibull
57 rict
hat oa ent led III
ars ted the )n Ie ed of 59
Iy te
1
IS
I
Study of 23 Villages in the Central District I
i I I
is more pronounced among families of disabled adults and to a lesser extent children These results are consistent with the prevailing understanding that old age brings with it disabilities that are not the fault of the family but rather part of the ordinary life cycle while other disabilities carry with them blame disabled known
shame and the consequent psychosocial trauma not only for the child but for the entire family as well Indeed it is ordinarily
I
that the presence of disabled children within the family can compromise the marriage options of females within that family It is to this extent that I the disability stigma is felt in this society emphasising the importance for the CBR projects to systematically work on awareness building and consciousness change as the core of any community based disability rehabilitation project 21
I
I
Examining psychosocial problems - or stigma - on its own and relating responses pertaining to stigma to the locale where families live we found a pattern of difference among the different communities where a low of 31 percent of NiIin catchment area families noted stigma as a major problem in contrast to 40 percent among the Beit I Dr villages and a high of 45 percent among the Kharbatha catchment area villages Although these differences were not found to be statistically significant they potentiate the views of the field workers who believe that increasing urbanisation opening up to the urban area and modernisation increase the feelings of stigma related to disability among families These views appear to be consistent with the results of I this study that denote that the Ni lin catchment area is the least developed I of the areas The field worker observations are also potentiated by the finding that stigma is more strongly felt by families living in central villages relative to peripheral ones where a high of 48 percent of central village families reported stigma as a main problem they encounter in contrast to a low of 38 percent among peripheral village families
I
I i
I 21 It sh9uld be noted here that the responses obtained from disabled people relating
to the problem they face were complete for only one third of the disabled making it impossible to analyse the data adequately
I II
I
58 Study of 23 Villages in the Central District
58 Gender
As Appendices I IIA lIB and lIe indicate disabled males outnumbered disabled females in the communities overall and in each of the catchment areas with 56 percent of the disabled being male and 44 percent being female This contrasts with the proportion of women relative to men in these communities where women were found to compose 499 percent of the total population This discrepancy in the ratio of males to females requires further
I
study Although one can argue that this could be explained by a higher rate of disability among males because of biological as well as social or work reasons it could also be argued that the combined effects of being disabled and being female in Palestinian society could be leading to the premature death of disabled females Although it is beyond the scope of this study to examine the way in which gender articulates with disability to produce specific physical as well as mentallife condition effects on disabled women an attempt was made to compare the conditions of sexes given the limitation of available data and with the perspective of identifying priorities for action
There were no relationships between sex and disability rate by catchment area nor by centralperipheral village locale Likewise there were no relationships found between the sex of the disabled and their abilities in the activities of daily living That is theoretically given similar abilities disabled males and females should rate similarly in social integration indicators given that no determinant other than the disability itself is operational However cross-tabulating social integration indicators by sex revealed significant differences in social integration levels between males and females in favour of males and as follows
Study of 23 Villages in the Central District ct
TABLE 14 Social Integration Indicators by Sex of Disabled Person
- Percentage of Sex Category shy
~d
at
19 e al ~r
Males Females
PLAY - FOR CHILDREN ONLY
Yes 66 52I
As younger I 13 22 No I 21 26I
Chi square =74921 p=002 i
GOES TO SCHOOL-FOR CIDLDREN OF SCHOOL AGE 6 TO 18 YEARS-Yes i 48 42 As younger 1 0 No homework 6 0 No i 37 50 Special rehabilitation school 7 8
Chi square =1182295 p =0018
JOINS SOCIAL ACTIVITIES
Yes
73 62
Sometimes 13 18 No i 14 20
Chi square =132354 p= lt0005 i
RECEIVED SERVICES
Yes I 83 79 No services at all 17 21
Chi square =404255 p=0044
l
n
It
o e
1
S
(
I
60 Study of 23 Villages in the Central District
As the above table demonstrates and given similar abilities between disabled males and females in these communities women tend to consistently be at a disadvantage Notice for instance that 21 percent of disabled male children do not play at all in contrast to 26 percent among disabled females 37 percent of disabled male children do not go to school at all compare with a high of 50 percent for disabled females 14 percent of disabled males do not join social activities at all compared with 20 percent of disabled females and 17 percent of disabled male children have not received any service at all compared with 21 percent of disabled females These results clearly demonstrate the impact of gender relations on disability specifically highlighting the negative impact on the integration level of females relative to males These results reiterate the need to view and define disabled women as a priority for the activities of the CBR project
i
I
IIIIIiiI I
i
61 rict
een itly lale es ha not md all rly lly rve len
I Study of 23 Villages in the Central District
60 SUMMARY AND CONCLUSIONS
61 Summary of Study Findings I
This study was based on data collected in a house-to-house survey conducted in 23 villages in the central area of the West Bank A total of 4793 households were visited representing about 80 percent of the total number of households in these communities The average family size was found to be 69 persons per family for the visited households The large
I
majority were found to be original inhabitants of the area while 13 percent were refugees The male to female ratio was almost identical with females
representing ~99 percent of the population
I
Despite the proximity of these villages to the Ramallah urban area and to Jerusalem they nevertheless continue to suffer serious socio-economic problems and general underdevelopment With the majority of household heads working as wage labourers these villages today suffer the economic crunch that resulted from the closure of the occupied territories and the resultant inability of wage workers to enter Israel in search of wage labour opportunities
j
The overall educational attainment of male and female househeads was found to be generally low with an average of 7 years of schooling formales relative to a lower 42 years for females
I
I This survey succeeded in identifying 1056 disabled people living in these
communities Of those 56 percent were males and 44 percent females once
1 I
62 Study of 23 Villages in the Central District
again replicating the pattern observed in the northern region of the West Bank and in the Gaza Strip where disabled males outnumber disabled females and suggesting a pattern of discrimination against disabled females leading to premature death The mean age of the disabled was found to be 359 years considerably higher than the mean found for the northern area villages and for the G~a Strip and with a high of 36 percent of the disabled population being 50 years or older The data pertaining to the length of the period of being disabled was also generally indicative of the prevalence of disabilities of longer term duration with a high of 39 percent of the disabled reporting having had their disabilities for 20 or more years 23 percent for 10-19 years 17 percent [for 5-9 years and 21 percent for 0-4 years The majority of the disabled were found to suffer from moderate and severe disabilities with only 4 percent denoting their disability as of the mild type and indicating the need for CBR projects in these communities
In total 25 percent of the disabilities were related to movement a high of 44 percent i were related to the sensory system - sight hearing and speech shy
I
and 31 percent were multiple in nature mental mixed with other types of disabilities This pattern generally replicates the trend already found in the north of I the West Bank and in the Gaza Strip except for the overshyrepresentation of sensory disabilities within this population Controlling for age the data revealed that the majority of sensory disabilities pertained to older people and therefore should be categorised as the expected disabilities of old age rather than due to the specific circumstances of this particular population i Although one can also question the reasons for the apparent differences I in the rate of disability of old age among the different population studied in the West Bank and Gaza Strip unfortunately the answer to such a question is beyond the scope of this particular study
i
I What is important is to note is that overall a total of 2 139 daily living
skills are still not performed either adequately or at all by these disabled people Moreover the data also confirms the problem of the isolation of disabled people because of a combination of physical difficulties and social stigma and requiring immediate attention in the area of social integration
Study of 23 Villages in the Central District 63iet
programmes This is especially important in the case of disabled children and nk disabled women and girls who neither play nor go to school nor participate
to rrd
in communal life as equally as other members of their society and is
s definitely considered as a matter of priority I
ld in
Overall that data obtained in this study related to the general well being Jf of disabled I people and their families confirms the need for immediate
~s
assistance in the form of rehabilitation programmes focusing on not only 19 physical problems and their solution but also psychosocial problems leading
~
to isolation of disabled persons in these communities le h e
62 Priorities for eBR Programs
f
In line with the above findings it is recommended that f
1 The central area CBR programme takes the shape of not only individual assistance within homes but also the shape of communal education and action On the one hand the disabled people of the central area need assistance to solve their physical problems On the other hand an attempt to gradually change the negative perceptions of communities towards disability shystigma and shame - is very much part of disability rehabilitation in addition to being a fundamental human right
2 The CBR programme also takes into serious consideration the finding I
that a rather high percentage of the disabled in these communities are older people Given that old age can often lead to disability but that society perceives this type of disability in different ways than disabilities caused by other factors - certainly less stigmatising than disabilities occurring due to other causes - it is important that the programme is developed to fulfil this special need Specifically given that the largest percentage of disability
64 Study of 23 Villages in the Central District
related to the sensory system it is imperative that the central area programme links to accessible and affordable secondary services that are well linked into a network of assistance with the CBR programme and can therefore
adequately provide the needed technical aids as well as other forms of assistance needed by this older disabled population Indeed this is an emerging national priority not only because of the specific findings of this study but also because of the gradual change in the nature and relations within and around the Palestinian family Increasingly Palestinian families are becoming nuclear - about two-thirds of the families were found to be nuclear families in the West Bank and Gaza Strip by the FAFO study - more and more women - the traditional caretakers of older people - are moving into the labour force by virtue of economic necessity Yet there is no systematic and parallel evolution of networks of services and assistance to older people during these transitional times In other words it is precisely such groups that fall through the cracks in care systems during periods of change and it is precisely such groups that the CBR programme should pay special attention to
3 That the programme takes into serious consideration the special problems of disabled women and girls as gender relations in Palestinian society compound the effects of disability and pose a double burden on disabled women compared to disabled men That is it is highly recommended that the programme specifically focuses on the needs of disabled women and girls as a priority and as a high risk group
I
4 Finally disability rehabilitation is not merely a programme of assistance The Palestinian experience has developed in such a way that it is also a programme that is directed towards guaranteeing the fundamental human rights of disabled people In this vein an active involvement in animating and assisting the disabled and their families to speak forr
themselves to form their advocacy groups and call for the recognising of their rights is also very much part of the tasks of the staff in this emerging programme In this area consolidating relations with unions for the disabled is a task as imperative as conducting the technical practical work Through such an approach to disability rehabilitation that combines the technical with
Study of 23 Villages in the Central District 65
the human rights component the stage IS set for the central area CBR programme I s success in its endeavours
66 Study of 23 Villages in the Central District
APPENDIX I
Overall Characteristics of the 23 Central Area Villages
i III
Surveyed households Total number of households surveyed 4793 Estimated actual22 number of households
in the 23 communities of the central area studied 5800 Percentage of households surveyed 83 percent
Gender breakdown in surveyed household population Total population of surveyed households 33186
Males 1 16641 Females 1 16545
I
Percentage females 499 percent Children ( lt 15 years of age) 17035
Percentage children 51 percent
Mean household size 69 II
I
I Population origin Original inhabitants 87 percent Refugees 13 percent r
I
22 Based on HDIPs estimated total population of 40000 for the area and 69 for
average family size - see later in Appendix 1 II
III
I I
67 Study of 23 Villages in the Central District
Work of male household heads Unskilledsemi-skilled labourer 59 percent Private work 8 percent Office work- white collar 8 percent Farmer 7percent Unemployed in prison or retired - no work 18 percent
i
I
Education of male household heads None 15 percent 1-6 years 33 percent 7-12 years 42 percent 13-21 years 10 percent
Mean educational attainment 7 years
I
Work of female household head Homemaker 94 percent Embroidery and knitting in the informal sectorpart time 4 percent Farmer ~
I
I percent I
Other 1 percent I i I I
i
Education of female household heads None 40 percent 1
1-6 years J 31 percent I
7-12 years 27 percent 13-16 years i 2 percent
Mean educational attainment 42 years
I
Total number working in household None 8 percent One person 78 percent 2-5 persons 14 percent
68 Study of 23 Villages in the Central District
Home ownership Own ~ 95 percent Rent
Ibull 4 percent
Family owned 1 percent
Total number of rooms in house Up to 2 rbullbullbullbullbullbullbullbullbullbullbullbullbullbullbullbullbullbullbullbullbullbullbullbullbullbullbullbullbullbullbullbullbullbullbullbullbullbullbullbullbullbullbullbullbullbullbullbullbullbullbullbullbullbullbullbullbullbullbullbullbullbull 53 percent 3 to 4 41 percent r
5 to 8 1 6 percent Mean number of rooms in house 26 rooms
House type i Stone 24 percent Concrete 75 percent
Household wealth status Doing very well by village standards 12 percent Managing 46 percent Barely able to manage 42 percent
Disabled persons Total disabled 1056 Estimated percentage disability in these communuies- 26 percent
Number of disabled persons by households Households with one person disabled 67 percent Households with more than one person disabled 33 percent
I
23 Based 011 HOIPs population estimate of 40000 persons
Study of 23 Villages in the Central District 69
Gender of persons with disabilities Male Female
56 percent 44 percent
Age of persons with disabilities o to 4 years 5 to 9 10 to 14 15 to 49 50 to 95
Mean age of disabled
7 percent 11 percent 11 percent 35 percent 36 percent 359 years
Length of disability o to 4 years 5 to 9 years l 10 to 19 years 20 or more years
Mean years disabled
21 percent 17 percent 23 percent 39 percent 20 years
Severity of disability Mild Moderate Severe
4 percent 46 percent 50 percent
i
I
70 Study of 23 Villages in the Central District
APPENDIX II-A
Characteristics of Beit Ur al-Tahta Catchment Area
(Beit Ur al-Tahta Beit Sira AI-Tireh Saffa Beit fUr al-Foqa i Beit Liqia and Kharbathat Misbah)
I Surveyed hou~eholds Total number of households surveyed 1911 Total population of surveyed households 13293
Males 66141
Females rI
6679 Percentage females ~ 50 percent
Children ~ 15 years of age 6947 Perc~ntage children 52 percent
I I
Mean household size 7 persons
Population origin Original inhabitants 86 percent Refugees 14 percent
Work of male household heads Unskilledsemi-skilled labourer 60 percent Private work 9 percent
Office work- white collar 7 percent Farmer 7 percent Unemployed prison or retired- no work 17 percent
71Study of 23 Villages in the Central District
Education of male household heads None ibullbullbullbullbullbullbullbullbullbullbullbullbullbullbullbullbullbullbullbullbullbullbullbullbullbullbullbullbullbullbullbullbullbullbullbullbullbullbullbullbullbullbullbullbullbullbullbullbullbullbullbullbullbullbullbullbullbullbull 13 percent 1-6 years 33 percent 7-12 years i bull bull bull bull bull bull bull bull bull bull bull bull bull bull bull bull bull bull bull bull bull bull bull bull bull bull bull bull bull bull bull bull bull bull bull bull bull bull bull bull bull bull bull bull bull bull bull bull bull bull bull bull bull bull bull bull bullbull 44 percent 13-21 years 10 percent 1 bullbullbullbullbullbullbullbullbullbullbullbullbullbullbullbullbullbullbullbullbullbullbullbullbullbullbullbullbullbullbullbullbullbullbullbullbullbullbullbullbullbullbullbullbullbullbullbullbullbullbullbullbullbullbullbullbullbullbull
Mean educational attainment 71 years I I I I i
Work of female household heads Homemaker
I
90 percent Embroidery and knitting in the informal sectorpart time 9 percent Private work jbullbullbullbullbull 1 percent
I I I
Education of female household head None Jbullbullbullbullbullbullbullbullbullbullbullbullbullbullbullbullbullbullbullbullbullbullbullbullbullbullbullbullbullbullbull 38 percent 1-6 years i bullbullbullbullbullbullbullbullbullbullbullbullbullbullbullbullbullbullbullbullbullbullbullbullbullbullbullbullbullbullbullbullbullbullbullbullbullbullbullbullbullbullbullbullbullbullbullbullbullbullbullbullbullbullbullbullbullbullbullbull 30 percent 7-12 years 30 percent 13-16 years 2 percent
Mean educational attainment 44 years
Total numberworking in household I
None 7 percent 1
I
One person 77 percent 2-5 persons 16 percent r
1
i Home ownership Own bullbullbullbullbullbullbullbullbullbullbullbullbullbullbullbullbullbull 95 percent Rent ~
i 5 percent
Family owned none
Study of 23 Villages in the Central District 72
Total number of rooms in house Up to 2 48 percent 3 to 4 43 percent 5 to 8 9 percent
Mean number of rooms in house 27 rooms
House type Stone 17 percent Concrete 83 percent
Household wealth status Doing very well by village standards Managing J
Barely able t9 manage
13 percent 47 percent 40 percent
I Disabled persons Total disabled Estimated percentage disability in these communities-f
474 25 percent
Number of disabled persons by households Households with one person disabled Households with more than one person disabled
68 percent 32 percent
73 Study of 23 Villages in the Central District
Age of persons with disabilities o to 4 years 5 to 9 10 to 14 15 to 49 50 to 95
Mean age of disabled I I i
Mean Length of disability j
i Severity of disability Mild Moderate 1
Severe ~
7 percent 13 percent 11 percent 34 percent 35 percent 351 years
196 years
3 percent 49 percent
48 percent
bull
74 Study of 23 Villages in the Central District
APPENDIX II-B
Characteristics of Nilin Catchment Area (Nilin Qibia al-Midieh Budrus and Shubtin)
Households Surveyed Total number of households surveyed 1035 Total population of surveyed households 6752
Males 3433 Females bullbullbullbullbullbullbullbullbullbullbullbullbullbullbullbullbullbullbullbullbullbullbullbullbullbullbullbullbullbullbullbullbullbullbullbullbullbullbullbullbullbullbullbullbullbullbullbullbullbullbullbullbullbullbullbullbullbullbullbullbullbull 3319
Percentage females 492 percent Children laquo 15 years of age) 3606
Percentage children 534 percent
Mean household size 65 persons
Population origin Original inhabitants 88 percent Refugees 12 percent
Work of male household heads Unskilledsemi-skilled labourer 59 percent Private work 8 percent Office work - white collar 7 percent Farmer 7 percent Unemployed in prison or retired - no work 19 percent
75 Study of 23 Villages in the Central District
Education of male household heads None 17 percent 1-6 years 35 percent 7-12 years jbullbullbullbullbullbull 38 percent 13-21 years 10 percent
Mean educational attainment 67 years
Work of female household heads Homemaker 97 percent Embroidery and knitting in the informal sectorpart time 2 percent Other - office private and farmer 1 percent
Education of female household head None 43 percent 1-6 years 35 percent 1
7-12 years ~ 20 percent 13-16 years 2 percent bull
Mean educational attainment 37 years
Total number working in household None 9 percent One person 83 percent 2-4 persons 8 percent
Home ownership Own 94 percent Rent 6 percent
Study of 23 Villages in the Central District 76
Total number of rooms in house Up to 2 61 percent 3 to 4 i 35 percent 5 to 8 4 percent
Mean number of rooms in house 239 rooms
House type Stone 15 percent Concrete i 85 percent
I Household wealth status Doing very well by village standards 10 percent Managing 43 percent Barely able to manage 47 percent
Disabled persons Total disabled 199 Estimated percentage disability in these communities-gt 21 percent
Households with one person disabled 69 percent Households with more than one person disabled 31 percent
Sex of persons with disabilities Male 59 percent Female bullbullbullbullbull bullbullbullbullbullbullbullbullbull 41 percent
25 Based on HDI~s population estimate of 9330 persons
77 Study of 23 Villages in the Central District
Age of persons with disabilities o to 4 years 7 percent 5 to 9 11 percent 10 to 14 14 percent 15 to 49 31 percent 50 to 95 37 percent
Mean age ofdisabled 363 years
Mean Length of disability 201 years
i I
Severity of disability Mild ) 7 percent Moderate 45 percent Severe 48 percent
~
Study of 23 Villages in the Central District 78
APPENDIX II-C
Characteristics of Kharbathat Bani Hareth Catchment Area
(Kharbathat Bani Hareth Ras Karkar Deir Qaddis Bilin Kufr Nimeh Beit Nuba Deir Ammar Deir Ibzi
al-Janieh Beit Illu and Jammalah)
Surveyed Households Total number of households surveyed 1847 Total population of surveyed households 13141
Males 6595 Females 1 6546
Percentage females 498 percent Children laquo 15 years of age) 6562
Percentage children 499 percent
Mean household size 71 persons
I I
i I
Population origin Original inhabitants 88 percent Refugees 12 percent
Work of male household heads Unskilledsemi-skilled labourer 59 percent Private work 7 percent Office work- white collar 9 percent Farmer 7 percent Unemployed in prison or retired- no work 18 percent
79 Study of 23 Villages in the Central District iet
Education of male household heads None 16 percent 1-6 years 31 percent 7-12 years 42 percent 13-21 years 11 percent
Mean educational attainment 71 years
Work of female household heads Homemaker 97 percent Embroidery and knitting in the informal sectorIpart time 1 percent Other - office private an farmer 2 percent
i
Education of female household heads None 39 percent 1-6 years j bullbullbullbullbullbullbullbullbullbullbullbullbullbullbullbullbullbullbullbullbullbullbullbullbullbullbullbullbullbullbullbullbullbullbullbullbullbullbullbullbullbullbullbullbullbullbullbullbullbullbullbullbullbullbullbullbullbullbullbullbullbullbull 31 percent 7-12 years 27 percent 13-16 years 3 percent
Mean educational attainment 44 years i
I i
Total number working in household None 8 percent One person 77 percent 2-4 persons 15 percent
Home ownership Own jbullbullbullbullbullbullbullbullbullbullbullbullbullbullbullbullbullbullbullbullbullbull97 percent Rent 3 percent
80 Study of 23 Villages in the Central District
Total number of rooms in house Up to 2 53 percent 3 to 4 ~ 42 percent 5 to 8 t 5 percent
Mean number of rooms in house 25 rooms
House type Stone i bull 35 percent
i Concrete Jbullbullbullbullbullbullbullbullbullbullbullbullbullbullbullbullbullbullbullbullbullbullbullbullbullbullbullbullbullbullbullbullbullbullbullbullbullbullbullbullbullbullbullbullbullbullbullbullbullbullbullbullbullbullbullbullbullbull 65 percent
i
i I
Household wealth status Doing very well by village standards 13 percent Managing 46 percent Barely able to manage 41 percent
Disabled persons Total disabled 383 Estimated percentage disability in these communities-s 32 percent
Households with one person disabled 66 percent Households with more than one person disabled 34 percent
Gender of persons with disabilities Male ~ 55 percent Female 45 percent
26 Based on HDIPs population estimate of 12000 persons
81 Study of 23 Vlllages in the Central District
I
Age of persons with disabilities oto 4 years 7 percent 5 to 9 ibullbullbullbullbullbullbullbullbullbullbullbullbullbullbullbullbullbullbullbullbullbullbullbullbullbullbullbullbullbullbullbullbullbullbullbullbullbullbullbullbullbullbullbullbullbullbullbullbullbullbullbullbullbullbullbullbullbullbullbullbullbullbull 9 percent 10 to 14 10percent 15 to 49 39 percent 50 to 95 36 percent
Mean age of disabled 367 years
Mean Length of disability 206 years
I i
Severity of disability Mild 4 percent Moderate 42 percent Severe 54 percent

I
i I
I I
10 Study of 23 Villages in the Central District
I estimates the population in these villages to be around 40000 persons
I
therefore we have estimated that the CBR project succeeded in reaching about 80 percent of the households found in these communities and the majority of disabled community members who require rehabilitation services Based on HDIPs estimation of population it is reasonable to conclude that the rate of disability in this community is around 26 percent of the total population
I
I 32 Distribution of Population by Origin
I
I The population in these villages was found to be mostly homogenous
with the majority of the population - 87 percent - composed of original inhabitants and the remaining 13 percent holding refugee status (See Appendix I) The percentage of refugees in all three catchment areas were similar making up 14 percent of the Beit Ur Catchment Area and 12 percent in both the Nilin and Kharbatha catchment areas The majority of these villages are located close to the 1948 armistice line Many lived in the villages where they still live today but their agricultural land became part of the State of Israel in the post-1948 period Those were granted refugee or semi refugee status by the United Nations Relief and Works Agency (UNRWA) as they had technically lost their livelihood andor their homes
I
with their land being on one side of the border and domicile on the other This explains the presence of the relatively large proportion of refugees in some of these villages 6 percent of the population in Ras Karkar 5 percent in Deir Qaddis 18 percent in Nilin 9 percent in Beit Sira 75 percent in al-
I
Tireh 9 percent in Satta 12 percent in Beit Ur al-Tahta 8 percent in Beit Liqia 100 percent in Beit Nuba 53 percent in Deir Ammar 56 percent in Budrus 8 percent in Beit Illu 6 percent in Kharbathat Bani Hareth and 7 percent in Kharbathat Misbah Note however that the percentage of refugees
I
I i
1 Barghouthi M and Daibes 1 Infrastructure and Health Services in the West
Bank Guidelines for Health Care Planning the Health Development Information Project Ramallah 1993 pp314-316
11 rict
1S1
lout yof l on ~ of
iUS
nal See ere ent ese the of or
ICY
es er in
ent alshyieit in
i 7 ~es
est
ion
Study of 23 V~llages in the Central District
I I
in the area las a whole is close to the percentage found for the lenin area villages - 1~ percent - the focus of a similar study- to this in 1992-93 and
where a CBR project is in full operation today However this is a considerably lower proportion of refugees than figures cited for the West Bank Oust over one quarter of the population) and the Gaza Strip (roughly two-thirds of the populatiom This is because generally speaking refugees
tend to live] in concentrations within refugee camps and only a relatively small proportion were settled in the urban and rural communities of the area
I I
Population origin and refugee status are significant factors in the initiation and operation of a community based rehabilitation programme for disabled people in that those holding refugee status and their families have access to UNRWA services - especially health educational and social
I
services - that are crucial for the viability of rehabilitation within the community iIt should be noted that UNRWA services are free of charge are able to reach all refugees and are often more developed than those offered by the governmental sector This is understandable in view of the years of military rule and the associated neglect of the public sector that has taken
I
place since 1967 In areas where there are no refugees the population has had to rely on severely curtailed governmental services and on the expanding nationalist iNG04 service delivery system Although this NGO network did
succeed in ideveloping an infrastructure of services a new rather well developed and appropriate approach to service provision and an infrastructure of resistance to occupation it has not and could not have been able to fulfil the needs everywhere particularly in remote and rural
I
i
2 Giacamari R and Jarrar A A Study of 22 Palestinian Villages in the Jenin
District with Special Reference to the Needs of Persons with DisabilitiesThe Northern Regional Committee for Rehabilitation 1994 p14 Henceforth called the Jenin Study
3 Heiberg M and Ovensen eds Palestinian Society in Gaza West Bank and I
Arab East Jerusalem A Survey of Living Conditions FAFO- Report 151 May 1993 p360 Henceforth called FAFO Survey
4 Non-Govemmental Organisation
Study of 23 Villages in the Central District12
cornmunmes because of its nature limitations of finances and context Thus although the central area of the West Bank is known to be privileged to have a network ofPalestinian NGO services focusing on rural areas it is important to note that areas such as the communities that we have studied continue to be deprived 1 of basic services This is a result of the fact that few of the central area services are adequately linked to rural communities with the needed infrastructure including referral procedures This is important in that the success or failure of the CBR programme will also depend on the ability of the programme to link with existing communities basic services or to develop them where absent
I
I I
33 Distribution of Population by Gender
I The overall ratio of males to females in the study population was found to
be almost as expected world-wide with 499 percent of the population composed of females These results are very close to those obtained in the FAFOs Palestinian Society in Gaza West Bank and Arab Jerusalem A Survey of Living Conditions where adult females over the age of 15 years composed 50 percent of the population However theFAFO study also noted a slight over-representation of males in the ages 60 years or alders while an
analysis of PAFO infant mortality data also indicates a slight overshyrepresentation of males in the infant and early childhood years This
information indicates that despite an overall gender distribution that is almost equal in these villages discrimination against women and girls leading to premature death relative to males cannot be ruled out but cannot be ascertained either However the FAFO results draw attention to undue female infant death as well as the premature death of women in older age relative to imen in the same age category This is important as we have
i
I S FAFO Survey opcit pp44-45 See original footnote for complete reference
i i
6 This analysis of infant mortality differences by sex was conducted by Rita
Giacaman utilizing the PAPO Survey data set
13
i
II
II
II
I Study of 23 Villages in the Central District
II
I hus we ant ~ to the the hat ity to
consistently observed the presence of a higher number of males with disabilities in comparison to females as the CBR projects continue to encompass new areas and as communities continue to be surveyed Such results indicate a need to pay special attention to women girls and especially disabled females when operating community based rehabilitation projects
34 Household Size
i The average household size within the overall survey population was
found to be a somewhat surprising high of 69 persons compared to 65 persons per household for the lenin district villages7 As with the lenin
j
to peripheral ones with an average of 66 members in central village families
Nilinvillages the central villages of Kharbathat Bani Hareth and Beit Ur al-Tahta found to have relatively smaller family size than the were a
on
settingexposed-I
and 7 members in peripheral village families perhaps an indication of the he within which central village members live relative to more A peripheral ones
lfS
ed It is I
generally assumed that northern area rural communities tend to be an more under-developed than central area ones mostly because the central area er- of the West Bank offers the possibilities of access to a variety of services lIS including educational and health institutions Within the context of this )st assumption one would have expected smaller family sizes for central area 1to villages as family size is often linked to general exposure improved
1ij
be ue e ve
Ieducational levels and general state of including access to services However it appears that such assumptions are
development within communities
not corroborated by the results of this study Field workers through observation d~ring the period of research in the villages and presently as
I 7 Jenin Study lopcit p15 See original footnote for complete reference
II
8 Exposed in~ this context means a proximity to urban life and its associated
lifestyles and ways of thinking iIi
1
Study of 23 Villages in the Central District 14
they are launching the project have come to believe that despite the I
proximity of these central area villages to main town centres and an abundance of services accessibility continues to be a major problem Clearly the scope of this study does not allow for an adequate explanation of this larger-than-expected family size in these villages although we have discussed the relationship between family size and educational level at a later stage in this report
I
Comparing family sizes in the different catchment areas with the average number ofchildren per household revealed the following
I TABLE 1 I
I Average Household Size and Number of Children by Catchment Area
I
Beit fUr al-Tahta Nilin Kharbatha
I
Average number of household member
i
7 65 71
Average number of 33 35 36 children
As the table above indicates the catchment area with the largest family size Kharbathat Bani Hareth with 71 persons per family is also the area with the largest number of children 36 However this tendency of higher family size and a higher number of children does not surface in the other catchment areas with Nilin having the lowest household size but not the lowest average number of children and with Beit Dr having a family size of
i
9 Kharbathat Bani Hareth has been shortened toKharbatha here and in future
tables
15
iI
I
II
Study of 23 Villages in the Central District strict
IiI
7 - almost that of Kharbatha - but the lowest average number of children One d an the
possible explanation of these results could be the presence of a larger arly proportion of extended families in Beit Ur when compared with the other f this catchment areas and higher fertility in Kharbathat relative to the other areas issed ge in
erage
lffiily area igher other Jt the ize of
future
16 Study of 23 Villages in the Central District
I
I
40 SOCIO-ECONOMIC STATUS OF SURVEY POPITLATION
I The sobo-economic status of the communities surveyed was examined
utilising selected socio-economic indicators including work and educational patterns of male and female heads of households crowding rates home
I
ownership I house type and wealth status Wealth status of individual households i was then cross-tabulated with various indicators to examine the relationships of the different indicators to each other I
I
I 41 Work Patterns amongst Household Heads
i
I Of the4793 surveyed households 8 percent reported that no one in their
household i
I
was working at the time of the survey in contrast to a high of 12 percent that was reported for the Jenin area villages Comparison of the two
I populations should be approached with caution as the two studies were conducted I a year apart from each other However this data suggests a lower rate of unemployment in the central area villages relative to the Jenin district It could be argued that the central area of the West Bank offers more work opportunities for labourers within the West Bank relative to the Jenin district and therefore relieves some of the economic tensions arising from the closure of Jerusalem and the consequent sudden isolation of many wage workers from their livelihood in Israel
i i
10 Jenin Study opcit p18 See original footnote for complete reference
17
r strict
nined tional home idual ie the
their of 12 e two
were lower strict work istrict osure from
I Study of 23 YiIIages in the Central District
I
I Among the adult male heads of households surveyed a high of 59 percent
worked as iwage labourers in an unskilled and semi-skilled capacity only 7 percent reported that they were farmers 16 percent worked as white collar workers or in unemployed at study where a
I indicating that continues to
a private capacity and 18 percent reported that they were the time of the survey These results contrast with the lenin
high of 18 percentreported that they worked in farming11
the economic base of the communities in the lenin Region include agriculture as an important source of income and
livelihood while in the central area communities wage labour predominates as a primary mode of income generation There were no appreciable differences in work patterns among the different catchment areas nor between central and peripheral villages Thus overall it appears that farming composed a very small proportion of the activities and livelihood of all 23 communities regardless of location or linkage to their central village and that on the whole these are communities of primarily wage labourers who seek work either in the urban areas of the West Bank or in Israel and who minimally rely on other modes of generating income within their communities
Examining patterns of work for female household heads we found that as expected the majority of female heads reported not working at all for pay rather working as full time home-makers while 4 percent reported that they worked part time or during their leisure time on knitting andlor embroidery
I earning some income this way The rest - 1 percent - worked in farming or as unskilled Iabourers Again comparisons with the Jenin villages are important in that IiI percent of the Jenin female heads of households reported that they worked as
farmers These results reinforce the notion that the Jenin villages
rely on farming and agricultural production as a relatively important mode of earning income in contrast to the central area villages which appear to have moved more substantially into wage labour in the West Bank and Israeli
Imarkets I
I
I 11 Jenin Study opcit ppl8-19 See original footnote for complete reference
Study of 23 Villages in the Central District 18
42 Educational Attainment amongst Household Heads i II
The results of this survey revealed an average of 7 years of educational attainment for male heads of households (Appendix I) with 15 percent having had no education at all 33 percent having between 1 and 6 years of schooling 42 percent between 7 and 12 years and 10 percent between 13 and 21 years of schooling These results are comparable to the results of male head educational attainment in the Jenin district where the average number of years of schooling was found to be 71 years Interestingly a difference in average educational attainment was noted among the catchment areas in this study with i an average educational attainment of 71 years for Beit I Urand Kharbatha catchment areas in contrast to a low of 67 years for Nilin the area that also has the lowest family size It is not known exactly how this correlation functions Field workers and project managers have isolated some
I
possibilities i for example it could be that larger families have a greater economic base with which to send members to school and beyond
Cross tabulating male head educational attainment with their work I
revealed the following results I
TABLE 2iI EducationalAttainment of Male Heads of Households by Work I - Percentage of Work Category shy
Education In Years
I
Labourer Farmer OfficelPrivate Retired unemployed
orison I
None I I 7 29 6 44 1
I
1 to 6 I 35 46 18 36
7 to 12 I 52 21 40 15 I
I
13 to 21 I 6 4 36 5
Chi square =1574 48321 P lt0005
19 ct
al 19 )f ld le )f n LS
d le lS
le r
k
Study of 23 Vnlages in the Central District
Labourer Farmer I
Yea-s d Eduabn by ~ercertage Yea-s d Eduabn by Percertage
il1tosli
~----I
71012
RetiredlUnempoyedlPrison YeCls d Eduabn by Percertage YeCls d Eduabn by Percertage
~-I
I
I36D1 i i
71012
I~
I Note thatthe table indicates that the highest proportion of those who have
no education at all are in the category of retiredunemployed with 44 percent having no education at all in contrast to 7 percent for labourers and 6 percent for officeprivate work respectively and 29 percent for farmers Given that it is known that many of those who work in farming are in fact
I
older it appears that those with minimal education represent the older generation and that educational attainment has gradually improved in recent years These results are consistent with the FAFO study results on
i i
I
OfficelPrivate
Study of 23 Villages in the Central District 20
educational patterns over time and relevant to both the West Bank and Gaza Stripl
Cross-tabulating educational attainment and type of work also shows a significant association with 55 percent of those who have a post high school education working in white collar jobs or privately in contrast to 34 percent of those with the same educational attainment who work as labourers and 4 percent among farmers (Chi square = 157448321 plt0005) Although a statistically significant association it is important to note that while education might determine type of work education itself is often found to be dependent on wealth status That is as an intermediate variable education can operate on its own determining type of work but educations influence on type of work can also be a reflection of class or wealth category We will have a chance to examine the relationship of work education and wealth at a later stage in this report
I Examining the relationship of educational attainment to the location of
these communities - central versus peripheral villages - as a measure of accessibility to services we found a significant relationship noting a better educational attainment of male heads of central villages relative to peripheral ones Specifically we found that 14 percent of central area village male heads of households stating that they had no education at all in contrast to 15 percent in peripheral villages - probably older people and reflecting the past rather than the present 27 percent having between 1 and 6 years of schooling in central villages in contrast to 34 percent in peripheral villages 47 percent having between 7 and 12 years of schooling in central villages in contrast to 41 percent in peripheral villages and 12 percent having more than 12 years of schooling in central villages relative to 10 percent in peripheral villages (Chi square = 1869292 P = lt 0005)
f
II
IIII
12 FAFO Survey opcit pp136-137 See original footnote for complete reference
rict Study of 23 Vlllages in the Central District 21 i
iaza
EducabnalAttairmeri ci Male Heeds Percertage ci vilIage bcation category
solIS a Legnd
1001 [Iill Periiral
cent CS1tralD40Id 4 zh e
tion 30 Ient rate e of 20
ve a ater
10
n of o
-middot middot middot
e of ~tter
eral I ads These tesults indicate that access to educational facilities in central ) 15 villages is superior to peripheral ones particularly as students approach past secondary school and university age Indeed these central villages do house
of secondary schools that cater to the needs of not only the students of their es village but I the students of nearby villages as well However difficulties in in i transport and having to move from one village to another for schooling shyhan i I
mostly secondary - appears to have a negative impact on educational eral I attainment Ireinforcing existing notions of the need to have services
accessible and within communities for effective provision and universal
I access
I As expected female heads of households were found to have considerablyI I lower education than their husbands with a mean of 42 years for females in tbull contrast to I 7 years for males This is surprising in that the average
co--shy
--0shyII bull
~H~
m1
m
II bullbull
II iiii
m
~ - I middot1 middot I I H middot
bull II I II bull
I
I I I I N01e 1-6 ~alS 7-12YEaS 12+~ars
Educaticnal Ala rrrent
educationalIce i t 4
if
iattainment for female house heads of the lenin district was found i
I i
Study of 23 Villages in the Central District 22 I I I
to be 47 yeats 13 These results continue to reinforce the need to raise
questions regarding the prevailing assumptions that central area villages are advantaged in terms of service provision and relative to the north or the south of the West Bank These results unfortunately suggest that despite the
I
relative abundance of general services including education health and transport in the central area such services do not appear to affect the rural communities concentrated as they are in the towns and leaving rural communities in a more under-developed state than is generally assumed
We found Ia significant association between female heads of households educational attainment and where these women live where once again the Nilin catchment area women fare worse than the others
i
TABLE 3 Educational Attainment of Female Heads of Households
I by Catchment Area I - Percentage of Catchment Area Category-
I
Educational IJevel I
in Years I
None
1-6
7-12
13-16
I
BeitDr Nilin Kharbatha
38 43 39
30 35 31
30 20 27
2 2 3
Chi Square =3477647 p= lt0005
i
13 Jenin Study opcit p24 See original footnote for complete reference
23 ict
rse
ire ith he nd ral ral
Is he
J5
Study of 23 Villages in the Central District
I The above table demonstrates that the highest percentage of female heads
of households is found in the Nilin area with 43 percent having had no education at all in contrast to 39 percent for Kharbatha and 38 percent for Beit Ur Similarly only 20 percent of Nilins female heads have had between 7 and 12 years of schooling in contrast to 27 percent for Kharbatha and 30 percent for Beit Ur While it is clear from these and earlier results in this study that the Ni lin area stands out one cannot conclude from this data that the educational levels of Nilin are inferior to the other catchment areas
This is because this data on education pertains only to female heads of households land does not include information pertaining to all ages As it stands it would be safe to state that in comparison with the educational status
of women of similar social standing - ie other female heads - the data suggests that the Nilin catchment area lags behind the others In this sense a picture begins to emerge where the Nilin area can be seen as a priority area for the activities of the central area CBR project
I i Educatonal Anairmert of Ferrale Heads I Percenta9= ri Ccichmert Area CaEgJry
50-+--------------- shy
0 Ho6
g 7to 12
D 1310 16 NflinEilitUr
20
30 -t---------gt r--=------t~ur1----
40-+---------il~-------
Le~nd
m Nme
I I
24 Study of 23 Villages in the Central District
I I
Examining the educational attainment of female heads of households in relation to i whether their domicile is in a central or peripheral village we
I
found that as is the case with male heads central village female heads have a significantly higher educational attainment than peripheral village ones with 35 percent of central area women having no education at all in contrast to 41 percent in peripheral villages and 29 percent of central area villages having I had between 7 and 12 years of schooling in contrast to 27 percent among peripheral village ones (Chi square = 1021184 p=0016) This relationship I
Iis weaker than the relationship between education and catchment area In addition it must be remembered that the overall level of educational I attainment for the central area female heads of households is considerably ilow That is although we note differences in locales in general terms all of the women heads of households in the central area appear to be educationally compromised relative to other areas I
IFerrale Hwsehecd Educational Attairment j
I Percentage ~ Village LocafQ1 f50i-T---------------r-------_~
40-t------
304-----
20+------
10+---shy
0+----shy
Le~nd
o R1ripreral A IIa~s
o Caltral Allage
middot bullbull I bullbullbullbullbullmiddot
bull I I bullbull I bull I bull
Ncne
-middot middot middot middot middot middot middot bull bullbull bull I bullbull --~-middot middot middot middot middot middot middot
~---~-----~--middot bull bullbullbull I bullbullbullbull middot bullbull bull bullbullbull bull I
I bullbullbullbullbullbullbull bull bull I bullbullbullbullbullbullmiddot middot middot middot middot middot middot
--------L--~---middot middot
YearsofEtlucaticn
Overall idata on educational attainment of both male and female heads of households indicate a relative deprivation in the Nilin catchment area and
25 rict
~m
we e a ith 41
mg mg hip In
nal bly of
Illy
I I I
I
I Study of 23 Villages in the Central District
peripheral areas relative to central ones This alerts the CBR project to the need to pay I a special attention to these deprived areas as education is so often shown t to be an important determinant of the health and well being of the family particularly the health and well being of disabled family members
I 43 Home Ownership Patterns
Consistent with what is normally found in villages in the West Bank this survey demonstrates that the large majority of inhabitants own their homes Specifically lit was found that 95 percent of the surveyed families owned their homes 14 percent rented them and 1 percent lived in homes owned by their extend~d families (Appendix I) This contrasts with the FAFO data that indicates thatl 26 probably reflecting villages 14 I
I
I 100
percent of the homes included in their survey were rented a considerably higher rate of home rentals in towns than
CentrallyeneaHome ONnershp Patterns Otvnership Categcry bfPercentlge
80 -
-60
40 -
20 -
o HOllEOMer Tenlllnl
OM-erSlip Ca1egcry
Farril)ltlMlef torre i
14 FAFO Survey opcit pp131-154 See original footnote for complete i
reference II
i
of nd
Study of 23 Villages in the Central District26
Examining home ownership by catchment area we found very similar results with 194 percent home ownership for Nilin 95 percent for Beit Ur and 97 percent for Kharbatha (Appendices lIA lIB and lIC) An interesting
I
finding was made when comparing home ownership between central and peripheral villages We found that 8 percent of the homes in central village were rented I in contrast to 36 percent of homes in peripheral villages (Chi square =3286540 p= lt0000) Note that in the lenin district villages no observable differences in home ownership patterns were noted between central and peripheral villages 15 If home rentals is one of the measures of
community d~velopment including the opening up to people from outside the community the presence of market and other such relations then these reinforce the notion that central area villages are more developed communities (With a relatively increased access to the outside world possibly in the initial phases of urhanisation
I I
44 crOlding Rates Ii
Overall ~3 percent of the surveyed houses had 1-2 rooms and 47 I
percent had between 3 and 8 rooms The mean was 26 rooms per household lower than the average of 3 rooms per household for Jenin
I I
While the lenin study showed minimal differences in the number of rooms per household among the different catchment areas substantial differences were noted in this survey Specifically we found that while 48 percent of the houses in the I Beit Ur catchment area had 1-2 rooms 53 percent of the houses in Kharbatha and a high of 61 percent of the houses in the Nilin catchment area lhad the same number
I
I I
15 Jenin Studyopcit p26 See original footnote for complete reference
16 Jenin Study lOp cit p26 See original footnote for complete reference
27
Study of 23 Villages in the Central Districttrict ~ I
i
nilar IU r sting and Ilage (Chi no veen ~s of
~ the hese
I
bullbullbullbullbullbullbullbull I bull I bullbullbullbullbullbullbullbullbullbullbull I bullbullbullbullbullbull I bullbullbullbullbullbullbullbullbullbullbullbullbullbullbullbullbullbullbullbullbullbullibly t bull bull bull bull bull bull bull bull bull bull bull bullbullbullbull I bullbullbull
Central Plea CrONding Rates Percerra ge a f house size by rooms
[1-2 roomsll 530
[ bullbullbull bull
I------- f
~--0 - bullbullbullbullbullbullbullbullbullbullbullbullbullbullbullbullbull I bullbullbullbullbullbullbullbullbullbullbull I bullbullbull
bull bull bull bull I bull I bullbullbullbullbullbullbullbullbullbullbullbullbullbullbull I bullbullbullbullbull I bull I bull ~ iped
----gt-gt-- 3-8 rooms -------bullbullbullbullbullbullbullbullbullbullbullbullbullbullbullbull 470 bullbullbullbullbullbullbullbullbullbullbullbullbullbullbullbull
~ ~ ~ ~
bullbullbull bullbull bullbullbullbullbullbullbullbullbullbullbullbullbullbull bullbullbullbullbullbullbull Ymiddot
~ ImiddotmiddotmiddotmiddotI- ~~~~r
Crowding by Catchment Area 147 I Percenla ge a f houses wi1h 1-2 rooms
old
Jms Ices
Il -r---- shy
- - shy iii--shy
-+shy
c-shy itl- r
4J
1the
3)
the I J)lin
1~ i
d Ktaibatla Nlin
Catdme rt area Bert LX
Dividing the total number of persons living in a household by the total number of rooms - to obtain crowding rates - revealed that overall 38
28 Study of 23 Villages in the Central District
I percent of the surveyed households had a crowding rate of 1-2 persons per
I
room 29 ipercent a rate of between 21 and 3 and 33 percent had a rate of between ~I and 18 persons per room In contrast 50 percent of the households in the lenin villages had a crowding rate of 1-2 persons per room 38 percent with a crowding rate of between 21 and 4 and a low of 12 percent with between 41 and 12 persons per room 17 Clearly central area families
live in more overcrowded houses than those in the lenin district villagesI
CrOdin~ Rates by Region CrQvdng Rates by Region I Jen~-rea Central gtlea
~ ~ ~~-(thTI2IT]rt~~ middotmiddot)middotn~middotgt
middotiiiimiddot~jliiiiimiddot [1
ji1=1BOl L230~J
These results once again point to the need be very careful about prevailing i assumptions of states of development and also alert us to the need
I
to take into consideration the importance of the urban versus the rural setting when studying the socio-economic status of the Palestinian communities in different regions
I Crowding rates differed significantly between the three catchment areas
I 17 Jenin Study opcit p26 See original footnote for complete reference
29 trict
s per te of 0 the
raquoom rcent lilies
gion
about
i ~eed i~till ues ill
eas
Study of 23 Villages in the Central District I
I
I TABLE 4
Crowding Rates by Catchment Area - Percentage of Catchment Area Category shy
I
Crowding Rate (personsroom) Beit Ur Nilin Kharbatha
1-2 41 37 35
21-3 27 28 31
31-18 32 35 34
Chi square =1373177 p=O008
The above table demonstrates that in terms of crowding rates Beit Dr catchment area fares best with 41 percent of the households having a crowding rate of 1-2 persons per room and with 32 percent of the households having between 31 and 18 persons per room Kharbatha and Nilin appear to be similar with 35 percent and 37 percent of households with 1-2 persons per room and 34 percent and 35 percent with between 31 and 18 persons per room respectively Thus although Nilin had the lowest average total number of rooms in its households when compared with the other two areas its crowding rate becomes about the same as for Kharbatha area because of its lower family size It should be mentioned here that there were no differences in crowding rates between central and peripheral villages
I
I
I i I
I
I
I
I
Ibullbull
Ibull l i i i 1middot
30 Study of 23 Villages in the Central District
I
~rowding Rates by Catchrrent Plea I ~~~~cl~~~~h~
I 00
If
10
Legml
II 10-20o o 21-30Nllin lthartetha o 31-180CatchmertArea
I
I45 Wealth Status
I The assessment of wealth status for these communities relative to each
other was completed by the field workersrehabilitation workers This took place by categorising a number of factors that are locally thought to be indicators of wealth Those included the amount of land owned by the family the I type of house that they live in including the materials used to build the house the total number of rooms in the house and furniture fixtures and any electrical equipment that the family owns
An exiination of the data pertaining to wealthstatus revealed that 13 percent of Ithe surveyed households were doing well by local standards 46 percent were barely managing and 41 percent are unable to manage Regional
BeiUr
-----
I
rict Study of 23iillages in the Central District 31
variations Jere noted where once again the Nilin catchment area fared less 1
well than the other two areas we found that 13 percent of the Beit Dr and 13 percent of the Kharbatha households were doing well in contrast to 9 percent in the Nilin catchment area while 40 percent of households in Beit Ur and 411 percent in Kharbatha were unable to manage in contrast to 47
I
percent among Nilin households (Chi square = 2078826 p= lt0005) The differences in wealth status between central and peripheral villages were also significant ~lthough less pronounced 10 percent doing well in the central villages in contrast to 13 percent in peripheral ones and 44 percent unable to manage in tentral area villages in contrast to 41 percent in peripheral ones18
(Chi square r704642 p=O029)
W3alth Status by Areas and Location Percertage of Wealth Category
5O-ri--------------------- shy
I
----I40
3Ol ----II bull II
bull
I
--~20- -
10 shy shy __-=-ach ook ) be the Ctntral
d to ure
t 13 46 IX Note that peripheral area anal
I
1 ] middot middot middotmiddot middotmiddotmiddot middot middot middot middot middot middot middot middot middot middot middot middot middot middot middot middot middot
Legnd
Ii DdnglJlkllt3 Barely Mtraging
1- 0 UrabletoMmcgew
1-
D1-----1
middot middot middot middot middot middot middot middot middot middotmiddotmiddot middot middot
middot middot middot middot middot middot Feuroripreral IltharlBtra Cctctllrent JlrEBIlocction
ampit Ur Nrlin
communities seem to be doing slightly better on the
wealth status scale than central area ones These results remain unexplainedI 1
i
I I
I ~
I
32 i Study of 23 Villages in the Central District
I On the lwhole however while all households that are categorised as
I
unable to manage require the special attention of the CBR projects Nilin appears to he even more of a priority than the other catchment areas I
Jespecially as poverty can have a negative impact on the outcome of disability i
in these communities t I Ii ~
Looking [at the relationship of wealth to the educational status of male and female heads of households we found a significant and strong association
I
hetween the two variables with increasing educational status with wealth II I
- Percentage of Wealth Category -
I
I Doing well Barely managing Unable to manage I
No educatioh at all 8 11 22
1-6 years 31 34 33
7-12 years 46 43 37 I I
13-21 years I 15 12 8
Chi square = J48 84665 J = lt 0005
I
IiTABLE 5
Education of Male Heads of Households by Wealth Status
I
The above table clearly shows that the more educated male heads of households ~re also the wealthier with 8 percent of those who are doing well with no education at all in contrast to 11 percent among those who are harely
I
managing and a high of 22 percent among those who are unahle to manage Likewise 15 percent of those doing well have 13 or more years of schooling in contrast to 12 percent among those who are barely managing and 8 percent
I
among those who are unable to manage i
33
05
t
as In
s ty
ld m
mge
of ell ly ~e
i I
I I
Studv of 23 Villages in the Central District
Education and Vlealth Status of Males eo Percenlageofvkallh Category
~ i ~-l
~ co irg ell
Bcr ely rraragrg -
D U1 etJeto rrm ltg3
i ~=--i middot
middot middot middot middot -- middot middot middot middot middotmiddot middot middot
c-- middot middot middot middot middot middot middot middot middot middotmiddot - -
No edua tim
middotl4J
middot middot middot middot 3J middot middot middot middot middot middot middot middotmiddot middot middot middot middot middot middot middot 10 middot middot middot middot middot middot
middotmiddot shyo
~-shy middot middot middot middot
1 to 6~as 7 to 12 years 13 to 21 ~as
I I
Examining the relationship between educational levels of female heads of households and wealth status revealed similar results with the more educated being the wealthier 33 percent of the well off had no education at all in contrast to 46 percent among those who are unable to manage In this case 34 percent of the well off had 7-12 years of schooling in contrast to 23 percent
I
among those who are unable to manage (Chi square = 6671126 p= lt 0005) Clearly it is beyond the scope of this study to determine whether it is wealth that determines education or whether it is education that leads to the generation of a good income For the purposes of this study it is sufficient to note the relationship between these two variables highlighting their importance onthe prospects for disabled people in these communities
i I I
Attempting to assess the relationship of wealth to an indicator of good living conditions according to local standards we related the type of building materials used in the construction of a house to household wealth status We
34 I
Study of 23 Villages in the Central District
I
found thJt those who live in stone houses tended to be better off than those who live in houses made out of concrete with a total of 24 percent of the houses built with stone Forty-eight percent of the well off lived in stones houses in contrast to 24 percent of those who reported being only able to barely manage and 17 percent of those who reported being unable to manage (Chi square = 22495139 P = lt0005) It therefore appears that in these communities a relatively reliable indicator of family wealth is the material used in the construction of the familys house
Central Area Wealth Status Housebold Wea~h Stctus tyen Percent3ge
I
b middot middot middot middot middot middot middot middot middot middot middotmiddot middot middotmiddotmiddot middot middot middot
middot middot middot middot middotmiddotmiddot middot middot middot middot middot middot middot middot middot middot middot middot middot middotmiddot middot middot middot middot middotmiddot middotmiddot middot middot middot middot middot middotmiddot middot middotmiddot middot middot middot middotmiddot middot middot middot middotmiddot middotmiddot middot middot middot middot middotmiddotmiddotmiddot middot middot middot middot middot middot middotmiddot middotmiddot middot middotmiddot middot middot middotmiddot middotmiddot middot middotmiddot middot middot middotmiddotmiddotmiddot middot middotmiddotmiddot middot middotmiddot middot middotmiddot
middot middot middot I middot middot middot i middot middot middot middotmiddot middotmiddotmiddotmiddotI middot middot middot 10-shy30 middotmiddot middot middot 1 I
middot middot middot middot middot I middot middot middot middotI-shy20 middot middotmiddot middot middot middotmiddotmiddotmiddot middot middot middot middot middot middotI middot middot middotI
r
middot middot middot middot middotmiddotmiddot middotmiddot middot middot middot middotmiddot middot middot middot -shy
middot middot middotmiddot middot middot middot middotmiddot middotmiddot middotmiddotmiddot middot middot middot middot middot middot middot middot middot middot p I I I
~
Ddngwell B3rely rrBl1lging Ul1lbleto rTBncge llkath Sctus
I Likewise looking at patterns of association between wealth status and
crowding in the homes we found a strong association between the two variables with a pattern of rising crowding with decreasing wealth with 55 percent of those doing well living in homes of 1-2 persons per room in
I
contrast to 40 percent among those barely able to manage and 34 percent among those who are unable to manage Likewise a low of 20 percent of those doing
well were found to be living in homes with over 3 persons and
up to 18 per room in contrast to 27 percent among those who are barely managing and a high of 40 percent among those who are not able to manage
35 Study of 23 Villages in the Central District trict
(Chi square = 10189049 p= lt0005) Clearly the level of crowding in fthe hose
the home appears to he one of the indicators of wealth [ones I
Attempting to relate wealth status to the type of work that the male head
e to le to
of household is engaged in showed the following t in the
TABLE 6 Type of Work by Wealth Status - Percentage of work category shy
Unemployed Labourer retiredprisonFarmer OfficePrivate
I
Doing wel~ 11 14 24 6 I I
Barely managing 48 3152 54 i I
Unable to manage 22 6341 34
md wo
1 in ent of md ely age
Chi square = 31863640 p= lt0005
Note that the above table demonstrates that those who are self employed or employed in white collar jobs seem to do best as expressed by the wealth status observed by the field workers and double checked with local sources For instance 24 percent of the officeprivate workers are doing well in
I
contrast to 14 percent of farmers 11 percent of labourers and 6 percent of the unemployed or retired In contrast 63 percent of the unemployedretiredin prison category were found to be unable to manage 41 percent of the labourers 34 percent of the farmers and a low of 22 percent of those privately employed or who work in offices were found to be unable to manage That is other than the unemployed and retired who are generally
I expected to have lower incomes than the rest of the population labourers
I
I
55
36 Study of 23 Villages in the Central District
I
appear to be the worst off followed hy farmers and then office workers or workers in private enterprises
I
Type of Wgtrk by Wealth StatusI
I Percertaga of Vbrllt Category 170
Leyenld
I Ddngwell00 shy
Barely rraraging~I 0j50 -
I140
0 0
130 I
120
110
~=l 1----shyo
Urabletorra~e r----c
ql l
--2C-
I 1-1 t I
I
r-
Ii shy
i i
I I
LalDurEf Farrm afmPria1e REiirEdfU1erTfledfrison lkJrk Ccteggtry
I Looking at wealth status relative to the total number of persons working
at home lindicares that the higher the number of employed household I
members the greater the likelihood of that household being able to manage and doing well
I TrtBLE 7 Wealth Status by Number of Employed per Household
I - Percentage of Number of Employed Category shy
I None working 1 working 2-5 working
I Doing well 3 12 22
Barely a61e to manage 18 47 56 i
Unable to manage 79 41 22
middot
middot middot
37 istrict
ers or
rking ehold mage
I
I Study of 23 tillages in the Central District
Chi square = 29712707 P= lt 0005
WStatus by No of Employed per Hhold of No of Bnploje d Category
I ff)l---------===--------------------
I----------------f
1-------1 middotr-----Imiddot---~middot
1--------1 bull
1 Mlkirg t-bri EmpOfgj Qie~ry
o -----YiN--r+-----~-Ib re Mlkirg
I As the above table demonstrates there is a clear pattern of increasing
wealth with the increase in the number of people working in the household with a low of 3 percent of the households with none working doing well in contrast to 12 percent with one person working and 22 percent with 2-5
I
persons working In contrast 79 percent of the households with no one working are unable to manage in contrast to 41 percent for household with one person working and a low of 22 percent for those with 2-5 persons working As i~ the case with the Jenin district villages this data indicates that household income in these communities is primarily determined by wage work rather than for instance agricultural production land ownership or
I
remittance money from abroad
I ~1-+----1
6J +-----1 I I
~I+-------1
4)1-t--------1
3Jrl------j
JJ 1
I 10---1
I I
Legrd
1m Coirgwe
8 Bcrely ITBragrg o U1lttje to JT1al~
bull bull I bull
bullbullbull r-- shy
middot middot I-~-----JmiddotmiddotmiddotmiddotL--shy
middot
38 Study of 23 Villages in the Central District
I
I
50 DESCRIPTION OF THE POPULATION OF PERSONS WITH DISABILITIES
II
I With 1956 persons with disabilities interviewed in this survey and based
on HDIPs population estimates we estimate the rate of disability in these communities I to be about 26 percent overall and within what we believe to 1 be the national average of 2-3 percent (See Appendix I) Appendices IIA to lIe also demonstrate that there were some differences in the rates of disability among the different catchment areas Note for instance that the highest rate of disability was found in the Kharbathat Bani Hareth catchment area with a total of 32 percent rate of disability in contrast to 25 for Beit Dr and a low of 21 percent for Nilin the catchment area that was found to be the most
I
socio-economically deprived in this survey Perhaps the results can be seen in terms of community deprivation leading to premature deaths among disabled people as one of the explanations for the lower rate of disability in Nilin area relative to the other areas As for the higher disability rates in Kharbatha area those remain unexplained
I
I 51 Distribution by Gender
i
I In line with the results obtained in both the Gaza Strip and lenin studies
a difference in disability rates between males and females was noted with 56 percent of the disabled in the three catchment areas being male and 44 percent female Separating the different catchment areas we note a similar pattern although the differences among the catchment areas is not statistically significant II
I I
urlct
ased hese Ie to A to iility rate
ith a low
nost n in bled area atha
lies h 56 d 44 nilar ally
39StudYof 23 Villages in the Central District bull I
I
TABLE 8 Disability by Sex and Catchment Area
- Percentage of Catchment Area Category -
Beit Ur Nilin Kharbatha
Males 55 59 55
Females 45 41 45
I Di~ability by Sex and Catchment Area
1
P ercenta ge 0 f eaten rren t Prea eategory ~
legrd
g Maes U Femaes
---Oraquoraquo---------J~~___~_____--l-~~~___J
Nlin Krartniha CaldmertArEB
ri shy~
Given t~at women in the survey population compose 499 percent of the population it
can only he concluded that the missing females have not been
included in the surveyor alternatively they may have suffered the combined effects of disability and the discrimination against women in Palestinian
I
~o Study of 23 Villages in the Central District
society leading to their premature death We will have a chance to examine the remaining data from this gender perspective later below
I
I
i I
52 Distribution by Age
I
The age of persons with disabilities included in this survey ranged between a few months of age to 95 years old The mean age was found to be
I
I359 years (Appendix I) rather higher than the mean age of 296 years for the disabled of the lenin district This reflects the higher proportion of 1 older people found in this survey relative the lenin one In this survey 29 percent of the disabled were under the age of 15 35 percent were between ] the ages of 15 and 49 and a high of 36 percent were aged 50 years or older in contrast to 26 percent of the lenin district disabled being 50 years or older
I II Aga Distribution in tre Central Area I Percer1agl ci Pje Ehket
I
j I
I I I
II I I
I
I
I I
I i I
19 Jenin Study opcit p3 See original footnote for complete reference
41 StudY of 23 Villages in the Central District strict
I j
rmine Compari~g this survey data to data on age for the West Bank and Gaza Snip we find that people 65 years or older compose not more than 4-6 percent of the population 20 In contrast in this study they compose 15
percent of the population While one would expect that as mortality is reduced within any population the rate of old age disabilities rises it is not clear if these results are merely a reflection of increased longevity They could also 1 be interpreted in terms of the severity of conditions within which disabled people live leading to their early death and skewing the disability nged picture towards the normal disabilities of old age They could also reflect the to be rising problem for the aged in these communities and in the area as a whole s for resulting f~om the demographic transition where as average life expectancy m of rises special services for older people - including the fitting of hearing aids 129 and glasses - are not being implemented to cater to these newly emerging Neen needs that reflect the transition that these communities are undergoing This lder data indicates the need to look further into disability care for the elderly lder especially lif contrasted with information pertaining to disability types that will follow
While I no appreciable differences in the age distribution of disabled people was noted when comparing the different catchment areas we found significanf differences between central and peripheral locales Six percent of disabled people in central areas were found to be under the age of 15 years in contrast to 8 percent in peripheral areas 12 percent between 5-14 in the central areas in contrast to a high of 24 percent in peripheral ones 47 percent between 15-59 in central areas in contrast to 44 percent in peripheral ones an~ 35 percent of disabled people in central areas found to be 60 years of over I in contrast to 25 percent in peripheral areas (Chi square = 1900316 P lt0005) These results indicate that the rates of disabilities in
j
the age bracket of 0-4 years are about the same The differences begin to I
appear sharply in the 5-14 years bracket with double the rate of disability in I
peripheral areas than in the central ones This may suggest either that peripheral area disabled children die prematurely because of lack of assistance or that they are exposed to a disabling environment more so than disabled
i
20 FAFO Survey opcit p44 See original footnote for complete reference I I
r I
r I
Study of 23 Villages in the Central District ~2
children in the central area In the age category 15-59 years the rates of disability are about the same for central and peripheral areas However differences again begin to appear among those aged 60 years or over with 35 I percent of the central area disabled falling into this category in contrast to 25 percent among peripheral area disabled I
III
On the whole this data suggests that the CBR project needs to take into account the ispecial needs of older disabled people especially in the central
I area villagd while at the same time focusing on disability early in life I particularly ih the peripheral villages f
t I53 DUfation and Types of Disabilities II
IThe mean duration of disabilities in these communities was found to be I
20 years with 21 percent of the disabled reporting having had the disability I
for 0-4 years 17 percent for 5-9 years 23 percent for 10-19 years and a high of 39 dercent with disabilities for 20 years or more
I
Duration of Disability Percertaoe ci lgt(Je BrakEi
1D-19yw rsl
I I
I
I I
I
I
rict Study of 23 Villages in the Central District middotB i
i I
s of In total 25 percent of the disabilities were related to movement a high of ver 44 percent were related to disabilities of the sensory type - visual hearing 1 35 and speech -I and 31 percent were multiple in nature with mixed mental ) 25 learning difficulties as well as seizures and physical symptoms associated
with mental disability There were no differences in disability type either by catchment area or locale - central versus peripheral villages - however
into attempting to relate age to the type of disability revealed the following ural life
I I
) be ility ld a
i I
I
The abdve table
TABLE 9 Disability Type by Age
- Percentage of Age Category shy
I I
I
I
Physical I
I
I
Sensory I I I
Mentalphysical
0-14 years 15-59 years 60 years or more
24 24 28
37 39 61
39 37 11
Chi square = 7297256 P lt0005
demonstrates that there is no appreciable difference in the rate of physical disability by age with 24 percent for those 0-14 years old 24 percent for those 15-59 years old and 28 percent for those aged 60 years or 0ier The picture changes with sensory disabilities where we have a low of 37 Ipercent of those between 0 and 14-years-old who suffer from sensory disabilities in contrast to 39 percent for those aged 15-59 and a high of 61 percent for those aged 60 years or over In contrast mentalmultiple disabilities tare more common with the younger age groups with 39 percent of those between 0 and 14-years-old suffering from mentalmultiple disabilities 37 percent among those aged between 15 and 59-years-old and a
I
low of 11 percent among those who are aged 60 years or older
I
----
Study of 23 Villages in the Central District 44
Disability Type by Age I Percertaps d AQe CaegHy I
Le~nd
Ii Fhysca IG ~r1S)ry o fventlitPhysical
I-------1bullbull -shy
bull bull I bullmiddot middot
1559yEBr5 60+ years bull PgeCategay
D-14yecrs
45 strict
eflect lised are lS on these
age ecial
j
I Study of 23 Villages in the Central District
II
i Disability Type by Age I Percenla ge 0 f Age Ca lego ry70 --r-~----------~---I leg=rd
I6) ~ Pty sica I [3 Senscry
IED ~O_Mentatfhj5lcal
I
I 3J --+------1
-~
~--~------i
I LX) -------===---------o==
-
1---
Iz 10
o ()14 yeltrs 15-69yeelS 6)+ WIS
AgcatEglYY
Of the total number of disabled 4 percent were noted as having a mild I
disability 46 percent with moderate disability and 50 percent with severe disability That is the large majority of the disabled surveyed in this study require assistance and rehabilitation services
I Severity ofDisablity
Percertage d Disati~ty CltEglYY
IIgtAxJerre dslti itt I
~
~~~~ ~~~~~ ~ ~~~~jJ~ll~ ~ ~~~~~)~ ~ ~~~ ~ ~
iiI II
I I
II
IiI
46
54
Study of 23 Villages in the Central District
Daily Living Skills
TABLE 10 Petformance of Daily Living Skills - Number of Persons by Skill Level shy
Unable to or help
Performs with Difficulty Perform
Eats 36
Cleans
60
87
Toilet
160
114 64
Dresses 78150
II
I
IiIIII
IIII
I
Sits
I
III 2559
I
II
iI
I
I
Ii
I
Stands 68 53
Moves inside house 46
Movesl outside house
94
104 123
WaUG ten steps 103 63 i
Understands instruction 121 41
Expresses needs 40
Understands sign language
89
94 27
Uses ISign language 32
Lip-reads
109
4356
I
I
47
I i I i I f
I Study of 23 Villages in the Central District rict
I I I bull bull
The above table demonstrates that among those where the question IS
relevant a fotal of 2139 different daily living skills need to be learned by these disabled persons with an average of 21 skills per disabled person living in the~e communities These results indicate the need for CBR projects
I
that can actively take part in assisting the disabled in performing activities of daily living1 releasing pressures off the disabled as well as their caretakers
Iwho are usually women I
55 cokmunity IntegrationI
I The degree to which persons with disabilities are integrated into their
community [was measured by the level of participation of disabled people in a variety of family social and educational activities Analysis of the data on children revealed the following
I T1BLE 11 Selected Social Activities of Children with Disabilities
I PERCENT OF TOTAL ACTIVIT~
NUMBER OF CHILDREN I I
Plays regularly with peer children lt 15 71
I Plays as a younger childwith younger 19 children I
IDoes not play at all 10
I I
I I
6-I8 years old goes to school regularly 52
I Went to school as a younger childno 4 homework
INo 35I
I i
Special rehabilitation school 9
I
rIfI
II
I
I IIii
48 Study of 23 Villages in the Central District
I The above table is interesting in more than one respect Firstly 10
percent of children do not play at all 19 percent play with younger childrenas ia younger child and 71 percent play regularly This contrasts with the Jenin data where a high 25 percent of the children were found not to play at all 21 percent were found to playas younger children and 54 percent were found to play regularly Although it is impossible to ascertain with accuracy the causesI of these differences between the different areas the data suggests that children in the central area communities are relatively more integrated than in theIJenin area assuming a similar degree of disablement
The above table also shows that 52 percent of the central area disahled children go to school 4 percent go to school as younger peers 9 percent go to special rehabilitation schools and a high of 35 percent do not go to school at all In lenin it was found that 43 percent of children go to school regularly 5 percent as younger children 7 percent with no homework and a high of 44 percent do not go to school These results do reinforce the suggestion that due to the accessihility of services in the central area shy
Imiddot
I
special rehabilitation schools for instance - in addition to other factors such as knowledge and exposure to alternative services for disabled people disabled children in the central area are relatively more integrated than the lenin area Nevertheless these results also demonstrate that a high proportion of children with disahilities do not have access to school and do not play
I adequately making children a priority for the CBR project operating in the area I
Examining this data in terms of the community in which these children
live wf noted a significant difference among the children in terms of attendance of school hy catchment area
I
49 ct
lO er th ly re -y ts ~d
~d
~o
01 01 a
he l shy
h e he m ay he
en of
Study of 23 Villages in the Central District
TABLE 12 Childrens School Attendance by Catchment Area
- Percentage of Catchment Area Category -
Beit Dr Nilin Kharbatha
I Yes go to school 51 41 36
I As younger or no homework 1 9 6
No 43 44 43
Special I
rehabilitation school 5 6 15
I I
Chi square = 2086095 p lt 0005
The above table shows that 51 percent of the disabled children of Beit Dr go to school normally in contrast to 41 percent in Nilin and a low of 36 percent in Kharbatha The lowest level of school attendance in Kharbatha can be explained in terms of the children there attendinghaving access to rehabilitation school with 15 percent of the children attending such schools in contrast to 6 percent in Nilin and 5 percent in Beit Dr In contrast 43 percent of the children of Beit Dr do not go to school at all compared to 43 percent fori Kharbatha and 44 percent for Nilin Thus it appears that Nilins children ar~ a priority for action
I
I
I
r 50 Study of 23 Villages in the Central District
I
School Attendance by Catchment Area Percen1a ge0 f Catch rrent Catsgory
8J----r----------~----_r_-~=-~
------------1
e I Goas to sctcd Y(lJrgerlro hl lrelMfkI I
middot middot middot i
10
JJ
Ngt CatdmertArm CatEgay
Le~rd
o 8ErtU e Nlin
E3 KIBboth a
A rather interesting and inexplicable relationship was noted between the rate of att~ndance of disabled children in schools and whether the locale is a
central or peripheral village Usually the assumption is that because central village families have access to schooling more so than peripheral ones one would expect that central village disabled children would be more integrated in schools than in peripheral villages However in this survey it was found that a high of 50 percent of central area village children do not go to school I at all in contrast to 33 percent for peripheral village children (Chi square = 1O7879 p= 029) These results suggest that factors other than accessibility are operational here impeding access of central village disabled children tq schools Stigma is believed to be a factor by field workers who have observed that stigma associated with disability is more strongly felt I among fa~ilies living in central villages relative to peripheral ones We will have a chance to examine this question later in this analysis
I
I Examining the data on social integration for the disabled population as a
whole wei find the following II I i I
I
51
i
iI
t
- Percentage of Total Population of Disabled shy
ACTIVITY PERCENTAGE OF TOTAL
Regularly joins family activities 90
Sometimes i 6
Not at all 4
III
i II
I
I
II
i
III
j
I
I I
i
ii
Regularly joins social activities 68
Sometimesi 15
Not at all I 17
Regularly Ihas jobincome 20
Sometimek has jobincome 8
No job or income 78
I
a I
III
1
1 )
t
I
i Study of 23 Villages in the Central District
TABLE 13 Selected Social Activities of Persons with Disabilities
The lbove table contrast with the Jenin area villages in that while 90 percent
I olf the disabled stated that they regularly join family activities in this
survey only 62 percent of the lenin area disabled responded positively to the
1
IiiII
52 Study of 23 Villages in the Central District
I
III
I III
question Additionally 68 percent of the disahled in this survey reported regularly joining social activities in their community in contrast to only 29 percent of the disabled in the lenin area These results demonstrate a significant difference in the integration of disahled people with the central area disabled appearing to he rather more integrated into community life than the lenin villages Even when it comes to having a job or regular area income the difference is clearly in favour of the central area villages with 20percent of the disabled in the central area reporting having a regular job or income in contrast to only 8 percent among the disabled of the lenin area These results were consistent across different age categories where children adults and older people appeared to have a similar pattern of integration indicators riegating an explanation of these results in terms of age Given also that th~ large majority of the disabled in this population are suffering from moderate to severe disabilities it does not make sense to suggest that they are better integrated than other disabled because their disabilities are of the mild type
I
I Examining the level of integration in terms of catchment areas we found
a significant but weak relationship denoting that Nilin area disabled are less integrated socially than the other areas with 72 percent of the Beit Ur area disabled stating that they regularly join social activities in contrast to 68
I
III
percent of Kharbathas disabled and a low of 60 percent for Nilins disabled The relationship disappeared when relating catchment to family activities While care must be taken not to make out of this data more than it can yield these results suggest that Ni lin disabled people are less socially integrated than the rest in consistency with the previous findings pointing to Nilin disabled people as a priority for action
Service Provision for Disabled People 56
I On the whole a high of 81 percent of the disabled of these communities
had sought services related to their disabilities in the past in contrast to a
I
II
low of 57 percent for the lenin area villages Of those who received services the large i majority - 91 percent - received medical or medically related
53 iet
ed 29
a raj an lar 20 or a n on en 19 lat of
Id ss ~a
8 1 s I ~d
III
s a d
Study of 23 Villages in the Central District
services such as operations special tests medications or physiotherapy and only 9 perce~t received rehabilitation services and training Interestingly only 4 reported that they had sought Arabic Medicine for a cure There were no appreciable differences in the receipt of services among the catchment areas
i i
Examining the receipt of service in terms of the community in which the disabled live there were significant differences noted with a high of 27 percent never having received any service in Nilin in contrast to 18 percent for Beit Dr I and 17 percent for Kharbatha with 70 percent of the Beit Dr disabled having had medically related services in contrast to 71 percent for Nilin and 79 percent for Kharbatha and a high of 12 percent of the Beit Dr disabled having received rehabilitation services in contrast to a low of 3 percent for Ni lin and 4 percent for Kharbatha (Chi square = 343195 P = lt 0005)
Receipt of Services tJy Catctrrent Area
Percena ge 0 f SeN ce Category I aJ 7-r--------------==-------r--------------
Legmir i
4)+----1
70H- _i m BatU I
I EDci--------- shy
I i
9]H----------shy I 4J-+--__~ _ I 3)-t--~-~----
I I
I 10
o
I Sa-vire Qt ~ ay
o Nlin
o Ktarbaha
Malicas av ire
I A simdar pattern was noted when comparing central and peripheral
villages 21 percent had no services 66 percent had medical services and 13
54 Study of 23 Villages in the Central District
percent had rehabilitation services for the central villages as opposed to 19 percent with no services 75 percent with medical and 6 percent with rehabilitation services for the peripheral villages (Chi square = 107879 P =003) These results indicate that although the large majority did receive I some form of service services accessible to disabled people remain mostly of the medical type and identification of the difference needs of service for this population required a concerted effort from the part of the CBR team to uncover with the aim of fulfilling them These results also demonstrate that peripheral areas have relatively less access to services even of the medical variety than the central ones with this highlighted once again in the Nitlin area as a whole
r
I I
Receipt of Services by Village Location 1
Pe rcerta~ d servi ceCltiegory 80--------------------------~
Le~nd
70-+------------1 II Ca1t rallliDages
o Feripteral vaiagES 100-+--------shy
i i 50-+--------shyr
i 40-+--------- shy
30-+--------shy
20-1-shy
10-+-shy
o No9ll4ce Rdlabilitaticn reNcervedical-raataI el4ce
SeNceCcteggtry
I
55 strict Study of 23 Villages in the Central District
to 19 57 Difficulties Faced by the Families of Disabled with
People879 I
Izeive I
When families were asked about the types of problems they faced as a this ly of
result of having disabled family members a high of 31 percent stated that m to they have no problem Of those who thought they had problems a low of 9 that percent believed that they had problems related to access to medical services
Iical or the search for a cure 15 percent denoted financial matters - such as an rilin income or job for the disabled person - as a major problem affecting family
life and a I
high of 40 percent noted that their problem is psychosocial the stigma or Ipsychological and social complications of disability making family life difficult Interestingly 5 percent noted that they have a problem in having educational access for disabled people and a high of 32 percent noted that daily physical difficulties in handling the disabled were the biggest
problems would face
Perceived Disabil~y-Related Protiems Percertags ci Reooted Prctgtlem
I Wediall-raatEd I
Educaticnal access
I Rnarciall-~mBit
FSyhcsocial
56 Study of 23 Villages in the Central District
Relating these responses to the age of the disabled person we find that psychosocial problems affect families with disabled children or adults to a much larger extent than families with disabled older people with 40 percent of families with disabled children and 49 percent of families with disabled members between 15-59 years noting psychosocial problems as important in contrast to 19 percent among families with disabled people who are 60 years or older Interestingly problems related to the physical difficulties of limited access to technical aids such as hearing aids and wheelchairs and the physical difficulties encountered by women in dealing with this situation were more strongly pronounced among families with older disabled people 59 percent of the families of disabled people who are 60 years or older noted this as a primary problem in contrast to 30 percent among families of disabled children and 24 percent among families of disabled adults 15-59 years (Chi quare = 4755373 P lt0005)
Perceived Importance of Problems Percertage d ~e Bracket
oo--------------------~--------_ L~nd
1m FSChaodal p-obkms irrpat3nto coosstl1echrical aidsirrpolta-rtso-+-shy
60
i 4O-+-shy
I I
i
I 20--t-- shyI
I
0---- shy
1559years 6O+-~ars fgtgeBlac~t
i
Clearly this data suggests that physical difficulties encountered by women - who are the caretakers of the disabled in Palestinian society - relate mostly to the presence of disabled older people and secondarily to children while stigma felt by the family that causes social and psychological problems
0-14yea-s I
I Il I i I
Ibull
57 rict
hat oa ent led III
ars ted the )n Ie ed of 59
Iy te
1
IS
I
Study of 23 Villages in the Central District I
i I I
is more pronounced among families of disabled adults and to a lesser extent children These results are consistent with the prevailing understanding that old age brings with it disabilities that are not the fault of the family but rather part of the ordinary life cycle while other disabilities carry with them blame disabled known
shame and the consequent psychosocial trauma not only for the child but for the entire family as well Indeed it is ordinarily
I
that the presence of disabled children within the family can compromise the marriage options of females within that family It is to this extent that I the disability stigma is felt in this society emphasising the importance for the CBR projects to systematically work on awareness building and consciousness change as the core of any community based disability rehabilitation project 21
I
I
Examining psychosocial problems - or stigma - on its own and relating responses pertaining to stigma to the locale where families live we found a pattern of difference among the different communities where a low of 31 percent of NiIin catchment area families noted stigma as a major problem in contrast to 40 percent among the Beit I Dr villages and a high of 45 percent among the Kharbatha catchment area villages Although these differences were not found to be statistically significant they potentiate the views of the field workers who believe that increasing urbanisation opening up to the urban area and modernisation increase the feelings of stigma related to disability among families These views appear to be consistent with the results of I this study that denote that the Ni lin catchment area is the least developed I of the areas The field worker observations are also potentiated by the finding that stigma is more strongly felt by families living in central villages relative to peripheral ones where a high of 48 percent of central village families reported stigma as a main problem they encounter in contrast to a low of 38 percent among peripheral village families
I
I i
I 21 It sh9uld be noted here that the responses obtained from disabled people relating
to the problem they face were complete for only one third of the disabled making it impossible to analyse the data adequately
I II
I
58 Study of 23 Villages in the Central District
58 Gender
As Appendices I IIA lIB and lIe indicate disabled males outnumbered disabled females in the communities overall and in each of the catchment areas with 56 percent of the disabled being male and 44 percent being female This contrasts with the proportion of women relative to men in these communities where women were found to compose 499 percent of the total population This discrepancy in the ratio of males to females requires further
I
study Although one can argue that this could be explained by a higher rate of disability among males because of biological as well as social or work reasons it could also be argued that the combined effects of being disabled and being female in Palestinian society could be leading to the premature death of disabled females Although it is beyond the scope of this study to examine the way in which gender articulates with disability to produce specific physical as well as mentallife condition effects on disabled women an attempt was made to compare the conditions of sexes given the limitation of available data and with the perspective of identifying priorities for action
There were no relationships between sex and disability rate by catchment area nor by centralperipheral village locale Likewise there were no relationships found between the sex of the disabled and their abilities in the activities of daily living That is theoretically given similar abilities disabled males and females should rate similarly in social integration indicators given that no determinant other than the disability itself is operational However cross-tabulating social integration indicators by sex revealed significant differences in social integration levels between males and females in favour of males and as follows
Study of 23 Villages in the Central District ct
TABLE 14 Social Integration Indicators by Sex of Disabled Person
- Percentage of Sex Category shy
~d
at
19 e al ~r
Males Females
PLAY - FOR CHILDREN ONLY
Yes 66 52I
As younger I 13 22 No I 21 26I
Chi square =74921 p=002 i
GOES TO SCHOOL-FOR CIDLDREN OF SCHOOL AGE 6 TO 18 YEARS-Yes i 48 42 As younger 1 0 No homework 6 0 No i 37 50 Special rehabilitation school 7 8
Chi square =1182295 p =0018
JOINS SOCIAL ACTIVITIES
Yes
73 62
Sometimes 13 18 No i 14 20
Chi square =132354 p= lt0005 i
RECEIVED SERVICES
Yes I 83 79 No services at all 17 21
Chi square =404255 p=0044
l
n
It
o e
1
S
(
I
60 Study of 23 Villages in the Central District
As the above table demonstrates and given similar abilities between disabled males and females in these communities women tend to consistently be at a disadvantage Notice for instance that 21 percent of disabled male children do not play at all in contrast to 26 percent among disabled females 37 percent of disabled male children do not go to school at all compare with a high of 50 percent for disabled females 14 percent of disabled males do not join social activities at all compared with 20 percent of disabled females and 17 percent of disabled male children have not received any service at all compared with 21 percent of disabled females These results clearly demonstrate the impact of gender relations on disability specifically highlighting the negative impact on the integration level of females relative to males These results reiterate the need to view and define disabled women as a priority for the activities of the CBR project
i
I
IIIIIiiI I
i
61 rict
een itly lale es ha not md all rly lly rve len
I Study of 23 Villages in the Central District
60 SUMMARY AND CONCLUSIONS
61 Summary of Study Findings I
This study was based on data collected in a house-to-house survey conducted in 23 villages in the central area of the West Bank A total of 4793 households were visited representing about 80 percent of the total number of households in these communities The average family size was found to be 69 persons per family for the visited households The large
I
majority were found to be original inhabitants of the area while 13 percent were refugees The male to female ratio was almost identical with females
representing ~99 percent of the population
I
Despite the proximity of these villages to the Ramallah urban area and to Jerusalem they nevertheless continue to suffer serious socio-economic problems and general underdevelopment With the majority of household heads working as wage labourers these villages today suffer the economic crunch that resulted from the closure of the occupied territories and the resultant inability of wage workers to enter Israel in search of wage labour opportunities
j
The overall educational attainment of male and female househeads was found to be generally low with an average of 7 years of schooling formales relative to a lower 42 years for females
I
I This survey succeeded in identifying 1056 disabled people living in these
communities Of those 56 percent were males and 44 percent females once
1 I
62 Study of 23 Villages in the Central District
again replicating the pattern observed in the northern region of the West Bank and in the Gaza Strip where disabled males outnumber disabled females and suggesting a pattern of discrimination against disabled females leading to premature death The mean age of the disabled was found to be 359 years considerably higher than the mean found for the northern area villages and for the G~a Strip and with a high of 36 percent of the disabled population being 50 years or older The data pertaining to the length of the period of being disabled was also generally indicative of the prevalence of disabilities of longer term duration with a high of 39 percent of the disabled reporting having had their disabilities for 20 or more years 23 percent for 10-19 years 17 percent [for 5-9 years and 21 percent for 0-4 years The majority of the disabled were found to suffer from moderate and severe disabilities with only 4 percent denoting their disability as of the mild type and indicating the need for CBR projects in these communities
In total 25 percent of the disabilities were related to movement a high of 44 percent i were related to the sensory system - sight hearing and speech shy
I
and 31 percent were multiple in nature mental mixed with other types of disabilities This pattern generally replicates the trend already found in the north of I the West Bank and in the Gaza Strip except for the overshyrepresentation of sensory disabilities within this population Controlling for age the data revealed that the majority of sensory disabilities pertained to older people and therefore should be categorised as the expected disabilities of old age rather than due to the specific circumstances of this particular population i Although one can also question the reasons for the apparent differences I in the rate of disability of old age among the different population studied in the West Bank and Gaza Strip unfortunately the answer to such a question is beyond the scope of this particular study
i
I What is important is to note is that overall a total of 2 139 daily living
skills are still not performed either adequately or at all by these disabled people Moreover the data also confirms the problem of the isolation of disabled people because of a combination of physical difficulties and social stigma and requiring immediate attention in the area of social integration
Study of 23 Villages in the Central District 63iet
programmes This is especially important in the case of disabled children and nk disabled women and girls who neither play nor go to school nor participate
to rrd
in communal life as equally as other members of their society and is
s definitely considered as a matter of priority I
ld in
Overall that data obtained in this study related to the general well being Jf of disabled I people and their families confirms the need for immediate
~s
assistance in the form of rehabilitation programmes focusing on not only 19 physical problems and their solution but also psychosocial problems leading
~
to isolation of disabled persons in these communities le h e
62 Priorities for eBR Programs
f
In line with the above findings it is recommended that f
1 The central area CBR programme takes the shape of not only individual assistance within homes but also the shape of communal education and action On the one hand the disabled people of the central area need assistance to solve their physical problems On the other hand an attempt to gradually change the negative perceptions of communities towards disability shystigma and shame - is very much part of disability rehabilitation in addition to being a fundamental human right
2 The CBR programme also takes into serious consideration the finding I
that a rather high percentage of the disabled in these communities are older people Given that old age can often lead to disability but that society perceives this type of disability in different ways than disabilities caused by other factors - certainly less stigmatising than disabilities occurring due to other causes - it is important that the programme is developed to fulfil this special need Specifically given that the largest percentage of disability
64 Study of 23 Villages in the Central District
related to the sensory system it is imperative that the central area programme links to accessible and affordable secondary services that are well linked into a network of assistance with the CBR programme and can therefore
adequately provide the needed technical aids as well as other forms of assistance needed by this older disabled population Indeed this is an emerging national priority not only because of the specific findings of this study but also because of the gradual change in the nature and relations within and around the Palestinian family Increasingly Palestinian families are becoming nuclear - about two-thirds of the families were found to be nuclear families in the West Bank and Gaza Strip by the FAFO study - more and more women - the traditional caretakers of older people - are moving into the labour force by virtue of economic necessity Yet there is no systematic and parallel evolution of networks of services and assistance to older people during these transitional times In other words it is precisely such groups that fall through the cracks in care systems during periods of change and it is precisely such groups that the CBR programme should pay special attention to
3 That the programme takes into serious consideration the special problems of disabled women and girls as gender relations in Palestinian society compound the effects of disability and pose a double burden on disabled women compared to disabled men That is it is highly recommended that the programme specifically focuses on the needs of disabled women and girls as a priority and as a high risk group
I
4 Finally disability rehabilitation is not merely a programme of assistance The Palestinian experience has developed in such a way that it is also a programme that is directed towards guaranteeing the fundamental human rights of disabled people In this vein an active involvement in animating and assisting the disabled and their families to speak forr
themselves to form their advocacy groups and call for the recognising of their rights is also very much part of the tasks of the staff in this emerging programme In this area consolidating relations with unions for the disabled is a task as imperative as conducting the technical practical work Through such an approach to disability rehabilitation that combines the technical with
Study of 23 Villages in the Central District 65
the human rights component the stage IS set for the central area CBR programme I s success in its endeavours
66 Study of 23 Villages in the Central District
APPENDIX I
Overall Characteristics of the 23 Central Area Villages
i III
Surveyed households Total number of households surveyed 4793 Estimated actual22 number of households
in the 23 communities of the central area studied 5800 Percentage of households surveyed 83 percent
Gender breakdown in surveyed household population Total population of surveyed households 33186
Males 1 16641 Females 1 16545
I
Percentage females 499 percent Children ( lt 15 years of age) 17035
Percentage children 51 percent
Mean household size 69 II
I
I Population origin Original inhabitants 87 percent Refugees 13 percent r
I
22 Based on HDIPs estimated total population of 40000 for the area and 69 for
average family size - see later in Appendix 1 II
III
I I
67 Study of 23 Villages in the Central District
Work of male household heads Unskilledsemi-skilled labourer 59 percent Private work 8 percent Office work- white collar 8 percent Farmer 7percent Unemployed in prison or retired - no work 18 percent
i
I
Education of male household heads None 15 percent 1-6 years 33 percent 7-12 years 42 percent 13-21 years 10 percent
Mean educational attainment 7 years
I
Work of female household head Homemaker 94 percent Embroidery and knitting in the informal sectorpart time 4 percent Farmer ~
I
I percent I
Other 1 percent I i I I
i
Education of female household heads None 40 percent 1
1-6 years J 31 percent I
7-12 years 27 percent 13-16 years i 2 percent
Mean educational attainment 42 years
I
Total number working in household None 8 percent One person 78 percent 2-5 persons 14 percent
68 Study of 23 Villages in the Central District
Home ownership Own ~ 95 percent Rent
Ibull 4 percent
Family owned 1 percent
Total number of rooms in house Up to 2 rbullbullbullbullbullbullbullbullbullbullbullbullbullbullbullbullbullbullbullbullbullbullbullbullbullbullbullbullbullbullbullbullbullbullbullbullbullbullbullbullbullbullbullbullbullbullbullbullbullbullbullbullbullbullbullbullbullbullbullbullbullbull 53 percent 3 to 4 41 percent r
5 to 8 1 6 percent Mean number of rooms in house 26 rooms
House type i Stone 24 percent Concrete 75 percent
Household wealth status Doing very well by village standards 12 percent Managing 46 percent Barely able to manage 42 percent
Disabled persons Total disabled 1056 Estimated percentage disability in these communuies- 26 percent
Number of disabled persons by households Households with one person disabled 67 percent Households with more than one person disabled 33 percent
I
23 Based 011 HOIPs population estimate of 40000 persons
Study of 23 Villages in the Central District 69
Gender of persons with disabilities Male Female
56 percent 44 percent
Age of persons with disabilities o to 4 years 5 to 9 10 to 14 15 to 49 50 to 95
Mean age of disabled
7 percent 11 percent 11 percent 35 percent 36 percent 359 years
Length of disability o to 4 years 5 to 9 years l 10 to 19 years 20 or more years
Mean years disabled
21 percent 17 percent 23 percent 39 percent 20 years
Severity of disability Mild Moderate Severe
4 percent 46 percent 50 percent
i
I
70 Study of 23 Villages in the Central District
APPENDIX II-A
Characteristics of Beit Ur al-Tahta Catchment Area
(Beit Ur al-Tahta Beit Sira AI-Tireh Saffa Beit fUr al-Foqa i Beit Liqia and Kharbathat Misbah)
I Surveyed hou~eholds Total number of households surveyed 1911 Total population of surveyed households 13293
Males 66141
Females rI
6679 Percentage females ~ 50 percent
Children ~ 15 years of age 6947 Perc~ntage children 52 percent
I I
Mean household size 7 persons
Population origin Original inhabitants 86 percent Refugees 14 percent
Work of male household heads Unskilledsemi-skilled labourer 60 percent Private work 9 percent
Office work- white collar 7 percent Farmer 7 percent Unemployed prison or retired- no work 17 percent
71Study of 23 Villages in the Central District
Education of male household heads None ibullbullbullbullbullbullbullbullbullbullbullbullbullbullbullbullbullbullbullbullbullbullbullbullbullbullbullbullbullbullbullbullbullbullbullbullbullbullbullbullbullbullbullbullbullbullbullbullbullbullbullbullbullbullbullbullbullbullbull 13 percent 1-6 years 33 percent 7-12 years i bull bull bull bull bull bull bull bull bull bull bull bull bull bull bull bull bull bull bull bull bull bull bull bull bull bull bull bull bull bull bull bull bull bull bull bull bull bull bull bull bull bull bull bull bull bull bull bull bull bull bull bull bull bull bull bull bullbull 44 percent 13-21 years 10 percent 1 bullbullbullbullbullbullbullbullbullbullbullbullbullbullbullbullbullbullbullbullbullbullbullbullbullbullbullbullbullbullbullbullbullbullbullbullbullbullbullbullbullbullbullbullbullbullbullbullbullbullbullbullbullbullbullbullbullbullbull
Mean educational attainment 71 years I I I I i
Work of female household heads Homemaker
I
90 percent Embroidery and knitting in the informal sectorpart time 9 percent Private work jbullbullbullbullbull 1 percent
I I I
Education of female household head None Jbullbullbullbullbullbullbullbullbullbullbullbullbullbullbullbullbullbullbullbullbullbullbullbullbullbullbullbullbullbullbull 38 percent 1-6 years i bullbullbullbullbullbullbullbullbullbullbullbullbullbullbullbullbullbullbullbullbullbullbullbullbullbullbullbullbullbullbullbullbullbullbullbullbullbullbullbullbullbullbullbullbullbullbullbullbullbullbullbullbullbullbullbullbullbullbullbull 30 percent 7-12 years 30 percent 13-16 years 2 percent
Mean educational attainment 44 years
Total numberworking in household I
None 7 percent 1
I
One person 77 percent 2-5 persons 16 percent r
1
i Home ownership Own bullbullbullbullbullbullbullbullbullbullbullbullbullbullbullbullbullbull 95 percent Rent ~
i 5 percent
Family owned none
Study of 23 Villages in the Central District 72
Total number of rooms in house Up to 2 48 percent 3 to 4 43 percent 5 to 8 9 percent
Mean number of rooms in house 27 rooms
House type Stone 17 percent Concrete 83 percent
Household wealth status Doing very well by village standards Managing J
Barely able t9 manage
13 percent 47 percent 40 percent
I Disabled persons Total disabled Estimated percentage disability in these communities-f
474 25 percent
Number of disabled persons by households Households with one person disabled Households with more than one person disabled
68 percent 32 percent
73 Study of 23 Villages in the Central District
Age of persons with disabilities o to 4 years 5 to 9 10 to 14 15 to 49 50 to 95
Mean age of disabled I I i
Mean Length of disability j
i Severity of disability Mild Moderate 1
Severe ~
7 percent 13 percent 11 percent 34 percent 35 percent 351 years
196 years
3 percent 49 percent
48 percent
bull
74 Study of 23 Villages in the Central District
APPENDIX II-B
Characteristics of Nilin Catchment Area (Nilin Qibia al-Midieh Budrus and Shubtin)
Households Surveyed Total number of households surveyed 1035 Total population of surveyed households 6752
Males 3433 Females bullbullbullbullbullbullbullbullbullbullbullbullbullbullbullbullbullbullbullbullbullbullbullbullbullbullbullbullbullbullbullbullbullbullbullbullbullbullbullbullbullbullbullbullbullbullbullbullbullbullbullbullbullbullbullbullbullbullbullbullbullbull 3319
Percentage females 492 percent Children laquo 15 years of age) 3606
Percentage children 534 percent
Mean household size 65 persons
Population origin Original inhabitants 88 percent Refugees 12 percent
Work of male household heads Unskilledsemi-skilled labourer 59 percent Private work 8 percent Office work - white collar 7 percent Farmer 7 percent Unemployed in prison or retired - no work 19 percent
75 Study of 23 Villages in the Central District
Education of male household heads None 17 percent 1-6 years 35 percent 7-12 years jbullbullbullbullbullbull 38 percent 13-21 years 10 percent
Mean educational attainment 67 years
Work of female household heads Homemaker 97 percent Embroidery and knitting in the informal sectorpart time 2 percent Other - office private and farmer 1 percent
Education of female household head None 43 percent 1-6 years 35 percent 1
7-12 years ~ 20 percent 13-16 years 2 percent bull
Mean educational attainment 37 years
Total number working in household None 9 percent One person 83 percent 2-4 persons 8 percent
Home ownership Own 94 percent Rent 6 percent
Study of 23 Villages in the Central District 76
Total number of rooms in house Up to 2 61 percent 3 to 4 i 35 percent 5 to 8 4 percent
Mean number of rooms in house 239 rooms
House type Stone 15 percent Concrete i 85 percent
I Household wealth status Doing very well by village standards 10 percent Managing 43 percent Barely able to manage 47 percent
Disabled persons Total disabled 199 Estimated percentage disability in these communities-gt 21 percent
Households with one person disabled 69 percent Households with more than one person disabled 31 percent
Sex of persons with disabilities Male 59 percent Female bullbullbullbullbull bullbullbullbullbullbullbullbullbull 41 percent
25 Based on HDI~s population estimate of 9330 persons
77 Study of 23 Villages in the Central District
Age of persons with disabilities o to 4 years 7 percent 5 to 9 11 percent 10 to 14 14 percent 15 to 49 31 percent 50 to 95 37 percent
Mean age ofdisabled 363 years
Mean Length of disability 201 years
i I
Severity of disability Mild ) 7 percent Moderate 45 percent Severe 48 percent
~
Study of 23 Villages in the Central District 78
APPENDIX II-C
Characteristics of Kharbathat Bani Hareth Catchment Area
(Kharbathat Bani Hareth Ras Karkar Deir Qaddis Bilin Kufr Nimeh Beit Nuba Deir Ammar Deir Ibzi
al-Janieh Beit Illu and Jammalah)
Surveyed Households Total number of households surveyed 1847 Total population of surveyed households 13141
Males 6595 Females 1 6546
Percentage females 498 percent Children laquo 15 years of age) 6562
Percentage children 499 percent
Mean household size 71 persons
I I
i I
Population origin Original inhabitants 88 percent Refugees 12 percent
Work of male household heads Unskilledsemi-skilled labourer 59 percent Private work 7 percent Office work- white collar 9 percent Farmer 7 percent Unemployed in prison or retired- no work 18 percent
79 Study of 23 Villages in the Central District iet
Education of male household heads None 16 percent 1-6 years 31 percent 7-12 years 42 percent 13-21 years 11 percent
Mean educational attainment 71 years
Work of female household heads Homemaker 97 percent Embroidery and knitting in the informal sectorIpart time 1 percent Other - office private an farmer 2 percent
i
Education of female household heads None 39 percent 1-6 years j bullbullbullbullbullbullbullbullbullbullbullbullbullbullbullbullbullbullbullbullbullbullbullbullbullbullbullbullbullbullbullbullbullbullbullbullbullbullbullbullbullbullbullbullbullbullbullbullbullbullbullbullbullbullbullbullbullbullbullbullbullbullbull 31 percent 7-12 years 27 percent 13-16 years 3 percent
Mean educational attainment 44 years i
I i
Total number working in household None 8 percent One person 77 percent 2-4 persons 15 percent
Home ownership Own jbullbullbullbullbullbullbullbullbullbullbullbullbullbullbullbullbullbullbullbullbullbull97 percent Rent 3 percent
80 Study of 23 Villages in the Central District
Total number of rooms in house Up to 2 53 percent 3 to 4 ~ 42 percent 5 to 8 t 5 percent
Mean number of rooms in house 25 rooms
House type Stone i bull 35 percent
i Concrete Jbullbullbullbullbullbullbullbullbullbullbullbullbullbullbullbullbullbullbullbullbullbullbullbullbullbullbullbullbullbullbullbullbullbullbullbullbullbullbullbullbullbullbullbullbullbullbullbullbullbullbullbullbullbullbullbullbullbull 65 percent
i
i I
Household wealth status Doing very well by village standards 13 percent Managing 46 percent Barely able to manage 41 percent
Disabled persons Total disabled 383 Estimated percentage disability in these communities-s 32 percent
Households with one person disabled 66 percent Households with more than one person disabled 34 percent
Gender of persons with disabilities Male ~ 55 percent Female 45 percent
26 Based on HDIPs population estimate of 12000 persons
81 Study of 23 Vlllages in the Central District
I
Age of persons with disabilities oto 4 years 7 percent 5 to 9 ibullbullbullbullbullbullbullbullbullbullbullbullbullbullbullbullbullbullbullbullbullbullbullbullbullbullbullbullbullbullbullbullbullbullbullbullbullbullbullbullbullbullbullbullbullbullbullbullbullbullbullbullbullbullbullbullbullbullbullbullbullbullbull 9 percent 10 to 14 10percent 15 to 49 39 percent 50 to 95 36 percent
Mean age of disabled 367 years
Mean Length of disability 206 years
I i
Severity of disability Mild 4 percent Moderate 42 percent Severe 54 percent