i-competere: using applied intelligence in search of ...rcolomo.com/papers/171.pdf · department of...
TRANSCRIPT
Information Systems Frontiers manuscript No.(will be inserted by the editor)
I-COMPETERE: Using Applied Intelligence in search ofcompetency gaps in software project managers.
Ricardo Colomo-Palacios · Israel González-Carrasco · Jose Luis
López-Cuadrado · Antonio Trigo · Joao Varajao
Received: date / Accepted: date
Abstract People in software development teams are
crucial in order to gain and retain strategic advantage
inside a highly competitive market. As a result, hu-
man factors have gained attention in the software indus-
try. Software Project Managers are decisive to achieve
project success. A competent project manager is capa-
ble of solving any problem that an organization may en-
counter, regardless of its complexity. This paper presents
I-Competere which is a tool developed to forecast com-
petence gaps in key management personnel by predict-
ing planning and scheduling competence levels. Based
on applied intelligence techniques, I-Competere allows
the forecast and anticipation of competence needs thus
articulating personnel development tools and techniques.
The results of the test, using several arti�cial neural
networks, are more than promising and show predic-
tion accuracy.
Keywords Competency Gaps · Software Engineering ·Project Manager · Neural Networks · Machine
Learning · Genetic Algorithm
Ricardo Colomo-PalaciosDepartment of Computer Science, Universidad Carlos III, Av.Universidad 30 - 28911. Leganes (Madrid). SpainTel.: +34 91 624 5958Fax: +34 91 624 9129E-mail: [email protected]@inf.uc3m.es of Ricardo Colomo-Palacios
Israel Gonzalez-Carrasco E-mail: [email protected] · Jose LuisLopez-Cuadrado E-mail: [email protected] · Antonio TrigoRibeiro. Institute of Accounting and Administration of Coimbra,Quinta Agrícola, Bencanta, 3040-316 Coimbra. Portugal E-mail:[email protected] · Joao Varajao. University of Tras-os-Montes e Alto Douro, P.O. Box n. 1013 5001-801 Vila Real. Por-tugal E-mail: [email protected]
1 Introduction
The sustainable success of any organization is strongly
associated with the success of the Information System
(IS) projects given that IS are considered to be an im-
portant component of �exibility for all types of enter-
prises [28]. In a rapidly changing business and techno-
logical environment, the ability to develop and deploy
new systems is an important asset that can di�erentiate
one organization from another [62]. Moreover, organi-
zations must continuously innovate in terms of product,
process, market and business model in order to remain
sustainable [61]. Many organizations rely on their inno-
vation process and, in many cases, are dependent on IT
systems. Due to its critical role, there are many studies
devoted to demonstrate the implications of IT in cor-
porate innovation (e.g. [13]).
The importance of IT for organizations has shown
that software development is an important issue, not
only in IT strategy but also in the overall strategy of
the organization [60]. Both the industry and academics
have acknowledged the importance of software devel-
opment industrialization [81] as a response to the soft-
ware crisis, detected in the late sixties and later de�ned
as endemic or chronic (e.g. [31]). More recently, several
authors (e.g. [44,33]) stated that the term �software cri-
sis� is not appropriate or fully justi�ed. However, soft-
ware project failure rates are quite high [21]and Soft-
ware Project Management (SPM) is indeed a critical
issue for the future of the software industry [74].
SPM is a relatively recent discipline that emerged
during the second half of the 20th century [48]. This
function has proven to be one of the most di�cult tasks
in software development [40]. Some authors have indi-

2
cated that the in�uence of competencies on the success
of projects has not been successfully explored (e.g. [29,
57]). On the other hand, many studies have been carried
out to identify and analyze project managers' compe-
tencies (e.g. [4,17,56]) in order to �nd out which fun-
damental characteristics makes project managers com-
petent and successful.
I-Competere which is based on applied intelligence
techniques, predicts competence gaps for SPMs to build
better software development teams and to design per-
sonnel development solutions so that corporation's com-
petence needs can be ultimately ful�lled. Therefore, this
paper focuses on the application of an Arti�cial Neural
Network (ANN) based framework and an optimization
methodology to detect competence gaps within soft-
ware development teams while focusing its predictions
on Planning and Scheduling competencies for SPMs.
The methodology used is guided with the assurance
of the proposed neural model as well as the optimiza-
tion of its performance both in runtime and accuracy.
I-Competere obtains an accuracy rate of 93.23% in its
prediction of Planning and Schedulling competencies ,
which is remarkable for its forecasting accurateness.
It is undeniable that personnel working in software
development teams are one of the most decisive re-
sources for the success of projects but they can also be
the cause of failure [55]. Recent research (e.g. [23]) sug-
gests that human factors have been largely overlooked
or have not been based on empirical studies, in spite of
their importance [58,25]. Given this situation, relying
on competent SPMs can be advantageous not only for a
given project, but also for the organization as a whole.
The aim of this paper is to introduce I-Competere, a
tool designed to detect competence gaps within soft-
ware development teams. In the case of I-Competere,
these competence gaps are focused on a given compe-
tence: scheduling. There are two main reasons for focus-
ing on this speci�c competence. The �rst reason is the
intrinsic limitation that both technologies and available
data present to predict di�erent factors in a given data
set. I-Competere should be able to extend its appli-
cability when predicting more than one variable when
managing large data sets such as historical data . How-
ever, in its current form, it is able to predict a single
competence from a de�ned set of competencies. Taking
this into account, authors need to decide which com-
petence is the most accurate in terms of applicability
and impact. Thus, the second reason is the applicabil-
ity and impact of scheduling and planning as a SPM
competence. According to [42], despite the proclaimed
novelty of the Project Management approach, most re-
cent approaches adopt Fayol's Elements of Management
when attempting to de�ne the responsibilities of the
project manager: Planning, Organizing, Commanding,
Coordinating and Controlling. When focusing on soft-
ware project management, according to [75], the typical
functions of software project management are planning,
team building, monitoring, decision making and report-
ing. Furthermore, some authors stated that planning is
a key competence for SPMs [64]. In any case, this com-
petence is one of the most important competences for
SPMs and is crucial for project success and common to
all project types.
The remainder of this paper proceeds as follows.
Section 2 outlines the relevant literature in the area
of applied intelligence and its implications on software
development. Section 3 discusses the main features of
I-Competere, including a usage scenario and the main
components of its architecture. Section 4 describes the
assessment of this tool. This section also includes a de-
scription of the sample, the method used along with
test results and a �nal discussion. Finally, this paper
concludes with a discussion on research �ndings, limi-
tations and concluding remarks.
2 Literature Review
The theory and modeling of Arti�cial Neural Networks
(ANN) have been inspired by the structure and opera-
tion of biological neural systems, in which the neuron
is the main element. Neurons are the cells which form
the cerebral cortex of living beings. A neuron is a mi-
croscopic structure composed of three parts, namely,
cell body, axon and dendrites. Santiago Ramon y Ca-
jal [14] de�ned the structure of the Central Nervous
System as it is known today. He also showed the bi-
ological mechanisms that govern the morphology and
the connection processes of the nerve cells. According
to these premises, the brain continuously receives in-
put signals from many sources and processes them to
provide the appropriate output response. The brain has
billions of neurons that interconnect to form neural net-
works. These neural networks execute the millions of
necessary functions needed to sustain normal life.
ANN is an information processing paradigm that is
inspired by the biological nervous system [5]. ANN is
also considered a mathematical model, composed of a
large number of elements or processing units also called
neurons. Neurons work together in order to solve spe-
ci�c problems. Similar to its structure, a neural network
is a system that connects neurons through a network
3
and distributes them in di�erent levels to produce an
output stimulus.
Finally, there are many ANN types classi�ed accord-
ing to characteristics such as topology, learning strategy
or the type of input received. Thanks to their compu-
tational power, generalization capacity and dynamics
properties, ANNs have been successfully used in solv-
ing complex problems in various �elds such as process
control (e.g. [51]), vehicle driving (e.g. [63]), weather
forecasting (e.g. [34]) or medical diagnosis (e.g. [8]).
2.1 ANNs applications: People in Software Projects
Given the importance of ANN in various �elds, human
resource management presents some solutions where
this technique can be applied.In fact, according to [7],
ANNs have been widely applied in social science re-
search. Therefore, [76] used ANN to support perfor-
mance management, [43] integrated fuzzy data mining
and fuzzy arti�cial neural networks for discovering im-
plicit knowledge, [79] employed a single-layer percep-
tron neural network model to simulate the knowledge
transfer process in organizational environments, [71] in-
cluded a combination of soft computing techniques to
support competency based selection and assignment of
human resources and [82] resorted to ANNs to support
organizational innovation by exploring competencies.
In the software engineering �eld and with regard to
people's needs, the use of ANNs is not scarce,as it is
one of the most widely used in this �eld [2]. Research
conducted by [1] shows an example of Bayesian regu-
larization of an ANN for estimating the size of software
developments. [47] estimated the cost of the software
by means of a Wavelet ANN. [77] also predicted the re-
liability of the software by means of hybrid models, cit-
ing some of the most representative studies in the �eld.
More recently, [26] focused on an ANN methodology
applied to force e�ort estimation based of a software
project.
I-Competere, the application presented in this pa-
per, focuses on SPMs' competencies. Project Managers
have been the focus of previous studies in the �eld of
applied intelligence (e.g. [46]); however, no e�ort has
been made to forecast competence gaps in the �eld of
software development projects.
3 I-Competere Architecture
I-Competere focuses on detecting competence gaps within
software development teams using applied intelligence
techniques. This function leads to build better software
development teams and to come up with personnel de-
velopment solutions to ful�ll corporations' competence
needs.
Based on this hypothesis, this study describes the
designed ANN based framework to predict skill com-
petencies using a number of relevant characteristics of
software development teams. For this purpose, several
ANNs techniques and heuristics have been applied since
they allow induction of knowledge. For example, they
are able to generalize behaviours based on unstructured
information from previous examples. Furthermore, ANNs
can be applied to a wide range of high-complex and
non-linear domains, due to their variety of design alter-
natives. Nevertheless, the variety of design alternatives
can sometimes be a disadvantage: the lack of guide-
lines leads the designer to make arbitrary decisions or
to use brute force techniques. Some new theoretical ap-
proaches have been proposed in order to facilitate the
design process, but they have not been considered as an-
alytical because they cannot be applied in all cases [65].
Therefore, an optimization methodology has been
applied in order to guide the search for the best neu-
ral model in a given problem and hence improve the
performance of this task both in time and accuracy.
To homogenize the large number of alternatives, they
have been grouped into three phases or stages, following
the premise �neuralmodel = pattern+ architecture+
algorithm�. For each term of the equation, di�erent
techniques and methods will be analyzed in order to
improve the �nal performance.
In order to obtain a reliable framework, the descrip-
tion of the data used is gathered from the research
conducted by [70]. This study analyzes the role of the
project manager from the perspective of the Team Soft-
ware Process (TSP), and it considers the required skills,
attitudes and knowledge for a software development
project. Taking into account the team leader's compe-
tencies in the skill environment, I-Competere predicts
the scheduling skill for a particular team leader so as to
build better software development teams and to design
personnel development solutions. In order to maintain
a �rm's position in the competitive market, an impor-
tant area of research is the team leader's role in job and
activity scheduling.
4
In order to do so, authors have used information
from 10 software development teams formed by 7 com-
ponents, within a time period of 4 years (2006-2010).
Consequently, there are 280 available patterns with in-
formation on the software team, the components and
the 13 skill competencies. Of the 13 skill competencies,
12 have been used as ANN input and 1 has been used
as the output. Table 1 shows a description of each pat-
tern for the team role in a skill environment.
The di�erent ANN components of the I-Competere
framework will be fully described and the optimization
process will be de�ned so as to obtain the best con�g-
uration for each detailed ANN strategy.
3.1 ANN Components
The input vector for each ANN is created based on the
features described in Table 1, and will be the following:
Vinp = {TC,KI,OD,CF,WQ,MF,
MD,EV, PI, LT,BR,GO}
The output vector predicts what the skill scheduling
of a team leader will be Vout = {SC}.The most important features of the ANN networks
included in this study are detailed in Table 2. Two com-
plementary stopping criteria were used during the net-
work training for all ANN alternatives: reaching a spe-
ci�c number of epochs, and early stopping (ES). There-
fore, with the set of data generated by numerical simu-
lation, a part has been assigned to the network's train-
ing (train and validation subset), whereas others have
been assigned to test the results obtained (test sub-
set). To improve the performance of an ANN model,
the extended BackPropagation algorithm has been in-
cluded. This algorithm uses the learning rate (η) and
the momentum coe�cient (µ) parameters in order to
achieve its best. There is no general rule of thumb for
determining the best values of µ and η. However, sev-
eral researchers have developed various heuristics for
their approximation. In this case, we have used a ge-
netic algorithm to �nd the best values for each ANN
strategy. Furthermore, the batch training mode was se-
lected because it presents a balanced behavior between
accuracy and speed [78], and the heuristic of Haykin
has been used to initialize the weights [37].
In regression, the network approximates the output
pattern from an input pattern using a nonlinear con-
tinuous function (F ). In this case, the quality of an
ANN model during the validation phase is obtained by
calculating the coe�cient of linear correlation (r) that
exists between the actual values of that variable and
those obtained by the ANN, being then calculated and
compared to each output variable. This ratio gives an
indication of similarity and the network's accuracy of
response after the training process:
r =
∑i(xi−x̄)(di−d̄)
N√∑i(di−d̄)2
N
√∑i(xi−x̄)2
N
(1)
where the numerator corresponds to the covariance
and the denominator corresponds to the product of the
standard deviations of the variables x (value obtained)
and d (expected value). This statistical indicator de-
scribes the intensity of the relationship between two sets
of variables x (output obtained) by the network and d
(expected output), for example,the linear relationship
between the variables is the intensity measure. As a re-
sult, it shows whether the value of a variable x increases
or decreases in relation to another variable's value y. In
addition, the indicator can take a value in the range
[−1, 1]. When the value is closer to 1, a strong posi-
tive association appears. On the contrary, if the value
is closer to -1, a stronger and negative association ap-
pears, i.e., an increment in the variable x produces a
decrement in d. Finally, if the value is zero or near zero,
the variables are uncorrelated. It is said that a correla-
tion is signi�cant when it is between ‖0.7, 1‖.
3.2 Optimization Process
Following the assumption of
"neuralmodel = patterns+architecture+algorithm"
the developed framework is initially divided into three
components with each one linked to a term of the equa-
tion. Figure 1 shows each one of the designed frame-
work's components and their interactions. The ANN
models have been designed using NeuroSolutions 5.0.
A number of techniques, methods and heuristics have
been included for each of the items in the previous equa-
tion with the aim of improving the performance and ac-
curacy of the neural models used. The main goal is to
determine the best ANN in this scenario and to improve
the performance by optimizing the network design and
by maximizing the input patterns.
This paper de�nes the optimization process described
in the methodology used in the research conducted by
[35] to regression problems. Furthermore, the previous
study is extended with the introduction of a new stage
that will be tested using I-Competere. Therefore, in

5
Table 1 The team leader's role in a skill environment
Skill Indicator Acronym
Inputs (Vinp) Maintain team communication TCIdentify key issues KIMake objective decisions ODCombine forces CFWork quality as a challenge WQMeeting facilitator MFEstablish and maintain discipline MDEnterprise vision EVPromote initiative and creativeness PILead the team e�ectively LTBeing resolute BRMake the team goal oriented GO
Output (Vout) Scheduling SC
Table 2 Initial features of the ANN networks
Feature Description References
Topology MLP, RBF, SVM, RNN, ELN andSOFM
See [35] for more details
Inputs Vinp -Outputs Vout -Hidden Layer and Neuron SVM and RBF: 0 Layer. Other ANNs:
1 Layer with 4 neuronsRules of Tarassenko in [80]
Activation Function (input-hidden-output)
fiden-ftanh-ftanh Based on [10,49,27]
Patterns distribution (train-test-validation)
33%/33%/33% with Hold-Out CrossValidation
Based on [78,59,52,18]
Training Algorithm Extended BackPropagation See [83,78,66] for more detailsLearning Parameters Genetic algorithm in each topology: µ
and η for input layer and output layerIn accordance with the guidelines of[67]
Cost Function MSE simple -Weight Update Batch Based on [78]Weight Initialization Haykin Heuristic Based on [37]Convergence Criteria Epochs [10000] and Early Stopping -
order to achieve this optimization process, the di�er-
ent techniques and methods are grouped in di�erent
stages. There is one stage for each component of the
framework, as well as an ANN initialization stage and
a quality stage to ensure the validity of the results.
The complete methodology with all �ve stages is de-
picted in Figure 2. The �rst stage includes simulations
with di�erent cost functions and compares the behavior
of six well-known alternatives of ANN. The second stage
focuses on the analysis of di�erent techniques which en-
able e�cient functioning in an environment where in-
formation may be limited. The third stage aims towards
increasing e�ciency, selecting the smaller network ar-
chitecture by �nding the best con�guration of hidden
items and pruning the input vector Vinp. This stage will
also analyze the in�uence of each variable on the per-
formance of the ANN. Stage four is a new stage which
includes a comparison of di�erent learning algorithms in
order to improve the performance of the ANN. Lastly,
the new quality stage which is stage �ve, will analyze
the quality of each neural model using a criteria based
information theory to estimate a quantitative measure
of �t that is appropriate for the data used.
The procedure followed for each simulation performed
within this process is outlined below:
1. Select one ANN alternative (Stage 1).
2. Select one cost function per ANN (Stage 1).
3. Find the best µ and η parameters per ANN using a
genetic algorithm (Stage 1).
4. Apply the resampling and distribution method to
the trial set (Stage 2).
5. Select the optimal topology using a genetic algo-
rithm to �nd the best hidden elements (Stage 3).
6. Select the optimal input vector performing the sen-
sitivity analysis and using a genetic algorithm (Stage
3).
7. Train and test the corresponding ANN using the
repeated 20x10 cv method (k-fold cross validation
repeated 20 times with weights being randomly ini-
tialized and 10 folds).
8. Select the optimal learning algorithm (Stage 4).

6
Fig. 1 I-Competere framework
9. Analyze the quality criteria (Stage 5).
Figure 3 shows the component used in for the pat-
tern treatment treatment of the patterns which is re-
lated to the Stage 2 of the optimization methodology of
I-Competere in stage 2. This component lets the user
to select various sampling techniques and to conduct
de�ne several experiments using with di�erent con�gu-
rations for the of distribution patterns.
Finally, Figure 4 shows the interface that leads the
training and validation of the ANN after the initializa-
tion (Stage 1: Initialization: Topology and Cost Func-
tion), the setup of the experiments with di�erent tech-
niques of sampling and distribution patterns (Stage 2),
and the de�nition of the architecture and learning al-
gorithm (Stages 3 and 4). The ANN models have been
designed using NeuroSolutions 5.0.
One of the problems inherent to the techniques used
in I-Competere is the large number of neural model
simulations performed when testing di�erent heuristics,
techniques and methods. A simulation framework has
been developed in order to reduce the number of re-
sources and the complexity of the tests to be performed
as much as possible. This framework includes a number
of components and tools designed to con�gure and au-
tomate the learning process of di�erent types of ANN.
This facilitates the creation, development and evalua-
tion of a series of experiments in a sequential and it-
erative way, thus not being dependent of the designer
during each one of the simulations.
3.2.1 Stage 1. Topology and Cost Function
In this stage and for each scenario, one ANN alternative
is selected as well as the di�erent available cost func-
tions in order to increase the performance of the ANN
model. This ensures that the cost function is minimized
during the training phase. The di�erent topologies and
cost functions incorporated in this research are listed in
Table 3.
Therefore, the correct choice of the cost function
and network topology is important in order to ensure
the most e�cient solution when predicting the Schedul-
ing and Planning competencies.
3.2.2 Stage 2. Resampling and Distribution
This stage includes several techniques to improve the
performance of the ANN in domains with limited data,
maximizing the patterns available for training and test-
ing the network. The list of techniques included in this
stage are detailed in Table 4. More details of these tech-
niques can be found in [35].
Moreover, to reduce the in�uence of random data
partition, some authors have proposed the use of a re-
peated cross-validation (repeated k-fold cross valida-
tion) [19,36,9,24].
This technique ensures that Type I and Type II er-
rors (probability of accepting the null hypothesis when
it is false, known as equal false) will be appropriate

7
Fig. 2 Stages of the ANN-based optimization process
Fig. 3 Example of I-Competere interface analyzing patterns (Stage 2)
Feature Description References
Topology MLP, RBF, SVM, RNN, ELN and SOFM See [35] for more detailsCost Function Lp norms: L1, L2, L∞ See [32,73,38,12] for examples
Table 3 Stage 1. Topology and Cost Function
and that reproducibility (the probability that two ex-
ecutions of the same comparison method produce the
same results, known as stability) will be greater. There-
fore, in this research, the technique of repeated k-fold
cross validation using the con�guration 20x10cv (i.e. 20
repetitions of KFCV with 10 folds) was used.
The best sampling technique and the ideal distri-
bution of patterns allows I-Competere to achieve the
most e�cient performance by maximizing the available
patterns.
3.2.3 Stage 3. Topology Design and Pruning
To ensure optimal generalization ability, the purpose
of this stage is to determine the optimal architecture
in each ANN topology. In order to obtain the smallest
network possible, a genetic algorithm has been incor-
porated to determine the best hidden con�guration ele-
ment and to �nd the best input vector. Furthermore, as
shown in Table 5, di�erent heuristics such as Pruning
and Sensitivity analysis techniques, have been included
to quantify variable importance in the prediction made

8
Fig. 4 Example of I-Competere interface during the process of training and validation
Technique Acronym Description
Hold-Out Cross Validation HOCV Conventional training.K-Fold Cross Validation KFCV10 KFCV with 10 folds.Leave-One-Out Cross Validation LOOCV KFCV alternative with 220 folds.Bootstrap BSR100 Bootstrapping with 100 trials resamplings.Alternative Iterative and Balanced of CrossValidation
AIBCV100 Random generation 100 trials.
Additive White Gaussian Noise (AWGN) AWGN100 Creation of 100 trials with Gaussian distribution noise.KFCV & AWGN K10AWGN100 KFCV10 and AWGN100 methods combination.
Table 4 Stage 2. Resampling and Distribution techniques
Technique Acronym Description References
Sensitivity About the Mean SAM Shows the determination of the in�uence ofeach of the inputs in the output which the net-work obtains.
See [66,72,53] for more details.
Indicator of Variable Criticality IVC Represents in the range [0, 1] the number oftimes which a variable k was outside the rangewhen the prediction has failed, and the totalnumber of times that a variable k has beenoutside the range.
See [35] for more details.
Backward Stepwise Method SWM Eliminates a variable from the input vector se-quentially and analyzes the e�ect on the out-put of the network.
See [30] for more details.
Table 5 Stage 3. Topology Design and Pruning
by the ANN model.
This stage ensures an optimal generalization ability,
since it is responsible for obtaining the smallest ANN
architecture possible.
3.2.4 Stage 4. Learning Algorithm
ANN training is based on minimizing the error function
E with the variation of the weights set which de�ne the
ANN (see Equation 2). Therefore, it is a multi-variable
optimization without restrictions since there is no other
additional requirement needed with respect to the func-
tion or the input variables.
Figure 2 shows the optimization methods applied in
this research study applicable to the weight's modi�-
cation in the ANN's training process. These methods,
classi�ed as heuristic and iterative methods, are applied
9
to multi-variable problems without restrictions where
the analytical solution is not easy to �nd.
∂E
∂w≡ 0⇔ ∇E(w∗) = 0 (2)
Iterative methods present a loop structure where the
problem is initialized and the obtained response is eval-
uated. Depending on whether certain criteria is met or
not, the process either continues or comes to an end.
The problem with this kind of method lies in the fact
that when the algorithm converges to a solution, it is
di�cult to recognize if this is a global minimum or sim-
ply a local solution.
On the other hand, heuristic methods, unlike itera-
tive ones, represent an alternative for cases in which it
is necessary to assure the location of global minimums
or cases where the requirements of the optimization
methods are not achievable (like derivability of func-
tions restrictions, etc.). A typical example of this kind
of heuristic method is genetic algorithms, which try to
simulate laws of natural selection when obtaining sets
of solutions that better �t their environment.
In Table 6, the di�erent learning algorithms included
in this research study are shown. As a result of this
stage, the most adequate learning algorithm has been
selected.
The learning or adaptation process is a crucial step
in the ANN theory, and is responsible for the procedure
to extract the required information from the input data.
If the learning process is incomplete, the values of the
weights will not be close to their optimum values and
as a result, the performance of the ANN will su�er.
3.2.5 Genetic Algorithm
Genetic algorithms (GA) are adaptive methods which
may be used to solve search and optimization problems.
A genetic algorithm is a randomized global search tech-
nique that solves problems by imitating processes ob-
served from natural evolution. Based on the survival
and reproduction of the �ttest, GA continually exploits
new and better solutions without any pre-assumptions,
such as continuity and unimodality. This evolutionary
solution has been successfully adopted in many com-
plex optimization problems and shows its merits over
traditional optimization methods, especially when the
system under study has multiple local optimum solu-
tions [45].
It is assumed that a potential solution to a prob-
lem may be represented as a set of parameters. These
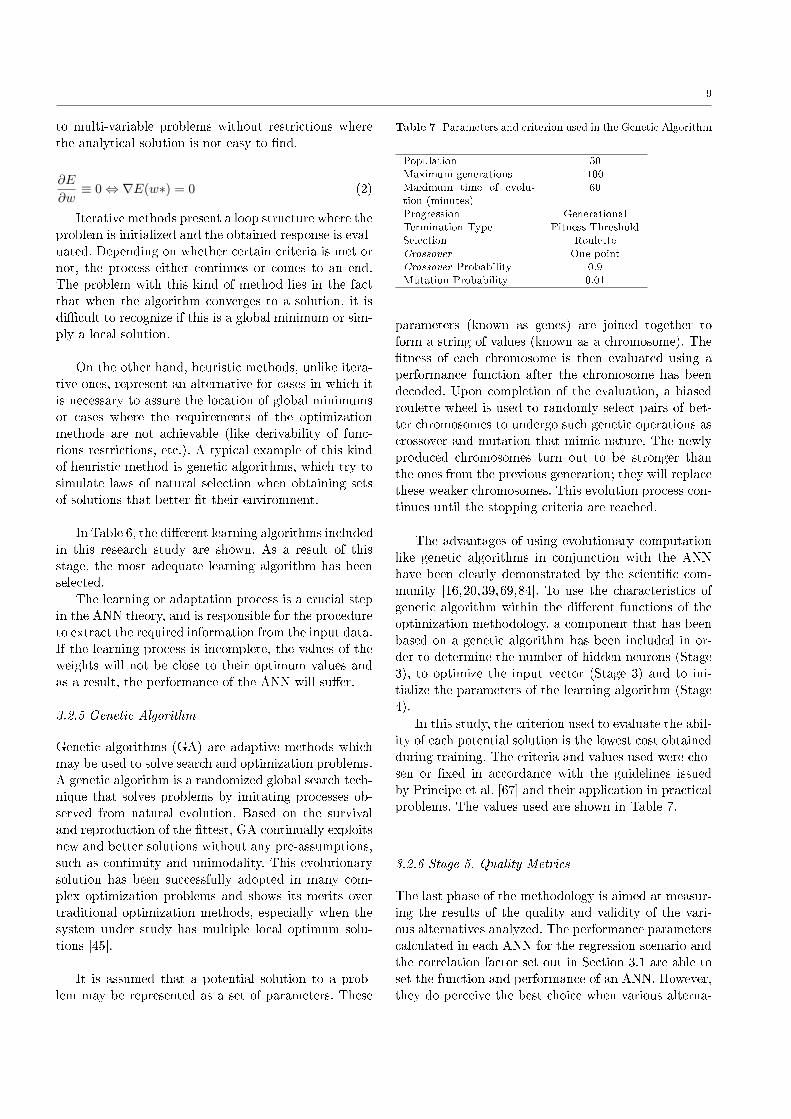
Table 7 Parameters and criterion used in the Genetic Algorithm
Population 50Maximum generations 100Maximum time of evolu-tion (minutes)
60
Progression GenerationalTermination Type Fitness ThresholdSelection RouletteCrossover One pointCrossover Probability 0.9Mutation Probability 0.01
parameters (known as genes) are joined together to
form a string of values (known as a chromosome). The
�tness of each chromosome is then evaluated using a
performance function after the chromosome has been
decoded. Upon completion of the evaluation, a biased
roulette wheel is used to randomly select pairs of bet-
ter chromosomes to undergo such genetic operations as
crossover and mutation that mimic nature. The newly
produced chromosomes turn out to be stronger than
the ones from the previous generation; they will replace
these weaker chromosomes. This evolution process con-
tinues until the stopping criteria are reached.
The advantages of using evolutionary computation
like genetic algorithms in conjunction with the ANN
have been clearly demonstrated by the scienti�c com-
munity [16,20,39,69,84]. To use the characteristics of
genetic algorithm within the di�erent functions of the
optimization methodology, a component that has been
based on a genetic algorithm has been included in or-
der to determine the number of hidden neurons (Stage
3), to optimize the input vector (Stage 3) and to ini-
tialize the parameters of the learning algorithm (Stage
4).
In this study, the criterion used to evaluate the abil-
ity of each potential solution is the lowest cost obtained
during training. The criteria and values used were cho-
sen or �xed in accordance with the guidelines issued
by Principe et al. [67] and their application in practical
problems. The values used are shown in Table 7.
3.2.6 Stage 5. Quality Metrics
The last phase of the methodology is aimed at measur-
ing the results of the quality and validity of the vari-
ous alternatives analyzed. The performance parameters
calculated in each ANN for the regression scenario and
the correlation factor set out in Section 3.1 are able to
set the function and performance of an ANN. However,
they do perceive the best choice when various alterna-

10
Table 6 Stage 4. List of Learning Algorithms
Learning Algorithm Acronym Parameters ReferencesGradient GR Parameter η in hidden and output layer (with
Genetic Algorithm)Introduced in 1847 by Cauchy [15].
Extended BackPropa-gation
EBP Parameter η and µ in hidden and output layer(with Genetic Algorithm)
See [83,78,66] for more details.
Conjugate Gradient CG Parameter η and µ in hidden and output layer(with Genetic Algorithm)
Invented by Hestenes and Stiefel in 1952 [41].
Quick-Propagation QP Second order method Developed by Fahlman in 1989 [22].Levenberg Marquardt LM Second order method Created by Levenberg and Marquardt [50,54].
tive models with similar results appear. To facilitate
this task, two subtasks have been included to evaluate
and compare, from a statistical point of view, the abil-
ity of the designed neural models to be generalized.
The �rst of these tasks includes two statistical es-
timates that indicate the measure of goodness of �t
of the statistical model estimated. These indicators are
quality measures based on Akaike Information Criterion
(AIC) developed by [3] and the principle of Minimum
Description Length (MDL) proposed by [68].
4 Experiments and Results
The basic architecture of the ANNs used in this study
are shown in Table 2. The learning rule for the ANNs is
the Extended BackPropagation, with or without the pa-
rameters, except for the Support Vector Machine (SVM)
topology. The values of the learning parameters were
approximated using the genetic algorithm component
and the rules established in [66]:
� RBF: Extended BackPropagation Learning. η=1.0
y µ=0.7 for the output layer. .
� RNN: Extended BackPropagation Learning. η=0.01
y µ=0.7 for the hidden layer. η=0.1 y µ=0.7 for the
output layer.
� SVM: Learning with η=0.01 for the output layer.
� MLP: Extended BackPropagation Learning. η=0.9
y µ=0.8 for the hidden layer. η=0.1 y µ=0.7 for the
output layer.
� ELN: Extended BackPropagation Learning.η=0.1 y
µ=0.8 for the hidden layer. η=0.1 y µ=0.8 for the
output layer.
� SOFM: Extended BackPropagation Learning. η=0.9
y µ=0.7 for the hidden layer. η=0.1 y µ=0.7 for the
output layer.
In the following sections, the results obtained for
each framework stage are explained in detail. The �rst
stage selects the best ANN strategy for the estimation
of competency gaps and the best cost function con�g-
uration for each ANN is evaluated. The second stage
focuses on the resampling methods and distribution
techniques included when working with limited data.
The third stage determines the best topology possible
and measures the in�uence of the input variables based
on the results of the gap forecasting. The �nal stage
presents the quality and viability of the results obtained
during all the stages of the framework.
4.1 Stage 1. ANN and Cost Function selection
Table 9 shows the results obtained for each ANN and
the Lp, being the L2 norm the one with the best behav-
ior found in the majority of the experiments. Only Re-
current Neural Network (RNN) and SVM with L1 dif-
fer. The �rst conclusion obtained is that the Radial Ba-
sis Function (RBF), Multilayer Perception (MLP) and
Elman Network (ELN) networks with L2 norm are the
ones with the best performance when analyzing com-
petence gaps. The Self- Organizing Map (SOFM) and
SVM are the less classi�ed ones, with an average di�er-
ence of 0.1705 and 0.1546 after 20 runs in comparison
to the RBF with L2 norm.
Once the best cost function con�guration has been
determined for each topology, ANN performance will
be improved in the following stage by maximizing the
input patterns.
Table 9 Stage 1. ANN performance based on di�erent cost func-tions (correlation factor. 20 runs)
ANN L1 L2 Linf
ELN 0.8071 0.8564 0.7612MLP 0.8438 0.8659 0.7755RBF 0.8395 0.8699 0.7818RNN 0.7512 0.7059 0.6891SOFM 0.5092 0.6994 0.4591SVM 0.7153 0.5252 0.6757

11
Table 8 Overview of ANN and cost function strategies included in the stage 1.
Method Acronym DescriptionRadial Basis Function RBF Conscience full competitive rule. Euclidean metric. Cluster Centers=70. 14-
0-1 topology.Recurrent Neural Network RNN Partially recurrent. 14-1-1 topology.Support Vector Machine SVM Kernel Adatron algorithm. Step size 0.01. 14-0-1 topology.MultiLayer Perceptron MLP 14-4-1 topologyElman Network ELN Inputs feeds the context units. 0.8 time constant. Momentum learning rule
14-1-1 topology.Self-Organizing Map SOFM Square Kohonen Full method. Rows=5, Columns=5, Starting Radius=2, Fi-
nal Radius=0. 13-1-1 topology.
Table 10 Stage 2. Resampling methods performance (% correlation factor. 20 runs)
ANN HOCV KFCV LOCV BSR AIBCV AWGN KFCV+AWGNELN 0.8564 0.8201 0.8755 0.8256 0.8854 0.8614 0.8893MLP 0.8659 0.8746 0.8913 0.8425 0.8588 0.9049 0.9150RBF 0.8699 0.8527 0.8633 0.8575 0.8697 0.8875 0.8924RNN 0.7512 0.7854 0.8302 0.7971 0.8175 0.8093 0.8148SOFM 0.6994 0.7543 0.7046 0.7960 0.7665 0.7852 0.7532SVM 0.7153 0.7893 0.8058 0.7681 0.7183 0.7234 0.8063
4.2 Stage 2. Resampling and Distribution
Early stopping and cross-validation has been introduced
in this experimentation to reduce computation time
and to prevent the occurrence of overlearning during
training. The results obtained after the second stage as
shown in Table 10, ratify the conclusions made by the
authors in previous research studies. This shows that
the techniques included in this framework can be used
in the domain of competence gap forecasting and thus,
provide ANN performance improvement. The column
�HOCV� in Table 10 contains the same results as Stage
1 since this technique has been used in the experiments
involving this stage.
The most e�cient technique in this stage has been
the noise injection with the Additive White Gaussian
Noise method (100 new patterns with noise) and ten k-
fold cross validation (AWGN100 + KFCV10), because
the accuracy of all tested ANN has increased. Another
interesting technique is the Leave One Out Validation
(LOOCV). Despite its positive results, LOOCV has cer-
tain disadvantages such as its complexity in applica-
tion as a model selector and its high variability. In this
case, there is a lack of continuity, given that a small
change in the data can cause a large alteration in the
model selected [11]. Although the Bootstrapping tech-
nique (BSR with 100 pattern resamplings) is the best
resampling alternative for the SOFM network, the re-
sults obtained are far from those obtained with ANN.
The other techniques, Alternative Iterative and Bal-
anced of Cross Validation (AIBCV with random gen-
eration of 100 patterns), Kfold Cross Validation (KFCV
with 10 folds) and Additive White Gaussian Noise (AWGN
with 100 patterns and with Gaussian distribution noise)
present in some cases, an irregular behavior during the
experiment and show a lower chance of improvement.
Among the three best networks (RFB, MLP and
ELN) the ANN topology with a higher rate of improve-
ment has been the MLP with theAWGN100 +KFCV10
technique. The RBF and ELN networks also showed
a remarkable improvement but do not match up with
the results obtained in MLP. Therefore, taking into ac-
count the experiments of this stage, the AWGN100 +
KFCV10 with early stopping resampling technique will
be used in the following stages.
4.3 Stage 3. Topology Design and Pruning
One of the most important aspects of achieving a proper
generalization ability is to adjust the size of the net-
work according to the requirements of the problem to
be solved. The two aspects that can be chosen by the
network designer are the hidden elements, layers and
neurons as well as the variables of the input vector.
For the �rst case, based on the architecture shown
in Table 2, the genetic algorithm has reached the best
con�guration of hidden elements, layers and neurons for
each ANN. As seen in Table 11, one single hidden layer
is enough in all the ANN, except for the SVM because
it does not need any hidden elements. This hidden el-
ements con�guration simpli�es the �nal architecture of

12
Table 11 Stage 3. Best network design and input vector with Genetic Algorithm (correlation factor. 20x10cv)
ANN Hidden Layer-Neuron Genetic Algorithm (Input Vector) Stage 3ELN L1N3 Full Vinp - {PI,CF,GO} 0.8980MLP L1N6 Full Vinp - {CF,BR,GO} 0.9224RBF L1N4 Full Vinp - {PI,BR,GO} 0.9107RNN L1N5 Full Vinp - {PI,BR,GO} 0.8442SOFM L1N4 Full Vinp - {CF,MF,GO} 0.8153SVM None Full Vinp - {CF,BR,GO} 0.8255
the ANNs and the complexity associated with them.
Furthermore, Table 11 indicates the best input vector
found using the Genetic Algorithm.
Once the input vector has been pruned with the ge-
netic algorithm component, the SWM and SAM and
IVC methods are used to corroborate the conclusions.
According to the study shown in Table 12, the most
important variables of Vinp are the following: KI, WQ,
MD, LT. These variables should always appear as a
component of the input vector to ensure higher accu-
racy. The least important variables of Vinp are the fol-
lowing: CF, PI, BR, GO. Therefore, their non-inclusion
will once again simplify the �nal architecture as well
as reduce the network training time. The pruning pro-
cess provides valuable information not only for the ANN
area, but also for project managers For example, it pro-
vides relevant variables related to software project man-
agers that should be taken into account when detecting
future competency gaps in software projects.
Finally, Table 11 also includes the correlation factor
obtained after the location of the best architecture for
each ANN has been found (best input vector and best
hidden elements con�guration). Once again, the results
obtained classify the MLP as having the highest accu-
racy.
4.4 Stage 4. Learning Algorithm
Table 13 Stage 4. Best Learning Algorithm (correlation factor.20x10cv)
ANN GR EBP CG QP LM EpochsELN 0.8188 0.8980 0.9215 0.9304 0.9132 +327MLP 0.8273 0.9224 0.9199 0.9297 0.9323 -202RBF 0.8243 0.9107 0.8678 0.8726 0.9103 0RNN 0.7517 0.8442 0.8642 0.8819 0.8601 -143SOFM 0.7731 0.8153 0.7901 0.8209 0.8352 +210SVM 0.8122 0.8255 0.8082 0.8551 0.8990 +197
The learning algorithm variants are intended to help
locate the global minimum of error surface in weight
space. Each alternative studied, �rst or second order, is
intended to optimize and accelerate this search process
using di�erent approaches, such as updating weights,
adapting the parameters or using second derivatives of
the error.
The results obtained in Stage 4 are presented in Ta-
ble 13. In the EBP column, the results are the same
as those obtained in Stage 3 for all topologies because
this algorithm has been used in the initial ANN designs
(see Table 2). The epochs column indicates the varia-
tion between the best algorithm as well as the epochs
in Stage 3 for each ANN topology (with the EBP algo-
rithm).
The results show that in the scenario studied, the
algorithms with best behavior in the prediction of com-
petence gaps are the LM and the QP variants. Further-
more, the QP algorithm obtained a lower the number of
epochs needed to train the network which reduces the
computation time. In regards to the RBF network, the
best algorithm for this scenario is the EBP. Finally, the
best result was obtained with the MLP topology and
the algorithm LM.
In summary, Table 14 provides an accurate rate of
each ANN (using the correlation factor) and shows the
improvement rate obtained by applying each phase of
the framework. The �nal column, �% Improve�, gives
the percentage of improvement obtained over the orig-
inal ANN and after the application of the complete
framework. The MLP is the alternative with the high-
est �nal accuracy rate of 0.9323. The highest rate of im-
provement is achieved by SVM (18.37%), and the aver-
age rate of improvement for all ANNs is 10.52%. Thus,
it can be concluded that the I-COMPETERE frame-
work is applicable when forecasting competency gaps.
In addition, the optimization methodology included im-
proves the performance and accuracy of the ANNs used
in the framework.
In the next section, quality metrics will be used to rat-

13
Table 12 Stage 3. In�uence of input parameters and the best input vector (SAM, IVC and SWM methods)
ANN SAM (more and less in�uential) IVC (more and less in�uential) SWM (Input Vector)ELN ↑: MD,LT ↓: CF,PI ↑: KI,MD,LT ↓: BR,GO Full Vinp - {PI,CF,GO}MLP ↑: KI,WQ,MD,LT ↓: CF,PI,BR,GO ↑: KI,WQ,MD,LT ↓: CF,PI,BR,GO Full Vinp - {CF,PI,BR,GO}RBF ↑: WQ,MD,LT ↓: BR,GO ↑: WQ,MD,LT ↓: CF,BR,GO Full Vinp - {PI,BR,GO}RNN ↑: KI,WQ,MD, LT ↓: CF,GO ↑: KI,WQ,MD,LT ↓: CF,PI,BR,GO Full Vinp - {PI,BR,GO}SOFM ↑: KI,LT ↓: CF,MF,GO ↑: KI,MD,LT ↓: CF,MF,BR,GO Full Vinp - {CF,GO}SVM ↑: KI,WQ,MD ↓: GO ↑: KI,WQ,MD,LT ↓: CF,BR,GO Full Vinp - {CF,BR}
ify the validity of the results obtained.
Table 14 Final summary and comparison between the di�erentANN (correlation factor. 20x10cv)
ANN Stage 1 Stage 2 Stage 3 Stage 4 % ImproveELN 0.8564 0.8893 0.8980 0.9304 7.39MLP 0.8659 0.9150 0.9224 0.9323 6.64RBF 0.8699 0.8924 0.9107 0.9107 4.07RNN 0.7512 0.8302 0.8442 0.8819 13.07SOFM 0.6994 0.7960 0.8153 0.8352 13.57SVM 0.7153 0.8063 0.8255 0.8990 18.36
4.5 Stage 5. Quality Metrics
To corroborate the above conclusions, an analysis fo-
cused on measuring the quality of each ANN after ap-
plying the framework, has been carried out. Two sta-
tistical criteria based on information theory, AIC and
MDL, are included to compare the degrees of good-
ness of �t for each proposal. Table 15 shows the results
for these criteria sorted by quality, i.e. lower AIC and
MDL. Once again, the MLP model showed the best
performance and adjusted the data of these statistical
indicators. This allows the researcher to choose ANN
and be sure of its ability to detect future competency
gaps. Furthermore, the other two topologies with bet-
ter accuracy, RBF and ELN networks, have obtained
good performance with the AIC and MLP indicators.
4.6 Numerical Example
A numerical example has been provided to give infor-
mation on the correlation between the inputs and the
prediction of I-Competere. However, the prediction pro-
cess of I-Competere is iterative and several experimen-
tal runs need to be performed.
The numerical example shown in Table 16 re�ects
one of these runs performed for the MLP topology. The
acronyms of the columns are described in Table 1.
The column �SC Output� re�ects the prediction ob-
tained by I-Competere for each of the input patterns.
The correlation factor obtained in this run, using Equa-
tion 1, is 0.9052.
4.7 Discussion
Previous sections have described the results obtained
during each stage of the methodology applied. These
stages showed how the framework was capable of de-
tecting competency gaps within software development
teams Firstly, a selection of six topologies with their
respective better cost functions were analyzed. When
comparing the results, one would think that the best op-
tions for predicting competencies would be RBF, MLP
and ELN with L2 norm. The lack of similar studies
in this domain made this stage mandatory in order
to optimize the framework. The second phase deter-
mined the best resampling method using the best con-
�gurations possible. The results of the second phase
show that for the majority of the con�gurations, the
AWGN100 +KFCV10 with early stopping was a tech-
nique for the given problem, even though LOCV and
BSR achieved better results for RNN and SOFM re-
spectively. At this stage, the network's con�guration
and the resampling method has been selected. How-
ever, the choice of the best con�guration implies the
optimization of each topology and the selection of the
best option which is MLP due to its architecture and
performance. The results obtained in phase 4 shows
that all topologies require only one hidden layer (except
SVM which does not have any hidden layers). The best
input network determined by the elements (KI, WQ,
MD, LT) revealed the most important skills to consider
in estimation. The selection of these skills using a ge-
netic algorithm not only helps improve the network's
performance, but also provides valuable information to
project managers. As a result, it attracts attention to
all the possible skills when predicting future necessities.
Once again, with the improved topologies and the opti-
mal set of inputs, the best performance was achieved by

14
Table 15 Stage 5. Analysis using Task 4.1: Indicators AIC and MDL
ANN AIC MDL ANN AIC MDLELN 65.991 92.765 MLP -27.836 -19.760RBF 2069.34 2208.627 RNN 94.021 88.231SOFM 879.945 934.081 SVM 5294.477 5628.455
MLP, with little di�erence concerning the RBF perfor-
mance. Finally, the last stage selected the best learning
algorithm for each con�guration, with the best options
being LM and QP.
When comparing all the possible alternatives, the
MLP was selected for the I-Competere architecture.
The systematic approach shown in this experimenta-
tion con�rms that I-Competere is a valid alternative for
the forecasting of the Scheduling and Planning skills,
thanks to the careful selection of its architecture. Final
results show that the framework obtained an accuracy
rate of 0.9323 with little di�erence in respect to the
ELN topology. However, quality metrics have indicated
that MLP was the best option.
Finally, it is important to note that the model de-
pends on historical data. All the models were trained
using a set of historical data which is coherent in terms
of project size, project type and team competence. These
three examples are some of the most important aspects
to consider. Base on previous studies, authors agree
(e.g. [6]) that there may be a considerable variation
in the performance of prediction systems when the na-
ture of the historical data changes. The accuracy of
I-Competere could change when applied to unknown
scenarios.
5 Conclusions and Future Work
This paper presents I-Competere, a framework for com-
petency gaps forecasting in the area of software project
management. The framework is able to predict the com-
petence level of a team leader based on their features.
In this sense, this study provides a powerful framework
used in forecasting competency gaps in software devel-
opment teams.
I-Competere provides a new point of view regarding
the application of intelligent systems in software engi-
neering. As mentioned in the literature review, despite
the application of ANN and intelligent systems for size
estimation, cost or software projects e�ort, there is no
similar approach related to the forecasting of required
Project Manager competencies . However, there is a set
of problems in software development projects that are
caused by the lack of training concerning the manager
or the members of the project team. Based on a set
of characteristics related to a software project and its
manager, the proposed framework predicts the compe-
tency gaps that could be a�ected during the project.
Thanks to the methodology applied, the most relevant
variables for this prediction have been identi�ed. The
most important variables of Vinp are the following: KI,
WQ, MD, LT. These variables should always appear as
a component of the input vector to ensure higher ac-
curacy. It provides decision makers with valuable infor-
mation when anticipating future problems and provides
training programs for SPMs and project team members
before starting a project thus avoiding future problems.
The adoption of the ANN based framework and op-
timization methodology has lead to compare di�erent
ANN con�gurations, optimizing them and selecting the
most accurate one: in this case the MLP. The obtained
accuracy rate is 93.23% which is a high indicator of suc-
cess concerning estimations. This measure leads one to
believe that the proposed framework can be a valuable
tool for both SPMs and organizations.
Further research will be centered on the inclusion of
other types of projects in order to prove that the pro-
posed framework can be adapted when predicting com-
petency gaps in di�erent projects (buildings, manufac-
turing, etc.). The inclusion of this estimation framework
along with the previous studies by other authors on the
estimation of software development [26] and its full in-
tegration in a collaborative environment will serve as
a powerful tool for project management.The adoption
of this estimation method combined with the collab-
orative work between the managers could bene�t the
project management area. It can be especially advan-
tageous in the very early phases in which project infor-
mation is scarce but the decisions made can determine
project success or failure.

15
Table 16 Numerical Example of I-Competere operation (1 run)
TC KI OD CF WQ MF MD EV PI LT BR GO SC SC Output6 3 2 2 2 4 3 1 7 3 7 0 2 2.11247 3 2 2 2 2 3 0 7 3 6 0 2 2.32506 3 1 2 2 5 2 2 8 3 7 0 2 1.98486 3 4 2 2 5 3 2 5 2 9 0 2 2.29026 3 2 3 2 4 3 1 7 3 7 1 2 2.71106 3 4 4 2 4 4 2 9 2 5 0 1 2.93478 3 3 2 3 4 3 1 7 3 8 1 2 2.82050 6 7 1 6 5 7 0 5 6 6 5 6 8.15020 6 7 1 6 5 7 0 5 5 6 5 6 8.15030 6 8 1 6 5 7 0 5 7 6 5 6 8.25042 7 8 2 7 5 7 0 4 7 6 6 6 8.36790 7 9 2 6 5 7 1 5 6 6 5 6 8.35610 6 7 2 6 3 7 1 5 6 6 6 5 8.38270 6 6 0 6 5 7 1 5 6 5 5 6 8.30772 0 2 5 0 6 0 8 10 0 10 2 0 0.89383 0 2 5 0 6 0 9 10 0 10 2 0 0.89802 0 1 4 0 6 0 8 10 0 10 0 0 0.95562 0 2 4 0 4 0 7 10 0 9 4 1 1.01181 0 2 5 0 7 0 10 10 0 10 2 0 1.12231 0 0 5 0 6 0 10 10 0 10 2 0 1.13772 0 0 6 0 5 0 9 10 0 10 2 0 1.21255 6 4 5 5 6 7 0 10 6 4 8 5 7.62435 6 2 5 5 6 7 0 10 6 2 9 5 7.67395 6 3 5 5 4 7 0 10 6 4 10 5 7.89135 5 4 5 5 4 7 0 10 6 4 9 6 7.75846 6 4 4 5 7 7 0 10 7 3 7 5 7.68346 6 5 5 5 6 7 1 10 6 4 8 5 7.81315 7 4 6 5 6 7 0 8 6 2 6 4 7.99186 5 7 4 6 1 5 5 4 5 1 6 6 7.47046 5 6 5 6 1 4 5 4 5 0 6 6 7.18664 5 7 4 6 0 6 5 4 5 1 6 6 8.00696 5 7 4 6 1 5 5 5 5 1 5 6 7.52946 5 7 4 7 1 5 5 4 5 0 7 5 7.88575 5 7 6 6 1 6 5 4 6 1 6 6 7.90127 5 9 4 5 1 5 5 4 4 3 6 6 7.24141 0 5 5 1 2 0 3 3 0 1 0 0 2.68791 0 5 6 1 4 0 3 3 0 1 1 0 2.78290 0 5 6 1 1 1 3 4 0 2 2 0 2.97301 0 6 3 1 2 0 1 3 0 1 0 0 2.85461 0 6 3 1 0 0 3 3 0 3 0 0 2.86570 0 5 5 1 2 0 4 3 1 1 1 0 3.36141 0 5 5 1 2 0 5 4 0 1 2 0 3.15486 6 2 5 6 10 7 8 4 7 2 9 7 7.11518 6 2 3 6 10 7 8 4 7 3 8 7 6.89406 5 3 5 6 10 7 9 3 7 2 10 7 6.78056 6 2 6 6 10 8 8 4 7 2 9 7 7.45027 6 3 5 6 9 7 10 4 7 2 8 8 7.16476 6 0 5 6 10 7 8 2 7 2 9 7 7.13408 5 4 5 5 10 7 8 4 6 2 8 7 5.92718 5 8 5 6 2 5 9 3 6 9 10 6 7.59567 5 8 5 6 2 5 10 3 6 10 10 6 7.70637 5 8 5 6 2 5 9 4 6 10 9 7 7.77099 5 6 5 6 2 5 9 5 6 9 10 6 7.65718 5 8 5 6 1 4 9 3 5 10 10 7 7.67968 5 7 5 5 2 5 9 3 6 9 10 6 7.57478 5 7 5 6 0 5 9 4 6 10 10 5 8.05549 9 3 9 9 2 8 0 10 9 0 9 9 8.46849 9 1 9 10 2 8 0 10 9 2 9 9 8.48949 9 3 10 9 2 8 0 10 9 0 7 9 8.47619 9 3 10 8 0 8 1 10 9 0 9 10 8.50099 9 4 9 8 2 8 0 9 9 0 9 9 8.48799 8 3 10 9 0 8 0 10 9 0 9 9 8.51449 9 3 9 9 4 8 0 10 9 2 7 9 8.49929 6 7 4 6 2 7 10 9 6 4 4 7 7.80088 6 6 4 6 2 7 8 9 6 5 4 8 7.94947 6 7 5 6 2 7 10 10 6 2 4 7 7.99359 7 8 4 6 2 7 10 9 6 5 4 7 8.126210 5 7 4 6 2 7 10 9 5 4 4 7 7.445710 5 6 4 6 2 7 10 9 6 3 3 7 7.455410 6 7 5 6 1 7 10 9 6 4 4 7 7.9968
16
References
1. Aggarwal, K., Singh, Y., Chandra, P., Puri, M.: Bayesianregularization in a neural network model to estimate linesof code using function points. Journal of Computer Science1(4), 505�509 (2005)
2. Ahmeda, M., Saliub, M., AlGhamdia, J.: Adaptive fuzzylogic-based framework for software development e�ort pre-diction. Information and Software Technology 47(1), 31�48(2005)
3. Akaike, H.: A new look at the statistical model identi�ca-tion. IEEE Transactions on Automatic Control 19(6), 716�723 (1974)
4. Aramo-Immonen, H., Bikfalvi, A., Mancebo, N., Vanharanta,H.: Project managers competence identi�cation. Interna-tional Journal of Human Capital and Information Technol-ogy Professionals (IJHCITP) 2(1), 33�47 (2011)
5. Arbib, M.: The Handbook of Brain Theory and Neural Net-works. MIT Press (1995)
6. de Barcelos Tronto, I., da Silva, J., Sant'Anna, N.: An investi-gation of arti�cial neural networks based prediction systemsin software project management. Journal of Systems andSoftware 81(3), 356�367 (2008)
7. Barr, J., Saraceno, F.: A computational theory of the �rm.Journal of Economic Behavior & Organization 49(3), 345 �361 (2002)
8. Bascil, M., Temurtas, F.: A study on hepatitis disease diag-nosis using multilayer neural network with levenberg mar-quardt training algorithm. Journal of Medical Systems 35,433�436 (2011). 10.1007/s10916-009-9378-2
9. Bermejo, P., Joho, H., Joemon, M., Villa, R.: Comparisonof feature construction methods for video relevance pre-diction. In: Advances in Multimedia Modeling. 15th In-ternational Multimedia Modeling Conference, MMM 2009,Sophia-Antipolis, France, January 7-9, 2009. Proceedings.,pp. 185�196 (2009)
10. Bisagni, C., Lanzi, L., Ricci, S.: Optimization of helicoptersub�oor components under crashworthiness requirements us-ing neural networks. Journal of Aircraft 39(2), 296�304(2002)
11. Breiman, L., Spector, P.: Submodel selection and evaluationin regression. the x-random case. International StatisticalReview 60(3), 291�319 (1992)
12. Burger, M., Neubauer, A.: Analysis of tikhonov regulariza-tion for function approximation by neural networks. NeuralNetworks 16(1), 79� 90 (2003)
13. Bygstad, B., Aanby, H.: Ict infrastructure for innovation: Acase study of the enterprise service bus approach. Informa-tion Systems Frontiers 12(3), 257�265 (2010)
14. Ramon-y Cajal, S.: The croonian lecture: La �ne structuredes centres nerveux. Proceedings of the Royal Society ofLondon 55, 444�468 (1894)
15. Cauchy, A.: Methodes generales pour la resolution des sys-temes d'equations simultanees. Compte Rendu des Séancesde L'Académie des Sciences 25(3), 536�538 (1847)
16. Cho, S.B., Shimohara, K.: Evolutionary learning of modularneural networks with genetic programming. Applied Intelli-gence 9(3), 191�200 (1998)
17. Crawford, L.: Senior management perceptions of projectmanagement competence. International Journal of ProjectManagement 23(1), 7�16 (2005)
18. Crowther, P., Cox, R.: A method for optimal division of datasets for use in neural networks. In: Knowledge-Based Intelli-gent Information and Engineering Systems, 9th InternationalConference, KES 2005, Melbourne, Australia, September 14-16, 2005, Proceedings, Part IV, pp. 906�912 (2005)
19. Dietterich, T.: Approximate statistical tests for comparingsupervised classi�cation learning algorithms. Neural Com-putation 10(7), 1895�1923 (1998)
20. Durand, N., Alliot, J.M., Médioni, F.: Neural nets trainedby genetic algorithms for collision avoidance. Applied Intel-ligence 13(3), 205�213 (2000)
21. El Emam, K., Koru, A.: A replicated survey of it softwareproject failures. Software, IEEE 25(5), 84�90 (2008)
22. Fahlman, S.: Faster-learning variations on back-propagation:an empirical study. In: Proceedins of Connectionist ModelsSummer School, pp. 38�51 (1988)
23. Feldt, R., Angelis, L., Torkar, R., Samuelsson, M.: Links be-tween the personalities, views and attitudes of software engi-neers. Information and Software Technology 52(6), 611�624(2010)
24. Ferri, C., Hernández-Orallo, J., Modroiu, R.: An experimen-tal comparison of performance measures for classi�cation.Pattern Recogn. Lett. 30(1), 27�38 (2009)
25. Galinec, D.: Human capital management process based on in-formation technology models and governance. InternationalJournal of Human Capital and Information Technology Pro-fessionals 1(1), 44�60 (2010)
26. García-Crespo, A., González-Carrasco, I., Colomo-Palacios,R., López-Cuadrado, J., Ruiz-Mezcua, B.: Methodology forsoftware development estimation optimization based on neu-ral networks. IEEE Latin America Transactions 9(3), 391�405 (2011)
27. Garcia-Crespo, A., Ruiz-Mezcua, B., Fernandez, D., Zaera,R.: Prediction of the response under impact of steel armoursusing a multilayer perceptron. Neural Computing & Appli-cations 16(2), 147�154 (2006)
28. Garg, A., Goyal, D., Lather, A.: The in�uence of the bestpractices of information system development on softwaresmes: a research scope. International Journal of BusinessInformation Systems 5(3), 268�290 (2010)
29. Geraldi, J., Lee-Kelley, L., Kutsch, E.: The titanic sunk, sowhat? project manager response to unexpected events. In-ternational Journal of Project Management 28(6), 547�558(2010)
30. Gevrey, M., I., D., Lek, S.: Review and comparison of meth-ods to study the contribution of variables in arti�cial neu-ral network models. Ecological Modelling 160(3), 249�264(2003)
31. Gibbs, W.: Software's chronic crisis. Scienti�c American271(3), 72�81 (1994)
32. Girosi, F., Jones, M., Poggio, T.: Regularization theory andneural networks architectures. Neural Computation 7(2),219�269 (1995)
33. Glass, R.: The standish report: does it really describe asoftware crisis? Communications of the ACM 49(8), 15�16(2006)
34. Gomez, I., Martin, M.P.: Prototyping an arti�cial neural net-work for burned area mapping on a regional scale in mediter-ranean areas using modis images. International Journal ofApplied Earth Observation and Geoinformation 13(5), 741� 752 (2011)
35. Gonzalez-Carrasco, I., Garcia-Crespo, A., Ruiz-Mezcua, B.,Lopez-Cuadrado, J.: An optimization methodology for ma-chine learning strategies and regression problems in ballisticimpact scenarios. Applied Intelligence (in press) (2011)
36. Grochowski, M., Dutch, W.: Learning highly non-separableboolean functions using constructive feedforward neural net-work. In: ICANN'07 Proceedings of the 17th internationalconference on Arti�cial neural networks, pp. 180�189 (2007)
37. Haykin, S.: Neural Networks: A Comprehensive Foundation.Prentice Hall PTR (1994)

17
38. He, Y., Sun, Y.: Neural network-based l1-norm optimisationapproach for fault diagnosis of nonlinear circuits with tol-erance. Circuits, Devices and Systems, IEE Proceedings -148(4), 223�228 (2001)
39. Henderson, C., Potter, W., McClendon, R., Hoogenboom,G.: Predicting a�atoxin contamination in peanuts: A ge-netic algorithm/neural network approach. Applied Intelli-gence 12(13), 183�192 (2000)
40. Henry, J.: Software project management: a real-world guideto success. Addison Wesley Longman (2003)
41. Hestenes, R., Stiefel, E.: Methods of conjugate gradients forsolving linear systems. Journal of Research of the NationalBureau of Standards 49(6), 409�436 (1952)
42. Hodgson, D.: Disciplining the professional: The case ofproject management. Journal of Management Studies 39(6),803�821 (2002)
43. Huang, M., Tsou, Y., Lee, S.: Integrating fuzzy data miningand fuzzy arti�cial neural networks for discovering implicitknowledge. Knowledge-Based Systems 19(6), 396��403(2006)
44. Jorgensen, M., Molokken-Ostvold, K.: How large are softwarecost overruns? a review of the 1994 chaos report. Informationand Software Technology 48(4), 297�301 (2006)
45. Kao, Y.T., Zahara, E.: A hybrid genetic algorithm and par-ticle swarm optimization for multimodal functions. AppliedSoft Computing 8(2), 849� 857 (2008)
46. Kelemenis, A., Ergazakis, K., Askounis, D.: Support man-agers' selection using an extension of fuzzy topsis. ExpertSystems with Applications 38(3), 2774 � 2782 (2011)
47. Kumar, K.V., Ravi, V., Carr, M., Raj Kiran, N.: Softwaredevelopment cost estimation using wavelet neural networks.Journal of Systems and Software 81(11), 1853�1867 (2008)
48. Kwak, Y.: A brief history of project management. In: Thestory of managing projects. Greenwood Publishing Group(2005)
49. Lanzi, L., Bisagni, C., Ricci, S.: Neural network systems toreproduce crash behavior of structural components. Com-puters structures 82(1), 93�108 (2004)
50. Levenberg, K.: A method for the solution of certain non-linear problems in least squares. Quarterly Journal of Ap-plied Mathmatics II(2), 164�168 (1944)
51. Li, J., Wu, C., Wu, H.: Wavelet neural network process con-trol technology in the application of aluminum electolysis.In: X. Wan (ed.) Electrical Power Systems and Computers,Lecture Notes in Electrical Engineering, vol. 99, pp. 937�941.Springer Berlin Heidelberg (2011)
52. Looney, C.: Advances in feedforward neural networks: de-mystifying knowledge acquiring black boxes. Transactionson Knowledge and Data Engineering 8(2), 211�226 (1993)
53. Majumder, M., Roy, P., Mazumdar, A.: Optimization of thewater use in the river damodar in west bengal in india: Anintegrated multi-reservoir system with the help of arti�cialneural network. Engineering Computing and Architecture1(2), 1�12 (2007). Article 1192
54. Marquardt, D.: An algorithm for least-squares estimation ofnonlinear parameters. SIAM Journal on Applied Mathemat-ics 11(2), 431�441 (1963)
55. McConnell, S.: Professional software development. Addison-Wesley (2004)
56. Morris, P., Crawford, L., Hodgson, D., Shepherd, M.,Thomas, J.: Exploring the role of formal bodies of knowledgein de�ning a profession-the case of project management. In-ternational Journal of Project Management 24(8), 710�721(2006)
57. Muller, R., Turner, J.: Matching the project manager's lead-ership style to project type. International Journal of ProjectManagement 25(1), 21�32 (2007)
58. Natarajan, T., Rajah, S., Manikavasagam, S.: Snapshot ofpersonnel productivity assessment in indian it industry. In-ternational Journal of Information Technology Project Man-agement 2(1), 48�61 (2011)
59. Nelson, M., Illingworth, W.: A practical guide to neural nets.Reading, MA (USA); Addison-Wesley Publishing Co., Inc.(1991)
60. Onita, C., Dhaliwal, J.: Alignment within the corporate itunit: an analysis of software testing and development. Euro-pean Journal of Information Systems 20(1), 48�68 (2010)
61. O'Sullivan, D., Dooley, L.: Collaborative innovation for themanagement of information technology resources. Interna-tional Journal of Human Capital and Information Technol-ogy Professionals 1(1), 16�30 (2010)
62. Patnayakuni, R., Ruppel, C.: A socio-technical approach toimproving the systems development process. InformationSystems Frontiers 12(2), 219�234 (2010)
63. Peng, X., zhe, H., Guifang, G., Gang, X., Binggang, C.,Zengliang, L.: Driving and control of torque for direct-wheel-driven electric vehicle with motors in serial. Expert Systemswith Applications 38(1), 80 � 86 (2011)
64. Pereira, J., Cerpa, N., Verner, J., Rivas, M., Procaccino, J.:What do software practitioners really think about projectsuccess: A cross-cultural comparison. Journal of Systems andSoftware 81(6), 897�907 (2008)
65. Priddy, K., Keller, P.: Arti�cial Neural Networks: An Intro-duction. SPIE Press (2005)
66. Principe, J., Euliano, N., Lefebvre, W.: Neural and AdaptiveSystems: Fundamentals through Simulations with CD-ROM.John Wiley & Sons, Inc. (1999)
67. Principe, J., Lefebvre, C., Lynn, G., Fancourt, C., Wooten,D.: Neuro Solutions Documentation. NeuroDimension, Inc.(2007)
68. Rissanen, J.: Modeling by shortest data description. Auto-matica 14(5), 445�471 (1978)
69. Roy, N., Potter, W., Landau, D.: Designing polymer blendsusing neural networks, genetic algorithms, and markovchains. Applied Intelligence 20(3), 215�229 (2004)
70. Ruano-Mayoral, M., Colomo-Palacios, R., Garcia-Crespo,A., Gomez-Berbis, J.: Software project managers under theteam software process: A study of competences. Interna-tional Journal of Information Technology Project Manage-ment 1(1), 42�53 (2010)
71. Shahhosseini, V., Sebt, M.: Competency-based selection andassignment of human resources to construction projects. Sci-entia Iranica 18(2), 163 � 180 (2011)
72. Sokolova, M., Rasras, R., Skopin, D.: The arti�cial neu-ral network based approach for mortality structure analysis.American Journal of Applied Science 3(2), 1698�1702 (2006)
73. Songwu, L., Member, S., Basar, T.: Robust nonlinear systemidenti�cation using neural network models. IEEE Transac-tions on Neural Networks 9(3), 407�429 (1998)
74. Stamelos, I.: Software project management anti-patterns.Journal of Systems and Software 83(1), 52�59 (2010)
75. Stamelos, I.: Software project management anti-patterns.Journal of Systems and Software 83(1), 52�59 (2010)
76. Stavrou, E.T., Charalambous, C., Spiliotis, S.: Human re-source management and performance: A neural network anal-ysis. European Journal of Operational Research 181(1), 453� 467 (2007)
77. Su, Y., Huang, C.: Neural-network-based approaches for soft-ware reliability estimation using dynamic weighted combi-national models. Journal of Systems and Software 80(4),606�615 (2007)
78. Swingler, K.: Applying Neural Networks. A Practical Guide.Academic Press (1996)

18
79. Tang, F., Mu, J., MacLachlan, D.L.: Disseminative capac-ity, organizational structure and knowledge transfer. ExpertSystems with Applications 37(2), 1586 � 1593 (2010)
80. Tarassenko, L.: A guide to neural computing applications.Arnol / NCAF (1998)
81. Watanabe, J., Maruyama, T.: Software development indus-trialization by process-centered style. Fujitsu Scienti�c andTechnical Journal 46(2), 168�176 (2010)
82. Wong, T., Wong, S., Chin, K.: A neural network-based ap-proach of quantifying relative importance among various de-terminants toward organizational innovation. Expert Sys-tems with Applications 38(10), 13,064 � 13,072 (2011)
83. Wytho�, B.: Backpropagation neural networks: A tutorial.Chemometrics and Intelligent Laboratory Systems 18, 115�155 (1993)
84. Xie, C., Ling, Chang, J., Yuan, Shi, X., Cheng, Dai, J., Min:Fault diagnosis of nuclear power plant based on genetic-rbfneural network. Int. J. Comput. Appl. Technol. 39(1/2/3),159�165 (2010)
Ricardo Colomo-Palacios is an Associate Pro-
fessor at the Computer Science Department of the Uni-
versidad Carlos III de Madrid. His research interests
include applied research in Information Systems, Soft-
ware Project Management, People in Software Projects
and Social and Semantic Web. He received his PhD in
Computer Science from the Universidad Politécnica of
Madrid (2005). He also holds a MBA from the Insti-
tuto de Empresa (2002). He has been working as soft-
ware engineer, project manager and software engineer-
ing consultant in several companies including Spanish
IT leader INDRA. He is also an Editorial Board Mem-
ber and Associate Editor for several international jour-
nals and conferences and Editor in Chief of Interna-
tional Journal of Human Capital and Information Tech-
nology Professionals.
Israel Gonzalez-Carrasco is an assistant profes-
sor in the Computer Science Department of Universi-
dad Carlos III of Madrid. He holds his PhD degree in
Computer Science by this University. He is co-author
of several papers in lectures and congress and his main
lines of research are Neural Networks, Expert Systems
and Software Engineering. He is involved in several in-
ternational projects and is a member of reviewer board
and editorial advisory board of di�erent journals.
Jose Luis Lopez-Cuadrado is assistant profes-
sor in Computer Science Department at the Universi-
dad Carlos III of Madrid. He holds his PhD degree in
Computer Science by this University. His research is fo-
cused on web based expert systems applications, neural
networks, software engineering and processes improve-
ment. Also he is co-author of several contributions pub-
lished in international congresses.
Antonio Trigo is an Assistant Professor of Com-
puter Science at Institute of Accounting and Admin-
istration of Coimbra, which is part of the Polytech-
nic Institute of Coimbra, Portugal, where he teaches
business intelligence, management information systems,
software engineering and computer programming, su-
pervising several MSc students. He received his PhD
in informatics from the University of Trás-os-Montes e
Alto Douro. His research interests include information
systems management and enterprise information sys-
tems. He worked as software engineer, project manager
and software engineering consultant in several compa-
nies including Portugal Telecom, Cabo Verde Telecom,
Meditel, Telesp Celular and Portuguese National Insti-
tute of Statistics. He has publications in international
journals, book chapters and international conferences.
He serves as editorial board member for international
journals and has served in several organization and sci-
enti�c committees of international conferences
19
Joao Eduardo Varajao is professor of information
systems management and project management at the
University of Tras-os-Montes e Alto Douro. He gradu-
ated in 1995, received his master degree in Computer
Science in 1997 and, in 2003, received his PhD in Tech-
nologies and Information Systems, from University of
Minho (Portugal). He supervises several Msc and PhD
thesis in the information systems �eld. His current re-
search includes information systems management and
project management. He has over 200 publications, in-
cluding books, book chapters, refereed publications, and
communications at international conferences. He serves
as associate editor and member of editorial board for
international journals and has served in several com-
mittees of international conferences. He is founder of
CENTERIS - Conference on ENTERprise Information
Systems.