i duwamish waterway i sediment characterization … · the duwamish waterway sediment...
TRANSCRIPT
I I I I I I I I I I I I I I I I I I I
DUWAMISH WATERWAY
SEDIMENT CHARACTERIZATION
STUDY REPORT
Prepared for
Damage Assessment Center National Oceanic and Atmospheric Administration
7600 Sand Point Way Northeast Seattle,WA 98115
William Conner, Contracting Officer's Technical Representative
Prepared under the direction of
Industrial Economics, Inc. 2067 Massachusetts Avenue
Cambridge, MA 02140
Contract 50-DSNC-7 -90032 Task Order 56-DSNC-7-20006
10 December 1998
I I I I I I I I I I I I I I I I I I I
EXECUTIVE SUMMARY
In 1997, the Natural Resource Trustees for the Duwamish River initiated an investigation to evaluate the extent and severity of polychlorinated biphenyl (PCB) and polychlorinated terphenyl (PCT) contamination in the sediments of the Duwamish Waterway. As the first step in evaluating the ecological health of the Duwamish River, the Trustees designed a sediment sampling program for the Waterway. The purpose of this report is to provide a summary and analysis of the data generated in the sediment study.
The major findings of this sediment characterization study are given below:
• Almost 71 acres of the sampled area of the Waterway, or just under 20%, are estimated to have PCB contaminant levels that exceed the Washington State Sediment Quality Standard (SQS) - an effects-based guideline for investigating the potential for biological effects.
• The most contaminated region is the middle portion of the Waterway, north of Slip 6 and south of Slip 2.
• Seventeen of 18 samples collected from within Slip 4 exceeded the SOS for PCBs.
• Concentrations of PCBs at many sample points in the middle portion of the Waterway are 10 to 100 times the Washington State SOS.
• Based on published studies of the exposure, uptake, and bioaccumulation of PCBs by organisms, the quantity and concentrations of PCBs found in Duwamish Waterway sediments are potentially sufficient to cause injuries to natural resources.
ii

I I I I I I I I I I I I I I I I I
ACKNOWLEDGEMENTS
This report was prepared by Versar, Inc. in collaboration with Mark Curry of Industrial Economics, Inc.; Greg Glass, a consultant in Seattle, Washington; and the Trustees of the Duwamish Waterway. Versar staff members Allison Brindley, William Burton, Ananda Ranasinghe, Stephen Schreiner, and Donald Strebel contributed to the report. In addition, comments and contributions by Ann Bailey, of EcoChem, Inc., were useful in refining the technical accuracy of the report. Finally, the report could not have been completed without the dedicated efforts of Sherian George and Gail Lucas, Versar's document production staff.
iii

I I I I I I I I I I I I I I I I I I I
TABLE OF CONTENTS
PAGE
EXECUTIVE SUMMARy .............................................................................................. ii
ACKNOWLEDGEMENTS .......................................................................••................... iii
1 .0 INTRODUCTION ........................................................................................... 1-1
1.1 STUDY ORGANIZATION ........................................................................ 1-2 1.2 DESCRIPTION OF THE STUDY AREA ....................................................... 1-2 1.3 CONTAMINANT REVIEW ....................................................................... 1-4
2.0 ASSESSMENT OVERViEW ............................................................................. 2-1
2.1 SAMPLING DESIGN ............................................................................... 2-1 2.2 FIELD SAMPLING .................................................................................. 2-4 2.3 ANALYTICAL PROCEDURES ................................................................... 2-5 2.4 QUALITY ASSURANCE .......................................................................... 2-6 2.5 SEDIMENT SAMPLING DATA BASE ........................................................ 2-6
3.0 EXTENT AND NATURE OF CONTAMINATION .................................................. 3-1
3.1 APPLICABLE CRITERIA ......................................................................... 3-1 3.2 EXTENT OF PCB AND PCT CONTAMINATION AND COMPARISON WITH
WASHINGTON SQS LEVEL .................................................................... 3-1 3.3 NATURE OF PCB CONTAMINATION IN RELATION TO BIOLOGICAL
EFFECTS .............................................................................................. 3-9 3.4 DISTRIBUTION PATTERNS OF CHEMICAL MIXTURES ............................. 3-12
4.0 REFERENCES ............................................................................................... 4-1
APPENDICES
A. ANALYTICAL CHEMISTRY AND SAMPLE LOCATION DATA ..................... A-1 B. DATA VALIDATION REPORT .................................................................. B-1 C. RECTIFICATIONS TO STATION LOCATIONS WITH RESPECT TO
SAMPLING REGIONS ............................................................................ C-1
F:\dI!ta· ...... oAds;st.74"EC\DUNMaSH11&4O-r.dac
iv

I' I I I I I I I I I I I I I I I I I I
LIST OF FIGURES
Figure Page
1-1 Features of the Duwamish Waterway ............................................................ 1-3
2-1 A schematic diagram of the Duwamish Waterway subdivided into 90 sub-strata for the sediment sampling program ................................................ 2-3
3-1 Measured PCB concentrations in Duwamish Waterway sediments .................... 3-3
3-2 Measured PCT concentrations in Duwamish Waterway sediments .................... 3-4
3-3 Observed distributions of PCB and PCT concentrations in the Duwamish Waterway sediment samples ........................................................................ 3-5
3-4 The fraction of the area of the Duwamish Waterway with PCB or PCT levels below a given concentration ................................................................ 3-6
3-5 A schematic diagram showing three classes of sediment contamination relative to Washington State standards, based on samples collected within each sub-stratum ........................................................................................ 3-8
3-6 A schematic diagram showing six classes of sediment contamination relative to ER-L and ER-M levels, based on samples collected within each sub-stratum ...................................................................................... 3-10
3-7 The chemical compositions of the 10 samples with the highest Total PCB + PCT concentrations; the samples' FIELDJDs are shown below each graph ............. 3-13
v
I I I I I I I I I I I I I I I I I I I
1.0 INTRODUCTION
In 1997, the Natural Resource Trustees for the Duwamish River initiated an investigation to evaluate the extent and severity of polychlorinated biphenyl (PCB) and polychlorinated terphenyl (PCT) contamination in the sediments of the Duwamish Waterway.' The Trustees initiated this investigation because a review of sediment data from the Waterway indicated the presence of PCBs at concentrations known to cause harm to organisms. The existing data, however, were not sufficient to make quantitative determinations regarding the effects on natural resources and the potential for restoration. Accordingly, the Trustees determined that additional study was necessary to further understand the nature and extent of contamination within the Duwamish Waterway.
As a first step in evaluating the ecological health of the Duwamish River, the Trustees designed a sediment sampling program for the Waterway (NOAA, 1997). The objectives of the sampling program included establishing the spatial distribution of PCB and PCT contamination, evaluating potential effects to natural resources, and obtaining preliminary insight into the distribution patterns of PCB mixtures. Sediment samples for the sampling program were collected between September and November of 1997, and the Trustees received validated chemistry results in April of 1998. The resultant data set contains information on 328 sediment samples and the associated chemical analyses for total PCBs, 1 5 PCB congeners (compounds with unique molecular structures), total PCTs, total organic carbon (TOC), and grain size.
The Duwamish Waterway Sediment Characterization Study was designed to analyze and interpret the results of the sediment sampling program. This report presents the results of the Study objectives given below:
1) Characterize the nature and extent of PCB and PCT contamination in the study area;
2) Evaluate potential natural resource effects based on PCB contamination in sediments;
3) Report analytical chemistry data and qualifying information derived from the sediment investigation.
, The Trustees of the natural resources of the Duwamish River and Elliott Bay include the Director of the State of Washington Department of Ecology, the Secretary of the United States Department of Commerce (acting through NO~A), the Muckleshoot Indian Tribe, the Suquamish Indian Tribe, and the Secretary of the United States Department of the Interior (acting through the u.s. Fish and Wildlife Service).
1-1
I I I I I I I I I I I I I I I I I I I
1.1 STUDY ORGANIZATION
The remainder of this introductory section provides descriptions of the general characteristics of the Duwamish Waterway study area and reviews the nature of PCB and PCT contamination for those readers unfamiliar with these topics.
Section 2 presents an overview of the sampling design and the field implementation of that design that provide the data and the statistical framework for the analyses included in this report. This section also includes brief comments on the data set, quality assurance procedures, and analytical methods.
Section 3 presents an examination of the extent and severity of PCB contamination in the Duwamish Waterway, an assessment of the potential effects to natural resources based on a comparison of PCB concentrations to established guidelines, and the results of a preliminary analysis of congener compositions for selected samples.
Appendix A presents the analytical chemistry and sample location data for the 328 samples collected by the Trustees. Appendix B contains the data validation report for the chemistry analysis. Appendix C provides information with which to rectify sample locations with respect to their intended sampling region.
1.2 DESCRIPTION OF THE STUDY AREA
The Duwamish River is located south of Seattle, Washington, originating at the confluence of the Black and Green Rivers (approximately river km 19) and flowing north to its terminus at Elliott Bay (Figure 1-1). The Duwamish River is a salt-wedge estuarine system that is heavily influenced by tides. Downstream flow is primarily controlled by releases at the Howard Hanson Dam and diversions from the Green River. The average annual freshwater flow (1962 to 1994) in the river is 1,327 cubic feet per second (cfs) measured at a U.S. Geological Survey (USGS) gauging station at Auburn (USGS, 1997). Flow rates vary from a record high 11,600 cfs to a low of 152 cfs. Peak discharges generally occur from December through February as a result of seasonal precipitation, with secondary peaks during spring snowmelt. Flow rates reach their lowest point in late summer and fall.
The lower portion of the Duwamish River, referred to as the Duwamish Waterway, begins at the upper turning basin (Turning Basin #3) and extends six miles north, discharging into Elliott Bay through the East and West Waterways. A dredged navigation channel bordered by intertidal and subtidal habitats extends up the entire length of the Waterway. The shoreline within the Waterway is highly developed, consisting of industrial, commercial, and limited residential use. The shoreline is also characterized by riprap, sheet pilings, miscellaneous fill materials, and concrete and wooden bulkheads (Weston, 1997; Tanner, 1991).
The Trustees' investigation focuses on the Duwamish Waterway and the area immediately upstream of the dredged channel. The study area's upstream boundary is located 1.5 km south of Turning Basin #3. The downstream boundary is defined as the southern tip of Harbor Island. As the study area is, in large part, concentrated on the
1-2

I I I I I I I I I I I I I I I I I I I
Washington
Map Area
AF8;'~
Sout';;"ark
N
A KM
Figure 1-1. Features of the Duwamish Waterway
1-3
Turning Basin
I I I I I I I I I I I I I I I I I I I
Duwamish Waterway, for simplicity in this report, the region of the Duwamish River included in this study is referred to as the Duwamish Waterway. The entire study area consists of approximately 350 acres.
The Duwamish River is an important habitat for more than 50 fish species, including chum, chinook, and coho salmon, and steelhead (Warner, 1996). Three salmon hatcheries within the Green/Duwamish River system release approximately 10 million juvenile salmon each year, and the river and its tributaries support a natural salmon run of an equal or larger amount. The river and surrounding habitat also support more than 80 species of birds and nine species of mammals (USFWS, 1996); a bird sanctuary has been established on Kellogg Island. The river supports recreational, subsistence, ceremonial, and commercial fishing. PCB releases have resulted in contamination in usual and accustomed fishing areas in which the Muckleshoot Tribe and Suquamish Tribe exercise federally adjudicated rights.
1.3 CONTAMINANT REVIEW
In the United States, the manufacture of PCBs and PCTs began in the late 1920s and continued until 1971 when production was voluntarily terminated due to concern over potential toxic effects and resistance to chemical and biological breakdown. After 1971, foreign producers continued to export PCBs and PCTs to the United States through 1979. In the United States, environmental concerns led to a formal ban on the manufacture of PCBs in 1979 (Erickson, 1997). However, due to their wide application and long-term persistence, PCBs and PCTs remain worldwide environmental pollutants that still exist in many industrial applications.
PCBs are a group of synthetic organic compounds formed from chlorine substitution in the biphenyl molecule. There are 209 unique congeners, distinguished by the number and position of the chlorine atoms on two connected benzene rings. PCBs were manufactured and distributed as specified mixtures of congeners called AroclorsTII. PCBs were rapidly adopted in the electric power and electronics industries as dielectric materials in transformers and capacitors. PCBs also were used as hydraulic fluids and plasticizers. Between 1929 and 1989, total world production of PCBs (excluding the Soviet Union) was approximately 1.5 million metric tons. Approximately 30 to 70 percent of all PCBs are still being used, while as much as 30 percent may reside in landfills, storage, or in the sediments of lakes, rivers, and estuaries. Global budgets of PCBs are sufficiently imprecise that the fate of as much as 30 percent of all PCBs (approximately 4.5 x 10⁸ kg) may be unknown (Thomas and Colborn, 1992).
PCTs have physical and chemical properties similar to those of PCBs. Theoretically, 8,149 PCT congeners are possible from the chlorination of the three phenyl rings of the terphenyl molecule. PCTs have many of the same applications as PCBs, although in the United States the primary uses include investment casting and plasticizer applications. Between 1959 and 1972, worldwide PCT production exceeded 50,000 metric tons. During this period, PCTs represented approximately 15 percent of total PCB production (De Kok et aI., 1982). Domestic firms significantly reduced their reliance on PCTs after 1972,
1-4

I I I I I I I I I I I I I I I I I I I
importing approximately 900 metric tons between 1973 and 1979 (Jensen and Jorgensen, 1983).
The chemical structure of PCBs and PCTs makes them extremely stable compounds that are slow to degrade under environmental conditions. Microbial degradation occurs at varying rates, depending on the degree of chlorination and the positions of the chlorine atoms on the biphenyl molecule. PCBs with four or fewer chlorine atoms degrade more quickly than PCBs with five or more chlorine atoms. In natural aquatic systems, the majority of PCBs are adsorbed to suspended particles and bed sediments. The tendency for adsorption increases with the degree of chlorination and with the organic content of the sediments.
Due to their chemical composition and attributes, PCBs that have accumulated in soils and sediments tend to become available to biota, typically moving through the food chain from invertebrates to fish, birds, and mammals. The results of field and laboratory studies indicate that PCBs are associated with several adverse effects on biota, including impaired reproduction in fish, marine mammals (Addison, 1989), land mammals, and birds (Giesy et aI., 1994).
PCBs have direct toxic effects on some biota (e.g., benthic organisms), but are more widely known for accumulating in the fatty tissues of higher trophic levels through repeated ingestion of contaminated food sources. Stored PCBs mimic hormones and can disrupt the endocrine system that governs reproduction. PCBs also have mutagenic, carcinogenic, and teratogenic properties in some species (Callahan, et aI., 1979; Steidl, et aI., 1991; Safe, 1994).
Because of their chemical properties, PCBs and PCTs discharged to a water body will adhere to the surfaces of suspended particulate matter. Since these compounds are heavier than water, the composite material is ultimately deposited as sediment. These contaminated sediments may then be distributed through tidal influences, dredging, storm events, and other sources of turbulence. Aquatic organisms also re-suspend and distribute contaminated sediments through bioturbation.
1-5
I I I I I I I I I I I I I I I I I I I
2.0 ASSESSMENT OVERVIEW
2.1 SAMPLING DESIGN
Prior to initiating field activities, the Trustees developed a sampling and analysis plan to document the sampling design and objectives, define sampling parameters, and establish field and chain-of-custody procedures (NOAA, 1997). The design of the sampling program was intended to provide the Trustees with as much information about the study area as possible within reasonable budgetary constraints.
The overall objective of the Duwamish Sediment Study was to provide information to support a natural resource damage assessment (NRDA) in the Duwamish River. The Trustees initiated assessment activities in 1996 after reviewing sediment chemistry data contained in a Resource Conservation and Recovery Act (RCRA) Facility Investigation report formally transmitted to NOAA by the Boeing Company. The geographic scope of the sediment portion of the RCRA Facility Investigation is limited to an area of the river adjacent to the Boeing Company Plant No.2 facility, which is the subject of a U.S. EPA RCRA Corrective Action Order. The following were stated objectives in the Sampling and Analysis Plan:
• Determine the spatial extent of [PCB and PCT] sediment contamination beyond the boundaries of the area previously characterized by Roy F. Weston near Boeing's Plant 2, where sediment contamination has already been demonstrated (Roy F. Weston, 1996, as given in the Sampling and Analysis Plan).
• Determine if there are other areas of contamination related to releases from Boeing properties or activities.
•
•
•
•
•
Assess the possible transport and far field deposition of Boeing contaminants in other parts of the river.
Identify the possible presence of other substantial areas of sediment contamination in areas not adjacent to Boeing properties, or not due to releases from Boeing, to evaluate allocation and the likely effectiveness of cleanup and restoration efforts.
Evaluate methods for identifying the sources of sediment contamination to support allocation of damages.
Develop sediment chemistry information that, in combination with tissue analyses, could be used to determine bioaccumulation rates.
Develop information on sediment chemistry that can be related to specific types of natural resources injury.
2-1
I I I I I I I I I I I I I I I I I I I
The sampling design uses a tiered approach to achieve the stated objectives. The Trustees were aware in developing this approach that multiple facilities and industrial activities may have released PCBs into the Waterway. Known information on the location of seeps and outfalls, and PCB releases from The Boeing Company's Plant No.2 facilities that had already been documented by facility investigations performed by Boeing under the RCRA investigation, were considered in the design process. Therefore, in the first tier, the study area was divided into two separate sub-areas, based on proximity of these areas to the adjacent Boeing properties. The first sub-area, Area 1, extends from the southern boundary of the study area (1. 5 km upstream from the Turning Basin) to Slip 4. The second sub-area, Area 2, extends from Slip 4 to the southern tip of Harbor Island. In the second tier, the two sub-areas were further subdivided into five cross-sectional regions, based on riverine tidal zone characteristics: east intertidal, east subtidal, navigational channel, west subtidal, and west intertidal. The third level of stratification divides the five regions into manageable sampling units or sub-strata (Figure 2-1).
In defining the third level of stratification, sub-stratum boundaries were established to designate practical groupings of seeps and outfalls and also take into account physical shoreline features such as slips and probable backwater depositional areas. The intertidal sub-strata were defined in contiguous areas of intertidal sediments; non-contiguous intertidal areas were not combined. The navigational channel sub-strata were larger and fewer in number, assuming relatively greater homogeneity in sediment contamination. In a few portions of the Waterway near known areas of high contamination, such as Slip 1 and Slip 4, the channel was divided into relatively small sub-strata. Some intertidal areas that were characterized by Weston in a previously conducted study were not sampled in this study (Weston, 1997); the remaining areas in the Weston study area received limited resampling. Two sub-strata were defined at the upriver boundary of the study area to provide reference area conditions (one subtidal and one intertidal).
Sample locations within each of the 90 sub-strata were determined by obtaining two sets (x and y coordinates) of 800 three-digit random numbers from the randomnumber generator function in Microsoft Excel 6.0 and plotting them within each of equally weighted areas (sampling segments) defined within each sub-stratum. There were 333 sampling stations defined in the Waterway; the average sample density was approximately 0.4 samples per hectare (O.9 samples per acre). Sampling densities for each sampling segment are available in NOAA, 1997. Area calculations do not include the intertidal areas that were not sampled (due to the previous Weston characterization; see Weston, 1997) or the few hard-substrate stations that could not be sampled.
The Trustees made several judgments in developing the sampling design, based on the need to assess contamination over the relatively large study area. First, they chose a total number of samples that would provide sufficient detectability for significant areas of contamination throughout the entire study area, based on average sampling densities and inter-sample distances. The sampling design was not intended to detect very small local areas of sediment contamination. Second, the Trustees based sub-area, habitat region, and sub-strata definitions within the study area on a priori knowledge of seep and outfall locations, tidal influences, and physical shoreline patterns to facilitate the investigation of potential sources of contamination and likely spatial patterns in sediment contaminant distribution. Third, the Trustees used random sampling within segments to select sampling
2-2

I I I I I I I I I I I I I I I I I I I
Duwamish Waterway Sediment Contamination Analysis Sampling Program Sub-strata
SLIP 2
SUP!
Habitat Region Codes
EIT Eastern Intertidal EST Eastern Subtidal CH Channel WST Western Subtidal WIT Western Intertidal
Note: Dimensions are exaggerated
Diagram is based on the Duwamish River Sediment Study
Sampling and Analysis Plan (NOAA, 1997)
Figure 2-1. A schematic diagram of the Duwamish Waterway subdivided into 90 substrata for the sediment sampling program; dimensions are not to scale.
2-3

I I I I I I I I I I I I I I I I I I I
locations within sub-strata with the objective of providing more uniform spatial coverage than pure random sampling.
2.2 FIELD SAMPLING
The Trustees established rigorous procedures for field sampling activities, as documented in the Duwamish River Sediment Study Sampling and Analysis Plan (SAP) (NOAA, 1997). Specifically, the SAP documents sampling equipment specifications and provides procedures for locating sample stations in the field. The SAP also contains detailed guidelines governing the collection, handling, and custody of sediment samples. Finally, the SAP documents training guidelines for sampling personnel and provides contingency procedures to handle deviations from anticipated field conditions.
Field operations were conducted from September to November 1997 by the National Marine Fishery Service's staff from the Northwest Fisheries Science Center, Environmental Conservation Division (NWFSC-ECD). The Trustees conducted field audits of the sampling activities on five separate days to ensure compliance with the SAP. During the initial audits, the Trustees noted and corrected minor deviations in sample labeling and the presentation of documentation. All corrections were made before samples were transferred to the laboratory. Therefore, the Trustees conclude that the sampling program complied with the protocols in the SAP, including the procedures for field changes and corrective action.
The original sample design called for the collection of 333 sediment samples; however, the total number of samples actually collected was 328. The difference between the planned and actual number of samples occurred because the field team was unable to collect some samples due to hard substrate or underwater obstacles. In these cases, the field team followed the protocol for selecting alternate sample stations outlined in the SAP. Specifically, if the field team was unable to collect a sample in the first three attempts, the station was abandoned. Five sample stations were abandoned due to substrate interferences. The following stations were abandoned:
• EIT 02-03 • EIT 15-01 • EIT 15-02 • EST 02-01 • EST Upriver-02
The Trustees implemented an audit to verify that samples were collected in the intended area and thus met the study's design objectives. The audit also included checking site depth to verify that the site met the depth criteria for the sampling design (e.g., sites located in subtidal sub-strata were not at depths expected of channel sites). This was done because of the dynamic nature of a dredged river system, where depths may change over time due to dredging or changes in water flow.
The audit showed that there were some discrepancies between targeted and actual sampling locations, as a result of imprecision in positioning. The Trustees identified 25 locations to be resampled; of those, 24 were successfully resampled. Only the resampled

I I I I I I I I I I I I I I I I I I I
sediments (designated by a trailing -R in the sample identification code) were analyzed for those 24 locations. The original sediment samples were archived but not analyzed. Based on the final recorded sampling locations in comparison to the sampling design, 85 percent of all samples are located in their correct sampling segment (each sub-stratum was divided into equally weighted areas (sampling segments) for randomly generated sample locations). An additional 10 percent are in a nearby sampling segment within the same targeted substratum (Table C-1), and 5 percent are outside their intended sub-strata (Table C-2). These positioning differences are not considered in the preliminary evaluations presented in this report. This simplification does not affect the general spatial patterns presented in the following sections of this report. More detailed analyses should consider the positioning information for collected samples provided in these tables.
2.3 ANALYTICAL PROCEDURES
Sediment samples were analyzed for PCBs and PCTs by NWFSC-ECD in Seattle, Washington. Total PCB + PCTs along with the quantitation of 15 individual PCB congeners were determined by methylene chloride extraction followed by high-performance liquid chromatography with photodiode array detection (HPLC/PDA). PCTs were further resolved using gas chromatography with electron capture detection (GC-ECD), then subtracted from the Total PCB + PCTs to obtain a calculated result for Total PCBs. Total organic carbon and grain size analyses were performed by Applied Marine Sciences, Inc. in League City, Texas. Analysis of total organic carbon was conducted according to the Puget Sound Protocols for Measuring Conventional Sediment Variables; grain size analysis was performed following the procedure in Sweet et al. (1994). Analytical procedures which were followed are detailed in the Quality Assurance Plan (QAP) (NOAA 1998).
The method used for the determination of PCBs and PCTs is an adaptation of previously published procedures by NWFSC-ECD scientists. The extraction procedure is a modification of the sonication procedure used by Krahn et al. (1991) for determination of aromatic hydrocarbons in sediment. The procedures for extract cleanup and HPLC/PDA analysis are based on a method developed for determining chlorobiphenyl congeners in marine tissue (Krahn et aI., 1994). This method was selected for analysis because it is significantly more rapid and cost-effective than more comprehensive methods (e.g., gas chromatography/high resolution mass spectrometry), while at the same time highly selective for PCBs and PCTs. Two important advantages of a PDA detector over more conventional detectors are the ability to identify individual analytes by comparing their ultraviolet spectra to those of reference standards and the ability to establish the spectral homogeneity (purity) of the analytes. Target detection limits of 4 ppb dry weight, which were specified in the project QAP, were readily achieved for Total PCBs and the PCB congeners in method detection limit studies performed by the laboratory. For total PCTs, the calculated method detection limit was greater than the target of 4 ppb dry weight at 8.1 5 ppb dry weight.
For reference purposes, the HPLC/PDA detection limits compare favorably to the more routine EPA methods which use GC-ECD for quantifying PCBs (EPA Methods 8081 and 8082). Detection limits for the EPA Method 8082 are in the range of 1 ppb dry weight for congeners and 50 ppb dry weight for Total PCBs as Aroclors.
2-5
I I I I I I I I I I I I I I I I I I I
2.4 QUALITY ASSURANCE
The Quality Assurance Plan (OAP) for the Duwamish River Sediment Investigation was developed by NWFSC-ECD in conjunction with EcoChem, Inc. (NOAA, 1998), The procedures are rigorous and meticulous, and are designed to meet the guidelines developed by the U.S. Environmental Protection Agency (U.S. EPA) and case-specific criteria developed by the Trustees. For the Duwamish Waterway sediment investigation, specific OA requirements were designed to monitor the performance of the measurement systems, to maintain statistical control and quality, and to verify that reported data were sufficiently complete, comparable, representative, unbiased, and precise. These objectives were achieved by defining OA procedures for the following categories: project OA responsibilities, sample handling and chain of custody, laboratory operations, assessment of data quality, quality control procedures, data reduction, corrective action and procedure alterations, and quality assurance reports to management. Quality assurance is further ensured through the use of an implementation structure that invokes multiple layers of responsibility and authority, employs communication and documentation procedures, and requires specific prerequisites and activities to ensure that sample data are technically sound, usable, and legally defensible. Quality assurance and control review procedures were enforced within the laboratory and by the OA Coordinator as necessary.
As a final step in the OA process, the Trustees retained EcoChem, Inc. to perform an independent data quality evaluation. As part of this validation process, EcoChem qualified many laboratory results as undetected, estimated due to co-eluting compounds, or estimated because the reported concentration was below the calculated method detection limit. The report also notes that 77 results for individual PCB congeners were not reported due to analytical interferences with co-eluting PCTs. As judged by EcoChem, these conditions do not compromise the data and none of the reported results were rejected. Overall, EcoChem concluded that the laboratories followed the specified analytical procedures and the protocols defined in the OAP and that the data are sufficient for use. The complete validation report is included in Appendix B.
2.5 SEDIMENT SAMPLING DATA BASE
The Trustees maintain an offiCial source data base to house the information generated during the Duwamish Waterway sediment investigation. The data base contains information on 328 samples along with associated results for Total PCBs, 15 PCB congeners, Total PCTs, grain size, and total organic carbon (TOC). The data base also contains laboratory and validation qualifiers, sample identification information, and spatial scale characteristics for each sample. Analytical chemistry results, validation, and station location information from this data base are provided in Appendix A.
The tables in Appendix A contain three types of information sets for the Duwamish Waterway sediment sample analysis results: sample physical data, sample total PCB and PCT concentrations, and congener concentration levels. The congener results are presented in separate tables which correspond to the regions defined in the Sampling and Analysis Plan (NOAA, 1997) and described in Section 2.1 of this report. Each of these tables lists the PCB congeners, total PCBs, and total PCTs for each station, in parts per billion dry weight, with associated qualifiers.
2-6

I I I I I I I I I I I I I I I I I I I
3.0 EXTENT AND NATURE OF CONTAMINATION
The data from the sediment sampling program show that PCBs and PCTs are found throughout the study area, although at a wide range of concentrations. In this section, the extent of this contamination is summarized with respect to two known sediment quality guidelines. One criterion is based on sediment contamination studies used by Washington State, and the other set of criteria is derived from numerous sediment toxicity sediment studies conducted throughout North America. These guidelines were used in this report because the Trustees have not yet derived a primary restoration goal for PCBs or PCTs in the Duwamish Waterway.
3.1 APPLICABLE CRITERIA
The Washington State Marine Sediment Quality Standards (SQS) level for PCB contamination is 12 mg of PCB per kg of Total Organic Carbon (TOC; WAC 173-204-320). This standard is intended to correspond to a sediment quality level (within Puget Sound marine sediments) below which acute or chronic adverse effects to biological resources, as a result of PCB contamination, are not likely. Information provided in Section 3.2 presents a general analysis of the extent of the contaminated sediments with respect to this standard.
Another set of criteria for evaluating the potential for biological effects associated with sediment PCB contamination has been derived by Long and Morgan (Long and Morgan, 1990; Long, et aI., 1995). Based on numerous toxicity studies that recorded both PCB concentration in sediments and adverse biological effects, Long and Morgan have derived two levels for defining the correlation: ER-L (22.7 ppb dry weight) and ER-M (180 ppb dry weight). ER-M represents the median level at which acute toxicity is observed and can be interpreted as the chemical concentration above which direct biological effects are likely. Similarly, ER-L is a level at which acute toxicity is observed in only 5% of the studies reviewed, and can be regarded as the chemical concentration below which direct biological effects are unlikely. Section 3.3 provides the results of a comparison between the PCB contamination levels in the Duwamish Waterway and the Long and Morgan criteria.
There are no similar values for PCTs. Section 3.2 reviews the extent of PCT contamination, but does not evaluate these data with respect to potential natural resource Injury. The Trustees anticipate that the peT data could be useful for differentiating releases by sources that used PCTs and therefore provide some guidance for evaluating sediment PCB contamination levels and distribution in possible future investigations in the Duwamish Waterway.
3.2 EXTENT OF PCB AND PCT CONTAMINATION AND COMPARISON WITH WASHINGTON sas LEVEL
To analyze the data set presented in Appendix A, the values for sample replicates were averaged so that there was one value for each sample location (Field-ID)' In addition,
3-1

I I I I I I I I I I I I I I I I I I I
a carbon-normalized PCB concentration was calculated as
(Total PCB-calc/(TOC/1 00))/1 000
for use in comparisons to the Washington State sas.
Figures 3-1 and 3-2 show reference maps of the total unnormalized (Le., not normalized for Total Organic Carbon) PCB and PCT concentration ranges observed in Duwamish Waterway sediments by sampling location. The distributions of concentration values, which range through several orders of magnitude for both contaminants, are summarized in histogram form in Figure 3-3. Note that the intervals on the concentration axes in these graphs increase logarithmically. This logarithmic scale is used because it allows environmental data, which commonly exhibit order-of-magnitude separations among the observations, to be summarized effectively. Under these conditions, the usual statistical measures such as the mean and the variance can be misleading summaries of the observations, and other measures more closely tied to the actual distribution of data values should be used (e.g., the median and the range).
When the concentration values are adjusted to account for sediment carbon content, in order to apply the Washington State sediment quality standard, 82 of the 326 samples for which Total PCBs are reported (25%) exceed the standard. Since the sampling program was not designed to achieve a uniform sampling density, the area of the Waterway exceeding the sas has to be evaluated by taking into account the area represented by each sample. The estimates for the area in each sub-stratum provided in the Sampling and Analysis Plan were used as the basis for this analysis.
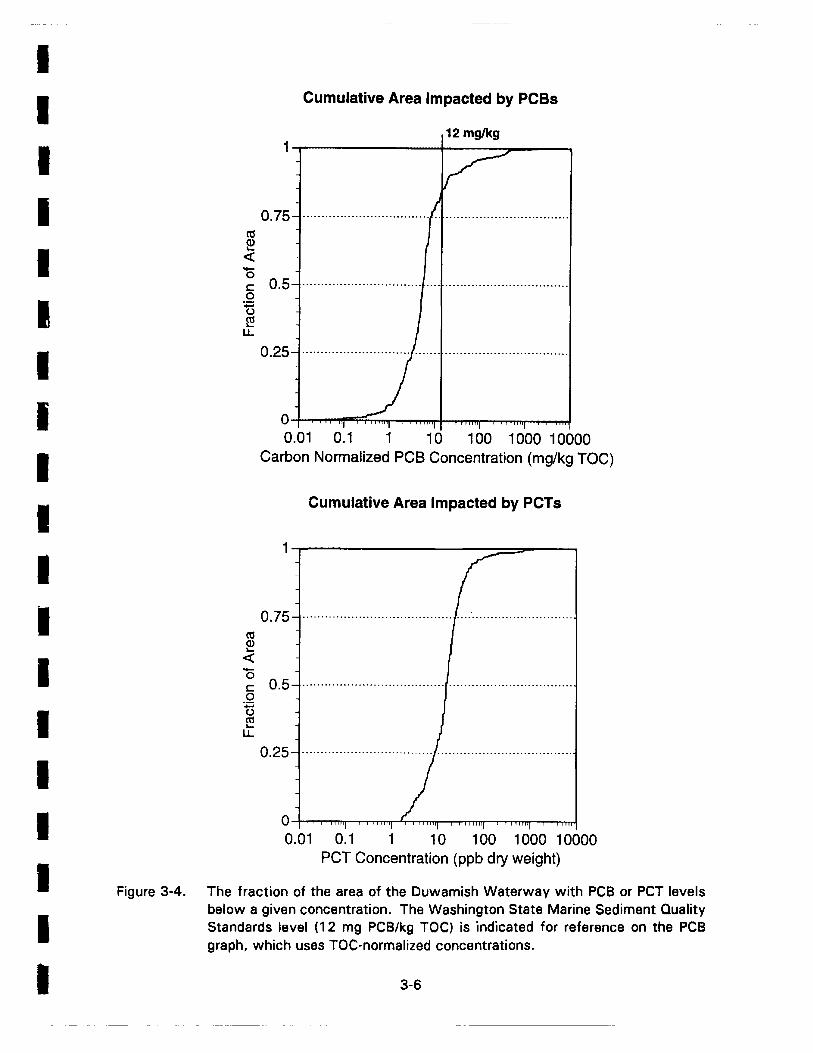
Figure 3-4 presents a cumulative distribution function of contaminant concentration versus percent of Waterway area. The proportion of the area of the Waterway affected by PCBs or PCTs with respect to a specific criterion can be obtained from Figure 3-4 by drawing a vertical line at the level of interest. The PCB graph illustrates this technique to show the area of the Waterway above and below the Washington State SOS (12 mg/kg TOC-normalized PCB concentration). The x-axis uses a logarithmic scale, with the Washington State SOS level indicated for reference; approximately 80% of the sampled area of the Waterway is at or below this level. Based on the interpretation of the SOS, the remaining 20%, which is above the criterion, has the potential for acute or chronic adverse effects to biological resources.
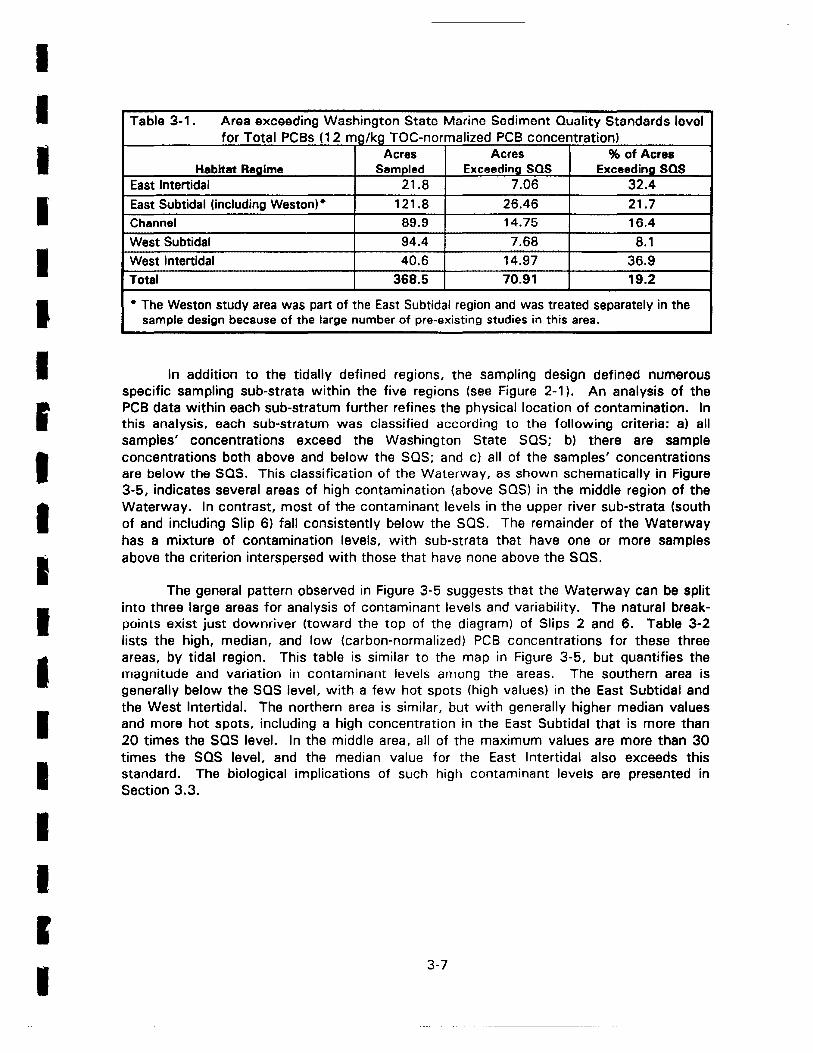
The areas exceeding the sas are relatively localized in the Waterway. Table 3-1 summarizes the distribution of these areas with respect to the five major habitat regions that were sampled. The intertidal areas on either side of the Waterway have the greatest proportion exceeding the criterion (greater than 30% in each case), while the largest amount of area above this level is in the East Subtidal (26.46 acres). Overall, almost 71 acres, representing approximately 19% of the sampled area, are estimated to be above the Washington State sas.

Harbor Island
Kellogg Island
Duwamish Waterway Sediment Contamination Analysis
Total PCBs (ppb dry weight)
Slip 1
Slip 4
PCB Concentration Ranges (ppb dry weight)
• 0.1 to 10
10 to 100 N
A· 100 to 1000
1 000 to 10000 KM 1 0000 to 1 00000
Figure 3-'. Measured PCB concentrations (in ppb) in Duwamish Waterway sediments.

Harbor Island
Duwamish Waterway Sediment Contamination Analysis
Total peTs (ppb dry weight)
Slip 4
Slip 6
PCT Concentration Ranges (ppb dry weight)
• •
1 to 10
10 to 100
100 to 1000
1 000 to 1 0000
10000 to 100000
N
A KM
Figure 3·2. Measured peT concentrations (in ppb) in Duwamish Waterway sediments.

I I I I I I I I I I I I I I I I I I I
Sampled PCB Concentrations (n = 326)
100
90
80
Q) 70
0> c: 60 ctS a: £ '-
50 Q) .0
40 E :::l Z
30
20
10
0 0- 1- 3- 1 0- 30- 1 00- 300- 1 000- 3000- 1 0000-
1 3 10 30 100 300 1000 3000 10000 30000 PCB Concentration Range (ppb dry weight)
Sampled PCT Concentrations (n = 328)
160
140
120 Q) 0> c: 100 ctS a: £ 80 '-Q) .0 E 60 ::::l Z
40
20
0 0- 1- 3- 1 0- 30- 1 00- 300- 1 000- 3000- 1 0000-
1 3 10 30 100 300 1 000 3000 10000 30000 PCT Concentration Range (ppb dry weight)
Figure 3-3. Observed distributions of PCB and PCT concentrations in the Duwamish Waterway sediment samples.
3-5
I I I I I I I I I I I I I I I I I Figure 3-4.
I I
Cumulative Area Impacted by PCBs
12 mg/kg 1,--------------+------~----~
0.75
-o c: 0.5 o t5 ~ u..
-
0.25
o~~~~~~~~~~~~~
0.01 0.1 1 10 100 1000 10000 Carbon Normalized PCB Concentration (mg/kg TOC)
Cumulative Area Impacted by PCTs
1,-------------------~==----_,
0.75
o c: 0.5 ...................................................................... . o
:;:; ()
~ u..
0.25 ....................................................................... .
04-~~~~~~~~rr=~~=-~nd
0.01 0.1 1 1 0 1 00 1 000 1 0000 PCT Concentration (ppb dry weight)
The fraction of the area of the Duwamish Waterway with PCB or PCT levels below a given concentration. The Washington State Marine Sediment Quality Standards level (12 mg PCB/kg TOC) is indicated for reference on the PCB graph, which uses TOe-normalized concentrations.
3-6
I I I I I I I I I I I I I I I I I I I
Table 3-1. Area exceeding Washington State Marine Sediment Quality Standards level for Total PCBs (12 mg/kg TOC-normalized PCB concentration)
Acres Acres % of Acres Habitat Regime Sampled Exceeding SOS Exceeding sas
East Intertidal 21.8 7.06 32.4 East Subtidal (including Weston)· 121.8 26.46 21.7 Channel 89.9 14.75 16.4 West Subtidal 94.4 7.68 8.1 West Intertidal 40.6 14.97 36.9 Total 368.5 70.91 19.2
• The Weston study area was part of the East Subtidal region and was treated separately in the sample design because of the large number of pre-existing studies in this area.
In addition to the tidally defined regions, the sampling design defined numerous specific sampling sub-strata within the five regions (see Figure 2-1). An analysis of the PCB data within each sub-stratum further refines the physical location of contamination. In this analysis, each sub-stratum was classified according to the following criteria: a) all samples' concentrations exceed the Washington State SOS; b) there are sample concentrations both above and below the SOS; and c) all of the samples' concentrations are below the SQS. This classification of the Waterway, as shown schematically in Figure 3-5, indicates several areas of high contamination (above SOS) in the middle region of the Waterway. In contrast, most of the contaminant levels in the upper river sub-strata (south of and including Slip 6) fall consistently below the SOS. The remainder of the Waterway has a mixture of contamination levels, with sub-strata that have one or more samples above the criterion interspersed with those that have none above the SOS.
The general pattern observed in Figure 3-5 suggests that the Waterway can be split into three large areas for analysis of contaminant levels and variability. The natural breakpoints exist just downriver (toward the top of the diagram) of Slips 2 and 6. Table 3-2 lists the high, median, and low (carbon-normalized) PCB concentrations for these three areas, by tidal region. This table is similar to the map in Figure 3-5, but quantifies the magnitude and variation in contaminant levels among the areas. The southern area is generally below the SOS level, with a few hot spots (high values) in the East Subtidal and the West Intertidal. The northern area is similar, but with generally higher median values and more hot spots, including a high concentration in the East Subtidal that is more than 20 times the SOS level. In the middle area, all of the maximum values are more than 30 times the SOS level, and the median value for the East Intertidal also exceeds this standard. The biological implications of such high contaminant levels are presented in Section 3.3.
3-7

I I I I I I I I I I I I I I I I I I I
Duwamish Waterway Sediment Contamination Analysis
North Area
Middle
Area
South Area
Washington SQS Level* Exceedances
Slip 2
Slip 3
Slip 4
Slip 6
SUb-stratum Color Code
D All samples below SOS
D Samples both above and below SOS
_ All samples - above SOS
* The Washington State SOS level is 12 mg PCB per kg of TOC.
Note: Dimensions are exaggerated
Figure 3-5. A schematic diagram showing three classes of sediment contamination relative to Washington State standards, based on samples collected within each sub-stratum.
3-8

I I I I I I I I I I I I I I I I I I I
Table 3-2. Carbon-normalized PCB concentration ranges in Duwamish Waterway sediments (mg/~ TOC)
Waterway Segment Habitat Regime South Area Middle Area North Area
East Intertidal No 13 18 10 a' 0.34 3.95 0.12 . 2.51 n.48 3.48
10.53 1805.05 10.33 East Subtidal No. 35 66 26
a' 0.09 0.04 3.72 1.46 , 1.57 6.31
a 18.61 607,84 299.32 Channel No. r". 4 21 13
0.85 0.80 3.17 1.46 4.14 5.5a
11m 2.34 403.94 80.92 West Subtidal No. ,. 12 36 19 .. 1.21 1.37 3.05
2.17 5.51 4.97 lJm 3.06 406.74 17.44
West Intertidal NQ, 19 18 Hi a' 0.32 3.44 0.34 a 1.23 8.70 4.75 a
lJnl 2138 838.71 38.33 Values exceeding the Washington State Sediment Quality Standard for PCB of (12 mg/kg TOC) are indicated in bold-faced and italicized type.
3.3 NATURE OF PCB CONTAMINATION IN RELATION TO BIOLOGICAL EFFECTS
The general characterization of the physical extent of contamination in the Waterway presented in Section 3.2 can be refined in terms of its biological implications by using the published ER-L and ER-M criteria for PCB toxicity to benthic organisms (Long and Morgan, 1990; Long, et aI., 1995). The Long and Morgan criteria are derived from numerous toxicity modeling, laboratory, and field studies performed with marine and estuarine sediments from areas throughout North America. The two guideline values, effects range-Low (ER-L) and effects range-Median (ER-M), define three concentration ranges that are rarely (below ER-L), occasionally (between ER-L and ER-M), or frequently (above ER-M) associated with adverse effects (acute toxicity) in organisms or communities. These criteria can be used to assess the biological significance of sediment-associated contamination. The values of ER-L (22.7 ppb dry weight) and ER-M (180 ppb dry weight) were compared to unnormalized PCB concentrations found in the sediments collected in the Duwamish Waterway. Results of this comparison are presented in this section.
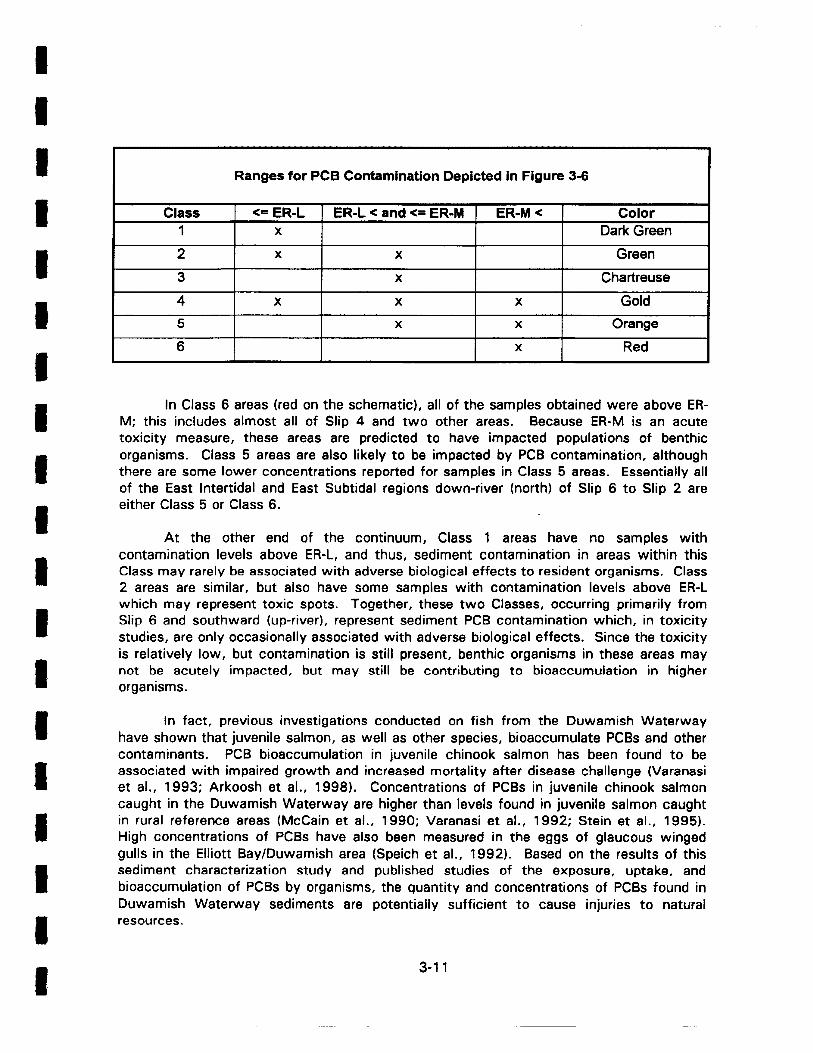
If the schematic in Figure 3-5 is redrawn, using the ER-L and ER-M, the sub-strata fall into 6 classes (Figure 3-6). The classes include samples' PCB concentrations relative to the ER-L and ER-M as follows:
3-9

I I I I I I I I I I I I I I I I I I I
Duwamish Waterway Sediment Contamination Analysis Biocriteria Exceedances
Note: Dimensions are exaggerated
Slip 2
Slip 3
Slip 4
Sub-stratum color indicates whether the samples in that area were above or below the ER-L and ER-M criteria as shown in the chart below.
ER-L ER-M
6 5
t:l 4 C'Il o 3
2 1
22.7 180 PCB Concentration -->
(ppb dry weight)
Figure 3-6. A schematic diagram showing six classes of sediment contamination relative to ER-L and ER-M levels, based on samples collected within each sub-stratum (see text for details).
3-10
I I I I I I I I I I I I I I I I I I I
Ranges for PCB Contamination Depicted in Figure 3-6
Class <= ER-L ER-L < and <= ER-M ER-M < Color 1 x Dark Green
2 x x Green
3 x Chartreuse
4 x x x Gold
5 x x Orange
6 x Red
In Class 6 areas (red on the schematic), all of the samples obtained were above ERM; this includes almost all of Slip 4 and two other areas. Because ER-M is an acute toxicity measure, these areas are predicted to have impacted populations of benthic organisms. Class 5 areas are also likely to be impacted by PCB contamination, although there are some lower concentrations reported for samples in Class 5 areas. Essentially all of the East Intertidal and East Subtidal regions down-river (north) of Slip 6 to Slip 2 are either Class 5 or Class 6.
At the other end of the continuum, Class 1 areas have no samples with contamination levels above ER-L, and thus, sediment contamination in areas within this Class may rarely be associated with adverse biological effects to resident organisms. Class 2 areas are similar, but also have some samples with contamination levels above ER-L which may represent toxic spots. Together, these two Classes, occurring primarily from Slip 6 and southward (up-river), represent sediment PCB contamination which, in toxicity studies, are only occasionally associated with adverse biological effects. Since the toxicity is relatively low, but contamination is still present, benthic organisms in these areas may not be acutely impacted, but may still be contributing to bioaccumulation in higher organisms.
In fact, previous investigations conducted on fish from the Duwamish Waterway have shown that juvenile salmon, as well as other species, bioaccumulate PCBs and other contaminants. PCB bioaccumulation in juvenile chinook salmon has been found to be associated with impaired growth and increased mortality after disease challenge (Varanasi et aI., 1993; Arkoosh et aI., 1998). Concentrations of PCBs in juvenile chinook salmon caught in the Duwamish Waterway are higher than levels found in juvenile salmon caught in rural reference areas (McCain et aI., 1990; Varanasi et aI., 1992; Stein et aI., 1995). High concentrations of PCBs have also been measured in the eggs of glaucous winged gulls in the Elliott Bay/Duwamish area (Speich et aI., 1992). Based on the results of this sediment characterization study and published studies of the exposure, uptake, and bioaccumulation of PCBs by organisms, the quantity and concentrations of PCBs found in Duwamish Waterway sediments are potentially sufficient to cause injuries to natural resources.
3-11

I I I I I I I I I I I I I I I I I I I
3.4 DISTRIBUTION PATTERNS OF CHEMICAL MIXTURES
The Trustees are considering future studies that will analyze the Duwamish Sediment Characterization Study data set in more detail. Preliminary analyses of contaminant patterns, conducted for this report, provide an indication of the usefulness of this data set for investigating the distribution of PCBs in the lower portion of the Duwamish River. The data set includes information on specific PCB congeners detected at each sampled location. The information collected could be used in conjunction with other studies and analyses to investigate some of the more complex aspects of the PCB distribution in the Waterway, such as time since the PCB release at a location, transport of PCBs between locations, the amount of mixing of PCBs from different releases, and the original composition (Aroclorlll mixture) of the PCB release represented at a location. Congenerlevel PCB concentrations provide a more detailed chemical characterization of sediment contamination than simple Total PCB results. Those more detailed congener-level data can support refined statistical evaluations that may help in identifying and evaluating sources or fate and transport processes contributing to the observed contaminant distributions in sediments.
The relative chemical breakdown of the 10 samples with the highest Total PCB + PCT concentrations is shown, with the relative locations of the samples, in Figure 3-7. All of the samples indicated have total concentrations greater than 4,000 ppb dry weight. Eight of the 15 PCB congeners that can be resolved by the HPLC/PDA method (PCBs 77,105,126,128,156,157, 169, and 189) are either not detected or present only in trace amounts (less than 5%) in all samples; these congeners are not plotted in the figure. The Uother" category represents the remaining fraction of the total PCB + PCT concentration for each sample that was not accounted for by the sum of the 15 congeners and PCT concentrations.
There are evident differences in the chemical mixtures at these locations. For example, PCTs are an important component only in the samples from the Weston substrata (samples DAC-WEST03 and DAC-WEST04 in the figure). PCB180 is found primarily in the samples south of Slip 4, while the samples in Slip 4 are dominated by PCB congeners that were not individually identified by the laboratory methods used in this study. The Trustees are investigating how these and other differences can be mathematically quantified.
3-12

I I I I I I I I I I I I I I I I I I I
Harbor Island
lmJ.; .~ 11 ~·.I ! i
DAC-EST21-03
n 1 ,. I ! .
DAC-WIT11-01
I I ;!.I lJLJ DAC-CH04-02
Duwamish Waterway Sediment Contamination Analysis
Chemical Composition at High-Concentration Sites
N
A KM
BarChart
.PCB101 DpCB110 [JPCB118 ~PCB138 DpCB153 .PCB170 .PC8180 .TOTAL PCT I[] OTHER
Note: Data for PCB congeners n,105, 126, 128, 156, 157, 169, and 189 were not plotted due to low concentrations
~ ...
:1 , I
! I , i
I
: I dl
I II Fel I
DAC-EST12-02 DAC.EST12.01
Slip 3 \ ~ . Slip 4 IJlli.
I
DAC-EIT08-02
1 I
. I
50% DAC-WEST04 DAC-EST12-05
30%
Bar height guide (% of Total)
Figure 3-7.
I -~IL:! - I ' ! __ i ~ lJr.Jil I .•
.
': : 1 I
-.. -, I
DAC·WEST03 DAC·WST09-02
Turning Basin \>
The chemical compositions of the 10 samples with the highest Total PCB + PCT concentrations; the samples' FIELD_IDs are shown below each graph.
3-13
I I I I I I I I I I I I I I I I I I I
4.0 REFERENCES
Addison, R.F. 1989. Organochlorines and marine mammal reproduction. Can. J. Fish. A qua t. Sci. 46:360-368.
Arkoosh, M.R., E. Casillas, P. Huffman, E. Clemons, J. Evered, J.E. Stein, and U. Varanasi. 1998. Increased susceptibility of juvenile chinook salmon (Oncorhynchus tshawytscha) from a contaminated estuary to the pathogen Vibrio anguillarum. Transactions of the American Fisheries Society 127:360-374.
Callahan, M.A., et al. 1979. Water-related Environmental Fate of 129 Priority Pollutants. U.S. Environmental Protection Agency, Office of Water and Waste Management, Washington, DC, EPA-440/4-79-029a.
De Kok, A., R.B. Geerdink, G. DeVries, and U.A. Th. Brinkman. 1982. An evaluation of Chromatographic methods for the Analysis of polychlorinated terphenyls in environmental samples. International Journal of Analytical Chemistry 12:99-122.
Erickson, M.D. 1997. Analytical Chemistry of PCBs, 2nd ed. CRC Press, Inc.
Giesy, J.P., J.P. Ludwig, and D.E. Tillin. 1994. Deformities in birds of the Great Lakes region: assigning causality. Environ. Sci. Technol. 28(3): 128-135.
Jensen, A.A., and K.F. Jorgensen. 1983. Polychlorinated terphenyls (PCTs) use, levels and biological effects. Science of the Total Environment, 27:231-250.
Krahn, M.M., G.M. Ylitalo, J. Buzitis, C.A. Sloan, D.T. Boyd, S. Chan, and U. Varanasi. 1994. Screening for planar chlorophenyl in tissues of marine biota by highperformance liquid chromatography with photodiode array detection. Chemosphere 29(1):117-139.
Krahn, M.M., G.M. Ylitalo, J. Joss, and S.L. Chan. 1991. Rapid, semi-Quantitative screening of sediments for aromatic compounds using sonic extraction and HPLC/fluorescence analysis. Mar. Environ. Res. 31 :175-196.
Long, E.R., D.O. MacDonald, S.L. Smith, and F.D. Calder. 1995. Incidence of adverse biological effects within ranges of chemical concentrations in marine and estuarine sediments. Environmental Management 19(1 ):81-97.
Long, f.R., and L.G. Morgan. 1990. The potential for biological effects of sedimentsorbed contaminants tested in the National Status and Trends Program. NOAA Technical Memorandum NOS OMA 52.
McCain, B.B., D.C. Malins, M.M. Krahn, D.W. Brown, W.O. Gronlund, L.K. Moore, and S.L. Chan. 1990. Uptake of aromatic and chlorinated hydrocarbons by juvenile chinook salmon (Oncorhynchus tshawytscha) in an urban estuary. Arch. Environ. Cont. Toxicol.19:10-16.
4-1
I I I I I I I I I I I I I I I I I I I
National Oceanic and Atmospheric Administration (NOAA). 1997. Duwamish River Sediment Study Sampling and Analysis Plan. Report prepared for the NOAA Damage Assessment Center, Seattle, WA by Environmental Conservation Division, Northwest Fisheries Science Center, National Oceanic and Atmospheric Administration, Seattle, WA.
National Oceanic and Atmospheric Administration (NOAA). 1998. Duwamish River Sediment Study Quality Assurance Plan. Report prepared for the NOAA Damage Assessment Center, Seattle, WA by Environmental Conservation Division, Northwest Fisheries Science Center, National Oceanic and Atmospheric Administration, Seattle, WA in collaboration with EcoChem, Inc.
Safe, S.H. 1994. Polychlorinated biphenyls (PCBs); environmental impact, biochemical and toxic responses, and implications for risk assessment. Crit. Rev. Taxieal. 24(2):87-149.
Speich, S.M., J. Calambokidis, S. Shea, J. Peard, M. Witter, and D.M. Frye. 1992. Eggshell thinning and organochlorine contaminants in western Washington waterbirds. Colonial Waterbirds 15: 1 03-112.
Steidl, R.J., C.R. Griffin, and L.J. Niles. 1991. Reproductive success and eggshell thinning of a re-established Peregrine Falcon population. J. Wildlife Management 55(2):294-299.
Stein, J.E., T. Hom, T.K. Collier, D.W. Brown, and U. Varanasi. 1995. Contaminant exposure and biochemical effects in outmigrant juvenile chinook salmon from urban and non-urban esutaries of Puget Sound, Washington. Environ. Toxieol. Chem. 14:'019-'029.
Sweet, S.T., J.M. Wong, J.M. Brooks, and T.L. Wade. 1994. Sediment grain size analyses. Geotechnical and Environmental Research Group, Texas A&M University.
Tanner, C.D. 1991. Potential intertidal habitat restoration sites in the Duwamish River Estuary. EPA 910/9-91-050. Prepared for the Port of Seattle Engineering Department and the U.S. Environmental Protection Agency, Environmental Evaluations Branch, Region 10, Seattle, Washington. December, 1991.
Thomas, K.B. and T. Colborn. 1992. Organochlorine endocrine disruptors in human tissue. In: Chemically-induced alterations in sexual and functional development: The wildlifelhuman connection. Advances in Modern Environmental Toxicology, Vol. XXI, pp. 342-343. T. Colborn, and C. Clement, eds. Princeton, NJ: Princeton Scientific.
U.S. Fish and Wildlife Service (USFWS). 1996. Elliott Bay/Duwamish River preliminary avian and mammal injury/exposure assessment. November 6, 1996.
U.S. Geological Survey (USGS). 1997. Gauge Number 1211300.
4-2
I I I I I I I I I I I I I I I I I I I
Varanasi, U., J.E. Stein, W.l. Reichert, K.l. Tilbury, M.M. Krahn, and S.L. Chan. 1992. Chlorinated aromatic hydrocarbons in bottom sediments, fish and marine mammals in U.S. coastal waters; laboratory and field studies of metabolism and accumulation. In: Persistent Pollutants in Marine Ecosystems. C.H. Walker and D.R. Livingstone, editors, pp. 83-115.
Varanasi, U., E. Casillas, M.R. Arkoosh, T. Hom, D.A. Misitano, D.W. Brown, S-L Chan, T.K. Collier, B.B. McCain, and J.E. Stein. 1993. Contaminant exposure and associated biological effects in juvenile chinook salmon (Oncorhynchus tshawytscha) from urban and non-urban estuaries of Puget Sound. NOAA Tech. Memo. NMFS-NWFSC-8, 112 p.
Warner, E. 1996. Muckleshoot Tribes Fisheries Department. Personal communication. November 6, 1996.
Weston, Roy F., Inc. 1997. Comprehensive RCRA Facility Investigation Report, BoeingPlant 2, Seattle Tukwila, Washington. Prepared for the Boeing Company, Boeing Information Support Services, Safety, Health, and Environmental Affairs. August, 1997.
4-3