i section: 13.4 background chapter 4 6 1 cooling tower
TRANSCRIPT

I AP42 Section:
Background Chapter Reference:
1 Title:
I
I
13.4
4 6
Cooling Tower Drift Test Report for Unnamed Client of the Cooling Tower Institute, Houston, Texas.
Midwest Research Institute (1989)

SUMMARY
The t e s t i n g serv ices o f Midwest Research I n s t i t u t e (MRI) were re ta ined by ] t o conduct d r i f t t e s t s on a !
\7-ce l l , mechanical-draft, counter- f low coo l ing tower located a t the !The work was performed by M R I as an
independent t e s t cont ractor .
Cooling tower d r i f t i s def ined as the percent o f water f l ow through the tower which e x i t s through the fan i n the f o r m o f water d rop le ts and aerosols. The amount o f d r i f t from the tower was determined by i s o k i n e t i c a l l y sampling a representat ive f r a c t i o n o f the tower a i r f l ow , and measuring the amount o f d rop le ts and aerosol leav ing the stack. I n d u c t i v e l y coupled argon plasma spectroscopy (ICP), an extremely sens i t i ve de tec t i on technique, was then used t o measure the concentrat ion o f three selected t race cons t i tuents (Na, Ca, Mg ) i n the basin water and water co l l ec ted from the a i r f l o w e x i t i n g the fan stack. A t the p l a n t ' s request, an add i t i ona l t race cons t i tuent , chromium ( C r ) , was analyzed. Since the chromium concentrat ion was near the de tec t ion l i m i t o f (ICP), the d r i f t samples were analyzed us ing Graphite Furnace Atomic Absorption (GFAA). From the measurements o f the se lected t race const i tuents i n the i s o k i n e t i c sampling t r a i n and the same t race cons t i tuents i n the bas in water, the d r i f t r a t e was calculated.
The ca lcu lated d r i f t r a t e s were between 0.0188% and 0.0348% f o r Fan Stack 1. depending on which o f the three t race rs was used. When the r e s u l t s are averaged f o r main t racers, a d r i f t r a t e o f 0.027% i s obtained f o r Fan 1. The ca lcu la ted d r i f t r a t e f o r chromium i s 0.0077% f o r Fan 1.
The ca lcu lated d r i f t r a t e s were between 0.0107% and 0.0146% f o r Fan Stack 5, depending on which o f the three t race rs was used. When the r e s u l t s are averaged f o r main t racers, a d r i f t r a t e o f 0.013% i s obtained f o r Fan 5. The ca lcu la ted d r i f t r a t e f o r chromium i s 0.0063% f o r Fan 5.
The average d r i f t r a t e f o r the three main t r a c e r s from Fan Stacks 1 and 5 was 0.020%, and t h e average chromium (Cr) d r i f t r a t e from Fan Stacks 1 and 5 was 0.007%. It should be noted t h a t the water c i r c u l a t i o n r a t e was 125.5% o f design, and t h a t the d r i f t sampling was conducted on two days when the wind speed was very high. This, i n combination w i t h low concentrat ion o f the t racers, could account f o r spread o r v a r i a t i o n from t r a c e r t o t racer .

.' . , ir'
COOLING TOWER TEST REPORl
DRIFT TEST ON THE
7-CELL, MECHANICAL-DRAFT, COUNTER-FLOW COOLING TOWER
I. INTRODUCTION
The t e s t i n g services o f Midwest Research I n s t i t u t e (MRI) were re ta ined by t h e Watson Cogeneration Company t o conduct d r i f t t e s t s us ins EPA Modif ied Method 5 i s o k i n e t i c sampling techniques on a mechanical-draft, counter-flow coo l ing tower. The coo l ing tower i s located a t
The work was performed by Nicholas M. S t i c h and Steve Cummins o f M R I .
11. TEST SITE DESCRIPTION
The ' p l a n t i s located i n The ' coo l ing tower provides coo l ing water t o process heat exchangers
and steam condensers. The coo l ing tower i s located a t ,
The coo l ing tower cons is ts o f seven mechanical-draft, counter- f low c e l l s i n a continuous s t r a i g h t l i n e w i t h a common co ld water bas in beneath the tower. Each c e l l I s equipped w i t h a I28-ft diameter, six-bladed f a n d r i ven by a 100-hp motor. The hub seal was 84 i n . i n diameter. The fan stack was 336 i n . i n diameter a t the sample plane l o c a t i o n and constructed o f f iberg lass.
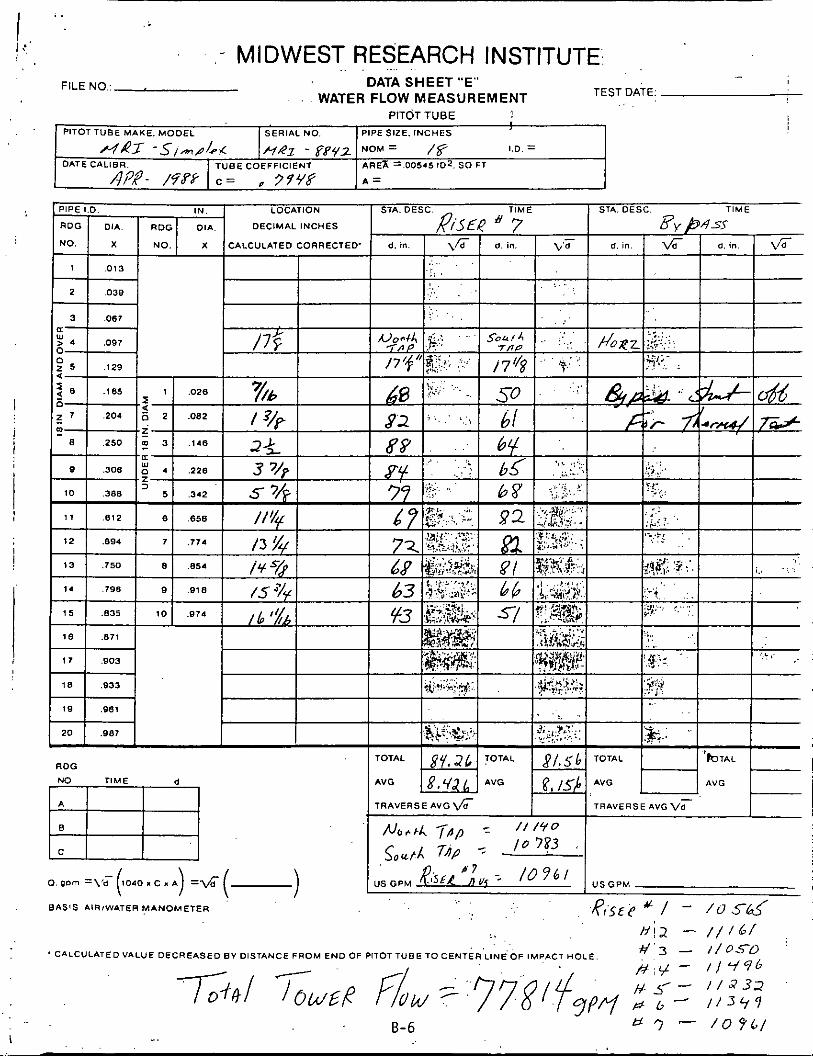
One underground ground s tee l condui t re tu rns ho t water from the p l a n t t o the coo l ing tower. The main l i n e then tees o f f t o feed seven ind i v idua l 18-in-diameter c e l l r i s e r s . P i t o t taps f o r water f low and hot water measurement were located i n the 18- in l ines.
The c o l d water from the coo l ing tower basin i s c o l l e c t e d i n the pump forebay adjacent t o the tower where four of the f i v e pumps are used t o r e t u r n co ld water t o the p lant . Taps w i t h temporary standpipes were used f o r the measurement o f co ld water temperatures on each o f the f o u r pump discharge l ines .
2

111. SAMPLING SEQUENCE
The t e s t sequence f o r the d r i f t t e s t s were as fo l lows:
1.
2.
3.
4.
5.
6.
7.
8.
9.
Water f l o w and fan horsepower measurements were conducted and t h e tower operat ions monitored.
D r i f t sample and a i r f l o w measurement loca t ions were ca lcu lated.
A basin water sample was co l lected.
I s o k i n e t i c d r i f t sampling o f the selected f a n stack was conducted.
A second bas in water sample was c o l l e c t e d dur ing t h e middle o f t h e d r i f t t e s t .
I s o k i n e t i c d r i f t sampling o f the fan was completed.
A t h i r d bas in sample was co l lec ted a t t h e conclusion o f t h e tes t . The th ree bas in samples were composited i n t o one bas in water sample.
The d r i f t samples were recovered from the sample c o l l e c t i o n system.
The basin composite, water blank, and d r i f t impinger samples were ac id -s tab i l i zed and transported t o the labora tory f o r analysis.
I V . DRIFT TEST EQUIPMENT
A. Sample Locat ion
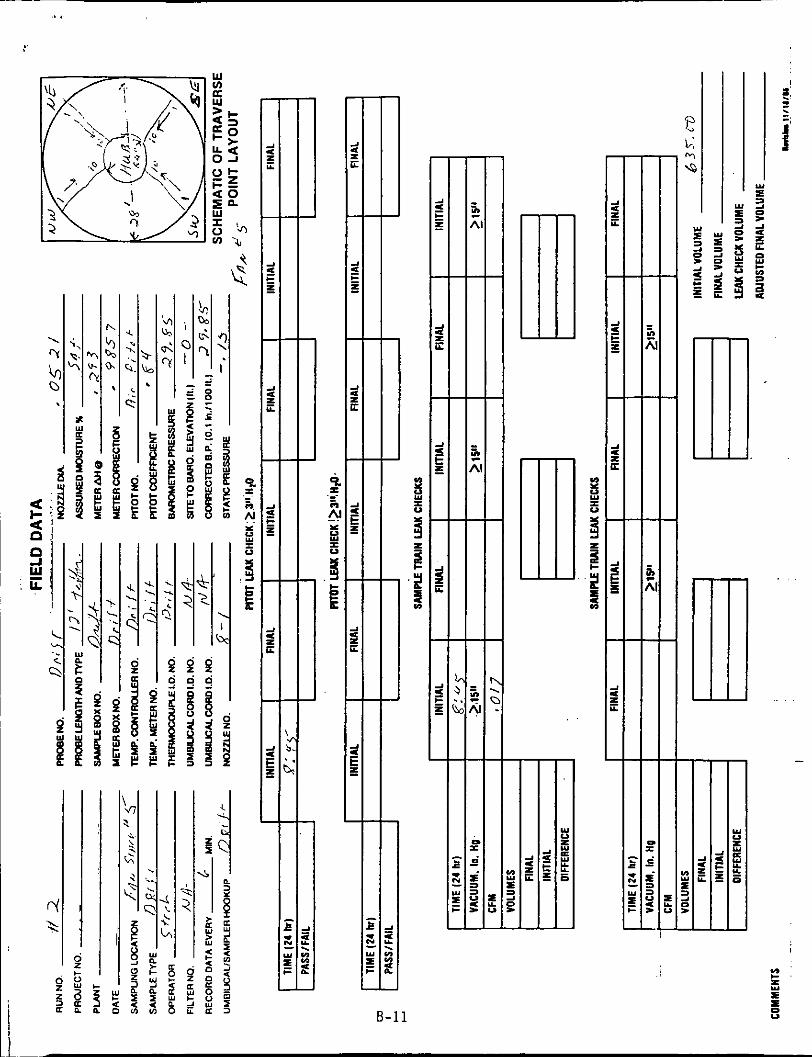
Since d r i f t i s def ined as t h e amount o f d rop le ts o r aerosols e x i t i n g the fan stack. t h e d r i f t t e s t s must be made a t the top o f the f a n stack. Also, t h e p r o x i m i t y o f t h e sample loca t ions t o the f a n requi red t h a t t h e s t a t i o n loca t ions be adjusted f o r the hub e f fec t . Sample loca t ions were determined f o r 10-point r a d i a l t raverses us ing the equat ion f o r equal annular areas f o r f a n discharge from Chapter 5 o f the C T I Manual.
B. A i r P i t o t / D r i f t Probe
Since cyc lon ic f l o w can b ias t h e d r i f t r e s u l t s , adjustments i n t h e sampling technique must be used t o e l im ina te t h i s bias. A spec ia l M R I a i r p i t o t / d r i f t probe assembly was developed t o a l low unbiased sampling. I f t h e sample nozzle i s not al igned w i t h t h e f low, then e f f e c t i v e v e l o c i t y through the nozzle opening i s reduced by the cosine o f the angle between t h e f l o w and
3

5'
i I stack axis. This results in a sample which is not truly isokinetic, and thus
the alignment approach1 must be used for the drift test to eliminate this bias. Since the sample proportionality could be compromised with the alignment approach, proportional sampling needs are then satisfied by adjusting the nominal base sample time by the cosine of the cyclonic flow angle. Airflow, fan discharge temperature, and the angle of cyclonic flow were measured with this probe assembly. The air pitot/drift probe assembly was equipped with:
1.
2.
3.
4.
5.
S-type primary pitot tips which are connected to a manometer to measure air velocity.
Secondary pitot tips which are positioned at 90" from the primary pitot tips. The secondary set of pitot tips are connected to a separate manometer to align the probe and compensate for any cyclonic flow effects.
A temperature sensor connected to a digital readout to measure the stack temperature.
A protractor attached to the probe assembly to determine the angle that the probe was rotating during the cyclonic flow determination.
A stainless steel sample nozzle and flexible Teflon sample probe which are connected to the drift collection train.
C. Drift Collection Train
The drift collection train consists of four high-capacity impingers and a filter assembly. Impingers 1 and 2 contained distilled water and were used to scrub out the aerosols and water droplets. The third impinger was used to collect any water droplets that might be carried over from the previous impingers. The filter was used as the final collection media and was placed between Impinger 3 which was dry and Impinger 4 which contained silica gel. The sampling train was kept iced during testing to help reduce the water vapor pressure and to further improve collection efficiency.
D. Control Console and Pump
The control console and pump used was a High-Volume Sampling System (HVSS) consistent with EPA Method 5 requirements. The impinger train is connected to the console via a sample line through the leak-free vacuum pump capable of up to 4 cfm. The modular vacuum pump has two control valves to adjust and maintain the desired sampling rate. The console contains a
1 Peeler, J. W . , F. J. Phoenix, and 0. J. Grove, "Characterization of Cyclonic Flow and Analysis of Particulate Sampling Approaches at Asphalt Plant," Entropy Environmentalists, Inc.
4

adjust and mainta in the des i red sampling ra te . The console contains a I ca l ib ra ted d r y gas meter, d i g i t a l temperature readout, manometers, and associated contro ls .
V. DRIFT TEST METHODS
Test ing was conducted on . The tower 's c i r c u l a t i n g water f l o w was 125.5% o f design, and t h e f a n horsepower was 103.1% o f design. The t e s t data were acquired i n accordance w i t h appl icable p o r t i o n s o f the C T I ATC-105 (1982) t e s t code. The i n d i v i d u a l parameters were measured as fo l lows:
T o t a l c i r c u l a t i n g water f l o w was measured w i t h two 10-point p i t o t t raverses o f the seven hot water r i s e r s . A 42-in Simplex- Leopold-type p i t o t tube was used t o measure t h e v e l o c i t y a t each po in t . An air-over-water manometer ,was used f o r measuring t h e d i f f e r e n t i a l pressure between t h e impact and reference o r i f i c e s o f t h e p i t o t tube.
Fan motor power was measured w i t h a clamp-on d i g i t a l k i l o w a t t meter, us ing t h e two wat t meter method.
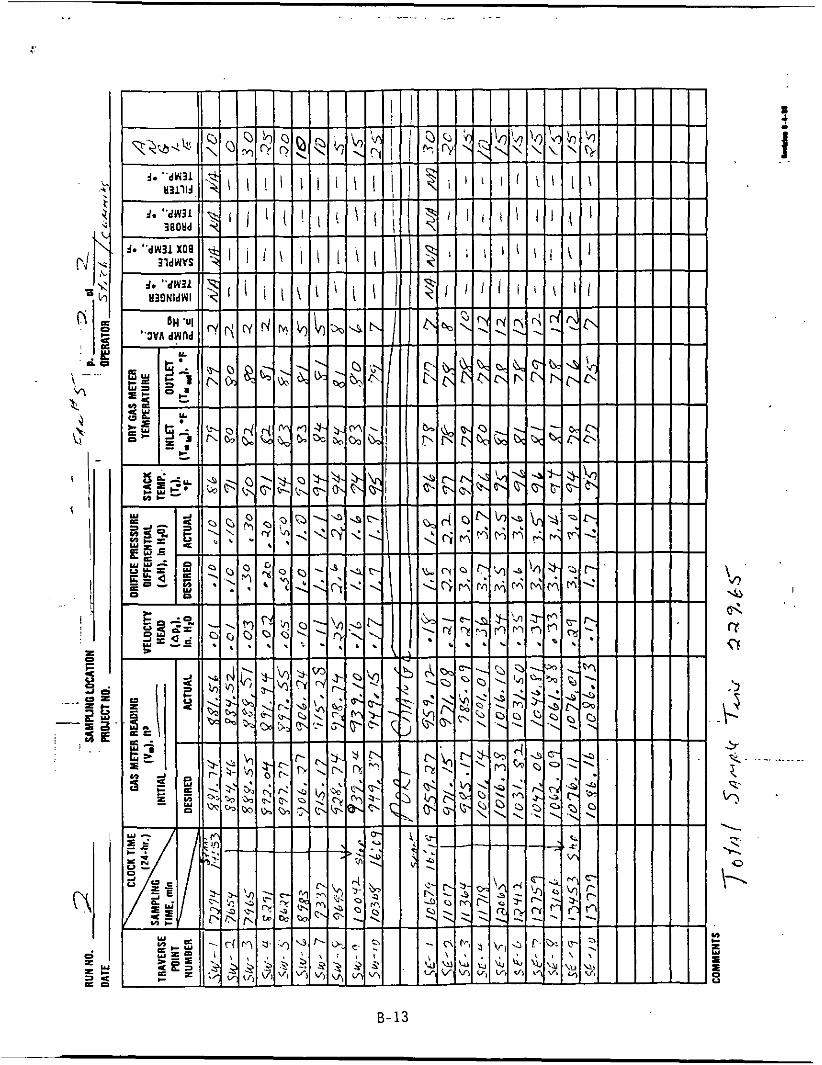
A i r v e l o c i t y was measured w i t h f o u r 10-point r a d i a l t raverses o f t h e f a n stack us ing the predetermined sampling locat ions. A t each p o i n t t h e M R I a i r p i t o t / d r i f t probe assembly was r o t a t e d u n t i l the pres- sure d i f fe rence across the secondary p i t o t t i p s was zero. When t h i s zero d i f f e r e n t i a l was obtained, the primary probe had been a l igned w i t h the f l o w and t h e p r o t r a c t o r read t o determine t h e cyc lon ic f l o w angle. The probe assembly was then used t o measure the v e l o c i t y pressure and temperature a t the sample point .
The i s o k i n e t i c sample r a t e and propor t ional sample dura t ion were determined using an Epson HX-20 computer. The prev ious ly determined v e l o c i t y pressure, stack temperature, and cyc lon ic f l o w angle were used by a computer program t o c a l c u l a t e the requ i red sample volume, i s o k i n e t i c rate, and the adjusted base sample time.
Sampling a t each t raverse l o c a t i o n was commenced a f t e r t h e proper sample r a t e was determined by t u r n i n g on the sample pump and simul- taneously a c t i v a t i n g the v a r i a b l e t imer f u n c t i o n o f the HX-20 computer. When each sample t ime had ended, the pump was shut o f f , t h e a i r p i to t /probe assembly was re located t o t h e next sample loca- t i o n , and the above procedure repeated u n t i l a l l 40 p o i n t s had been sampled . The d r i f t sample recovery was i n i t i a t e d by using d i s t i l l e d deionized water t o r i n s e the s ta in less s t e e l nozzle and f l e x i b l e Te f lon probe i n t o the contents o f the f i r s t impinger. The impinger t r a i n was sealed and then removed from t h e cool ing tower t o t h e sample recovery l o c a t i o n where the remainder o f the sample recovery was
5
I -
f'
recorded. The impinger contents, along with all the rinse, were I transferred to sample bottles. A distilled deionized water blank was taken. Both the drift impinger samples and water blank were nitric acid-stabilized and then returned to MRI for further analysis.
Basin water samples were taken at the beginning, the midpoint, and the conclusion of the drift sample. The basin water sample was taken from a thermal well that was installed on the discharge side of the circulating water flow pump. The samples were collected after the thermal well line was purged. The three samples were collected and then combined into one composite basin water sample. The composite basin sample was stabilized with nitric in the same manner as were the impinger and water blank samples. The composite basin water sample was returned to MRI for further analysis.
VI. SAMPLE ANALYSIS
The samples were returned to MRI where custody o f the samples was transferred to the analytical section. Quantitative analysis of selected trace elements in both the tower basin water samples and the collected drift samples was then performed by the analytical section. A Jarrell-Ash Model 1155A ICP-AES instrument was used to analyze the samples by inductively coupled argon plasma spectroscopy (ICP) samples. Graphite furnace atomic absorption spectroscopy (GFAA) was used to analyze for chromium on a Perkin- Elmer Model 5000 Zeeman Atomic Absorption Spectrophotometer. The drift and basin water samples were prepared using two different preparation techniques, Method 3050 and the acidification and dilution procedure. The results presented in this report are the averages obtained from the analysis of both preparation techniques for each sample. Method 6010 was used for the analysis of Ca, Na, Mg, and Method 7191 was used for the analysis of Cr. The methods used are described below.
A. Acidification and Dilution
This procedure was used to prepare surface and groundwater samples for analysis by flame atomic absorption spectroscopy (FLAA) or by inductively coupled argon plasma spectroscopy (ICP).
The entire sample is acidified at the time of collection with nitric acid. At the time of analysis the sample is diluted, if necessary, and acidi- fied with nitric to obtain approximately a 10% nitric acid sample matrix which is then ready for analysis.

B. Method 3050
Method 3050 i s an ac id d iges t ion procedure used t o prepare sedi- ments, sludges, and s o i l samples f o r analys is by f lame o r furnace atomic absorpt ion spectroscopy (FLAA and GFAA, respec t ive ly ) o r by I C P .
A representat ive sample i s digested i n n i t r i c ac id and hydrogen peroxide. The d igestate i s then re f luxed w i t h e i t h e r n i t r i c a c i d o r hydro- c h l o r i c acid. D i l u t e hydroch lo r ic ac id i s used as the f i n a l r e f l u x a c i d f o r (1) the I C P analys is o f As and Se, and (2) the flame AA o r I C P ana lys is o f A l , Ba, Ca, Cd, C r , Co, Cu, Fe, Mo, Pb, N i . K, Na, T1, V , and Zn. D i l u t e n i t r i c ac id i s employed as the f i n a l d i l u t i o n ac id f o r the furnace AA ana lys is o f As, Be. Cd. C r , Co, Pb, Mo, Se, T1. and V.
C. Method 6010
Method 6010 describes the procedures f o r ICP i n determining elements inc lud ing metals i n so lut ion. This method i s appl icable t o a l a rge number o f metals and wastes. A l l matr ices, inc lud ing groundwater, aqueous samples, EP extracts, i n d u s t r i a l wastes, s o i l s , sludges, sediments, and o ther s o l i d wastes, requ i re d iges t ion p r i o r t o analysis.
The simultaneous, o r sequential, mult ie lemental determinat ion o f elements by I C P i s measured by element-emitted l i g h t by o p t i c a l spectrom- etry. Samples are nebulized, and the r e s u l t i n g emission spectra are produced by a rad io frequency i n d u c t i v e l y coupled plasma. The spectra are dispersed by a g ra t i ng spectrometer, and the i n t e n s i t i e s of the l i n e s are monitored by pho tomu l t i p l i e r tubes. Background co r rec t i on i s requ i red f o r t r a c e element determination.
0. Method 7000 and 7191
Method 7000 i s used f o r the determinat ion o f metals i n dr ink ing , surface and s a l i n e waters, and domestic and i n d u s t r i a l wastes by Atomic Absorption. While d r i nk ing water f r e e of p a r t i c u l a t e matter may be analyzed d i r e c t l y , groundwater, o ther aqueous samples, EP ext racts , i n d u s t r i a l wastes, so i l s , sludges, sediments, and other s o l i d wastes requ i re d iges t i on p r i o r t o analysis. Method 7191 i s a mod i f i ca t ion of Method 7000 t h a t i s s p e c i f i c f o r chromium by Atomic Absorption using the furnace technique.
I n d i r e c t asp i ra t i on atomic absorpt ion spectroscopy, a sample i s aspirated and atomized i n a flame. A l i g h t beam from a hol low cathode lamp o r an e lect rodeless discharge lamp i s d i rec ted through the flame i n t o a mono- chromator and onto a detector t h a t measures the amount o f absorbed l i g h t . Absorption depends upon the presence o f free, unexcited ground-state atoms i n the flame. Because the wavelength o f the l i g h t beam i s c h a r a c t e r i s t i c of on ly the metal being determined, the l i g h t energy absorbed by t h e flame i s a measure o f the concentrat ion o f t h a t metal i n the sample. This p r i n c i p l e i s the basis o f atomic absorption.
7

When using the furnace technique in conjunction with an atomic absorption spectrophotometer. a representative aliquot of the sample is placed in the graphite tube in the furnace, evaporated to dryness, charred, and atomized. As a greater percentage of available analyte atoms is vaporized and dissociated for absorption in the tube rather than the flame, the use of smaller sample volumes or detection of lower concentratlons of elements is possible. The principle is essentially the same as with direct aspiration atomic absorption, except that a furnace, rather than a flame is used to atomize the sample.
VII. RESULTS AN0 CONCLUSIONS
The following equation is used by the MRI drift computer program to calculate the drift results:
% Drift = 100 (NFA - NWT)/(NZA - WFR EQT BTC)
where: NFA = Net Fan Area (square feet) NWT = Net Weight of Tracer (micrograms) NZA = Nozzle Area (square feet) WFR = Water Flow Rate (grams per minute) EQT = Equivalent Sample Time (240 minutes) BTC = Basin Tracer Concentration (micrograms per grams)
The table below summarizes the results of the laboratory analysis and drift calculations.
FAN STACK 1
Sample Water Basin Tracer Weight Blank Conc. Analyzed (pq/g] (vg/& % Drift
Ca 1354.9 0.0000 170.5 0.0348 Mg 331.6 0.0000 77.1 0.0188 Na 1836.8 0.0000 228.5 0.0279 Cr 14.7 0.0034 8.32 0.0077
!
a
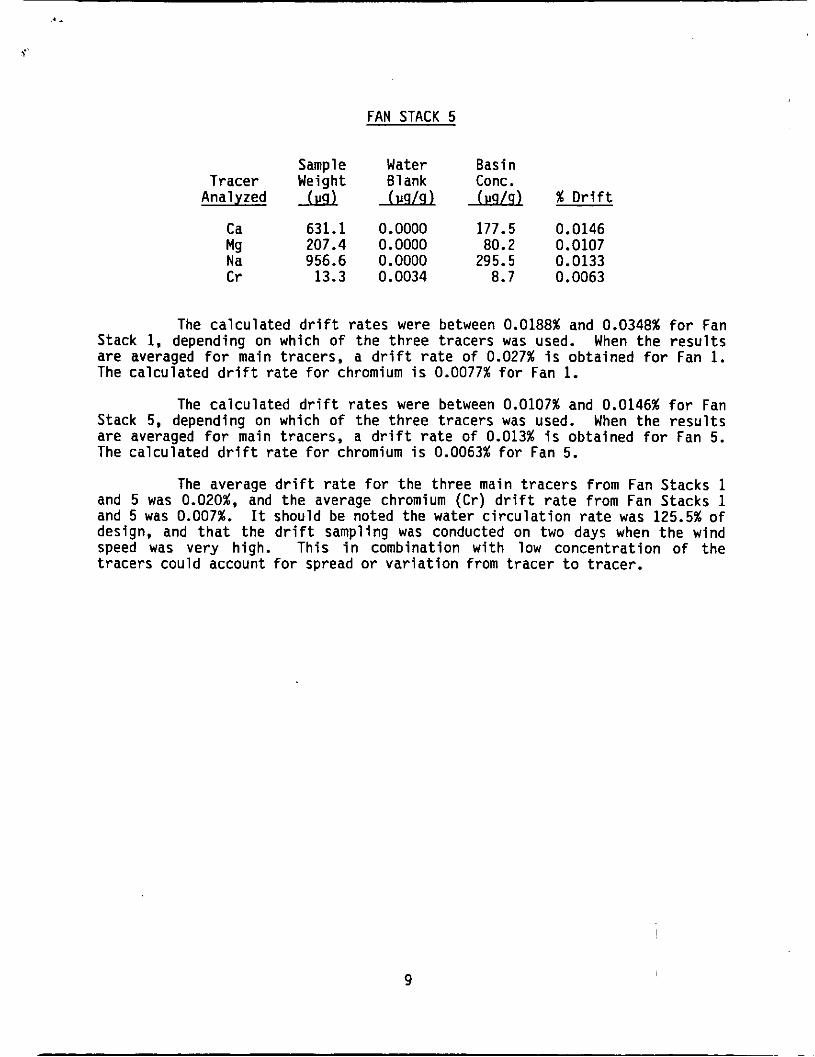
FAN STACK 5
Sample Water Basin Tracer Weight Blank Conc.
Analyzed J& (pg/q l (pq/gl % D r i f t
Ca 631.1 0.0000 177.5 0.0146 Mg 207.4 0.0000 80.2 0.0107 Na 956.6 0.0000 295.5 0.0133 C r 13.3 0.0034 8.7 0.0063
The calculated d r i f t ra tes were between 0.0188% and 0.0348% f o r Fan Stack 1, depending on which o f the three tracers was used. When the resu l t s are averaged f o r main tracers, a d r i f t r a t e o f 0.027% i s obtained f o r Fan 1. The calculated d r i f t r a te f o r chromium i s 0.0077% f o r Fan 1.
The calculated d r i f t ra tes were between 0.0107% and 0.0146% f o r Fan Stack 5, depending on which o f the three tracers was used. When the resu l t s are averaged f o r main tracers, a d r i f t r a t e of 0.013% i s obtained f o r Fan 5. The calculated d r i f t r a te f o r chromium i s 0.0063% f o r Fan 5.
The average d r i f t r a t e f o r the three main t racers from Fan Stacks 1 and 5 was 0.020%, and the average chromium ( C r ) d r i f t r a t e from Fan Stacks 1 and 5 was 0.007%. It should be noted the water c i r c u l a t i o n r a t e was 125.5% o f design, and t h a t the d r i f t sampling was conducted on two days when the wind speed was very high. This i n combination wi th low concentrat ion o f the t racers could account f o r spread o r va r ia t i on from t racer t o t racer.
9

APPENDIX A
SUMMARY O F RESULTS
D R I F T T E S T ON THE
I
CELL, MECHANICAL-DRAFT, COUNTER-FLOW COOLING TOWER
A - 1

.. /
k'
FILE NAME : RUN # : 1 LOCATION :
PROGRAM VER. 10/01/88 v 2 . 1
DATE PROJECT # :
INITIAL METER VOLUME (CUBIC FEET)= FINAL METER VOLUME (CUBIC FEET)= METER FACTOR= FINAL LEAK RATE (CU FT/MIN)=
NET METER VOLUME (CUBIC FEET)= GAS VOLUME (DRY STANDARD CUBIC FEET)=
BAROMETRIC PRESSURE (IN. HG)= STATIC PRESSURE (INCHES H20)=
PERCENT OXYGEN= PERCENT CARBON DIOXIDE= MOISTURE COLLECTED (ML)= PERCENT WATER=
DRY MOLECULAR WEIGHT= WET MOLECULAR WEIGHT=
AVERAGE METER TEMPERATURE (F.)= AVERAGE DELTA H (IN. H20)= AVG.SUM Of SQR DELTA P ( f o r % ISOKINETIC)=
% ISOKINETIC=
AVERAGE STACK TEMPERATURE (F.)= AVG. SUM of SQR DELTA P * COS of ANGLE (IN. H20)= PITOT COEFFICIENT= SAMPLING TIME (MINUTES)= NOZZLE DIAMETER (INCHES)=
STACK AXIS (INCHES)= HUB AXIS (XNCHES)= NET FREE STACK AREA (SQUARE FEET)=
STACK VELOCITY (ACTUAL, FEET/MIN)= FLOW RATE (ACTUAL, CUBIC FT/MIN)= FLOW RATE (STANDARD, WET, CUBIC FT/MIN)= FLOW RATE (STANDARD, DRY, CUBIC FT/MIN)=
DRIFT ANALYSIS ----- TRACER SAMPLE WATER BASIN
ANALYZED WEIGHT BLANK CONC.
---------_________-
(mcg) (mcg/g ) (mcg/g
Ca 1354.9 0.0000 170.50 Cr 14.7 0.0034 8.32 Mg 331.6 0.0000 77.10 Na 1836.8 0.0000 288.50
190.000 632.390 0.9857 0.000
436.064 429.883
29.95 -0.15
21.0 0.0 0.0 5.3
28.84 28.26
1 8 . 8 2.19
0.4433
101.0
93.7 0.4125
0.84 221.8
0.5021
336.0 84.0
517.27
1,438 829,828 791,849 749,685
% DRIFT
0.0348 0.0077' 0.0188 0.0279
A- 2
..
FILE NAME : RUN # : 1 LOCATION : DATE PROJECT # :
PROGRAM VER. 10/01/88 v2.1
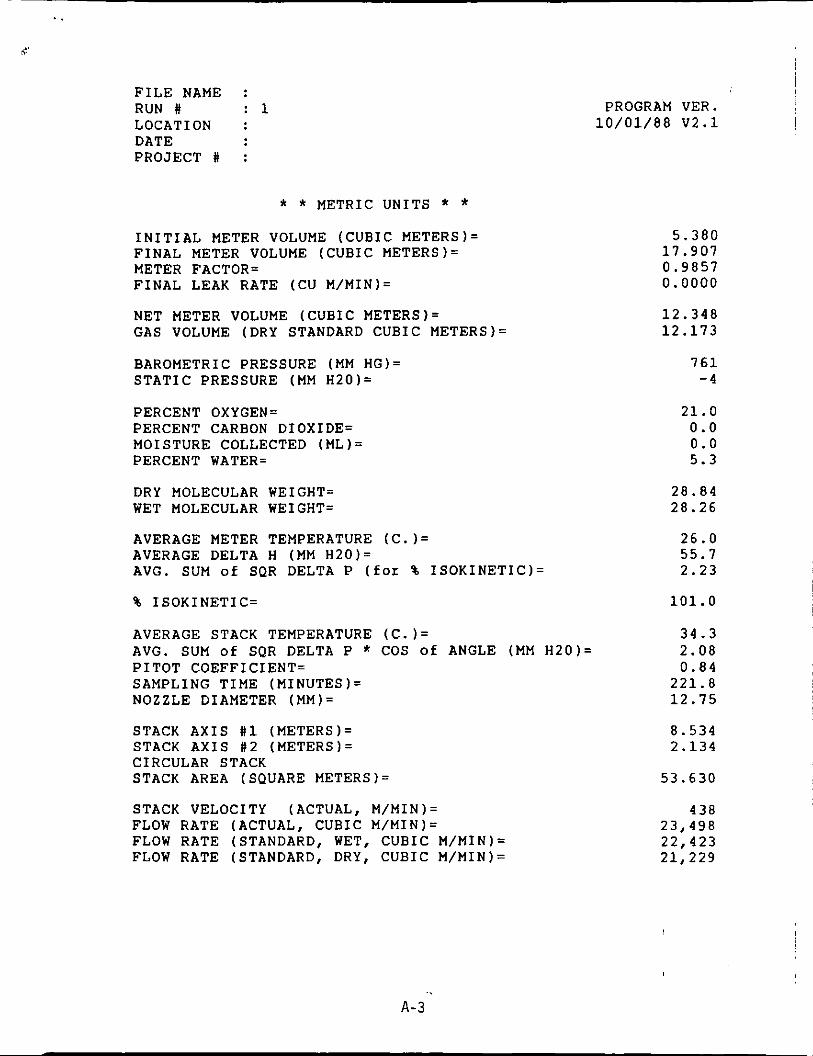
* * METRIC UNITS * * INITIAL METER VOLUME (CUBIC METERS)= FINAL METER VOLUME (CUBIC METERS)= METER FACTOR= FINAL LEAK RATE (CU M/MIN)=
NET METER VOLUME (CUBIC METERS)= GAS VOLUME (DRY STANDARD CUBIC METERS)=
BAROMETRIC PRESSURE (MM HG)= STATIC PRESSURE (MM H20)=
PERCENT OXYGEN= PERCENT CARBON DIOXIDE= MOISTURE COLLECTED (ML)= PERCENT WATER=
DRY MOLECULAR WEIGHT= WET MOLECULAR WEIGHT=
AVERAGE METER TEMPERATURE (C.)= AVERAGE DELTA H (MM H20)= AVG. SUM of SQR DELTA P ( f o r '% ISOKINETIC)=
'% ISOKINETIC=
AVERAGE STACK TEMPERATURE (C.)= AVG. SUM of SQR DELTA P * COS of ANGLE (MM H20)= PITOT COEFFICIENT= SAMPLING TIME (MINUTES)= NOZZLE DIAMETER (MM)=
STACK AXIS #1 (METERS)= STACK AXIS #2 (METERS)= CIRCULAR STACK STACK AREA (SQUARE METERS)=
STACK VELOCITY (ACTUAL, M/MIN)= FLOW RATE (ACTUAL, CUBIC M/MIN)= FLOW RATE (STANDARD, WET, CUBIC M/MIN)= FLOW RATE (STANDARD, DRY, CUBIC M/MIN)=
5.380 17.907 0.9857 0.0000
12.348 12.173
761 -4
21.0 0.0 0.0 5.3
28.84 28.26
26.0 55.7 2.23
101.0
34.3 2.08 0.84 221.8 12.75
8.534 2.134
53.630
438 23,498 22,423 21,229
A-3

C'
FILE NAME : RUN # : 1 LOCATION : DATE PROJECT # :
POINT # DELTA P (IN. H20)
1 0.040 2 0.050 3 0.080 4 0.140 5 0.170 6 0.280 7 0.300 8 0.360 9 0.330 10 0.250
11 0.240 12 0.300 13 0.290 14 0.320 15 0.350 16 0.320 17 0.310 18 0.250 19 0.280 20 0.240
21 0.010 22 0.010 23 0.020 24 0.050 25 0.060 26 0.080 27 0.120 28 0.180 29 0.210 30 0.180
31 0.200 32 0.240 33 0.270 34 0.270 35 0.350 36 0.360 37 0.310 38 0.380 39 0.310 40 0.220
DELTA H (IN. H20)
0.400 0.500 0.820 1.400 1.700 2.800 3.000 3.700 3.400 2.500
2.400 3.000 2.900 3.200 3.500 3.200 3.200 2.500 2.900 2.400
0.100 0.100 0.200 0.500 0.600 0.800 1.200 1.800 2.100 1.800
2.000 2.400 2.700 2.700 3.500 3.600 3.100 3.800 3.100 2.200
PROGRAM VER. 10/01/88 v2.1
STACK T METER T. ANGLE ( F . ) IN(F.1 OUT(F.) (DEG)
91 93 92 95 94 94 94 94 92 93
95 95 94 94 94 95 94 94 94 94
82 85 91 91 94 95 96 95 94 94
95 97 96 96 96 96 96 95 94 94
80 79 80 80 79 79 80 82 82 81
75 77 78 80 81 81 83 84 83 82
79 80 80 80 80 81 81 81 82 82
80 79 80 80 79 79 79 79 79 79
76 76 76 78 79 79 81 82 82 83
80 80 79 79 79 79 79 79 79 79
77 77 77 77 77 77 76 75 77 75 77 75 76 75 75 74 75 74 75 74
45 50 20 20 15 19 5
20 20 35
30 25 25 30 25 25 25 30 30 35
15 25 10 20 10 10 30 10 10 5
20 10 10 10 5 5 5
10 25 5
I A-4

DRIFT DATA REDUCTION
Sample Volume
Rinse Volume
Initial Water Vol.
DESCRIPTION
Water Blank (mcg/g)
Filter Blank (mcg) _----______------- ---- _---_-____------------
DIGESTED
Basin Water ( m c g / g )
Impinger (mcg/g)
Filter (mcg)
TOTAL SAMPLE WT(mcg)
ACIDIFIED
Basin Water (mcg/g)
Impinger (mcg/g)
Filter (mcg)
TOTAL SAMPLE WT(mcg)
AVERAGE
Basin Water ( m c g / g )
Impinger (mcg/g)
Filter (mcg)
TOTAL SAMPLE WT(mcg)
RUN # 1
823
245
250
Ca
171.00
1 .6100
24 .300
170.00
1 .6600
24.300
170.50
1 .6350
24.300
1354.9
A-5
Cr
8.37
.0168
.658
8 .27
.0236
.658
8 . 3 2
.0202
.658
14 .7
77 .40
.3959
8 .780
7 6 . 8 0
.4000
8.780
7 7 . 1 0
.3980
8.780
331.6
!
Na
290.00
2.0700
38.200
287 .00
2 .3500
38.200
288.50
2 .2100
38.200
1836 .8

.. :
FILE NAME : RUN # : 2 LOCATION : DATE PROJECT # :
INITIAL METER VOLUME (CUBIC FEET)= FINAL METER VOLUME (CUBIC FEET)= METER FACTOR= FINAL LEAK RATE (CU FT/MIN)=
NET METER VOLUME (CUBIC FEET)= GAS VOLUME (DRY STANDARD CUBIC FEET)=
BAROMETRIC PRESSURE (IN. HG)= STATIC PRESSURE (INCHES H20)=
PERCENT OXYGEN= PERCENT CARBON DIOXIDE= MOISTURE COLLECTED (ML)= PERCENT WATER=
DRY MOLECULAR WEIGHT= WET MOLECULAR WEIGHT=
AVERAGE METER TEMPERATURE (F.)= AVERAGE DELTA H (IN. H20)= AVG.SUM of SQR DELTA P (for ?. ISOKINETIC)=
% ISOKINETIC=
PROGRAM VER. 10/01/88 v2.1
635.000 1086.130
0.9857 0.000
444.679 437.389
29.85 -0.15
21.0 0.0 0.0 4.8
28.84 28.32
78.1 2.11
0.4316
101.3
AVERAGE STACK TEMPERATURE (F.)= 90.1 AVG. SUM of SQR DELTA P * COS of ANGLE (IN. H20)= 0.4158 PITOT COEFFICIENT= 0.84 SAMPLING TIME (MINUTES)= 229.6 NOZZLE DIAMETER (INCHES)= 0.5021
STACK AXIS ( INCHES) = HUB AXIS (INCHES)= NET FREE STACK AREA (SQUARE FEET)=
STACK VELOCITY (ACTUAL, FEET/MIN)= FLOW RATE (ACTUAL, CUBIC FT/MIN)= FLOW RATE (STANDARD, WET, CUBIC FT/MIN)= FLOW RATE (STANDARD, DRY, CUBIC FT/MIN)=
336.0 84.0
577.27
1,445 834,219 798,609 760,493
_ _ _ _ _ _ _ _ _ _ _ _ _ _ _ _ _ _ _ DRIFT ANALYSIS ----__---------____
TRACER SAMPLE WATER BASIN '% DRIFT ANALYZED WEIGHT BLANK CONC.
( mcq 1 (mcq/q ) (mcq/q)
Ca 631.1 0.0000 177.50 0.0146 Cr 13.3 0.0034 8.70 0.0063 Mg 207.4 0.0000 80.20 0.0107 ' Na 956.6 0.0000 295.50 0.0133
A-6

FILE NAME : RUN # : 2 LOCATION : DATE PROJECT # :
! PROGRAM VER.
10/01/88 v2.1
* * METRIC UNITS * * INITIAL METER VOLUME (CUBIC METERS)= FINAL METER VOLUME (CUBIC METERS)= METER FACTOR= FINAL LEAK RATE (CU M/MIN)=
NET METER VOLUME (CUBIC METERS)= GAS VOLUME (DRY STANDARD CUBIC METERS)=
BAROMETRIC PRESSURE (MM HG)= STATIC PRESSURE (MM H20)=
PERCENT OXYGEN= PERCENT CARBON DI OX1 DE= MOISTURE COLLECTED (ML)= '
PERCENT WATER=
DRY MOLECULAR WEIGHT= WET MOLECULAR WEIGHT=
AVERAGE METER TEMPERATURE (C.)= AVERAGE DELTA H (MM H20)= AVG. SUM of SQR DELTA P (for % ISOKINETIC)=
% ISOKINETIC=
AVERAGE STACK TEMPERATURE (C.)= AVG. SUM of SQR DELTA P * COS of ANGLE (MM H20)= PITOT COEFFICIENT= SAMPLING TIME (MINUTES)= NOZZLE DIAMETER (MM)=
STACK AXIS #1 (METERS)= STACK AXIS #2 (METERS)= CIRCULAR STACK STACK AREA (SQUARE METERS)=
STACK VELOCITY (ACTUAL, M/MIN)= FLOW RATE (ACTUAL, CUBIC M/MIN)= FLOW RATE (STANDARD, WET, CUBIC M/MIN)= FLOW RATE (STANDARD, DRY, CUBIC M/MIN)=
17.981 30.755 0.9857 0.0000
12.592 12.385
758 -4
21.0 0.0 0.0 4.8
28.84 28.32
25.6 53.6 2.18
101.3
32.3 2.10 0.84
229.6 12.75
8.534 2.134
53.630
440 23,622 22,614 21,535
A-7

F I L E NAME : i
R U N # : 2 LOCATION : DATE : \
PROJECT # : I
POINT k!
1 2 3 4 5 6 7 8 9 10
11 12 13 14 15 16 17 18 19 20
21 22 23 24 25 26 27 28 29 30
31 32 33 34 35 36 37 38 39 40
DELTA P DELTA H ( I N . H20) ( I N . H20)
0.130 0.090 0.130 0.210 0.110 0.240 0.280 0.320 0.250 0.200
0.080 0.260 0.250 0.210 0.290 0.260 0.330 0.310 0.280 0.210
0.010 0.010 0.030 0.020 0.050 0.100 0.110 0.250 0.160 0.170
0.180 0.210 0.290 0.360 0.340 0.350 0.340 0.330 0.290 0.170
1.300 0.900 1.300 2.200 1.100 2.400 2.900 3.300 2.600 2.100
0.800 2.700 2.600 2.200 3.000 2.700 3.400 3.200 2.900 2.200
0.100 0.100 0.300 0.200 0.500 1.000 1.100 2.600 1.600 1.700
1.800 2.200 3.000 3.700 3.500 3.600 3.500 3.400 3.000 1.700
I \
PROGRAM VER. 10/01/88 v2.1
STACK T METER T . ANGLE ( F . )
81 81 80 80 81 80 80 80 80 80
84 96 95 94 94 94 92 92 91 92
86 91 90 91 94 90 94 94 94 95
96 97 97 96 95 96 96 94 94 95
I N ( F . ) O U T ( F . 1 (DEG)
70 70 70 71 74 73 75 76 77 77
76 79 81 82 81 81 81 81 82 81
79 80 82 82 83 83 84 84 83 81
78 78 79 80 81 81 81 81 78 77
70 70 70 70 71 71 72 73 74 74
76 80 81 81 81 81 81 81 81 80
79 80 80 81 81 81 81 81 80 79
77 78 78 78 78 78 79 78 76 75
35 40 15 15 0
10 5
10 20 15
0 5 5 5 5 5
10 10 10 10
10 0
30 25 20 10 10 5
15 25
30 20 15 10 15 15 15 15 15 25
\!
A-8

DRIFT DATA REDUCTION
Sample Volume
Rinse Volume
Initial Water Vol.
DESCRIPTION ~~~ ~ ~ ~ ~ ~~
Water Blank (mcg/g)
Filter Blank (mcg)
DIGESTED
Basin Water (mcg/g)
Impinger (mcg/g)
Filter (mcg)
ACIDIFIED
Basin Water (mcg/g)
Impinger (mcg/g)
Filter (mcg)
AVERAGE
Basin Water (mcg/g)
Impinger (mcg/g)
Filter (mcg)
TOTAL SAMPLE WT(mcg)
RUN # 2
731
200
250
Ca
0.0000
2.8100 - - - - - - - - - . - - - - - - - - - .
179.00
.8440
15.600
629.8
. - - - - - - - - - . - - - - - - - - -
176.00
.8690
15.600
632.4
- - - - - - - - - - - - - - - - - -
177.50
.8565
15.600
631.1
Cr
A-9
5'
I
APPENDIX B
F I E L D DATA SHEETS
D R I F T TEST ON THE
7-CELL, MECHANICAL-DRAFT, COUNTER-FLOW COOLING TOWER
B - I

.. .-
MIDWEST RESEARCH INSTITUTE ~
6
I - _ . . DATA S H E E T X "
FILE NO,:
MEAS. OF:
- - - - _ _ _ _ _ _ _ _ _ _ _ _ _ - INSTRUMENT IDENTIFICATION DATE CALIBR.
J$ I I ' I I I I I
I I I I I I !
I I I I I I I S
TEST b v E R A C E I
8-2
-. !EST DATE:
M E A S OF UNIT 1
_ - _ _ _ _ _ - - - - - - INSTRUMENT IOENTIFICATION I
I I ~ TEST AVERAGE:
M E A S . O F : U N I T
- - - _ - - @ L W ---- I N S T R U M E N T IDENTIFICATION
,

I !
I i
I I I
I I
! i
t
- MIDWEST RESEARCH INSTITUTE ! FILE NO.: DATA SHEET "E"
WATER FLOW MEASUREMENT TEST DATE:
PIPE I.D.
,013
,038
0
-812 ,858
12 .e94 ,774
1 0 ,874
,833
881
,987
LOCATION
DECIMAL INCHES
:ALCULATED CORRECTED.
=i-
+ 'F
I
STA. DESC. TIME STA. DESC. TIME
&?-p 2 6 - R i m " /
d. in. 6 d. in a. in. \K a. in. t d
.. . .. .
. . .. . .. .
0ASlS AIR1WATER MANOMETER
.CALCULATED VALUE DECREASED BY DISTANCE FROM END OF PITOT TUBE T O CENTER LINE OF IMPACT HOLE.
.-
8-3

- MIDWEST RESEARCH INSTITUTE FILE NO: DATA SHEET "E"
WATER FLOW MEASUREMENT PITOT TUBE
PITOT TUBE M A K E . MODEL SERIAL N O . PIPE SIZE. I N C H E S
1.D = NRZ- s;/wp/!8g l+fk?- @ Y Z N O M = /r DATE CALIBR. T U B E COEFFICIENT AREA =.00545 102. SO FT
A =
TEST DATE: . .
DECIMAL I N C H E S
RDG
BASIS: AIRIWATER M A N O M E T E R
i
.CALCULATED VALUE DECWEASED BY DISTANCE FROM E N D OF PITOT TUBE T O CENTER LINE OF IMPACT H O L E i I
__
B-4

. .
- MIDWEST RESEARCH INSTITUTE: I: . . 8 ,
. . , . . .... . .
FILE NO.: DATA SHEET "E" WATER FLOW MEASUREMENT
TEST DATE: !
.. PITOTTUBE PITOT TUBE MAKE, M O D E L SERIAL N O . PIPE SIZE. I N C H E S
NRZ - S,& h-fkz- fg1/2 N O M = /f I.D. = DATE CALIBR. T U B E COEFFICIENT AREX =.00545 102. SO FT
!
DECIMAL I N C H E S
RDG
0. gom =\'; (!040 I C I A) =6 ( BASIS: A1R:WATER M A N O M E T E R
~
' CALCULATED VALUE D E C R E A S E D BY DISTANCE FROM E N D O F PITOT T U B E TO CENTER LINE O F IMPACT H O L E . -
, I
. . 6-5
:" ._. .
.. . .
PITOT TUBE MAKE. MODEL SERIAL N O . PIPE SIZE. I N C H E S
r-irL?T - s l m P / r * l-f& - Fry2 N O M = /B 1.0. = DATE CALIWR. T U B E COEFFICIENT AREA =.00545 102, S O FT
A =
I
i I
i 1
,
I
!
DECIMAL I N C H E S
. . ' CALCULATED VALUE D E C R E A S E D B V DISTANCE F R O M E N D O F PITOT T U B E TO C E N T E R ' L I N E O F IMPACT H O L E .
>;I,L - / J Y ? 6 /#A'-- I / 2 3 2
%jO/

I II
8-7

n
¶ i.
. . i:
\
8-8

. . _.
N
6-9

. ,,
i
Final Volume (includes rinses)
Rinse Volume
Initial Volume
Net Volume
MIDWEST RESEARCH INSTITUTE
Drift Sample Recovery
I
1st Impinger 2nd Impinger Probe Rinse
430
/5 o
2 3-5
3rd Impinger
30
!
B-10 I
m \g
i i
3 B
i a i
3 I
i i
il rn ' .. .
'r i
L Y
C
e
8-11

8-12
8-13

MIDWEST RESEARCH INSTITUTE
Drift Sample Recovery
1st Impinger 2nd Impinger 3rd Impinger Probe Rinse
Final Volume 9.9
Rinse Volume / 70
Initial Volume 2 Net Volume I 3 0
(includes rinses) 6 0
/O
No. of Bottles DeSCriDtiOn
1 Basin Composite ( No. of Comps. 3 ) f Probe Rinse h 1st Impinger ( Vol.= q 5 0 m l
I 2nd & 3rd Impinger ( Sample Vol. = J Y D m l
I Filter
/ Water Blank Lac s& &.- L L 7 I S /
J’ / Filter Blank 6 W ~-4e&&”’ c-
B-14

APPENDIX C
LABORATORY A N A L Y S I S
D R I F T T E S T ON THE
7-CELL, MECHANICAL-DRAFT. COUNTER-FLOW COOLING TOWER
c-1

L . . . . . .
. . . . <. .
. . , : . . . . . . . . . . .
. . ...
., . .
. . . . . . . . . . . :... . . .. . . . . . . .;...... .... . - . . :, ,,:.:: y..:... ;~.:, :..:,: : ..: . . . . . . . . . . . . .
. .
INTEROFFICE COMMUNICATIOh
MIDWEST RESEARCH INSTITUTE
To : T. Weast
From: E. McClendon G;*c
S u b j e c t : !CAP A n a l y s i s R e s u l t s f o r P r o j e c t I
E n c l o s e d a,re t h e r e s u l t s o f t h e ICAF' a n a l y s i s p e r f o r m e d f o r , d r i f t s a m p l e s .
I . I n t r o d u c t i o n R e q u e c t For_ e n a l v s i s
, -. T h e s e s a m p l e c were s u b m i t t e d f n r P r o j e c t I n e a n a l y t e s o f i n t e r e s t were Ca, C r . Mg a n d Pia. G n a l y s e c w e r e o e r f o r m e d o n t h e J a r r e l l - A s h Model 115% ICP-AES a n d t h e P e r k i n - E l m e r Model 5i100 Zeeman AAS.
11. S u b m i s s i o n ~f Sa.mp1es for A n a l v s i s 2nd Sample P r e o a . r a t i o n
E i g h t s a m p l e s ( I m p i n g e r c o n t e n t s f e r r u n 1 i n t w o c o n t a i n e r s , a f i l t e r fer r u n 1 , b a s i n w a t e r f r o m r u n 1 , i m p i n g e r c o n t e n t s f o r r u n 2 i n t w o c o n t a i n e r s , a f i l t e r f o r r u n 2 , b a s i n w a t e r f r o m r u n 2 , a blah!; f i l t e r a n d a. c o n a t i n e r w i t h " b l a n k " water; were r e c e i v e d i n t h e A t o m i c S p e c t r o s c o p y F a c i l i t y f r o m D. Cobb. T h e s a m p l e s w e r e p r e p a r e d a c c o r d i n g t o t h e atomic a b s n r p t i n n s e c t i o n o f EF'A 34-845 Method ;C!5r?. A l i q u o t s o f t h e c o m b i n e d i m p i n g e r c o n t e n t s , b a s i n water a n d " b l a n k " water were u s e d , w h i l e t h e f i l t e r s were p l a c e d i n bea . l ; e r s a.nd d i g e s t e d a c c a r d i n g t o t h e p r o c e d u r e .
T h e i m p i n g e r c o n t e n t s a n d b a s i n wa te r s w e r e a l s o a n a l y z e d w i t h o u t d i g e s t i o n b y d i l u t i n g t h e m w i t h c o n c e n t r a t e d H N @ 3 t o m a k e t h e m 10X (v /v! a c i d a n d a n a l y z i n g cmr d i l u t i n g t h e m w i t h 10 % "0.3 i f t h e d i l u t i o n was s u f f i c i e n t t o i n s u r e a n a c i d c o n t e n t o f i l l%.
1 1 1 . S t a n d a r d f r e 9 s r a t i o n
S t a n d a r d s f o r t h i s ? n a i y s i s were p r e p a r e d at a p p r o p r i a t e c o n c e n t r a t i o n s f r o m Sper.: I n d u s t r i e s M u l t i e l e m e n t Cus tom Fla .sma S t a n d a r d A n a l y t i c a l R e f e r e n c e Materi?ls. T h e s t a n d a , r o s were p r e p a r e d i n 10% ( v / v ) n i t r i c a . c i d iBs . l : : e r I n s t r a - a n a . l y z e d Lot. 8 0 4 0 5 B i a n d t h e u e p e r i n s t r u m e n t a l c a l i b r a t i o n l i m i t s f n r ICP were 1 9 mcg/mL f o r Ca a.nd C r , 5 mcg/mL + o r Mg a n d 150 mcg/mL foi- Ns.. T h e u p p e r c a l i b r a . t i o n l i m i t f o r t h e GFAA a . n a 1 y s i s f o r C r w a E 25 m c r / i . ;I c a l i b r a . t i o r . blami: c o n s i s r i n g e+ t h e s tork : . 1 C X n i t r i c a c i d wa: sed i c b e t h s n a l y s e c - .
A c i : i s t r~ . !men ta? checi:: s t a n d a . r d '1'a.s p r e p a r e 4 i t a 1 r,cgimL l e v e l T ~ l r ICP a n a l v s i s and at a. 1 0 0 mcgiL l r - v r i f o r G F A A ana . l . , s i s f r om c u z t n m p r e c a . r e d m u l t i e l e m e n t c - tz !nda-es f rom ir!urg?.nic: V e n t u r e s . i n c . .
c- 2
I
. . . . ,,. : . . . . . . . . . . . . . . . . . . . . . . . . . . . . . I. 9
. . .. . .
. . . . . . .. . . . . . .
P a g e 7 ..
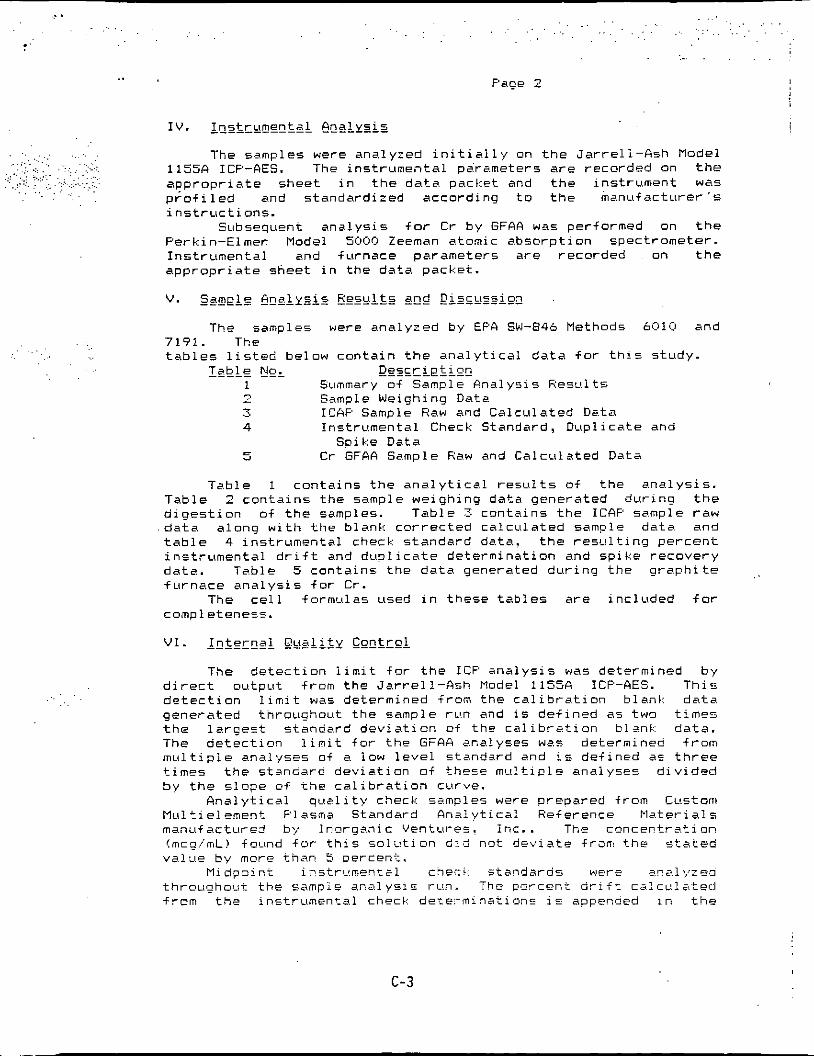
I V. I n _ s t r u m e n t a.1 &&ysic,
. . . . . . . . T h e s a m p l e s were a n a l y z e d i n i t i d l y on t h e J a r r e l i - A s h Model ... .:: . . . . . . . . . . 1 1 5 5 A ICP-AES. T h e i n s t r u m e n t a l p a r a n e t e r s are r e c o r d e d o n t h e
.. . . . . . . . . . . . . . . .J :.". .... :.;j ..... ~ a p p r o p r i a t e s h e e t i n t h e d a t a p a c k e t a n d t h e i n s t r u m e n t w a s
. . . . . . . . . . . . . . . . . ;: . . . . . . . . . . . . . . . . . . . . . . .
. . . . . . . . . . . . . . p k o f i l e d a n d s t a n d a r d i z e d a c c o r d i n g t o t h e m a n u f a c t u r e r ' s i n s t r u c t i o n s .
S u b s e q u e n t a n a l y s i s f o r C r b y GFAA was p e r f o r m e d o n t h e P e r k i n - E l m e r Model 5000 Zeeman atomic a b s o r p t i o n spectrometer . 1 n s t r o m e n t a . l a n d f u r n a c e p a r a m e t e r s a r e r e c o r d e d o n t h e a p p r o p r i a . t e s h e e t i n t h e d a t a p a c k e t .
V. S_a_mei_e A n a . l v s i s R e s u l t s _agd D i s c u s s i o n
T h e s a m p l e s were a n a l y z e d b y EFA SW-846 M e t h o d s bC1li:I a n d 7191. T h e t a b l e s l i s t e d b e l o w c o n t a i n t h e a n a l y t i c a l d a t a f o r t h i s s t u d y . . . . .
D e s c r i E t i o n 1 Summary o f S a m p l e A n a l y s i s R e s u l t s - 7 S a m p l e W e i g h i n g Date
4 I n s t r u m e n t a l Check S t a n d a r d , Diipl i c a t e a n d
I&k N&
I C A F S a m p l e R a w a n d C a l c u l a t e d D c t a - .>
5 S p i k e Data
C r GFAA S a m p l e R a w a n d C a l c u l a t e d Data.
T a b l e 1 c o n t a i n s t h e a n a 1 y t i r a . l r e s u l t s o f t h e a m a l y s i s . T a b l e 2 c o n t a i n s t h e s a m p l e w e i g h i n g d a t a g e n e r a t e d d u r i n g t h e d i g e s t i o n o f t h e s a m p l e s . T a b l e 3 c o n t a i n s t h e I C A F s a m p l e r a w
. d a t a a l o n g w i t h t h e blamlr c o r r e c t e d c a l c u l a t e d s a m p l e d a t a a n d t a b l e 4 i n s t r u m e n t a l c h e c k s t a n d a r d d a t a , t h e r e s , - i l t i n g p e r c e n t i n s t r u m e n t a l d r i f t a n d d u p l i c a t e d e t e r m i n a t i o n a n d s p i l - e r e c o v e r y d a t a . T a . b l e 5 c o n t a i n s t h e d a t a g e n e r a t e d d u r i n g t h e g r a p h i t e f u r n a c e a n a l y s i s f o r C r .
T h e c e l l f o r m u l a s u s e d i n t hese t a b l e s are i n c l u d e d f o r c o m p l e t e n e s r .
V I . 1 n t e r n a . l Qg~liiy C o n t r o l
T h e d e t e c t i o n l i m i t f o r t h e 18CF a n a l y s i s w a s d e t e r m i n e d b y d i r e c t o u t p u t f r o m t h e J a r r e l i - A s h Model 1 1 5 5 A ICF-AES. T h i s d e t e c t i o n l i m i t w a s d e t e r m i n e d f r o m t h e c a l i b r a t i o n b l a n k d a t a g e n e r a t e d t h r o u g h o u t t h e s a m p l e r u n a n d is d e f i n e d as t w o t i m e s t h e l a r g e c t s t a n d a . r d d e v i a t i o n o f t h e c a l i b r a . t i o n blani : : d a t a . T h e d e t e c t i o n l i m i t for t h e GFAA a . n a l y s e s wa,s d e t e r m i n e d f rom m u l t i p l e a n a l y s e s of a l o w l e v e l s t r n d a r d a.nd i s d e f i n e d a= t h r e e t i m e s t h e s t s . n d a r r i d e v i a t i o n of t h e s e m u l t i p l e a n a l y s e s d i v i d e d b y t h e s l o p e of t h e c a l i b r a t i o n c L i . r v e .
A n a l y t i c a l q u c l i t y c h e c k s a m p l e s w e r e p r e p a r e d f r o m C.ustoni M u l ' i e l e m e n t P l a s m a S t a n d a r d A n s l y t i c a l R e f e r e n c e Materials ma.ni i fa .c tured b y I n o r g a n i c Ven tCi re s . i n c . . The c o n c e r t r a t i o n (mcg/mL! f o u n d f o r t h i s s o l u t i o n d:,? n o t d e v i a t e f r a m t h e s t a t e d valLie b y more t h a n 5 o e r c e n t .
M i d p o i n t i r ' s t r u m e n t s . 1 cherC. s t a n d a r d s were a . n a l u z e 6 t h r o u g h o u t t h e c a m p i e a n a l y s i s irun. T h e p e r c e n t d r i f t ca1rL:l~:tei:I f r o m t h e i n s t r u m e n t a l c h e c l : d e r e r m i n a t i o n c i s a p p e n c e d i n t h e
c-3

.. . . . . . . . . . . .
. . ' . . . ':
. . . ~ . . . .:. . . . . . . . .
. . ~ . ,
c . . . . .
. .
. .
' P a g e 3
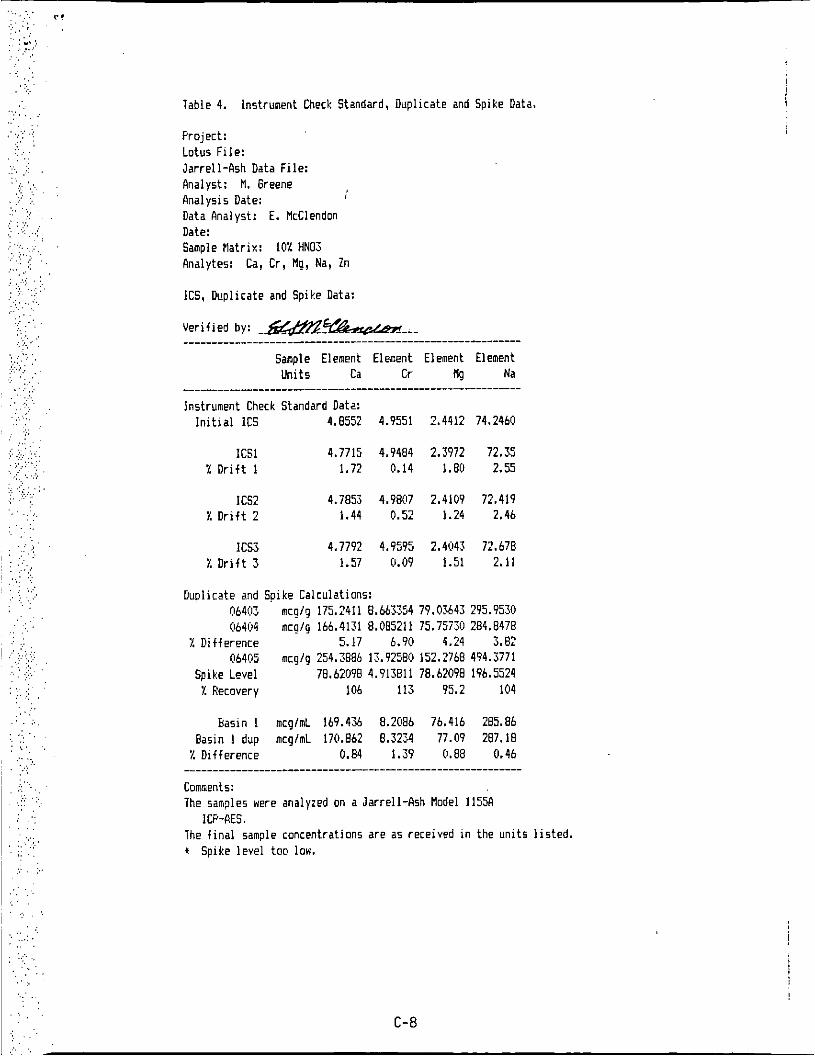
I n s t r u m e n t a l Checl:: S t a n d a r d , D ~ p l i c a t e a n d S p i k e Data. T a b l e ( T a b l e 4). I n s t r u m e n t d r i f t f o r a.11 a . n a l y s e s w a s less t h a n 7 p e r c e n t , i n d i c a t i n g t h a t t h e i n s t r u m e n t s were f a i r l y s t a b l e t h r o u g h o u t t h e e n t i r e sample a n a l y s e s .
No i n t e r f e r e n c e c h e c k s t a n d a r d w a s p r e p a r e d as t h e a n a . l y s i s wi.s f o r w h a t c o u l d b e c o n s i d e r e d major c o m p o n e n t s . T h e d u p l i c a t e d e t e r m i n a t i o n s s h o w e d p e r c e n t d i f f e r e n c e s o f less t h a n 7 p e r c e n t . S p i k e r e c o v e r i e s r a n g e d f r o m 95.2 t o 1 1 3 p e r c e n t .
V I I . _ A d d i t i o n a l . L~fgrmsfj.ea
T h e f o l l o w i n g raw d a t a a c c o m p a n i e s t h i s r e p o r t . T h i s i n f o r m a t i o n is c o d e d b y I a n d a l s o c o n t a i n s a p a . r t n u m b e r i d e n t i f i e r .
F ' x f f4u&%c Eescriet Lne i l ICF-AES Da.ta R e p o r t i n g S h e e t 2 C o n t r o l T a b l e E d i t o r O u t p u t
t s DEC Command F i l e s U s e d , 4 ICAF' S a m p l e R a w Data \ 5 Atomic A b s o r p t i o n Da.ta. R e p o r t i n g S h e e t
Atomic A b s o r p t i o n W o r k s h e e t Data S t a t i o n 10 O u t p u t S a m p l e W e i g h i n g S h e e t - I n i t i a l W e i g h t s S a m p l e W e i g h i n g S h e e t - F i n a l W e i g h t s P h o t o c o p y o f MRI L a b o r a . t o r y G e n e r a t e d
' !_b I
1," 1 Q
S a m p l e I n v e n t o r y i 11 F h o t o c o p i e s o f Notebool:
W i t h t h e e x c e p t i o n of p a r t n u m b e r ! l l . t h e p h o t o c o p i e s of the n o t e b o o l : : ., t h i s f i l e c o n t a i n s t h e o n l y r e c o r d o f t h e a n a l y s i s . T h i s f i l e s h o u l d t h e r e f o r e be a r c h i v e d as r e q u i r e d b y t h e p r o j e c t o r as r e q u i r e d b y MRI p o l i c y .
T h i s d a t s h a s u n d e r g o n e o n e l e v e l of s e n i o r r e v i e w w i t h i n t h e O n a l y t i c a l C h e m i s t r y S e c t i o n . T h e MFi I O n a . l i t y A s s u r a n c e U n i t h a s n o t r e v i e w e d t h i s d a t a .
J o h n $ t z n l e y . Head A n a l y t i c a l C h e m i s t r y S e c t i o n
c-4

. .. . ,. . : . ' . . . ,.,
'. . . :. ,
., . . . , .. . ,;..
. . .. . . . . . . . . ,:. :
.. . .. , .
. , . . . . . .. . . . .. A i ..:
. , , '.:. . . .. .. , .. . . . . .. .: . . . . ;
. I . . , . . .;.. ,
: . . ., . . j . . . .. .
. .
Table I .
Project: Lotus File: Jarrell-Ash Data File: Analyst: M. Greene Analysis Date: Data Analyst: E. HcClendon Date: Sample Matrix: 10% NO3 Analytes: Ca, Cr, fig! Na, l n
Summary of Sample Analysis Results:
Summary of Sample Analysis Results for Project
Verified by: -e-% _ _ _ _ _ _ Project Sample ASF Sample Sample Element Element Element Element
Name Rar Codelst Units Ca cr HY Na ...................................................................... Digested Samples
Mater Plan1 06402 mcglg (0.0163 0.00356 (0.00093 (0.0425 Filter Rlank 06408 mcg 2.81 0.438 o . m a i 2
Basin H20 #1 06403/06404 mcglg 171 8.37 77.4 290 Impingers # l 06406 ncg/g 1.61 0.0169 0.396 2.07
Fil ter R 1 Ob407 mcg 24.3 0.517 8.78 38.2
Basin H2O #2 Ob409 mcg/g 179 8.78 80.9 298 Impingers #2 (16410 mcg/g 0.844 0.0183 (1.283 1.17
Fi l te r #2 06411 mcg 15.6 0.513 1.68 (2.12
Acidified Samples
Pasin H20 81 mcG1aL 170 8.27 76.8 287 lmpingers #1 mcglmL 1.66 0.0236 0.400 2.35
Basin H20 #2 mcg/mL 176 8.61 79.5 293 Impingers #2 mcg/mL 0.869 0.0230 0.283 1.45
Coaments: The samples were analyzed on a Jarrell-Ash Model 115%
The final sample concentrations are as received in the units l i s ted . ICP-AES.
. . .:
. . . : . . .. . . .. :. ,
. : ,::; ..:
. : . . . . . ... .. .. .. . , ~ . .. , . . . ,
: ?. . ., , . ... .: ... ... ,',
. : . .
. . . , .
. . . ,
... , . '.j . .:. ;. .; . . :>
c-5
. . :. . . ,. . . ,.. ~. . . . .
. . ... . '. . . .
.. . ' . .. . . . . . .;. , . . . . . . . . . .
. , : . . .
. . :. . . . . . . .. . ,
. .
. . . ' . .
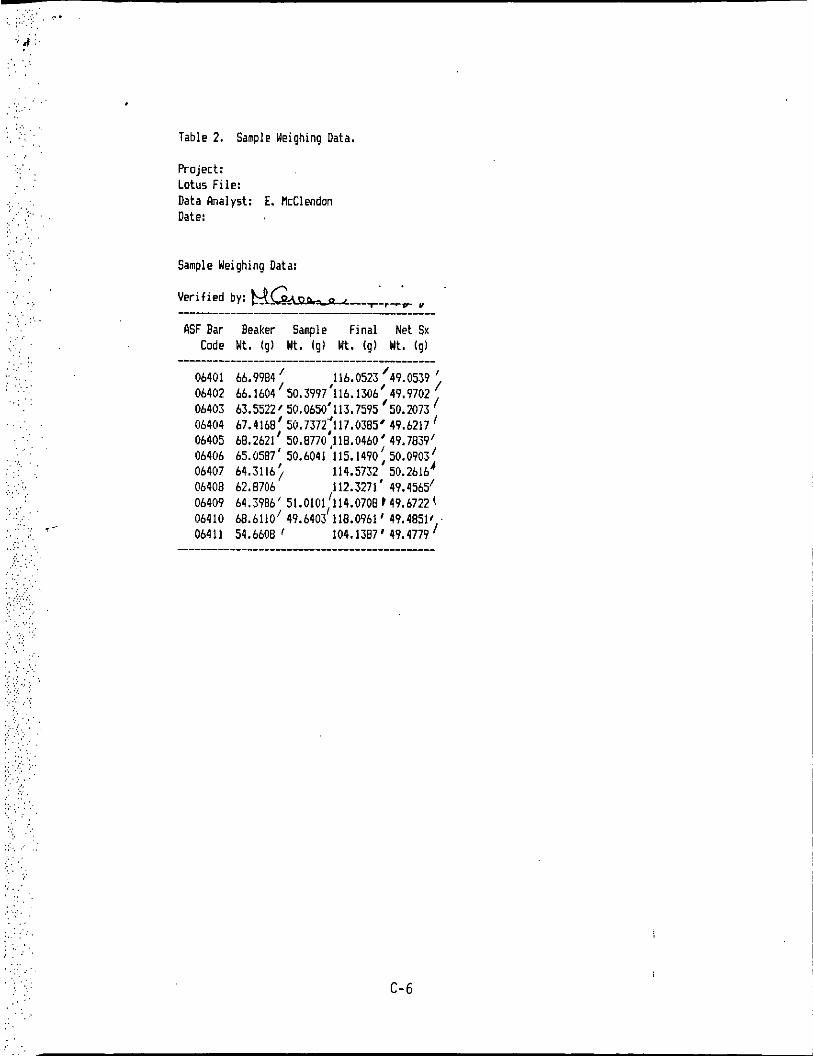
Table 2. Sample Weighing Data.
Project: Lotus File: Data Analyst: E. HcClendon Date:
Sample Weighing Data: . I
Verified by: H L - - l - - P - v Y --I_________________________
RSF Bar Beaker Sample Final Net Sx Code Wt. 19) Wt. 19) Wt. 19) Wt. 191
06401 66.9984 116.0523'49.0539 06402 66. I664 50.3997'116.l306/149.9702 06403 63.5522) 50.0650'113.7595 50.2073 06404 67.4168~ 50.7372:117.0385' 49.6217 ' 06405 68.2621 50.8770 ,ll8.0460: 49.7839' 06406 65.0587' 50.6041 115.1490, 50.0905' 06407 64.3116; 114.5732 50.2616' Ob408 62.8706 112.3271' 49.4565' 06409 64.3906' 51.0101,!114.0708 149.67224 06410 68.6110' 49.6403 118.0961' 49.4851' 06411 54.6608 ' 104.1387' 49.4779'
C-6
. . . . , . ;..:..: P.
: .:.. :.. .. . .. ... , . . :'
. . ... ., . . . . : . . ::. '.+ . . , . , . . . , . , . . . . . ,, I :,,
. . . . . . . ... . . .. ... . .. . .
. . . . . ,
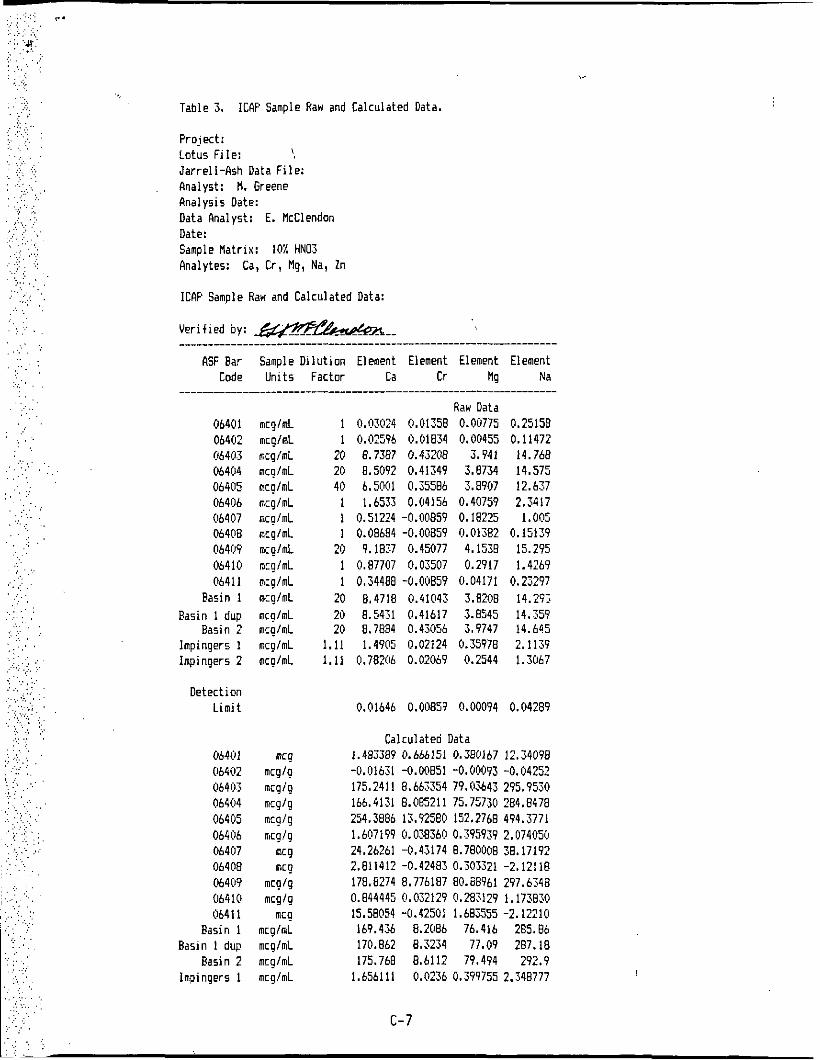
Table 3.
Project: Lotus File: '< Jarrell-Ash Data File: Analyst: ti. Greene Analysis Date: Data Analyst: E. kclendon
ICAF' Sample Haw and Calculated Data.
Date: Sample Matrix: 10% "03 Rnalytes: Ca, Cr, Mg, Na, I n
l C W Sample Raw and Calculated Data:
Verified by: ..................................................................
RSF Bar Sample Dilution Element Element Element Element Code Units Factor La Cr Na
' . .;
06401 mcq1nL 064(12 mcg1mL 06403 mig/mL 06404 mcglmL 06405 mcglmL 06406 mcqlmL 06407 mcgImL 06408 ncglmL 06409 mcglmL 06410 mcglmL 06411 mcglmL
Pasin 1 mcglmL Basin 1 dup mcglmL
Basin 2 rncglmL Impinqers 1 mcglmL Impingers 2 mcglmL
Detection Limit
06401 ncq 06402 mcglg 06403 mcg lg 064@4 mcglg Ob405 mcqlg 064i6 mcg/g 06407 mcg 06408 mcg 06409 mcglg 06410 mcglg 06411 mcg
Fasin 1 mcglmL Bas in I dup mcglmL
Basin 2 mcglmL lmpingers 1 mcg/mL
1 1
20 20 40
1 1 1
20 1 1
20 20 20
1.11 1.11
Raw Data 0.1!3@24 0.01358 0.00775 (1.02596 0.01834 0.00455 8.7387 0.43208 3.941 8,5092 0.41349 3.8734 6.5?@1 0.35586 3.8907 1.6535 0.04156 0.40759
0.51224 -0.00859 0.18225 0.08684 -0.00859 !1.01382 9.1837 0.45077 4.1538
0.87707 0.03507 0.2917 0.34488 -0.00859 0.04171
8.4718 0.41043 3.8208 8.541.1 (1.41617 3.8545
1.49@5 0.02124 0.35978 0.78206 0.02069 0.2544
8.7884 0.43056 3.9747
0.25159 0.11472 14.768 14.575 12.637 2.3417 1.005
0.15139 15.295 1.4269
0.23297 14.293 14.359 14.645 2.1139 1.3067
0.01646 0.00851 0.00094 0,04289
Calculated Data 1.483389 0.666151 0.380167 12.34098 -0.01631 -0.00851 -0.00093 -0,04252
166.4131 8.085211 75.75730 284.8478 254.3886 13.92580 152.2768 494.3771 1.607199 0.038360 0.395939 2.074(155 24.26263 -0.43174 8.780008 38.17192 2.811432 -0.42485 0.303321 -2.12118
0.844445 (1.032129 0.283129 1.173830 15.58054 -0.42501 1.683555 -2.12210 169.436 8.2086 76.416 285.86 170.862 8.3234 77.09 287.18 175.768 8.6112 79.494 292.9
1.656111 0.0236 0.399755 2.348777
175.2411 a.665354 79.03643 29s.9;30
i 7 ~ . ~ 2 7 4 8.776187 80.~a96i 2v7.6m
!
c-7
. .. ... . . . . . . .. . . . . . ,. . , , 1 ': ' -' , . . . , ..:. >' , ..; .:.
, :.: i .. . . . . . .. . . . . .
. . . . . , , . .
, . .. I ,:>:.::.;:
..,j ::;. . . . ', , ..:. ' .. : . . . ,
. , , , . . . ..
. .
. . . . . . . . .
Table 4.
Project : Lotus F i l e : Jarre l l -Ash Data F i l e : Analyst: M. Greene Analysis Date: Data Analyst: E. McClendon Date: Sample t l a t r i x : 10% "03 Rnalytes: Ca, Cr, Mg, Na, 2n
ICs, Dupl icate and Spike Data:
Ve r i f i ed by: ---AT-.
Instrument Check Standard, Di lp l icate and Spike Data.
Sample Element Element Element Element U n i t s Ca C r ng Na
~~ ~
Instrument Check Standard Data: I n i t i a l ICs 4.8552 4.9551 2.4412 74.2460
IC51 4.7715 4.9484 2.3972 72.35 7, Drift 1 1.72 0.14 1.80 2.55
IC52 4.7853 4.98[17 2.4109 72.419 1 Drift 2 1.44 0.52 1.24 2.46
ICs3 4.7792 4.9595 2.4043 72.678 % D r i f t 3 1.57 0.09 1.51 2.11
Dupl icate and Spike Calculat ions: 06403 064l:14
06405 Spike Level
mcplp 175.2411 8.663354 79.03643 295.9530 mcqlg 166.4131 8.085211 75.75730 284.8478
% D i f f e rence 5.17 6.90 4.24 3.82 mcglg 254.3886 13.92580 152.2768 494.3771
78,62098 4.913811 78.62098 196.5524 Y. Recovery 106 113 95.2 104
Basin I rncglmL 169.436 8.2086 76.416 285.86 Basin I dup mcglmL 170.862 8.3234 77.09 287.18
% Di f ference 0.84 1.39 0.88 0.46 ........................................................... Comments: The sanples were a n a l y x d on a J a r r e l l d s h Model 11554
The f i n a l sample concentrat ions a re as received i n the u n i t s l i s t e d . I Spike level too law.
ICP-AES.
i
!

.I ........ , .:. . : : . . . .. .. . .. : . . . . .
, . . .
. . . . . . . . . . .... .. . . . . . , . . . . . .
Table 5.
Project: Latus F i l e : Jarrell-R5h Data F i l e : Analyst: M. Greene Analysis Date: Data Analyst: E. flcClendon Date: t Sample natr ia: 10% "03 Analyte: Cr
Sample flnalysis Data:
Instrumental Detection L imi t :
Cr GFAA Analysis Raw and Calculated Data
(uglL, see below) . . . . . . . , . . . , . . . : . . . . . . . , . . . . .
:'. , . . .. , ;. .. . . . . :. . . . . .
Standard Absorbance
0 uo/L 0.003 Regression Output: 0.2: ug/L 0.004 Constant 0.0015987 0.5 ug/L (1.007 Std Err of Y Est 0.0038172
1 ug/L 0.01h R Squared 0.9993215 2.5 ug/L 0.042 No. of [Ibservations 8
5 ug/L 0.079 Degrees of Freedom 6 10 ug/L O.lb8 25 ug/L 0.395 X Coef f ic ient ls) 0.11!58466
Std Err of Coef. 0.0001686 Correlation 'Coefficient 0.99966@7
Di lu t ion Result ResultrDF Sample Sample Absorbance Factor (ug/L) (ug/L) Result Uni ts
. . . . ... NBS 1643 0.336 1 21.10245 21.10245 <;:' .. ,. . . . . . . . . . , . .
:...,: ,;.; . . . . . . . . . , . . . .. . . . . : . . . , , . . . . . . . ., . . , . ..
. . . . . ,. .. . . , . . : . , .. :
, .
. . . . .
... ? . . . .. . . \ . . :. .:. . , :;., .
.' :... : :.. i.
. . . . , . , ..:; ;.: . .:.. . ., . . . . . .
10 mcglL HR15 0.163
Sample ASF Rar Code
Oh401 0.047 Ob402 0.103 lLl6406 0.316 @64@7 0.209 Oh408 0.187
10.18525 10.18525
2.865055 2.865055 0.1405421 h.398946 6.39894b 0.0035558 19.84035 19.84@35 0.0168bl6 13.08809 13.08809 0.5172865 11.6997a 11.6997a 0 . 4 3 ~ 0 ~ 8 1
06410 0.338 1 21.22866 21,22866 0.0183jl~l Ob41 1 0.211 1 13.21430 13.?1430 0.5132740
Detection L imi t Determination:
i1.25 UglL 0.0@9 0.25 ug/L 0.25 ug/L 0.25 ug/L 0.006 0.3257108 ug/L 0.25 ug/L 0.005
0.@05 Detection Limit (uglLI: 0.004 3*Standard Deviation/Slope of Curve =
D r i f t Determination (10 uglL standardl:
c-9

. . . : '
I n i t i a l ICs IC51 ICs1 ICs1
X Drift 0.168 0. l b l 4.17 0. 163 ?. 98 0.157 6.55
Comments: These samples were analyzed on a Perkin-Elmer Zeeman 5000 w i t h a Cr hol low
A negat ive number i nd i ca tes t h a t t he sample was le55 than the de tec t i on l i m i t cathode lamp.
c-10

:.. . :
. . . . . . . . , .
. .
.. :. .. .. . ' , . : . . . . . . . .
r -
_'.. '.,. . . ,
Impingers 2 mcg/nL 0.868955 0.022988 0.282666 i . 4 m a ~
Commen t s : The samples mere analyzed on a Jarrell-Ash Model ll55fl
The calculated data i s blank corrected. A negative nuaber indicates that t h e result i s le55 than t h e detection limi
ICP-AES.
c-11