i ssues of h ousehold f ood s ecurity in a d eveloping c ountry bhawani mishra kamol ngamsomsuke...
TRANSCRIPT

ISSUES OF HOUSEHOLD FOOD SECURITY IN A DEVELOPING COUNTRY
Bhawani Mishra Kamol Ngamsomsuke
Thomas G. Johnson

2
National level
Regional level
Community level Market level
Individual level
Household level
Source: FAO
Food security studies can be done at the different levels
Food security study
3
Food Security at the Household Level
• As we move to the lower hierarchal levels, food security becomes more complex. (National level ---to---- Individual Level)
• Food security at the household level is an outcome of many factors – social, economical, environmental, political, institutional etc…
• Food security issues presented here are based on a case study done in Nepal.

4
Out of 44 Village Development Committees (VDCs)
Figure: Map of Nepal Showing Kailali District .
Figure: Selected VDCs in Kailali District.
Kailali is one of the food sufficient districts in Nepal.
Study Area

5
Data Collection
• Household Interviews , Group Discussions (primary data source)• Publications from Government Offices- (Secondary data source).• Analyses done based on caste/ethnic groups.
The household level is appropriate for studying the factors affecting food security (Gittelsohn, Mookherji, and Pelto 1998)
Reasons of studying food security at the household level
Little previous work done to operationalize the concept at the household level in Nepal (Gittelsohn et al., 1998).
Food production and consumption decisions are actually made at the household level.

6
Household
Expenditure(Food, non food)
Social variables(Caste, education)
Income(Farm, non farm)
Resource endowment(capital goods)
Policies,community resources, institutional supports, markets
Questionnaires Group discussions Secondary data
Tertiary factors Interlinkages Problems
Food security at the household level
Research Methods

7
• Majority of the households are in subsistence farming.
• Food security at the household level largely depends on agriculture
performance.
• Landholding size is a very important constraint to productivity.
• Landholdings are generally small .
• Landholding distribution skewed in favor of certain types of households.
Characteristics of Households
Major Issues of Food Security

8
Landholdings (National level)
Size of holdings % of total Holdings Area (000 ha.) % of Holdings
<1.0 ha.(2.47 Acre) 69.4 791.9 30.5
1.0 – 5.0 ha. 29.1 1470.6 55.6
5.0 – 10 ha. 1.2 209.3 8.1
>10 0.3 151.3 5.8
Total 100 2,597.4 100
Source: Central Bureau of Statistics, 2002
Major Issues of Food Security

9
Landholding size in study area
45.2
29.6
8.8
29.2
05
101520253035404550
Lan
dh
old
ing
(K
atth
a)
Brahmin Chhetri Sudra Tharu
Caste/ethnic group
30 kattha=1 hectare= 2.47 Acre
Major Issues of Food Security

Caste/ethnic group Landholding category (Kattha) Total
< 30 30-60 61-90 91-120 > 120
Brahmin 9 (47.4) 5 (26.3) 4 (21.1) 1 (5.2) - 19 (100)
Chhetri 11 (68.8) 4 (25.0) - - 1 (6.2) 16 (100)
Sudra 27 (100.0) - - - - 27 (100)
Tharu 23 (85.2) 1 (3.7) 2 (7.4) - 1 (3.7) 27 (100)
Total 70 (78.7) 10 (11.2) 6 (6.7) 1 (1.2) 2 (2.2) 89 (100)
30 Kattha= 1 ha.= 2.47 Acre
Distribution of landholdings among different castes
Major Issues of Food Security
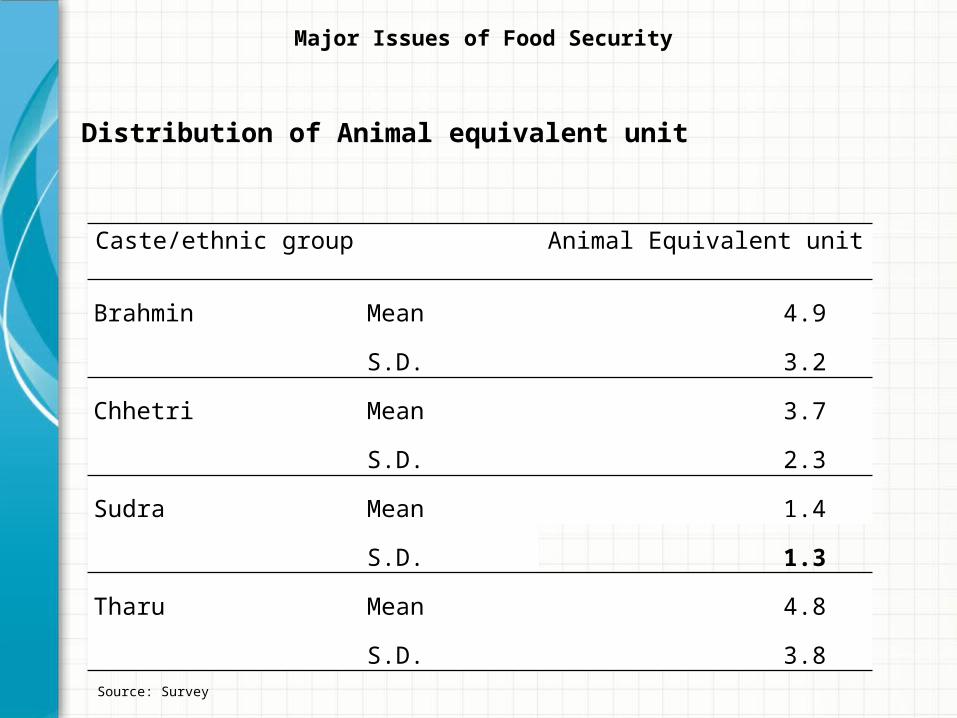
Distribution of Animal equivalent unit
Caste/ethnic group
Animal Equivalent unit
Brahmin Mean 4.9
S.D. 3.2
Chhetri Mean 3.7
S.D. 2.3
Sudra Mean 1.4
S.D. 1.3
Tharu Mean 4.8
S.D. 3.8
Source: Survey
Major Issues of Food Security

Average family size by caste/ethnic group
7.3
6.15.7
7.2
0
1
2
3
4
5
6
7
8N
umbe
r of
peo
ple
p
er f
amily
Brahmin Chhetri Sudra Tharu
Caste/ethnic group
Source: Survey, 2004
Major Issues of Food Security
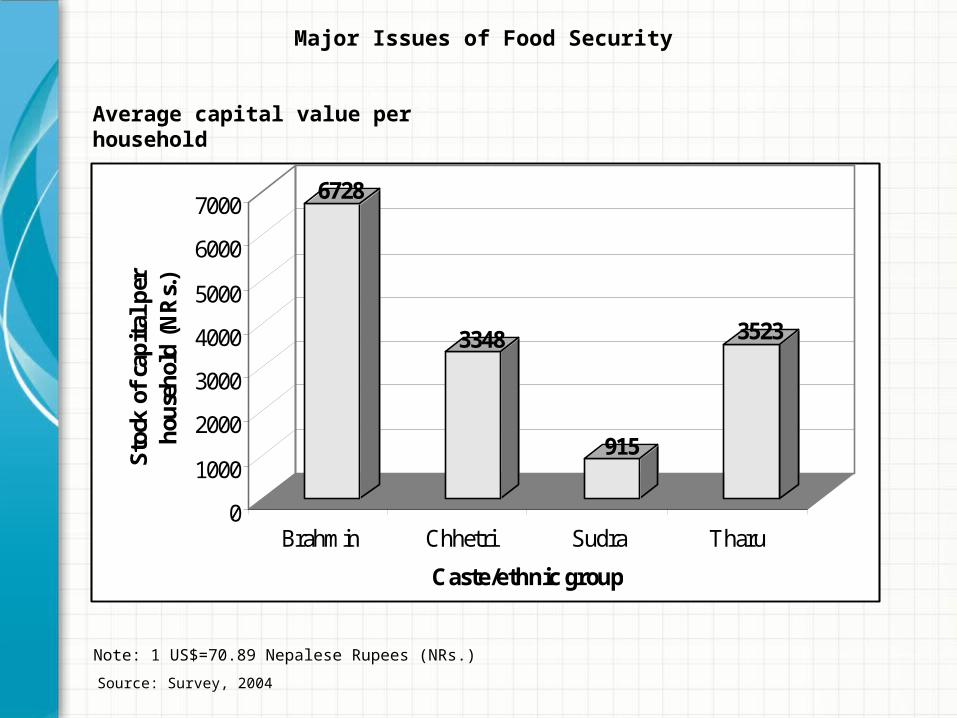
6728
3348
915
3523
0
1000
2000
3000
4000
5000
6000
7000
Sto
ck o
f ca
pit
al p
er
h
ouse
hol
d (
NR
s.)
Brahmin Chhetri Sudra Tharu
Caste/ethnic group
Average capital value per household
Source: Survey, 2004
Note: 1 US$=70.89 Nepalese Rupees (NRs.)
Major Issues of Food Security

Average Investment on agriculture
12270
8755
4266
8773
0
2000
4000
6000
8000
10000
12000
14000
Exp
endi
ture
on
ag
ricu
ltur
e (N
Rs.
)
Brahmin Chhetri Sudra Tharu
Caste/ethnic group
Note: 1 US$=70.89 Nepalese Rupees (NRs.)
Major Issues of Food Security

Household head’s years of education
Number of years’ education
Caste/ ethnic group Total
Brahmin Chhetri Sudra Tharu
Illiterate - 4 (25.0%) 10 (37.0%) 4 (14.8%) 18 (20.2%)
1-5 10 (52.6%) 7 (43.8%) 17 (63.0%) 21 (77.8%) 55 (61.8%)
6-9 2 (10.5%) 1 (6.2%) - 1 (3.7%) 4 (4.5%)
>=10 7 (36.8%) 4 (25.0%) - 1 (3.7%) 12 (13.5%)
Total 19 (100.0%) 16 (100.0%) 27 (100.0%) 27 (100.0%) 89 (100.0%)
Mean value of calorie per adult equivalent of 10 or less than 10 years’ of education is significant different with more than 10 years of education (α=0.05 )
Source: Survey
Major Issues of Food Security

n
jjjjj
tij
n
jjjjj
tijiTotkal
1
1
1
)1()1(
t total production of jth food commodity for ith householdj is the extraction rate of edible part of the jth food item
j is the waste rate of food in storage and handling of jth commodity
j is the rate of other losses than storage and food item jth item jth commodity
t-1 ij stock from previous years of ith household and jth commodity j is the calories values of the food item jth
Also include food bought and received
Calorie per adult equivalent per day = total calories of ith household in year / total adult equivalent * 365
Calorie per adult per day= f(land, caste, labor, livestock, expenditure on agri, land parcel)
Factor affecting of food security

Outcome of Household characteristics
caste/ ethnic group
Mean NStd.
Deviation Minimum Maximum
Brahmin2626.6 19 1848.1 1211 6925
Chhetri2251.4 16 653.6 1446 3923
Sudra1537.2 27 466.7 1086 2479
Tharu2204.3 27 1234.0 1052 6333
Total2100.5 89 1204.3 1052 6925
Note: The national average kcal per adult equivalent threshold level is 2250.

18
Factor affecting of food securityVariables Expected sign Result Significant
Cultivated land per capita + + *
Ratio female economically active adult to total economically active
+ - *
Adult equivalent + + ***
land parcel - + NS
Ratio of irrigated land to the total cultivated land
+ + NS
Livestock equivalent unit + + *
Expenditure on agriculture + + **
Dummy of Sudra - - **
Dummy of Tharu - - NS

Caste/ethnic groupNumber of
food secure HHs*
Percentage (%) to total HHs under each caste/ethnic group
Brahmin 7 36.8
Chhetri 7 43.8
Sudra 4 14.8
Tharu 9 33.3
Total 27 30.3
Food secure households under each caste/ethnic group
Source: Survey

High
Medium
Low
April/May May/ June June/ July July/Aug March/AprilFeb/ MarchJan/FebNov/DecOct/NovSept/OctAug/Sept Dec/Jan
No
income
income
Food shortage
Food shortage
Food shortage
Food shortage
Expenditure
Expenditure Expenditure
ExpenditureExpenditure
income
income
income
Seasonality of food security
Source: Group discussion
Food security trend

21
Additional issues related to food security
• Wide spread poverty among the certain group of people.
• Increased “Feminization of agriculture” due to conflict.
• Inadequate institutional support to boost agriculture (such as
improved agricultural technologies) .
• Higher morbidity during rainy season (including livestock).
• Inadequate access to agriculture markets (both input and output
markets)
• Natural resources such as forest, nature water bodies are important
source food (especially for Sudra and Tharu group).
• Land tenure Institution weak or absent (*).

22
Food insecurity(Core problem)Unfavorable
weather condition
Lowproduction
Less off-farmjobs
Diseases(Human)
Low inputsused
(fertilizer, pesticides)
Low landholding Low income
Inadequateirrigation
InadequateImproved seed
supply
Low knowledge ofpest and diseasesLocally not
supplied
Higher costLess contact withextension worker/
inadequate trainings
Higher landlevel
Higher cost ofPumpshet
No governmentsubsidies
Difficultprocedure
Low priceof output
Higher costof land
No storagefacility
Importation ofvegetable from
India
Collusion ofTraders
Price not knownearlier
Low governmentinvestment
Less governmentinitiative
Conflict
Inadequateknowledge and skill
aboutentrepreneurships
Low production ofRice and Wheat
Potato/ Tomatodestroyed
Notrainings
Higher familymembers/ family
separation
Higher demandof land
High migration of conflictdisplaced people
Conflict
Inadequateknowledge about
sanitation andnutrition
Inadequatesupply ofmedicine/doctors
Inadequate creditavailability
Rich picture of food security issues
Source: Group discussion
Summary of food security issues

23

24
Government Agri. Policy Trade Production
Regional food supply
Community food supply
Household
Cultural factorsRule for the selection, inter-household
sharing, intra-household allocation
Climate change
Household food
security
Intra-household
food allocation
Individual dietary intake
Morbidity
Individual nutritional
status
Figure: Conceptual framework for examining household food security, Gittelsohn et al. 1998

25
Income from different sources
Caste/ethnic group
Income from agricultural sector (%) Non-farm income (%)
Crop *(%) Livestock*(%) Total (%)
Brahmin 21.5(66.6)
10.5 (33.4)
31.5 (100.0)
68.5
Chhetri 18.0(61.5)
11.3(38.5)
29.3(100.0)
70.7
Sudra 4.4(56.8)
3.4(43.2)
7.8(100.0)
92.2
Tharu 17.8(81.1)
4.2(18.9)
22.0(100)
78.0
*Figure in the parenthesis indicates the percentage within Agriculture

26
1843 1795
2045
15581451 1446 1428
2983
2370
2629
0
500
1000
1500
2000
2500
3000
Cal
orie
s pe
r
adul
t eq
uiva
lent
1 2 3 4 5 6 7 8 9 10 11 12 13 14
Household head's year of education
Education VS Calories Per Adult Equivalent
Mean value of calorie per adult equivalent of 10 or less than 10 years’ of education is significant different with more than 10 years of education (α=0.05 )
27
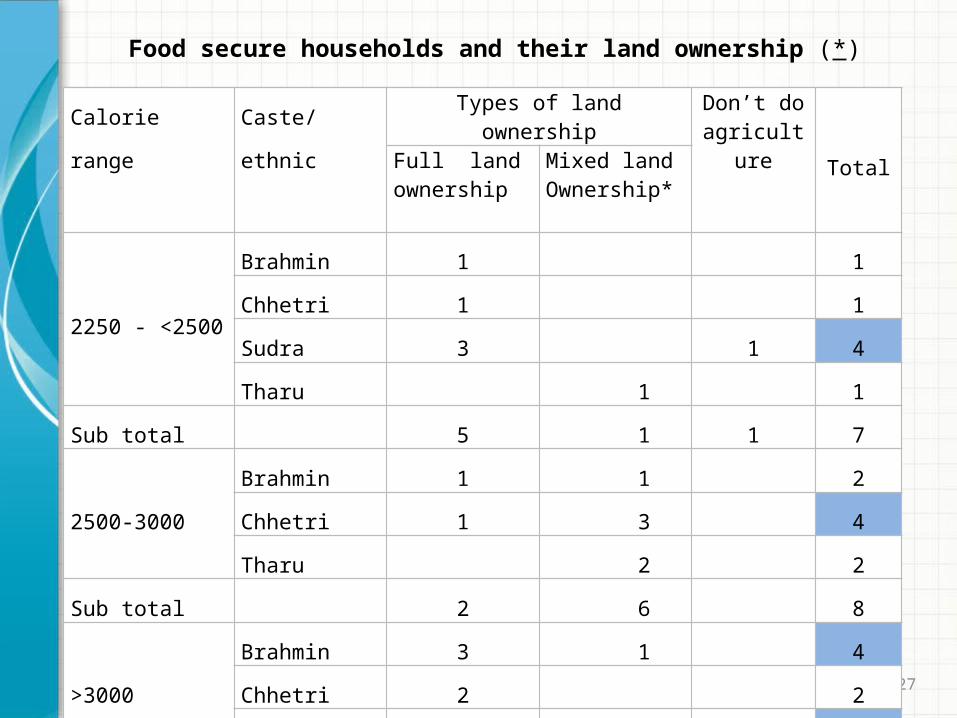
Food secure households and their land ownership (*)
Calorie range Caste/ethnic Types of land ownership Don’t do agriculture TotalFull land
ownershipMixed landOwnership*
2250 - <2500
Brahmin 1 1
Chhetri 1 1
Sudra 3 1 4
Tharu 1 1
Sub total 5 1 1 7
2500-3000
Brahmin 1 1 2
Chhetri 1 3 4
Tharu 2 2
Sub total 2 6 8
>3000
Brahmin 3 1 4
Chhetri 2 2
Tharu 2 4 6
Sub total 7 5 12
Total 14 12 1 27

28
Activities Apr/May May/Jun Jun/July July/Aug Aug/Sep Sept/Oct Oct/Nov Nov/Dec Dec/Jan Jan/Feb Feb/Mar Mar/Apr
Events School admission of children, Cucurbits planting (early)
Diseases (human) Paddy nursery, Maize planting (upland) Cucurbits
Paddy planting, Maize planting (upland) Cucurbits,Calving animal
Diseases Diarrhea in children, Paddy Planting, Calving animal
Paddy weeding, Nursery of winter vegetable
Dashain celebra-tion, Winter Vegeta-bles’ nursery and transplantation
Tihar celebra-tion, winter vegetable harvesting (early), planting of winter crops
Paddy harvesting, wheat and planting, Vegeta- bles, Potato
Wheat planting Vegetables
Off-seasons (cucurbits) nursery
Off-seasons (cucurbits), Beans, Maghi celebration (Tharu)
Okra, French bean, Asparagus bean, Potato harvesting
Harvesting of off season vegetables,
Wheat harvesting
Expendi-tures
High Medium High High Medium High High High MediumHigh
(Tharu), medium
Medium Medium
Income High Medium Low Low Low Medium Medium High High High Medium MediumLabor shortage Medium Medium High High Medium No High High Medium High No Medium
Diseases (human) Medium Low High High High Low Low Low Medium High No No
Food shortage No Medium High High High Medium Medium No No No No/Low No/ low
/ diseases
No/low No/low FMD livestock
FMD livestock
Insect in Rice
Insect in Rice
No/low Late blight
Potato& tomato
Late blight
Potato& tomato
No/low Insect veg.
Wheat Rust
Insect veg.
Fowl diseases
Seasonality of food security
Source: Group Discussion

29
Factor affecting of food security
Calorie per adult per day= f(land, caste, labor, livestock, expenditure on agri., parcel)
Ojha(1999) has already tested these variables and found that log-linear model is appropriateI used same variables with Sudra and Tharu as dummy
Final model •Log (Calorie per adult per day )= dependent variables•Cultivated land per capita, •Ratio female economically active adult to total economically active, •Adult equivalent,•land parcel number, •Ratio of irrigated land to the total cultivated land,• Livestock equivalent unit, •expenditure on agriculture,

Major problems in agriculture
Problems Ranking
Conflict / insurgency First
Inadequate of irrigation facility Second
Higher input prices Third
Inadequate knowledge about pest and diseases
Fourth
Lower prices of outputs Fifth
Inadequate access to improved seeds/breeds
Sixth
Inadequate landholding Seventh
Source: Group discussion