iab pwc: online adspend study 2007, uk
TRANSCRIPT

2007 UK online adspend study

1. Introduction
Agenda
1. Introduction
2. Study methodology
3. Market background and trends
4. UK online adspend – headline results
5. Online in context
6. The digital media mix
7. Industry categories
8. Summary
9. Looking ahead…
10. Questions

Background
• Census of all major UK online media owners
• Official Advertising Association figures since 1997
• Information collected each half year
• Analysis available by
‒ Format
‒ Industry category

2. Methodology

• The IAB has been working with PwC since 1997 to survey the value of the online advertising market
• We have run projects in Europe and North America to assess the size of the interactive media markets
• These figures have become the industry standard for measuring advertising spend
• 118 companies have participated in the survey
• Reported figures are not adjusted to account for other organisations that have not participated
• Total advertising revenue is reported on a gross basis
• The figures are drawn up on the basis of site declaration
• They cover thousands of UK websites, but by no means all
A brief history…

Research participants
Acxiom Ad2-one Adept Scientific Adlink Ad Revenue AdSales4U Advertising.com Adviva AOL Affiliate Window Ask Associated Northcliffe Digital Autotrader BBC Worldwide
Bloomberg Blue Lithium BMJ Bolt Blue Bounty BSkyB Buy Association Buy.at (Perfiliate) Channel 4 Chinwag Chrysalis Radio Classic FM CNET Conde Nast Confetti Dennis
Interactive DGM Dixons Double Fusion E-circle Economist EDR EMAP E-Type Euroclick Everyclick Faversham House Group Financial Times Find.co.uk Findaproperty Fish4 Five
Friends Reunited Future Publishing GCap Radio Google Guardian Habbo Hachette Fillpacchi Handbag Haymarket Hello IDG Independent I.E.T (Institute of Engineering and Technology) IPC Media IPT i-Points ITN ITV iVillage Jetix Jobs.ac.uk Jobsite Johnston Press Loot Lycos Manchester Online Media Brokers Memedia Miva Monetise Moneyextra Monster MSN My
Space National Magazines Net Communities Netrecruit News International Orange Oridian Overture Pigsback Prime Location Property Finder Real Media Reed Business Information Reuters Right Move Scotland Online Sift Simply Media TV SRH Skupe Teamtalk Telegraph
Tesco Tiscali TMN Media Tradedoubler UK Net Guides UKTV Unanimis Upmystreet U Target Valueclick Viacom Brand Solutions Virgin Radio WME Workthing Yahoo! Yell
…Plus further recruitment sites, courtesy of WARC
Representing thousands of UK websites

3. Market background
and trends

At the height of the “boom” online was worth £166m!
19.4
153.1
165.7
51.0
0
20
40
60
80
100
120
140
160
180
1998 1999 2000 2001
£ m
illio
ns
Source: PricewaterhouseCoopers / Internet Advertising Bureau / WARC

Where were we this time last year?..
• Online broke through the £2bn barrier in 2006
• The medium grew by 41% from £1.4bn in 2005
• Online overtook National Press• Our initial forecast for 2007 was £2.6bn…
• …but we revised that up to £2.75bn (and Prayed!)

3.6mJune 96
Source: Gfk NOP World, To July 2007
Have you used the Internet in the last 12 months?
32.5mJuly 07
Meanwhile the audience is still growing
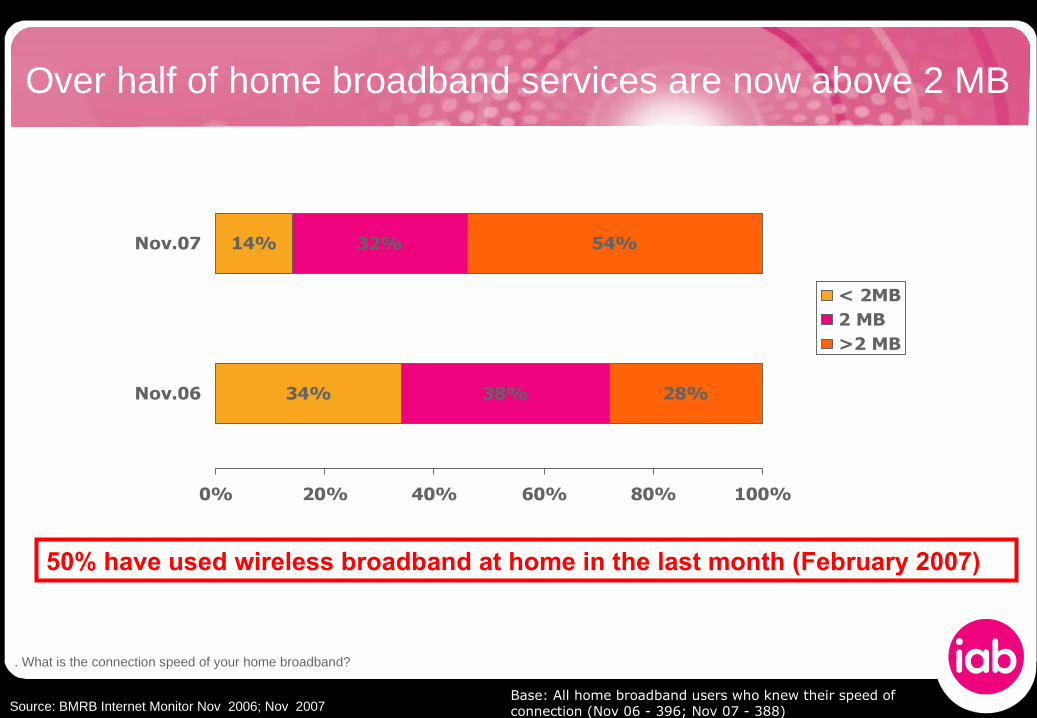
Over half of home broadband services are now above 2 MB
34%
14%
38%
32% 54%
28%
0% 20% 40% 60% 80% 100%
Nov.06
Nov.07
< 2MB2 MB>2 MB
Base: All home broadband users who knew their speed of connection (Nov 06 - 396; Nov 07 - 388)Source: BMRB Internet Monitor Nov 2006; Nov 2007
50% have used wireless broadband at home in the last month (February 2007)
Q. What is the connection speed of your home broadband?

Young women take over…
Women 25-34 now spend more time online than men in
the same age group.
Source: Ofcom Communications Report 2007

Empty nesters go surfing…
One quarter of all Britons online are over 50 and 30% of total time spent on the internet is by the over 50’s
Source: Ofcom Communications Report 2007

It’s never been easier to get online
£4.50
Toshiba Tecra 8100£250 inc VAT
$100 Wind Up
50p per hour
Free at libraries
Bars, Hotels,Coffee shops, parks…

4. UK Online Adspend Study
Results for the full year of 2007Prepared by PricewaterhouseCoopers for the IAB

Have I got news for you…?

£2,812.6mmarket in 2007
An increase of £797m year-on-year
Source: PricewaterhouseCoopers / Internet Advertising Bureau / WARC

38% increase
New contributions in 2007 represented £64.9m
2007 vs. 2006
on a like for like basis
Source: PricewaterhouseCoopers / Internet Advertising Bureau / WARC
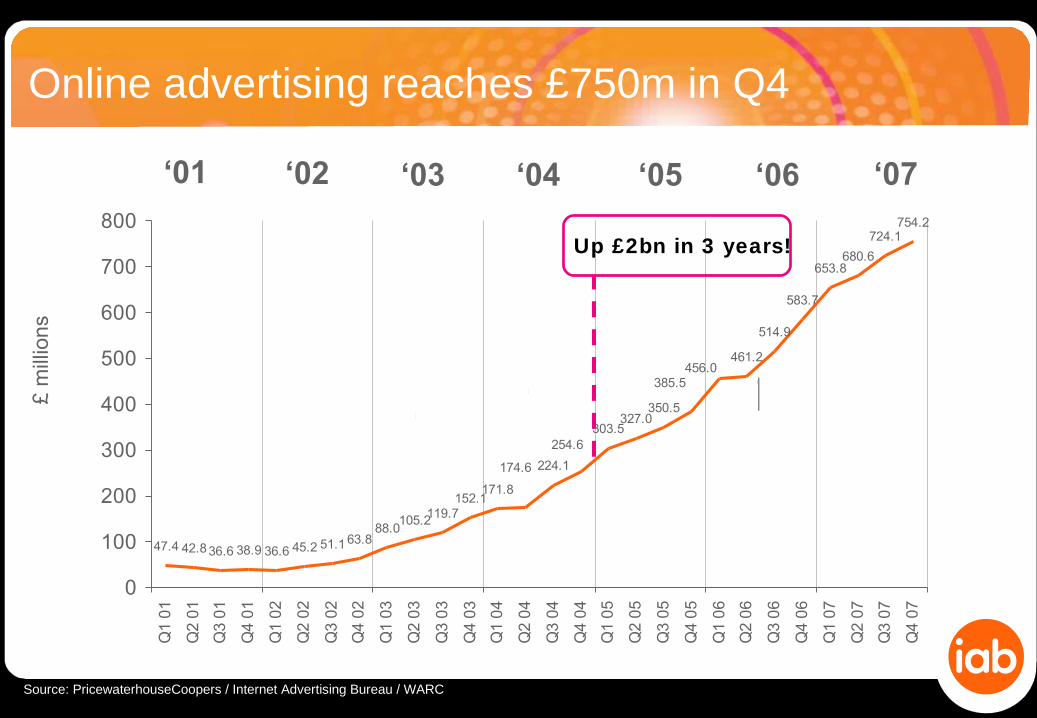
Online advertising reaches £750m in Q4
47.4 42.836.6 38.9 36.6 45.2 51.1 63.888.0
105.2119.7152.1
171.8
224.1
303.5327.0
350.5
461.2
514.9
583.7
653.8680.6
724.1754.2
385.5456.0
174.6
254.6
0
100
200
300
400
500
600
700
800
Q1
01
Q2
01
Q3
01
Q4
01
Q1
02
Q2
02
Q3
02
Q4
02
Q1
03
Q2
03
Q3
03
Q4
03
Q1
04
Q2
04
Q3
04
Q4
04
Q1
05
Q2
05
Q3
05
Q4
05
Q1
06
Q2
06
Q3
06
Q4
06
Q1
07
Q2
07
Q3
07
Q4
07
£ m
illio
ns
Source: PricewaterhouseCoopers / Internet Advertising Bureau / WARC
‘01 ‘03‘02 ‘04 ‘05 ‘06 ‘07
Up £2bn in 3 years!

5. Online in context…Breaking market trends in the UK ad industry

21.8%
15.3%
11.8% 5.3%
3.3%
0.9%6.7%
15.1%
19.9%
Television
Press - Display
Internet
Press - Classified
Direct Mail
Directories
Outdoor
Radio
Cinema
2007 market share 15.3% (11.4% in 2006)
% share of revenues for January to December 2007
Source: PricewaterhouseCoopers / Internet Advertising Bureau / WARC
IAB estimates for actual ad spend by format are based on samples of categorised revenue from key IAB members provided by PwC. Data excludes unclassified figures.
Total advertisingmarket
£18.4bn

-3.2%
4.0% 4.6%
9.9%
-0.3%
2.3% 2.8%
-6.5%
38%
Direct
Press
Clas
sified
Press
Disp
lay TVRad
io
Direct
ories
Outdo
or
Cinem
a
Inte
rnet
Source: PricewaterhouseCoopers / Internet Advertising Bureau, The Advertising Association / WARC: WARC estimate for directories.
Online drives the whole market
Total advertising market growth = 4.3%
Year on year growth for 2007

Mar
ket
Sha
reOnline’s share growth accelerates to 16%
Source: PricewaterhouseCoopers / Advertising Association / Internet Advertising Bureau / WARC
2.5%3.3%
4.2%5.5%
7.3%8.4%
10.4%
12.4%
14.7%15.9%
H12003
H22003
H12004
H22004
H12005
H22005
H12006
H22006
H12007
H22007

0
200
400
600
800
1000
1200
Q198
Q298
Q398
Q498
Q199
Q299
Q399
Q499
Q100
Q200
Q300
Q400
Q101
Q201
Q301
Q401
Q102
Q202
Q302
Q402
Q103
Q203
Q303
Q403
Q104
Q204
Q304
Q404
Q105
Q205
Q305
Q405
Q106
Q206
Q306
Q406
Q107
Q207
Q307
Q407
Online slices through the media market£
mill
ions
Source: PricewaterhouseCoopers / Internet Advertising Bureau / Advertising Association / Radio Advertising Bureau / WARC
N.B. WARC Recruitment data included from 2003
Radio
Outdoor
Internet
Press - Display
Television
Press - Classified
Direct Mail
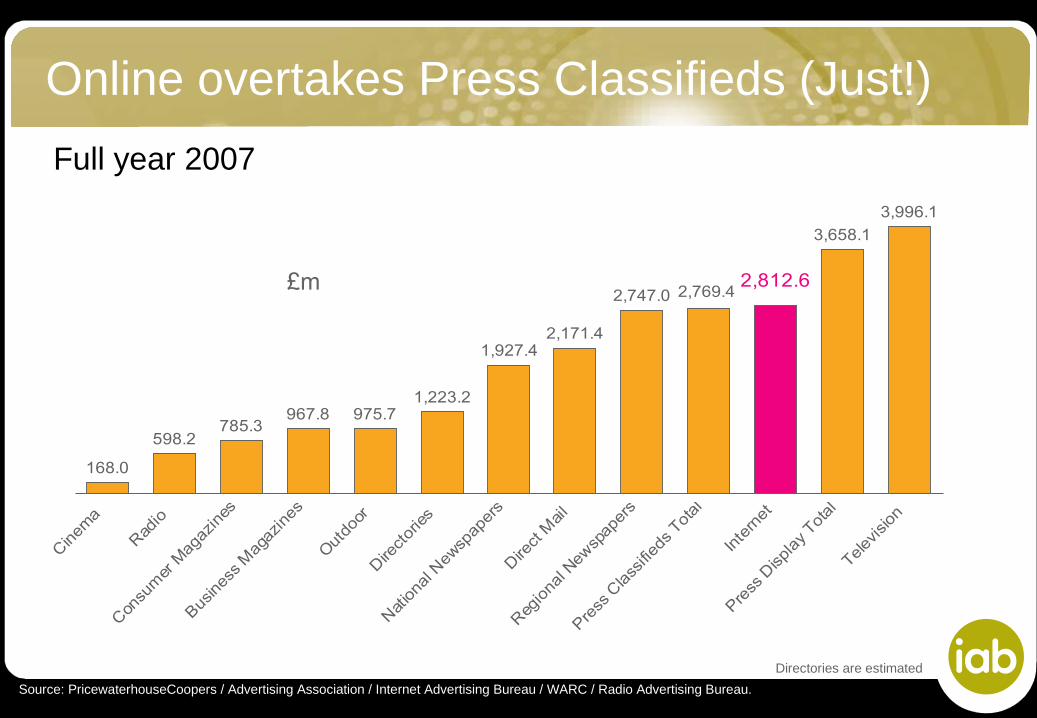
Online overtakes Press Classifieds (Just!)
168.0
598.2785.3
967.8 975.71,223.2
1,927.42,171.4
2,747.0
3,658.1
3,996.1
2,769.42,812.6
Cinem
a
Rad
io
Con
sum
er M
agaz
ines
Busines
s M
agaz
ines
Out
door
Dire
ctor
ies
Nat
iona
l New
spap
ers
Dire
ct M
ail
Reg
iona
l New
spap
ers
Press
Class
ified
s Tot
al
Inte
rnet
Press
Disp
lay Tot
al
Telev
ision
£m
Source: PricewaterhouseCoopers / Advertising Association / Internet Advertising Bureau / WARC / Radio Advertising Bureau.
Full year 2007
Directories are estimated

Summary – Full year 2007
• Online advertising driving growth of the entire media market
• Internet advertising reaches £2,812.6m in 2007
• Online achieved a share of 15.3%, up nearly 4 points from 2006 (11.4%)
• The market grew on a like for like basis by 38% year-on-year, maintaining the strong growth of previous waves
• Online overtakes Regional Newspapers and press classifieds (15% and 15.1% respectively)

Summary – H2 2007
• In the second half of the year, online advertising was worth £1,478.2m
• The internet’s share of all advertising expenditure actually reached 15.9%
• Revenues for Q4 over £750m

6. The digital media mixThe developing mix of ad products

21.0%
57.6%
0.6%
20.8%
DisplayClassifiedsPaid for searchSolus Email
Source: PricewaterhouseCoopers / Internet Advertising Bureau / WARC
IAB estimates for actual ad spend by format are based on samples of categorised revenue from key IAB members provided by PwC. Data excludes unclassified figures.
Full year total
£2,812.6m
% share of revenues for the full year 2007
The digital media mix

335.9262.2
768.3
453.7379.0
1165.6
592.0 585.3
1619.1
Display Classifieds Paid for search
2005 2006 2007
£ m
illio
ns
+31% +54%
+39%
Source: PricewaterhouseCoopers / Internet Advertising Bureau / WARC
IAB estimates for actual ad spend by format are based on samples of categorised revenue from key IAB members provided by PwC. Data excludes unclassified figures.
The digital media mix
All online formats have experienced strong growth

10.2%
16.6%
10.5%
57.6%
1,6%
Banners / Embedded
Sponsorships
Interruptive formats
Display ads on email
Tenancies
Other display
Solus Email
Recruitment classifieds
Consumer classifieds
B2B Classified
Paid-for search listings
The digital media mix
Source: PricewaterhouseCoopers / Internet Advertising Bureau / WARC
IAB estimates for actual ad spend by format are based on samples of categorised revenue from key IAB members provided by PwC. Data excludes unclassified figures.
Full year total
£2,812.6m
£467.1m
£23.1m
£15.1m
£23.4m
£44.1m
£19.2m
£16.2m
£286.8m
£296.5m
£1.9m
£1,619.1m
% share of revenues for the full year 2007

The digital media mix£
mill
ions
IAB estimates for actual ad spend by format are based on samples of categorised revenue from key IAB members provided by PwC. Data excludes unclassified figures.
14.0
17.5
15.8
20.1
9.1
15.1
16.2
19.2
23.1
23.4
44.1
298.4
467.1
1619.1
73.2
215.2
163.8
321.5
1165.6
286.8
Interruptive formats
Solus Email
Other display
Sponsorships
Display ads on email
Tenancies
Recruitment classifieds
Further classifieds
Banners / Embedded
Paid-for search listings
2007
2006
Source: PricewaterhouseCoopers / Internet Advertising Bureau / WARC
Year on year comparison

Strong growth of Search continues
181.2248.5
337.0
431.4
531.3
634.3
762.3
856.8
H1 2004 H2 2004 H1 2005 H2 2005 H1 2006 H2 2006 H1 2007 H2 2007
£m
Source: Internet Advertising Bureau / PricewaterhouseCoopers
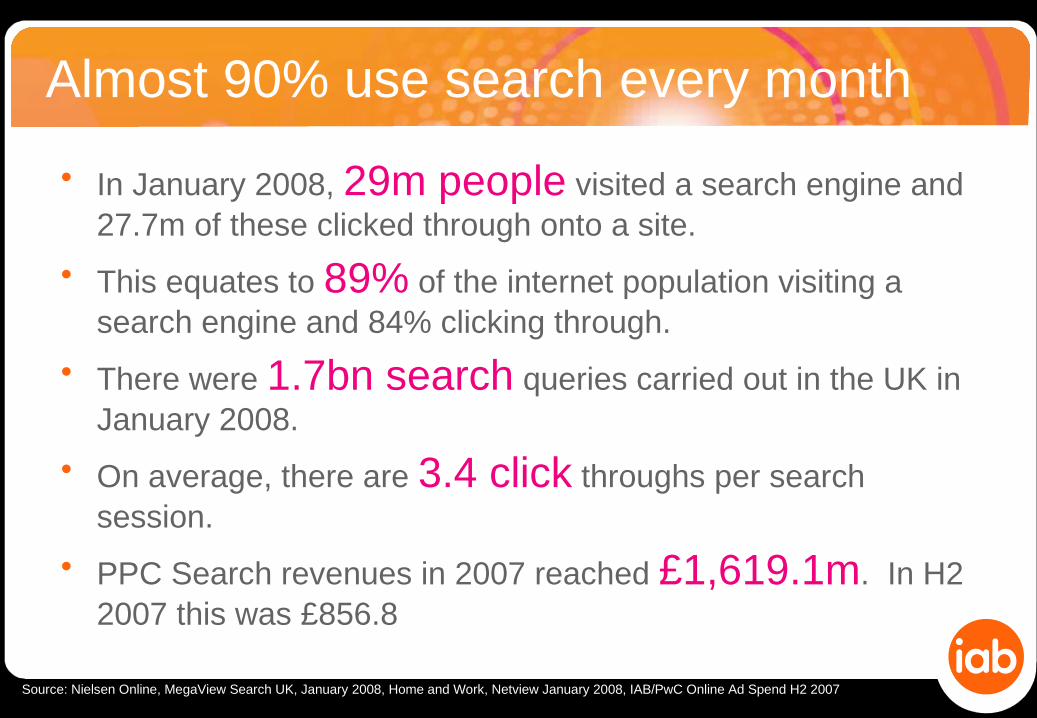
Almost 90% use search every month
Source: Nielsen Online, MegaView Search UK, January 2008, Home and Work, Netview January 2008, IAB/PwC Online Ad Spend H2 2007
• In January 2008, 29m people visited a search engine and 27.7m of these clicked through onto a site.
• This equates to 89% of the internet population visiting a search engine and 84% clicking through.
• There were 1.7bn search queries carried out in the UK in January 2008.
• On average, there are 3.4 click throughs per search session.
• PPC Search revenues in 2007 reached £1,619.1m. In H2 2007 this was £856.8

53.8 67.494.4 87.6 102.8 112.3
142.0 144.814.3
26.0
37.0 43.359.3
104.5
135.6162.8
0
50
100
150
200
250
300
350
H1 2004 H2 2004 H1 2005 H2 2005 H1 2006 H2 2006 H1 2007 H2 2007
Recruiment classifieds Further classifieds
£m
Source: Internet Advertising Bureau / PricewaterhouseCoopers
Growth in further classifieds

Classifieds led by key players

Display: formats dominated by banners & rich media
73.2 91.4 105.4 119.0 138.9182.7
203.6
263.5
305.0287.1
237.9215.9
173.8162.1
136.2
96.7
0
50
100
150
200
250
300
350
H1 2004 H2 2004 H1 2005 H2 2005 H1 2006 H2 2006 H1 2007 H2 2007
Banners / Embedded Sponsorships Interruptive formats
Display ads on email Tenancies Other display
£m
Source: Internet Advertising Bureau / PricewaterhouseCoopers

Embedded formats up over 100% in the last two years£
mill
ions
IAB estimates for actual ad spend by format are based on samples of categorised revenue from key IAB members provided by PwC. Data excludes unclassified figures.
224.4
55.6
20.5 8.8 15.7
321.5
73.2
20.1 9.1 14.0 15.8
467.1
44.123.1 23.4 15.1 19.210.9
Banners /Embedded
Tenancies Sponsorships Display ads onemail
Interruptive formats Other display
2005
2006
2007
Source: PricewaterhouseCoopers / Internet Advertising Bureau / WARC
+45%
+8%+15% +22%+159%-40%

IASH sales houses represent thousands of sites
Source: Internet Advertising Bureau
40% of display spend through networks

Formats summary – 2007
• Revenues increased across all formats, except for tenancies and solus e-mail
• With revenues of £1619.1m in 2007, search maintained its dominant position
• YoY, display was up 31% to £592m while search increased by 39% and classifieds were up by 54% to £585.3m
• Core “embedded” display rose 45% YOY
• Classifieds: recruitment increased by 33% to £286.8m and other classifieds grew by 82% to £298.4m
Source: Internet Advertising Bureau / PricewaterhouseCoopers

7. Industry categories
Source: PricewaterhouseCoopers / Internet Advertising Bureau / WARC
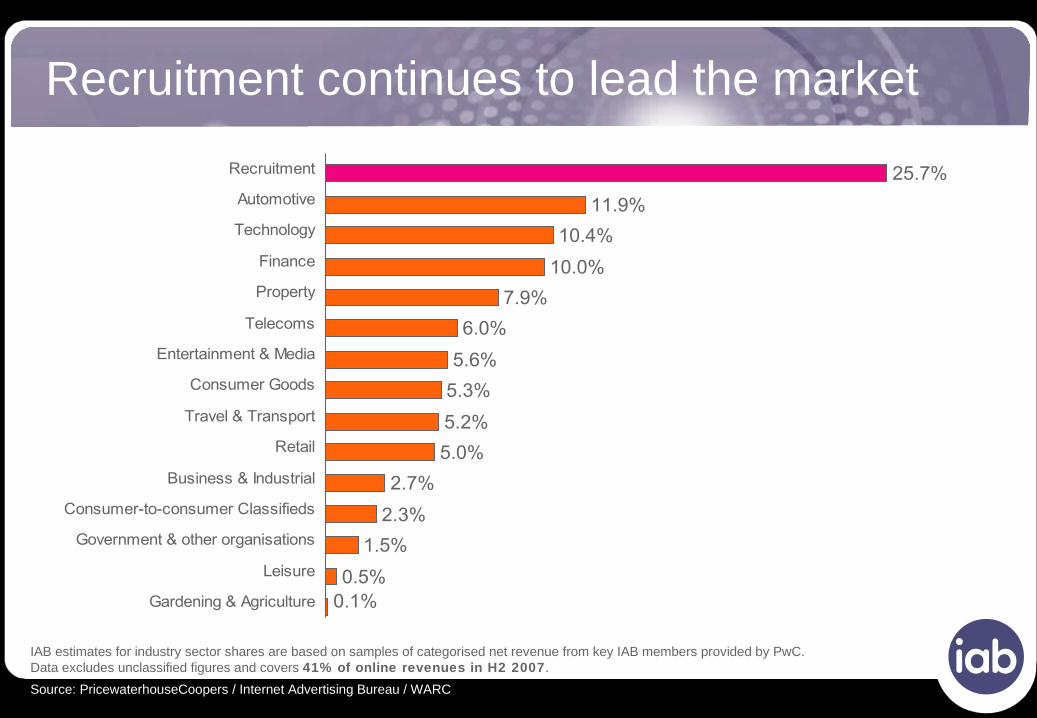
IAB estimates for industry sector shares are based on samples of categorised net revenue from key IAB members provided by PwC. Data excludes unclassified figures and covers 41% of online revenues in H2 2007.
Recruitment continues to lead the market
0.1%0.5%
1.5%
2.3%
2.7%
5.0%
5.2%
5.3%
5.6%
6.0%
7.9%
10.0%
10.4%
11.9%
25.7%
Gardening & Agriculture
Leisure
Government & other organisations
Consumer-to-consumer Classifieds
Business & Industrial
Retail
Travel & Transport
Consumer Goods
Entertainment & Media
Telecoms
Property
Finance
Technology
Automotive
Recruitment

Sector Market Shares
0.9%
0.3%
1.2%
1.0%
0.6%
3.3%
5.8%
8.0%
0.1%
0.5%
1.5%
2.3%
2.7%
5.0%
5.2%
5.3%
5.6%
6.0%
7.9%
10.0%
10.4%
11.9%
25.7%
4.4%
13.8%
13.4%
24.8%
12.6%
4.6%
5.3%
Gardening & Agriculture
Leisure
Government & other organisations
Consumer-to-consumer Classifieds
Business & Industrial
Retail
Travel & Transport
Consumer Goods
Entertainment & Media
Telecoms
Property
Finance
Technology
Automotive
Recruitment
H2 2007
H2 2006
IAB estimates for industry sector shares are based on samples of categorised net revenue from key IAB members provided by PwC. Data excludes unclassified figures and covers 41% of online revenues in H2 2007.
*
• Technology overtakes Finance
• Property enters top 5
Source: PricewaterhouseCoopers / Internet Advertising Bureau / WARC

Sector Market Shares
0.9%
0.3%
1.2%
1.0%
0.6%
3.3%
5.8%
8.0%
0.1%
0.5%
1.5%
2.3%
2.7%
5.0%
5.2%
5.3%
5.6%
6.0%
7.9%
10.0%
10.4%
11.9%
25.7%
4.4%
13.8%
13.4%
24.8%
12.6%
4.6%
5.3%
Gardening & Agriculture
Leisure
Government & other organisations
Consumer-to-consumer Classifieds
Business & Industrial
Retail
Travel & Transport
Consumer Goods
Entertainment & Media
Telecoms
Property
Finance
Technology
Automotive
Recruitment
H2 2007
H2 2006
IAB estimates for industry sector shares are based on samples of categorised net revenue from key IAB members provided by PwC. Data excludes unclassified figures and covers 41% of online revenues in H2 2007.
Source: PricewaterhouseCoopers / Internet Advertising Bureau / WARC
Retail gains share
!

Spotlight on Retail
• Online spend beginning to grow, reflecting a buoyant and competitive e-commerce market (46.6bn 2007)
• 46.6bn ecommerce spend up 54% on the £30.2bn recorded for 2006

Are Finance and travel maturing?
0.2%
0.5%
0.7%
0.9%
1.4%
3.5%
4.2%
5.7%
6.2%
9.3%
10.5%
11.2%
21.6%
24.0%
Gardening & Agriculture
Leisure
Government & other organisations
Consumer-to-consumer Classifieds
Property
Retail
Business & Industrial
Consumer Goods
Entertainment & Media
Technology
Automotive
Travel & Transport
Recruitment
Finance
0.1%0.5%
1.5%
2.3%
2.7%
5.0%
5.2%
5.3%
5.6%
6.0%
7.9%
10.0%
10.4%
11.9%
25.7%
Gardening & Agriculture
Leisure
Government & other organisations
Consumer-to-consumer Classifieds
Business & Industrial
Retail
Travel & Transport
Consumer Goods
Entertainment & Media
Telecoms
Property
Finance
Technology
Automotive
Recruitment
*
Finance and Travel spend has increased
over time,
but share of categories has declined
H2 2007
H2 2004

• Property is the share point winner (+3.3 points) however, recruitment retains the pole position and Technology overtakes Finance for the first time to take the third spot.
• Retail (+1.7), Business and Industrial (+2.1) and Telecoms (+0.7 points) strengthened their positions whilst Finance (-3.8 points) and Technology (-3 points) continued to showed a decline.
• Share for Consumer Goods, though remains mid tier, increased by 0.9 point - there is still room for growth in this sector.
Industry sectors summary – H2 2007
8. Summary

Have I got news for you…
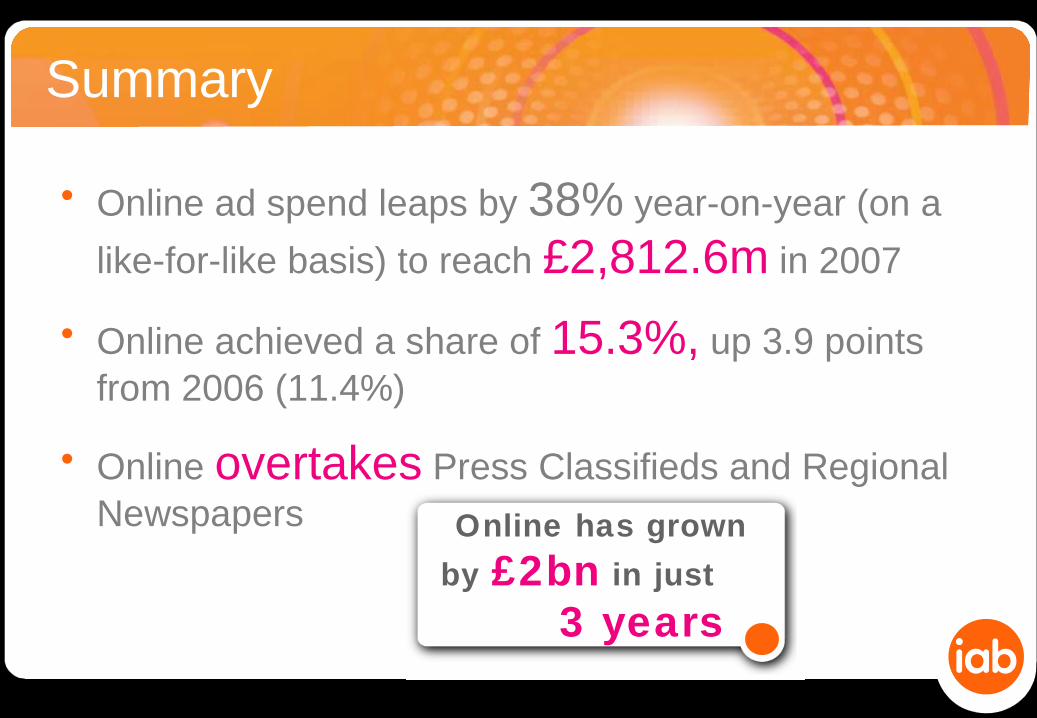
Summary
• Online ad spend leaps by 38% year-on-year (on a
like-for-like basis) to reach £2,812.6m in 2007
• Online achieved a share of 15.3%, up 3.9 points from 2006 (11.4%)
• Online overtakes Press Classifieds and Regional Newspapers Online has grown
by £2bn in just
3 years
Summary
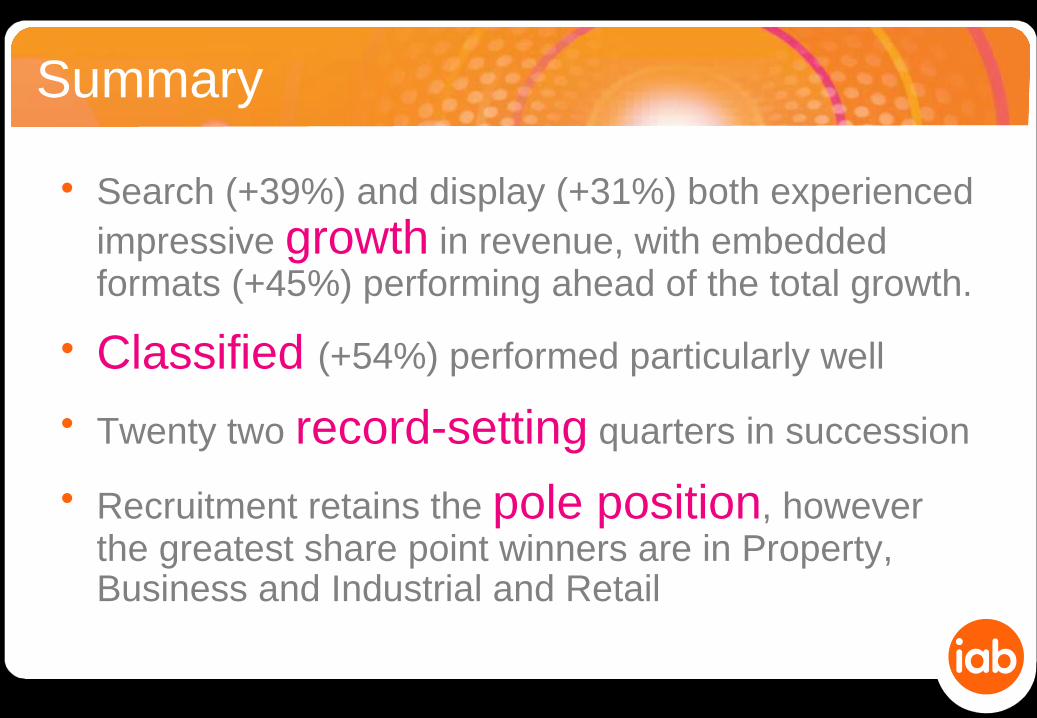
• Search (+39%) and display (+31%) both experienced impressive growth in revenue, with embedded formats (+45%) performing ahead of the total growth.
• Classified (+54%) performed particularly well
• Twenty two record-setting quarters in succession
• Recruitment retains the pole position, however the greatest share point winners are in Property, Business and Industrial and Retail

9. Looking ahead

Online poised to draw level with total Press display
0
200
400
600
800
1000
1200
Q103
Q203
Q303
Q403
Q104
Q204
Q304
Q404
Q105
Q205
Q305
Q405
Q106
Q206
Q306
Q406
Q107
Q207
Q307
Q407
Internet Press Display
£m
Source: PricewaterhouseCoopers / Advertising Association / Internet Advertising Bureau / WARC

Could online overtake TV next year?
0
200
400
600
800
1000
1200
Q103
Q203
Q303
Q403
Q104
Q204
Q304
Q404
Q105
Q205
Q305
Q405
Q106
Q206
Q306
Q406
Q107
Q207
Q307
Q407
Internet TV
£m
Source: PricewaterhouseCoopers / Advertising Association / Internet Advertising Bureau / WARC

…And be the single biggest medium!?
YOU BET!
!
£
Our current forecast for 2008 is…
£3.6 billion

All of the 118 companies taking part, representing thousands of websites
and to
Our thanks to…
Nicki Lynas, Senior Manager and
Paul Pilkington, Director
Colin Macleod, Research Director
