iata breakfast workshop - icao
TRANSCRIPT

IATA Breakfast Workshop:Air Connectivity - Recent Trends and Implications for Air Transport Policy
Tuesday 3 December
Aqaba, Jordan

Contents
2
The economic and social importance of connectivity 3
Defining and quantifying air connectivity 8
Key trends and findings 13
Towards sustainable air connectivity 18
Policy Implications and discussion 23

IATA’s mission...
“To represent, lead and servethe airline industry”

IATA’s Vision
”Working together to shape the future growth of a safe, secure and sustainable air transport industry
that connects and enriches our world”

5
Aviation supports employment and economic activity

6
Aviation growth creates new opportunities

EconomyAviation
Economic Stimulus
TradeInvestment
TourismR&D
Innovation
Business climate & employment
Passenger demand
Infrastructure
Open Borders
Connectivity
Regulatory Environment
Lower travel costs for passengers
Virtuous circle of connectivity and economic performance

8
What is air connectivity?
PASSENGER AND SHIPPER PERSPECTIVE
POLICY MAKER PERSPECTIVE
AVIATION INDUSTRYPERSPECTIVE
Ability to seamlessly travel by air from ones’ origin to destination in the shortest possible time.
• Degree a city or country is connected to the rest of the world through air travel
• Ability of the aviation network to transport freight particularly in the case of perishable goods and high-tech components; Important for:• Citizens’ social benefits, • Impact on a country’s economy
Important input for business planning- supply chains and partnerships building
Air connectivity refers to the access available to the global air transport network from a country’s major airports.

Direct Connectivity• Reflects direct services available from an airport. • Measured by the number and/or importance of destinations;• Can also consider frequency and/or capacity
Indirect Connectivity• Reflects destinations that can be reached using connecting
flights;• Connections are weighted as a function of quality;• Key factors: connecting time and diversion factor.
‘Hub’ Connectivity• For hub airports, reflects flight pairs that can be connected
taking into acccount mínimum and máximum connecting times. • As with indirect connectivity, connections can be weighted
depending on their quality in terms of diversion factor orconnecting time.
Types of Connectivity

IATA Air Connectivity Index
10
𝑨𝒊𝒓 𝑪𝒐𝒏𝒏𝒆𝒄𝒕𝒊𝒗𝒊𝒕𝒚= ∑ ( 𝑨𝒗𝒂𝒊𝒍𝒂𝒃𝒍𝒆 𝒔𝒆𝒂𝒕𝒔 · 𝑾𝒆𝒊𝒈𝒉𝒕 𝒐𝒇 𝒅𝒆𝒔𝒕𝒊𝒏𝒂𝒕𝒊𝒐𝒏 𝒂𝒊𝒓𝒑𝒐𝒓𝒕 )
3 key elements:
• Frequency
• Available Seats per Flight
• Weighting of destination airport

IATA Air Connectivity Index - Destination Weights
11
0
0.2
0.4
0.6
0.8
1
1.2
PE
K
AT
L
DX
B
HN
D
LA
X
LH
R
OR
D
CG
K
HK
G
PV
G
FR
A
SIN
CA
N
CD
G
IST
DE
L
BK
K
ICN
KU
L
AM
S
DF
W
JF
K
DE
N
MA
D
SF
O
CT
U
SZ
X
ME
X
MU
C
BC
N
YY
Z
BO
M
SE
A
CL
T
SY
D
TP
E
LA
S
KM
G
SV
O
EW
R
Source: IATA Economics

Destination weights as a proxy for indirect connectivity
12
R² = 0.9544
0
200,000
400,000
600,000
800,000
1,000,000
1,200,000
0 10,000 20,000 30,000 40,000 50,000 60,000 70,000 80,000
IAT
A C
on
ne
cti
vit
y U
nit
s
ACI Connectivity Units
Source: IATA Economics based on IATA and ACI-Europe

Connectivity varies widely between world regions
13
49%
28%
42%
17% 65%
38%
0
2000000
4000000
6000000
8000000
10000000
12000000
14000000
16000000
Asia Pacific North America Europe Latin America Middle East Africa
2013
2018
By region- air connectivity (2013 and 2018), and air connectivity growth (2018 vs. 2013)
Growth 2013-2018
Source: IATA Economics

Domestic US and China drive high connectivity
14
Top 20 most connected countries in the world
27%
56%
16%114%
36% 49% 30% 56% 78% 20% 45% 33% 49% 70% 8% 42% 45% 31% 26% 32%
0
1000000
2000000
3000000
4000000
5000000
6000000
7000000
8000000
9000000
2013
2018
Growth 2013-2018
Source: IATA Economics
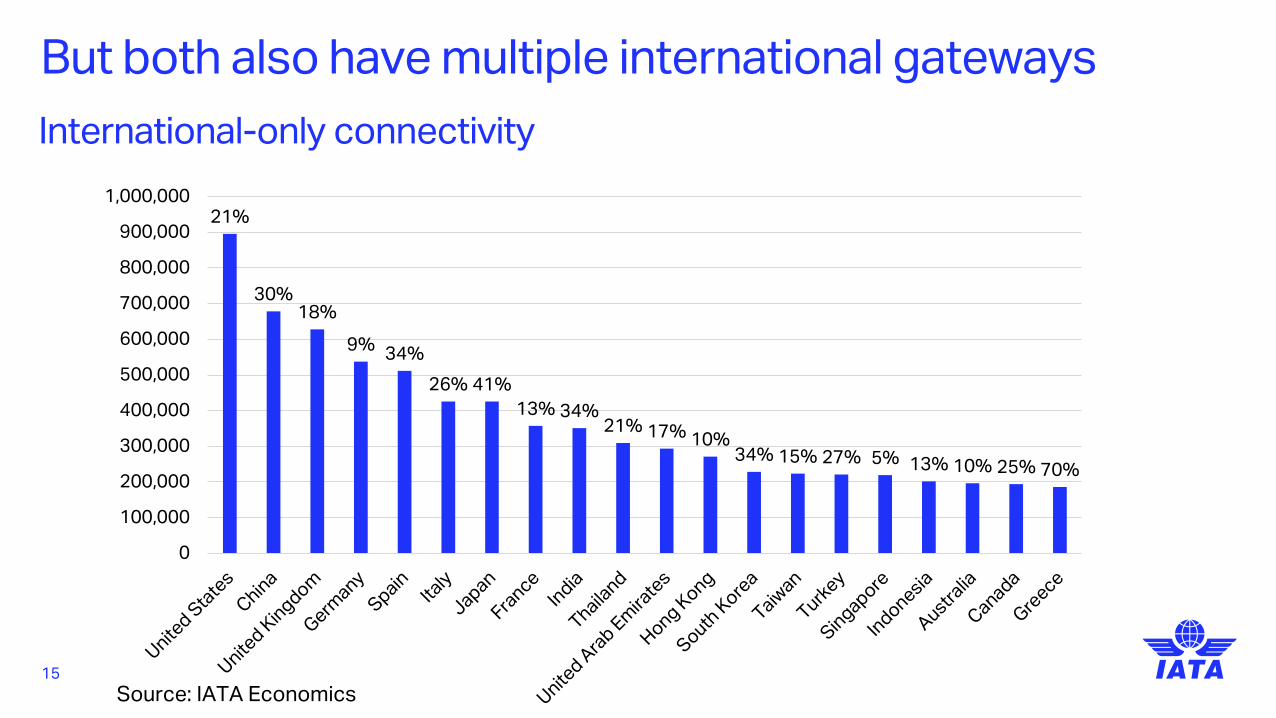
But both also have multiple international gateways
15
21%
30%18%
9% 34%
26% 41%
13% 34%21% 17% 10%
34% 15% 27% 5% 13% 10% 25% 70%
0
100,000
200,000
300,000
400,000
500,000
600,000
700,000
800,000
900,000
1,000,000
International-only connectivity
Source: IATA Economics
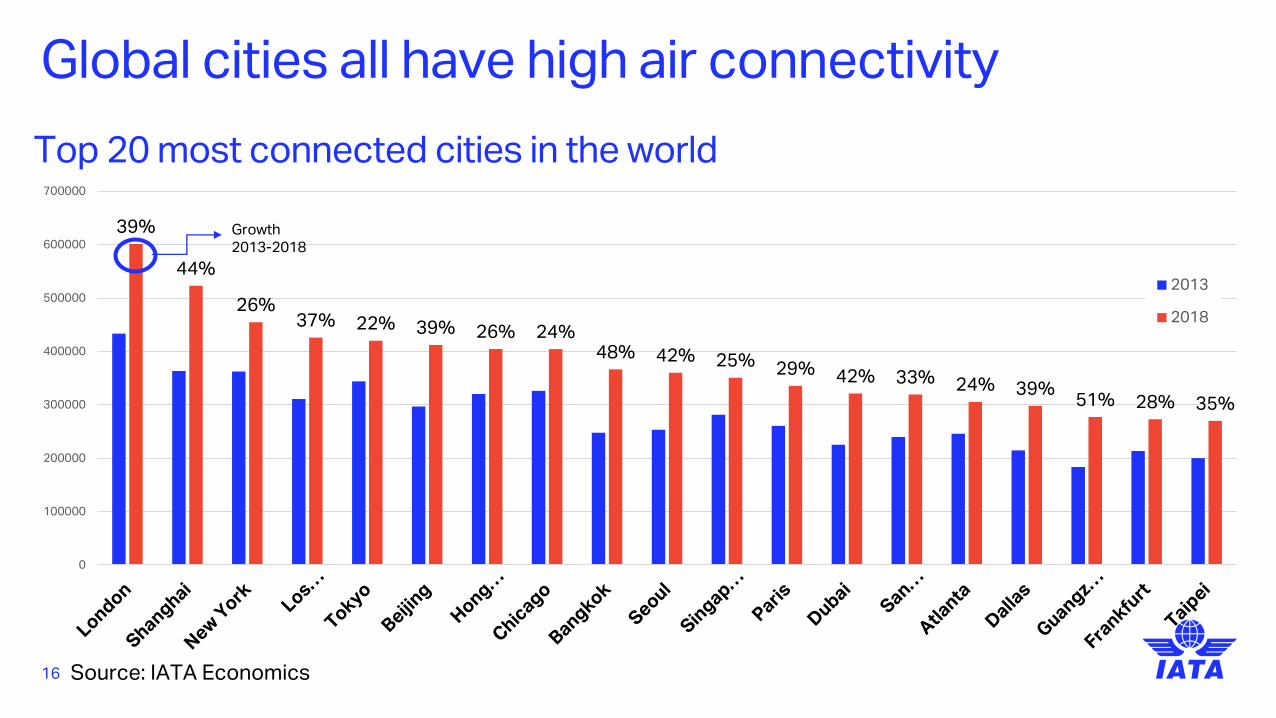
39%
44%
26%37% 22% 39% 26% 24%
48% 42% 25% 29% 42% 33% 24% 39%51% 28% 35%
0
100000
200000
300000
400000
500000
600000
700000
2013
2018
Global cities all have high air connectivity
16
Top 20 most connected cities in the world
Growth 2013-2018
Source: IATA Economics

17
Air transport connects Jordan to the rest of worldJordan’s connectivity at a regional level and how it has evolved
Source: IATA Economics based on SRS Analyzer

18
Air connectivity and climate change
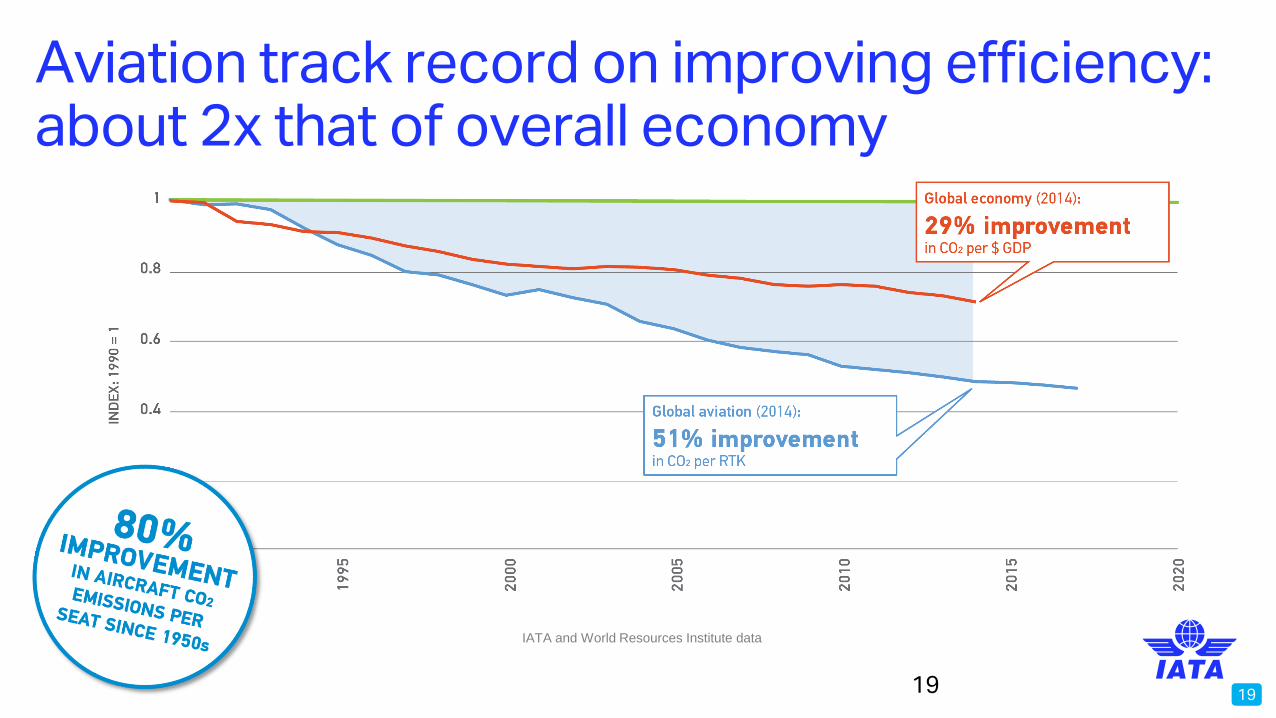
19
Aviation track record on improving efficiency: about 2x that of overall economy
19
IATA and World Resources Institute data

20
Aviation efficiency in numbers

21
3 strategic goals to address climate impacts
21

2222
CORSIA is a key part of the answer

Discussion Questions
23
• What are the major impediments to greater air connectivity?
• What role for policy to influence connectivity outcomes
• What role for global standards, instruments, frameworks?
