ibex global solutions plc · operations with ibm, convergys, 3com corporation, modus media, and...
TRANSCRIPT

ANNUAL REPORT
2016IBEX GLOBAL SOLUTIONS PLC

RESPECT | INTEGRITY | TRANSPARENCY | EXCELLENCE

Table of Contents
Company Information 1
Board of Directors 2
Chairman’s Statement 4
Strategic Report 6
Directors’ Report 17
Corporate Governance Report 24
Statement of Directors’ Responsibilities 26
Independent Auditors’ Report on Group Financial Statements 27
Consolidated Statement of Comprehensive Income 29
Consolidated Statement of Financial Position 30
Consolidated Statement of Changes in Equity 32
Consolidated Statement of Cash Flows 33
Notes to the Consolidated Financial Statements 34
Independent Auditors’ Report on Parent Company Financial Statements 89
Parent Company Statement of Financial Position 91
Parent Company Statement of Changes in Equity 92
Parent Company Statement of Cash Flows 93
Notes to the Parent Company Financial Statements 94

4
4 1
Directors Muhammad Ziaullah Khan (“Zia”) Chishti (Non-executive Chairman)Robert Dechant (Chief Executive Officer)Karl Gabel (Chief Financial Officer)Mohammedullah (“Mohammed”) Khaishgi (Non-executive Director)John Leone (Non-executive Director)Gerhard Johannes (“Gerard”) Kleisterlee (Independent Non-executive Director)Joel Wyler (Independent Non-executive Director)
Corporate Secretary Deena Williamson
Registered Office 3rd Floor5 Lloyds AvenueLondonEC3N 3AE
Registered Number 08462510
Nominated Advisor and Joint Broker
Liberum Capital LimitedRopemaker Place, Level 1225 Ropemaker StreetLondon EC2Y 9LY
Joint Broker Cenkos Securities Plc6.7.8 Tokenhouse YardLondonEC2R 7AS
Legal Advisers to IBEX Global Solutions Plc and subsidiaries (IBEX, IBEX Global, IBEX Group or the Group)
Eversheds LLP1 Wood StreetLondonEC2V 7WS
Auditor to the Group Grant Thornton UK LLPGrant Thornton HouseMelton StreetEuston SquareLondonNW1 2EP
Reporting Accountant Grant Thornton UK LLP30 Finsbury SquareLondonEC2P 2YU
Registrar Capita Registrars LimitedThe Registry34 Beckenham RoadBeckenhamKentBR3 4TU
Public Relations Adviser to the Group
Alma PR Limited37 Dempster RoadLondonSW18 1AS
Website www.ibexglobal.com
Company InformationFor the year ended 30 June 2016

2
For the year ended 30 June 2016
Zia Chishti – Non-executive Chairman
Zia is the Chief Executive Officer (CEO) and Chairman of The Resource Group International (TRGI). He represents TRGI’s 71 percent interest in IBEX Global Solutions Plc (IBEX Global, the Company, the Holding Company or the Parent Company). Zia has served as the Chairman and CEO of Align Technology (NASDAQ: ALGN) which he led from inception to a more than $500 million public valuation. Zia has worked at Morgan Stanley and McKinsey and serves on multiple corporate and non-profit boards. Zia is a graduate of Columbia University and earned an MBA from Stanford Graduate School of Business.
Robert Dechant – Chief Executive Officer
Mr. Robert Dechant is a proven executive in the business process outsourcing and technology industries. He has over 25 years of leadership experience in strategic sales, marketing, client management and operations with IBM, Convergys, 3Com Corporation, Modus Media, and Stream Global Services, Inc.
Prior to joining IBEX Global, Mr. Dechant was the Chief Sales, Marketing and Client Relations Officer at Qualfon Inc., a global business process outsourcing (BPO) provider. In this role, he diversified the client portfolio, implemented new sales and go-to-market processes and established viable nearshore markets, transforming the business into a rapidly growing player in the BPO industry. He also served as the Executive Vice President for Sales, Marketing and Client Services for Stream Global Services, an $850.0 million revenue per year global BPO provider.
Karl Gabel – Chief Financial Officer
Karl joined IBEX Global at the time of its acquisition of Telespectrum Worldwide, Inc. in 2004, where he was Vice President of Finance and was instrumental in the financial restructuring of Telespectrum Worldwide, Inc. prior to its sale. Karl has over 19 years of experience in the contact centre industry, commencing with his first role as Director of Revenue at Telespectrum in 1997. Karl has a B.S. in Accounting from Penn State University and MBA from St. Joseph’s University.
Board of Directors

2 3
For the year ended 30 June 2016
Mohammed Khaishgi – Non-executive Director
Mohammed is Chief Operating Officer of TRGI. He along with Zia Chishti, as Board Directors of TRGI, represent TRGI’s 71 percent interest in the Company. Prior to joining TRGI in 2003, Mohammed was a Senior Director at Align Technology, where he managed Align’s offshore contact centre and back office services operations. He was previously a Senior Investment Officer at the International Finance Corporation (private sector investment arm of the World Bank) where he was responsible for investments in the Asian telecommunications and technology sectors. Mohammed has a B.S. degree in Electrical Engineering from University of Engineering and Technology in Lahore, Pakistan, a B.A. degree in Philosophy, Politics and Economics from the University of Oxford where he was a Rhodes Scholar and MBA from Harvard Business School.
John Leone – Non-executive Director
John Leone is a Non-executive Director of the Company. John Leone is the Managing Director of PineBridge Investments, an investor in TRGI. John works on sourcing, negotiating and executing private equity transactions in Europe, Latin America, the Middle East and Africa. Prior to this role, John was General Counsel of PineBridge Investments’ Emerging Markets Private Equity operations. Earlier in his career, John was an attorney at Kirkland & Ellis LLP where he focused on advising private equity clients. John earned a Juris Doctor, with High Honours, from The George Washington University Law School where he was a member of the Law Review, and a Bachelor of Arts, Magna Cum Laude, from the State University of New York at Binghamton.
Gerard Kleisterlee – Independent Non-executive Director
Gerard Kleisterlee is an Independent Non-executive Director of the Company. He is Chairman of Vodafone Group Plc. A Non-executive Director and member of the Audit Committee and Chair of the Remuneration Committee of Royal Dutch Shell and Chairman of the Supervisory Board of Dutch Technology Company ASML A former member of the Supervisory Board of Daimler AG, and of the Board of Directors of Dell Inc. He was President, CEO and Chairman of Royal Philips Electronics from 2001 to 2011.
Joel Wyler – Independent Non-executive Director
Joel Wyler is an Independent Non-executive Director of the Company and, currently, he is the Chairman of Granaria Holdings, a global investment company. He is an entrepreneur with a broad range of knowledge and experience in operating, manufacturing, trading, shipping and logistics companies internationally. He is a director of Rainbow Medical Ltd, and Aegate Holdings, Ltd. Joel is a partner of ACPI Investments, Ltd, member of the Advisory Board of SatMap, Inc. d/b/a Afiniti, and a Board Member of Cocon Vastgoed B.V. Joel was appointed Officer of the Order of Orange Nassau in 2000 and Chevalier de la Legion d’honneur in 2009.
Board of Directors

4
For the year ended 30 June 2016
Dear fellow shareholders,
I am pleased to announce this set of strong results, which marks the first full year under Bob Dechant’s stewardship, and shows excellent progress in all key metrics across the Group as we continue to deliver efficiently against our growth strategy announced in February 2016. Our financial performance reflects not only very encouraging growth in volumes with existing clients, but also, importantly, an expansion in our client base. This success has been delivered through a combination of continued investment in front line call centre agents and new facilities, as well as the hard work and dedication of all our employees.
Financial Results
Revenues in the year to 30 June 2016 were $255.5 million, representing strong improvement compared with the previous year (2015: $238.8 million) and adjusted EBITDA (excluding share-based payment, exceptional items and other income) was $17.9 million (2015: $16.6 million), reflecting growth of 7.0% and 7.8%, respectively. Profit before tax was $7.1 million (2015: $7.2 million).
Operationally, previous investment in the Group’s infrastructure continues to deliver improved efficiencies and capabilities which allow us to provide, we believe, world-class services to our growing client base. The Group performed well in each of its chosen geographies with a strong improvement in our Offshore operations in the Philippines. We also expanded our business into the Nearshore regions of Nicaragua and Jamaica launched mid-year and then took the strategic decision to invest further in our Jamaica facility, following greater than expected client demand. Whilst this investment resulted in an increase in capex and impacted negatively on EBITDA, the investment should lead to increased revenues and margins in fiscal year 2017 and beyond. A further pleasing trend, now consistently represented across reporting periods, has been the winning of new blue chip clients. We believe this highlights IBEX’s growing presence as the provider of choice amongst the most successful class of global businesses.
Dividend
The Board hereby indicates its intent to pay final a dividend of 6.6 cents per share, representing a total dividend for the year of 11.7 cents per share. The final dividend will be declared ahead of the Annual General Meeting, and expected to be paid before the end of the calendar year, in line with previous periods.
Share Buyback
In accordance with the terms of the general authority to make market purchases of the Company’s own shares granted to it by shareholders of the Company on 20 November 2015, and the announcement made by the Company on 24 August 2015 to extend the period for making purchases of its own shares until such time as the Board shall choose to terminate for a total up to $1.0 million, the Company acquired for cash in the market 39,082 ordinary shares in the capital of the Company for treasury from 19 March 2015 to 30 June 2016 at a price of 72 to 130 pence per share. IBEX will continue to make additional purchases of its own shares in line with the above general authority where the Board considers that it is appropriate to do so. The buyback affirms the Board’s confidence in the Group’s prospects and market position.
Chairman’s Statement

4 5
For the year ended 30 June 2016
Management and Staff
Given the nature of our business, IBEX’s success depends on the continued dedication and hard work of its employees at all levels across the Group, from the Board to our contact centre workers who provide excellent service to our client’s end customers. I would like to thank all IBEX employees for their continuing commitment to our ethos and congratulate them on their collective achievement as we continue to drive our business forward.
Corporate Governance
The Board remains focused on strong corporate governance, including nurturing a culture in which our people behave in accordance with our values, which is fundamental to building a business that can deliver sustainable, profitable growth. I believe that our continued commitment to business integrity, sustainability and governance is important to our business.
The Company’s statement on corporate governance can be found in the Corporate Governance Report on pages 24 to 25.
IBEX is well-positioned to continue on its successful path and deliver world-class services for clients, opportunity for employees and growing shareholder value and returns. We look forward to the future with confidence.
Best regards,
Muhammad Ziaullah Khan ChishtiChairmanDate: 27 September 2016
Chairman’s Statement

6
For the year ended 30 June 2016
IBEX Group (“IBEX Global”, “IBEX”, “we”, or “our”) is a global provider of customer interaction solutions with facilities in the United States, Philippines, the United Kingdom, Pakistan, United Arab Emirates, Senegal, Jamaica and Nicaragua servicing Fortune 1000 and industry-leading companies around the world. Its service offerings include business and consumer customer care support, inbound and outbound telesales and technical support services. The Company provides these across an Omni Channel medium including voice, chat, email, SMS and social media. IBEX Group also offers enabling technology solutions including Intelligent Call Routing powered by Afiniti,Interactive Voice Response (IVR) and a suite of outbound dialers.
Business and Financial Review
IBEX delivered a strong performance, both operationally and financially, during the fiscal year 2016. Operational improvements and strategic investment not only helped us to achieve significant increases in both revenues and profitability for the year under review but have also placed us in a strong position for further, continued growth in the years to come. The Group’s organic growth, consistently delivered over successive periods, has continued to outperform industry averages and reflects the advantages of our business model. As a Group we are focused on enhancing IBEX’s position as preferred BPO provider verses our larger competitors by delivering superior services to our clients and maintaining high levels of client satisfaction. We repay the confidence they show in us by helping them to better service their own end customers. This approach not only grows volumes with existing clients but also provides the Group with a steady stream of new client wins.
Key Financial Performance Indicators (KPIs)
The principal KPIs used by the Board in measuring the performance of the Group continue to be Revenue, Cost of Sales, Selling, General & Administrative (SG&A) expenses, Adjusted EBITDA, Net Income and Net Debt.
It is important to note that the comparative figures for 2015 included considerable one-off project revenues of $5.2 million. Therefore, we have also included the comparative figures excluding those revenues in the proforma column below to provide an illustration of the ongoing, repeatable business of the period against 2015.
Strategic Report

6 7
For the year ended 30 June 2016
Proforma*
30 June 2016 30 June 2015 30 June 2015Continuing Operations $’000s $’000s $’000sRevenue 255,510 238,806 233,590Cost of sales 213,225 200,027 200,027Less depreciation and amortisation (9,080) (6,946) (6,946) 204,145 193,081 193,081
Adjusted gross profit 51,365 45,725 40,509Adjusted gross profit margin 20.1% 19.1% 17.3%
SG&A 34,539 30,017 30,017Less depreciation and amortisation (1,103) (851) (851) 33,436 29,166 29,166Adjusted EBITDA 17,929 16,559 11,343Adjusted EBITDA margin 7.0% 6.9% 4.9%Depreciation and amortisation,
exceptional items, finance costs, share based payment, income tax and other income 11,443 10,146
Net income 6,486 6,413Net income margin 2.5% 2.7%* excluding $5.2 million one-off project revenue relating to expansion of one of major clients
30 June 2016 30 June 2016$’000s $’000s
Borrowings 38,701 21,609Cash and cash equivalents (6,245) (3,011)Net debt 32,456 18,598
The Income Statement KPIs above are in line with the Board’s expectations.
Revenue for the year grew 7.0% to $255.5 million (2015: $238.8 million), or by 9.4% when excluding one-off items in the prior year (2015: $233.6 million). Whilst the growth in revenues was driven primarily by increasing business from our existing client base, of which our top four clients grew at 5%, the overall percentage of revenue contributed by them decreased slightly, a trend that we will look to continue as we attract further clients across various geographical and industrial verticals.
Adjusted EBITDA was 7.8% ahead of last year at $17.9 million (2015: $16.6 million). The main reason for this is the delivery against the Group’s strategic objectives which has resulted in improved operations, driving greater efficiencies and also in concentrating on higher margin areas of growth. The Company sees the expansion of its presence in both the Offshore and Nearshore markets as a key part of its strategy to achieve double digit Adjusted EBITDA margins and will look to build a greater proportion of business in its Offshore and Nearshore markets.
Strategic Report

8
For the year ended 30 June 2016
As announced on 14 July 2016, Adjusted EBITDA was impacted by two factors, the Group’s strategic decision to build its own facility in Jamaica in the fourth quarter to cater for excess client demand, and separately a merger between two existing clients which created higher than anticipated operating costs while we converted to a new integrated delivery model in the US region in the second half of the year. The Group expects to benefit from the Jamaica investment from the current period onwards, whilst the costs relating to the merger were a one-off event.
Profit before tax for the year slightly declined to $7.1 million; however on a proforma basis excluding one-off items, increased 255% (2015: $7.2 million) with earnings per share slightly higher than the prior year at 16.37 cents (2015: 16.19 cents). Net debt (third party borrowings less cash and cash equivalents of $6.2 million) at the end of the year increased to $32.5 million (2015: $18.6 million), primarily through greater utilisation of line of credit due to decelerated receivables towards the close of financial year.
Operational Review
The Company has stated its target of achieving double digit EBITDA margins while developing the Company into a more repeatable and predictable business. I am pleased to report that we have made solid progress on these fronts. Importantly, as well as delivering improved financial performance for the year under review we believe we have made strategic investments in the business which will continue to provide further improvements to both the top and bottom line in the years to come.
In particular, the Group has had great success in improving and expanding its Offshore and Nearshore operations with over 1600 seats of new capacity, both of which contribute higher margin. Our sales and client facing teams have had great success in selling over 75% of this new capacity.
Nearshore operations were successfully established in the year in both Jamaica and Nicaragua with two blue chip clients launching in each of these territories with over 1100 seats of new capacity. Our Jamaica operations were initially established in conjunction with a partner. However, it soon became evident that the opportunity in that geography was significant enough to warrant further investment. As such, the Group took the strategic decision to exit its partnership relationship with a local Jamaican operator and build its own 720 seat facility which became operational on 1 July 2016. Whilst this had an impact on the year’s EBITDA performance as a result of paying higher fees to the partner for the early exit and the associated costs for the buildout of our new facility, we believe it will prove of great benefit over the coming years. The facility provides IBEX with additional capacity to look after additional client operations in the current period and beyond with minimal additional capex required. Our Nicaragua business operations, with 450 seats of capacity, extends our capabilities to provide very good bilingual English and Spanish services (a key offering to clients providing goods or services to the Hispanic population) and has gone through successful launches whilst having ample capacity for growth for FY17.
In total, revenues from the Offshore and Nearshore operations totalled 39% of Group revenue compared with 28% in 2015. In order to achieve our target of double digit EBITDA margins, the Group will look to further increase the proportion of Group revenue that comes from Offshore and Nearshore operations, both through increasing the volume of work executed and clients in those geographies but also through maximising the efficiency and output of our US operations.
Our International business made good strides as well. In the second half of the fiscal year, we began efforts in transforming our Senegal operations to be a new, low cost alternative to support the French market. We believe this market to be a viable alternative to the Tunisia and Moroccan geographies with competitive labour rates, great French speaking skills, and limited competition. Investments were also made in improving and expanding our facilities in Pakistan. These investments paid off quickly as we were able to win significant business with a major mobile/telco operator in Pakistan at the end of the period which we expect to make a positive impact in the current period.
Strategic Report
8 9
For the year ended 30 June 2016
The Company also made great strides in improving important operational KPI’s across the Group. Our agent employee satisfaction – the key driver for success – for FY16 measured at 92% companywide with the Philippines leading the way at 96% satisfied. This stronger focus on employee engagement in particular at our Offshore operations in the Philippines helped to greatly improve our agent retention rates, which naturally resulted in a much better performance. We believe that during the course of this year we have been able to build our Philippines operations into being best-in-class and we are confident that we will continue to see a strong performance in the coming years.
As the Group continues to grow and expand the vertical and geographical markets which we serve, it is important that we continue to invest into the business and get the right experience and talent in place. I am therefore delighted that on 17 August 2016 Bruce Dawson was appointed as our Chief Sales and Client Services Officer. Bruce joined us from Atento, one of the major global players in our industry, where he was Director of Nearshore and US. Bruce’s experience will help us to build an industry best sales engine and client management model whilst our ability to attract somebody of his calibre also underlines our growing standing in the market place. This key appointment will enable Julie Casteel to focus on Strategic Client Relationships and Marketing for the Company as we continue to define our unique position in the market.
Analysis of our revenue growth by clients shows a pleasing mix of additional work by our existing client base, which we believe reflects their growing confidence in our abilities, as well as a number of new clients, which will support our growth and performance beyond the current reporting period and enable us to become less dependent on our top few clients.
With regards our existing client base, revenue growth was underpinned by:
• A global telecommunications provider where we were able to expand geographically into the Philippines and Nicaragua as well as expand Line of Businesses (LOBs) support. The result was a near threefold increase in volume and agents and was pursuant to a series of acquisitions by our client.
• A leading client in the television services and broadband internet industry expanded its business sourced from IBEX by adding a supplemental line of business serviced by the Group’s US and Philippines sites as well as launching in its new Jamaica site.
Of note within the new customer wins, contracts were signed with four large companies, spanning the insurance, home solutions and transportation services industries. Several of these new clients have already expanded with us into new geographies. These wins continue to highlight our value proposition of delivering great performance for our clients across many different markets at competitive price points. We remain committed to our investment in new business development across a diversified set of verticals and we will look to grow our base of new clients in the coming quarters.
More widely, IBEX’s remains committed to its business model - what we call the virtuous cycle. This is the sourcing of front-line agents of unparalleled quality, delivering superior performance in our service offering and therefore growing the delivery volumes with the existing client base. IBEX also invests in an on-going, robust business development effort in order to win a regular stream of new clients and we aim to repeat this cycle, year-on-year.
IBEX benefits from a lean, efficient operating overhead structure. Our SG&A adjusted for depreciation is at 13.1% of revenues, which is generally lower than the 15-28% expected from our competitors. Consequently, IBEX has a strong operating leverage associated with its business model. This, coupled with a focus on the excellence of our operational execution, means that clients entrust greater portions of their outsourcing spend to IBEX.
Strategic Report

10
For the year ended 30 June 2016
Our Marketplace and Outlook
The customer contact management industry is highly fragmented. The size of the outsourced portion of the customer contact management industry worldwide was estimated at approximately $64.0 billion in 2014, according to International Data Corporation (“IDC”), an industry research firm. IDC also estimates that the outsourced portion of the customer contact industry is expected to grow to approximately $81.0 billion by 2018, a compound annual growth rate of 6.1% from 2014 to 2018. According to Ovum, an industry research firm, it is estimated that no single outsourcer has more than five percent of the total agent positions worldwide.
The Board believes that IBEX provides the ideal alternative to the largest providers in the industry with our extensive footprint, robust offerings, exceptional service delivery model, complemented with speed and flexibility. As a result over the last several years, IBEX has consistently achieved greater than market growth and we anticipate this year will provide further opportunities. Our core clients continue to deliver growing volumes and additional services to us and we remain confident that our sales and client teams will deliver new client wins which will diversify our revenue streams, in line with our strategy.
The improvement in our Philippine operations has been pleasing and we are excited by the opportunities available at our Nearshore operations. Additionally, our International operations should benefit further in the current fiscal year from the launch with a major mobile/telco client in Pakistan which took place in June 2016. The increased capex investment this year should benefit the Group in the coming years as we fill the additional capacity it has created. Whilst we would expect capex spend to be lower in the current fiscal year, the Board will continue to take advantage of strategic opportunities which present themselves, such as our decision to build our own facility in Jamaica, to maximise the benefit for all stakeholders in the coming years.
We have a positive trajectory as we move into the new fiscal year. The success that we had in engineering a stronger business and management team is positioning us for success in fiscal year 2017. Whilst our clients continue to refine their strategies and their geographies within which they choose to operate, we believe that the overall business is on a good footing to meet our client requirements. We anticipate the majority of our growth to be driven in our Offshore and Nearshore regions, and the investments we have made to strengthen our sales team are seeing early positive returns. In early August, we launched in the Philippines with a new strategic client who is a leader in the Television and Media services. Additionally, we are gearing up for a major launch in our Jamaica centre with a Fortune 25 client in late September. Whilst these are new relationships, it is reinforcement that our value proposition is strong, our reputation is growing, and our future is very bright.
The Board of IBEX recognises that changes to the macro-backdrop can quickly affect the business. Whilst regulatory and legislative issues, the 2016 U.S. Presidential election, and various new minimum wage statutes at state and federal levels may impact on the US economy, we are confident in our business and our team’s ability to successfully deal with any challenges we encounter and continue to build upon our business.
Our goal is to continue to grow faster than the market whilst improving our bottom line performance. We firmly believe we can deliver on this. The Group has begun the new fiscal year well and with our focus on people, product and execution, the Board looks forward to the future with confidence.
Our workforce continues to be our most critical asset in delivering outstanding results for our clients. Our success depends on our growing network of associates, which currently numbers more than 15,500 across the world, and we thank them all for their passion in delivering exceptional services. IBEX will continue to invest in the talents and skill sets of our world-class workforce and provide employees with the best opportunities to reach their ambitious professional goals. We believe that a commitment to our people is a commitment to performing extremely well for our clients.
Strategic Report

10 11
For the year ended 30 June 2016
Principal Risks and Uncertainties
The Group cannot be certain that its business strategy will be successful or that it will successfully address these or other risks that may become material. The Group’s failure to address any of the risks described below could have an adverse effect on its business.
Client Concentration
The Group’s business relies on relationships with a limited number of clients and any deterioration of the Group’s relationship with any particular client could have a material adverse effect on the Group’s performance. Furthermore, mergers and acquisitions associated with IBEX Group’s client base could have a material adverse effect on the Group’s performance. Our relationships with our largest clients have multiple engagements, span many geographies and sites and across several lines of business. The contracts we have typically have different termination dates. That being said, although we have a good track record of contract extensions and evergreening, there can be no assurances this will continue.
As such, the Company has made client diversification one of its most important platforms. The Company’s executive management and Board continually monitors the progress of new client wins and the performance and health of the relationships with its largest clients.
Tax
IBEX enjoys an overall effective tax rate of 9-16 percent, given a tax-efficient corporate and legal structure. There is a risk that amounts paid or received under intra-group arrangements in the past or in the future could be deemed for tax purposes to be lower or higher, as the case may be, or be disregarded for the purposes of calculating tax, which may increase the Group’s taxable income or decrease the amount of relief available to the Group with a consequential material negative effect on its financial and operating results.
Following the UK’s decision to exit the European Union (EU), management is in the process of evaluating the overall tax impact for the Group. There is some uncertainty as the UK still has two years to finalise the details and negotiate its trade agreements before it withdraws from the EU. At this stage, management does not expect a significant increase in overall tax rate subsequent to the UK’s exit from the EU.
Operations in International Markets
As the Group has its operations in overseas territories, the Group has and expects to become increasingly subject to diverse local legal and regulatory requirements. Violations of these laws and regulations could result in fines and/or criminal sanctions against the Group, its officers and employees, as well as challenges to its ability to conduct its business and its ability to offer products and services in one or more countries. Such challenges could delay or prevent potential acquisitions and materially damage the Group’s reputation, brand, international expansion efforts, ability to attract and retain employees and operating results.
The Group’s success depends, in part, on its ability to anticipate these risks and manage these difficulties.
The Group is also subject to a variety of other risks and challenges in operating in various countries, including but not limited to: challenges caused by distance, language and cultural differences; general economic conditions in each country or region; fluctuations in currency exchange rates; regulatory changes; political unrest, terrorism and the potential for other hostilities; longer payment cycles and difficulties in collecting debts; overlapping tax regimes; the ability to repatriate funds held by international subsidiaries at favourable tax rates; difficulties in transferring funds from certain countries; and reduced protection for intellectual property rights in some countries. If the Group is unable to manage the international aspects of its business, its operating results and overall business may be significantly and adversely affected.
Strategic Report
12
For the year ended 30 June 2016
As such, the Group continues to monitor the relevant regulatory, geopolitical and other risk factors related to our operations outside of the United States. Additionally, we work closely with our clients to de-risk this by placing business across multiple regions, markets, and sites. However, we cannot assess with certainty what impact such risks are likely to have over time on business and can provide no assurance that we will always be able to mitigate these risks successfully and avoid material impact to our business and results of operations.
Ability to Recruit, Compensate and Retain Skilled Personnel
The Group’s performance is dependent on the talents and efforts of its agents; therefore the ability to compete effectively in the Group’s business and expand into new businesses and geographic areas depends on the ability to attract new talent and retain and motivate existing employees. Factors that can affect the Group’s ability to attract and retain employees include the compensation and benefits offered to employees as well as its reputation as a successful business in fairly treating and motivating its employees. Competition in the call centre industry and in the geographies where the Group’s call centre businesses are located can be intense. Although the Group believes that it has appropriate incentive structures and employee engagement to attract and retain the calibre of employees necessary to ensure the efficient management and development of the Group; any difficulties encountered in hiring and retaining appropriate employees may have a detrimental effect on the trading performance of the Group.
Changes in federal, state, local and international laws or failure to comply with certain laws could increase costs, reduce margins and lower sales.
The Group’s business is subject to laws and regulations in the United States and other countries in which it operates. Significant workforce-related legislative changes could increase expenses and adversely affect operations. In addition, the Group’s failure to comply with applicable laws and regulations including wage and hour laws, data security, the Foreign Corrupt Practices Act and local anti-bribery laws, could subject the Group’s business to legal risk including government enforcement and class action civil litigation, which could adversely affect operations by increasing costs, reducing margins and lowering sales. Changes in U.S. federal, state and international laws relating to outsourcing of jobs to foreign countries may adversely impact our ability to provide services from these locations. The Group’s compliance group and outside advisors monitor the changing laws, where possible.
Rapid growth
In order to manage the further expansion of the Group’s business and the growth of its operations and personnel, the Group may need to expand and enhance its infrastructure and technology, and improve its operational and financial systems and procedures and controls from time to time in order to be able to match that expansion, as well as procure working capital financing. There can be no assurance that the Group’s current and planned personnel, infrastructure, systems, procedures and controls will be adequate to support its expanding operations in the future or that the Group will be able to source the working capital financing required for further growth. If the Group fails to manage its expansion effectively, its business, operations and prospects may be materially and adversely affected. As such the Company will be moving its infrastructure to a hardened, commercial grade co-location facility that will provide significant expandability and 99.999 uptime.
Technological changes and advances
The industry has a history of technological advances to improve the customer experience or costs associated with providing services. Technological advancements in voice recognition software, web-based help, chatbots, and call avoidance technologies, have the potential to adversely impact call volume. As these technologies come to market for simple customer transactions, this will place requirements on us to provide more complex services and will require us to provide adequately training personnel.
Strategic Report

12 13
For the year ended 30 June 2016
Competition
Current and potential competitors of the Group may have substantially greater financial, technical and marketing resources, longer operating histories, larger customer bases, greater name recognition and more established relationships than the Group and so may be better able to compete in the Group’s target markets.
Risks Relating to Data Security and Potential Cyber Attacks
The Group’s operations depend on a complex combination of technology networks and systems, comprising hardware, software, and telecommunications including dependency on third-party systems and services. Internal or external cyber attacks on any the Group and/or any third party network and/or system could disrupt call centre operations and adversely affect the Group’s ability to meet key performance standards, which could result in liability under its client service agreements or in loss of clients. Moreover, the Group’s business involves use, storage and transmission of data about clients, customers of clients, and employees. In addition, laws governing data privacy are continually evolving and sometimes conflict among various jurisdictions where the Group operates. Negligent or intentional breach of data security controls, or misuse or misappropriation of confidential data, or failure to comply with applicable law, could result in damages, fines, penalties or criminal prosecution. Any such breach, misuse or misappropriation could also result in negative publicity and damage to reputation, loss of clients, or other material adverse effects. The Group has a security platform protecting its systems and confidential data, and it updates the platform periodically. The platform includes compliance with the PCI Data Security standard in the Group’s call centres locations. However, it is possible that the security platform may not prevent improper access to or disclosure of confidential data including over the internet. The Group maintains cyber insurance coverage, and reviews and updates the coverage at least annually. There can be no assurance, however, that available insurance will be adequate to cover losses that may occur.
In March 2015, IBEX US received a notice from one of its major clients of a claim for indemnification under applicable client service agreements. This notice resulted from a data security breach that occurred during late 2014 at one of the Group’s call centres. IBEX and the client had cooperated to investigate the problem and take appropriate remedial action. There was no evidence of any financial loss to any customer of the client. Taking into account the facts and circumstances known at this point, together with applicable insurance coverage, IBEX US believes that this potential indemnity claim should fall within the applicable insurance policy limitations.
Stock Price Volatility
IBEX’s share price has fluctuated in the past and may continue as such in the future in response to various factors. These factors, in addition to reported results of our operations, may include changes in economic, political, social or environmental fabrics of the countries we are situated in, which may or may not be directly related to our business; general or industry-specific market conditions; volatility in major financial markets; revision in trends of risk assumption; fundamental analysis of geographical diversity of our business and segments thereof; regulatory announcements by us or competitors about developments in current business or prospects; projections or speculation about our business or that of competitors by the press or investment analysts; and our ability to generate distributable cash flow to return to our shareholders in the form of dividend at historical or expected levels.
Third Party Service and Outsource Providers
The Group depends on third-party suppliers and outsourcers for a variety of services including our telecommunications and data network. If these third party services were interrupted in the provision of supplies and/or services, it could impact our ability to meet client demand, damage our reputation and client relationships and adversely affect our revenue and profitability.
Strategic Report
14
For the year ended 30 June 2016
Financial Risks
The Group’s activities expose it to a variety of financial risks:
• Interest rate risk
• Foreign currency risk
• Credit risk
• Liquidity risk
Interest rate risk
Interest risk is the risk that the value of the financial instrument will fluctuate due to changes in the market interest rates. The Group is exposed to interest rate risk in respect of borrowings and bank balances. Effective interest rates and maturities are given in applicable notes to the consolidated financial statements.
Foreign currency risk
Currency risk arises mainly where receivables and payables exist due to transactions entered into foreign currencies. The Group primarily has foreign currency exposures in Pakistan Rupee, Pound Sterling, CFA Franc (XOF), Philippine Peso, Jamaican Dollar and Nicaraguan Cordoba. However, the majority of the transactions of the Group are denominated in United States Dollar (US$) and recognised by Group entities that have a functional currency of US$. Accordingly, foreign currency exposure is not significant to the Group’s financial position and performance.
Concentration of credit risk
Financial instruments which potentially expose the Group to concentrations of credit risk consist primarily of cash and cash equivalents and accounts receivable. The Group’s cash and cash equivalents are held with US and foreign commercial banks. The balance at times may exceed insured limits.
Liquidity risk
The Group leverages the Revolving Line of Credit with PNC Bank, National Association to fund its working capital cycle as necessary. This credit, together with cash generated through operations, enable the Group to meet its working capital needs. In addition, the Group’s receivables financing agreement with Citibank, N.A. has enabled it to accelerate cash collections from a major client during financial year 2016. However, the Group’s operating plan for financial year 2016-17 incorporates a number of business assumptions which may not materialise as expected. As a result, the Group may take necessary measures including seeking additional financing or implementing a reduced spending plan to fund its continued operations.
Risk Management System
The risk management objective of IBEX is to identify, minimize, mitigate and prevent risks within the business (both externally and internally) and within the Company’s various departments such as operations, finance, technology and human resources. The risk practices seek to enhance long-term competitive advantage to the Group and to protect the business and its customers.
Indemnities, Commitments and Guarantees
From time to time, during the normal course of business, the Company may make certain indemnities, commitments and guarantees under which it may be required to make payments in relation to certain transactions. These include, but are not limited to: (i) indemnities to clients, vendors and service providers pertaining to claims based on negligence or wilful misconduct of the Company and (ii) indemnities involving breach of contract, failure of service, data breaches; the accuracy of representations and warranties
Strategic Report

14 15
For the year ended 30 June 2016
of the Company, or other liabilities assumed by the Company in certain contracts including SLA service failures. In addition, the Company has agreements whereby it will indemnify certain officers and directors for certain events or occurrences while the officer or director is, or was, serving at the Company’s request in such capacity. The indemnification period covers all pertinent events and occurrences during the officer’s or director’s lifetime. The maximum potential amount of future payments the Company could be required to make under these indemnification agreements is unlimited; however, the Company has director and officer insurance coverage that limits its exposure and enables it to recover a portion of any future amounts paid subject to standard insurance exclusions. The Company believes the applicable insurance coverage is generally adequate to cover any estimated potential liability under these indemnification agreements. The majority of these indemnities, commitments and guarantees do not provide for any limitation of the maximum potential for future payments the Company could be obligated to make. The Company has not recorded any liability for these indemnities, commitments and guarantees. In addition, the Company has some client contracts that do not contain contractual provisions for the limitation of liability of different types of damages, and other client contracts that contain agreed upon exceptions to limitation of liability. The Company has not recorded any liability with respect to any client contracts under which the Company has or may have unlimited liability.
Incentivising Key Staff
Traditionally, staff churn is a challenge for operators in our industry because the training of staff to make them effective can be both costly and time-consuming. For a BPO solution to be competitive, the staff involved in dealing with customers’ needs must know their business extremely well and be able to deliver our clients’ aspirations for customer service to very high standards, every time.
IBEX understands that the retention and motivation of staff are absolutely crucial to our success. Attrition has a disproportionate impact on Group profitability, both through the cost of replacement training and through foregone margin associated with a departing employee. The Directors believe that employees with longer tenures are more likely to perform better, thereby improving client metrics and more easily growing the Group’s share of the client’s outsourcing spend.
To this end, the salaries we pay are sometimes above the industry average in each country in which we have operations. Additionally, our employees are afforded opportunities to progress their careers as we grow the business. We believe employee career development is inextricably linked to the success of the Group. In order to further enhance these principles, IBEX used the Alternative Investment Market (AIM) admission to offer an equity incentivisation plan. The IBEX equity reward scheme is therefore not limited to the Board and senior management, but is also offered to nearly all manager-level individuals in the organisation. This represents a significant point of differentiation in the BPO marketplace and the overall incentivisation package IBEX Group provides, which will help safeguard the services we offer to our clients.
Customer Service
We are acutely aware that our clients entrust IBEX with key customer support functions, thereby outsourcing mission-critical parts of their business operations. Given the impact we have on our client’s reputation, we know that customer service is a key differentiator in the marketplace, and represents a key aspect of how we manage our business. We are also aware that merely performing against our client’s requirements is the bare minimum of what we can achieve on each client’s behalf.
Therefore, after taking care of our workforce, we turn our attention to outperforming against client requirements. It is this approach, consistently applied, which differentiates us from the competition, and means that household names use us to protect and cultivate their relationships with their end customers. Overall, we want our clients to know that IBEX is dedicated to generating the best outcomes of customer satisfaction on their behalf. In each case, the metrics by which clients measure the value we add to their operations are examined almost daily. We are diligent when it comes to ensuring client satisfaction and the business is set up to improve constantly on our already proven success.
Strategic Report
16
For the year ended 30 June 2016
Technology
IBEX uses state-of-the-art systems to service our clients’ needs and deliver the best possible service for each of them. We have continually improved our infrastructure through investment to make sure that we run as efficiently as possible and provide the exceptionally high levels of service which our clients have come to expect.
The world of technology and connectivity moves very quickly. To that end, IBEX sees the improvement of its systems as an on-going priority for the Group. By applying the latest technology developments available to us, we can continually ensure that our system capability is world class. We not only make sure that we are operating existing technology as efficiently as possible, but we are always looking for ways in which we can innovate within our client delivery models. This provides us with a strategic advantage over our rivals and keeps us competitive in the market.We would like to thank our shareholders, clients, employees and Board members for your confidence and support.
The strategic report was approved by the Board of IBEX Global Solutions Plc and signed on its behalf by:
Robert Dechant Karl GabelChief Executive Officer Chief Financial OfficerDate: 27 September 2016 Date: 27 September 2016
Strategic Report
16 17
For the year ended 30 June 2016
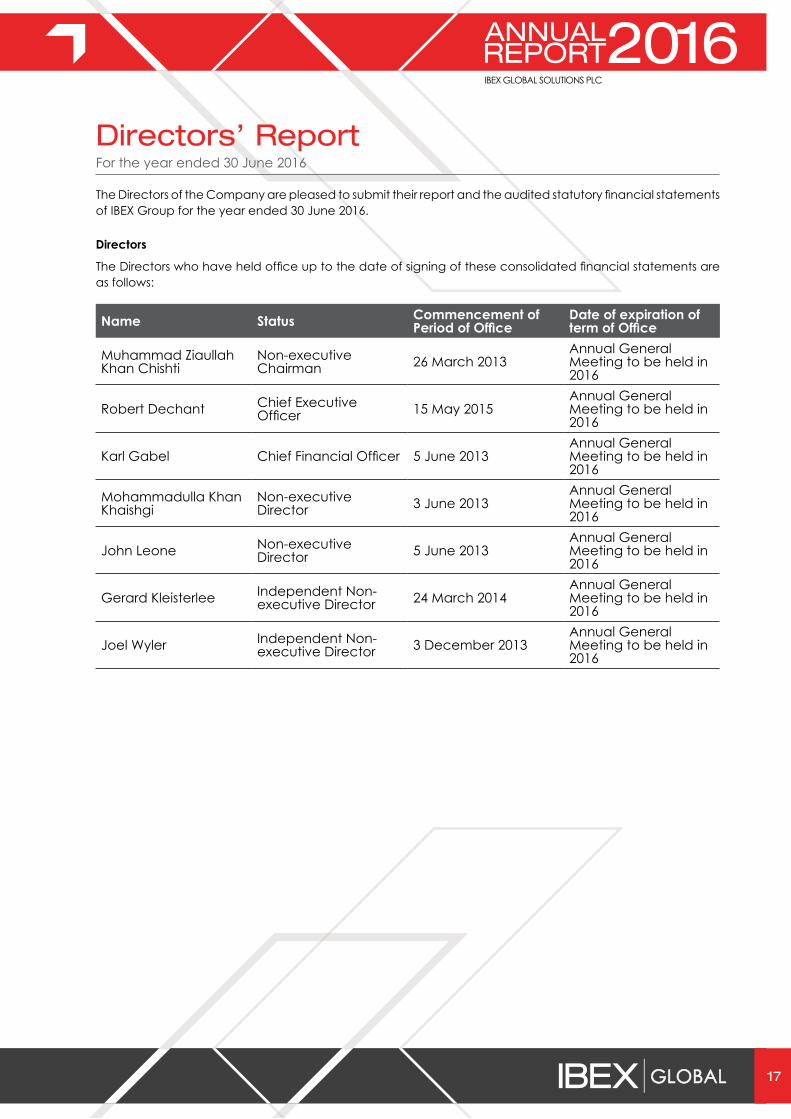
The Directors of the Company are pleased to submit their report and the audited statutory financial statements of IBEX Group for the year ended 30 June 2016.
Directors
The Directors who have held office up to the date of signing of these consolidated financial statements are as follows:
Name Status Commencement of Period of Office
Date of expiration of term of Office
Muhammad Ziaullah Khan Chishti
Non-executive Chairman 26 March 2013
Annual General Meeting to be held in 2016
Robert Dechant Chief Executive Officer 15 May 2015
Annual General Meeting to be held in 2016
Karl Gabel Chief Financial Officer 5 June 2013Annual General Meeting to be held in 2016
Mohammadulla Khan Khaishgi
Non-executive Director 3 June 2013
Annual General Meeting to be held in 2016
John Leone Non-executive Director 5 June 2013
Annual General Meeting to be held in 2016
Gerard Kleisterlee Independent Non-executive Director 24 March 2014
Annual General Meeting to be held in 2016
Joel Wyler Independent Non-executive Director 3 December 2013
Annual General Meeting to be held in 2016
Directors’ Report
18
For the year ended 30 June 2016
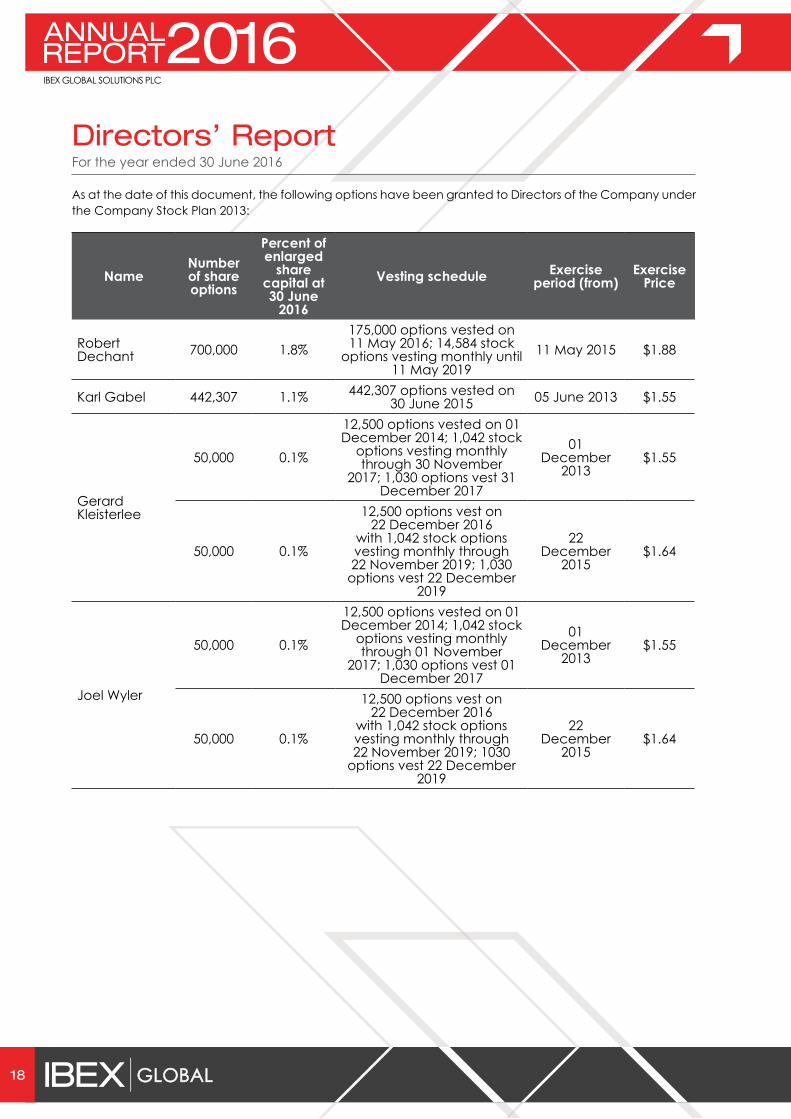
As at the date of this document, the following options have been granted to Directors of the Company under the Company Stock Plan 2013:
NameNumber of share options
Percent of enlarged
share capital at 30 June
2016
Vesting schedule Exercise period (from)
Exercise Price
Robert Dechant 700,000 1.8%
175,000 options vested on 11 May 2016; 14,584 stock
options vesting monthly until 11 May 2019
11 May 2015 $1.88
Karl Gabel 442,307 1.1% 442,307 options vested on 30 June 2015 05 June 2013 $1.55
Gerard Kleisterlee
50,000 0.1%
12,500 options vested on 01 December 2014; 1,042 stock
options vesting monthly through 30 November
2017; 1,030 options vest 31 December 2017
01 December
2013$1.55
50,000 0.1%
12,500 options vest on 22 December 2016
with 1,042 stock options vesting monthly through 22 November 2019; 1,030
options vest 22 December 2019
22 December
2015$1.64
Joel Wyler
50,000 0.1%
12,500 options vested on 01 December 2014; 1,042 stock
options vesting monthly through 01 November
2017; 1,030 options vest 01 December 2017
01 December
2013$1.55
50,000 0.1%
12,500 options vest on 22 December 2016
with 1,042 stock options vesting monthly through 22 November 2019; 1030
options vest 22 December 2019
22 December
2015$1.64
Directors’ Report
18 19
For the year ended 30 June 2016
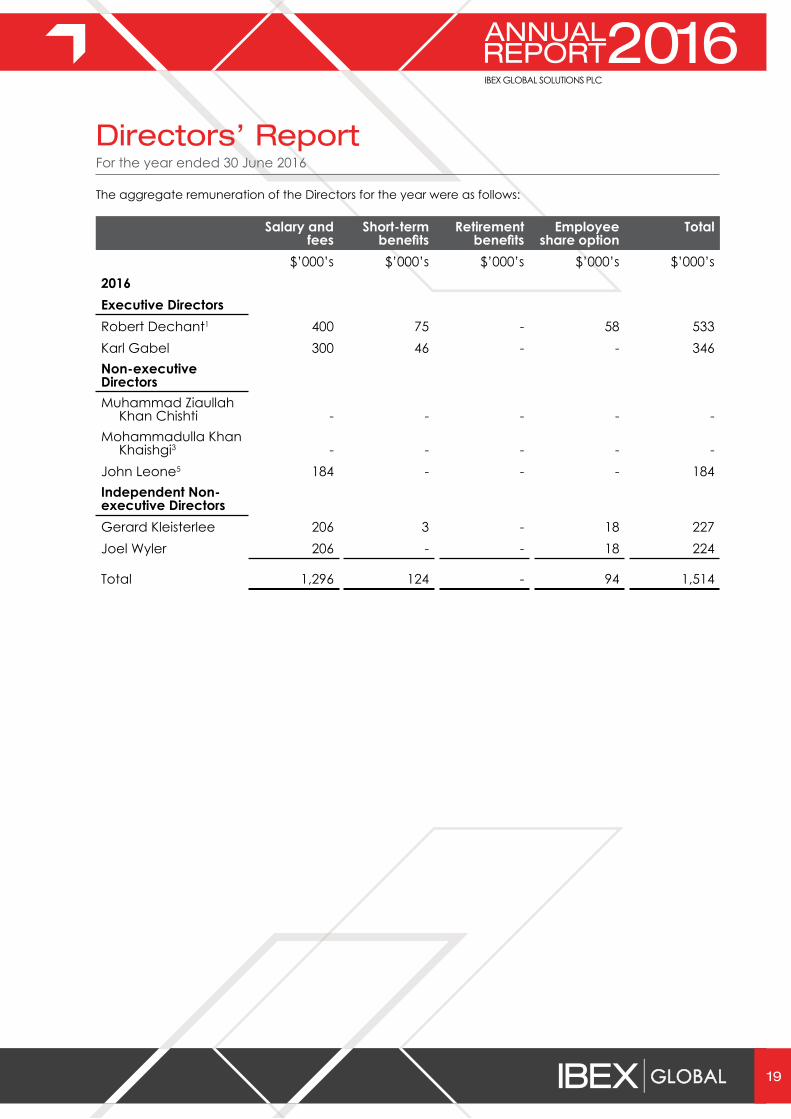
The aggregate remuneration of the Directors for the year were as follows:
Salary and fees
Short-term benefits
Retirement benefits
Employee share option
Total
$’000’s $’000’s $’000’s $’000’s $’000’s2016Executive DirectorsRobert Dechant1 400 75 - 58 533Karl Gabel 300 46 - - 346Non-executive DirectorsMuhammad Ziaullah
Khan Chishti - - - - -Mohammadulla Khan
Khaishgi3 - - - - -John Leone5 184 - - - 184Independent Non-executive DirectorsGerard Kleisterlee 206 3 - 18 227Joel Wyler 206 - - 18 224
Total 1,296 124 - 94 1,514
Directors’ Report

20
For the year ended 30 June 2016
Salary and fees
Short-term benefits
Retirement benefits
Employee share option
Total
$’000’s $’000’s $’000’s $’000’s $’000’s2015Executive DirectorsRobert Dechant1 58 136 - 8 202Karl Gabel 300 45 - 4 349Steve Kezirian2 699 792 - 46 1,537Mohammadulla Khan
Khaishgi (as Interim CEO)3 150 - - - 150
Non-executive DirectorsMuhammad Ziaullah Khan
Chishti - - - - -Mohammadulla Khan
Khaishgi3 - - - - -Tim Kelly4 62 - - 3 65John Leone5 120 - - - 120Independent Non-executive DirectorsGerard Kleisterlee 150 5 - 69 224Joel Wyler 225 - - 69 294
Total 1,764 978 - 199 2,941
1Appointed 15 May 20152Left his post as Director effective 7 October 20143Interim CEO from 3 November 2014 to 30 April 20154Left his post as Director effective 13 October 20145Remuneration of John Leone paid to Pine Bridge
Stephen M. Kezirian resigned as CEO and left his post as Executive Director effective 7 October 2014, and by agreement provided transition assistance through to 31 December 2014. The financial terms of the aforementioned agreement have been reflected in the disclosure above. Mr. Kezirian’s options continued vesting until the day after the first anniversary of resignation date, and Mr. Kezirian’s vested options were exercisable up until 30 April 2016 at which time the options expired. Mohammed Khaishgi, a Non-executive Director, succeeded Mr. Kezirian as interim CEO. Robert T. Dechant became CEO and an Executive Director on 1 May 2015. Mr. Khaishgi continues as a Non-executive Director.
Employment of Disabled Persons
The Group’s policy is to comply with applicable laws regarding recruitment and employment of disabled workers. Arrangements are made, wherever possible, for making reasonable accommodations for employees who become disabled.
Directors’ Report

20 21
For the year ended 30 June 2016
Political Donations
No political donations were made by the Parent Company or the Group during the fiscal year 2016 (2015: nil).
Going Concern
The Directors have a reasonable expectation that the Group has adequate resources to continue in operational existence for the foreseeable future. Thus they continue to adopt the going concern basis of accounting in preparing the annual consolidated financial statements. If for any reason the Group is unable to continue as a going concern, it could have an impact on the Group’s ability to realise assets at their recognised values and to extinguish liabilities in the normal course of business at the amounts stated in the consolidated financial statements.
Financial Instruments
The Group’s financial instruments comprise cash and cash equivalents, bank loans, finance leases and financing arrangements together with various items such as receivables and payables that arise directly from operations. As mentioned in the Strategic Report on page 14, the Group’s activities expose it to a variety of financial risks: market risk (including interest rate risk and foreign currency risk), credit risk and liquidity risk. Additional information on financial instruments is included in Note 35 to the consolidated financial statements.
Purchase of Treasury Shares
In accordance with the terms of the general authority to make market purchases of Holding Company’s own shares granted to it by shareholders of the Company on 20 November 2015, and the announcement made by the Holding Company on 24 August 2015 to extend the period for making purchases of its own shares until such time as the Board shall choose to terminate for a total up to $1.0 million, the Holding Company acquired for cash in the market a total of 39,082 ordinary shares as of 30 June 2016. The acquired shares were held in treasury.
Directors’ Report

22
For the year ended 30 June 2016
Below are the details of treasury shares as of the year ended 30 June 2016.
Acquisition date No. of Shares Price per share (in
US$)
Total price (in US$)
19 March 2015 13,888 1.08 14,93028 May 2015 749 1.24 92829 May 2015 700 1.31 9173 June 2015 725 1.56 1,1319 June 2015 745 1.80 1,34230 June 2015 725 1.98 1,4363 July 2015 725 2.00 1,44824 July 2015 725 1.96 1,4245 November 2015 725 2.00 1,45210 November 2015 740 1.96 1,45112 November 2015 735 1.97 1,44919 November 2015 730 1.91 1,39624 November 2015 700 1.91 1,3371 December 2015 745 1.92 1,4308 December 2015 725 1.66 1,20311 December 2015 1,000 1.67 1,66914 December 2015 2,000 1.67 3,35015 December 2015 2,000 1.67 3,33716 December 2015 2,000 1.68 3,36517 December 2015 2,000 1.68 3,36718 December 2015 2,000 1.64 3,28621 December 2015 2,000 1.56 3,12722 December 2015 2,000 1.67 3,338Total 39,082 58,113
Auditors
A resolution proposing the re-appointment of Grant Thornton UK LLP will be put to the shareholders at the forthcoming Annual General Meeting.
Directors’ Report

22 23
For the year ended 30 June 2016
Statement of Disclosure to Auditors
Each of the persons who is a Director at the date of approval of this report confirms that:
a. So far as they are aware, there is no relevant audit information of which the Company’s auditors are unaware; and
b. They have taken all the steps that they ought to have taken as Directors in order to make themselves aware of any relevant audit information and to establish that the Company’s auditors are aware of that information.
IBEX owes its continuing success not just to the management team but also to our employees across all roles within the Group. The quality and dedication of our staff is what differentiates us from the competition and delivers the best, most well informed and professional service for our client base. I would therefore like to thank every member of the IBEX team for their on-going support and efforts. Galvanised by our successful initial public offering on AIM, we remain true to our core values (Integrity, Transparency, Excellence and Respect) and look forward to a bright future for the entire IBEX family.
By order of the Board
Robert Dechant Karl GabelChief Executive Officer Chief Financial OfficerDate: 27 September 2016 Date: 27 September 2016
Directors’ Report

24
For the year ended 30 June 2016Corporate Governance Report
Financial Aspects of Corporate Governance
The Directors recognise the importance of sound corporate governance and confirm that they intend to comply in all material respects with the Corporate Governance Guidelines (as devised by the Quoted Companies Alliance or QCA in consultation with a number of significant institutional small company investors), to the extent appropriate for a company of its nature and size. We do not fully comply with the QCA Code, however; and the Board is encouraging, where possible and practicable, for the Company to follow the material recommendations on corporate governance of the QCA for companies with shares traded on AIM.
This approach to corporate governance was proposed by the QCA, as it considers the UK Corporate Governance Code to be inappropriate to many AIM companies. The Corporate Governance Guidelines state that, “The purpose of good corporate governance is to ensure that the company is managed in an efficient, effective and entrepreneurial manner for the benefit of all shareholders over the longer term.” We do not comply with the UK Corporate Governance Code. However, we have reported on our Corporate Governance arrangements by drawing upon best practice available, including those aspects of the UK Corporate Governance Code we consider to be relevant and material to the Group and best practice.
The Board meets at least four times per year to review, formulate and approve the Group’s strategy, budgets, and corporate actions and oversee the Group’s progress towards its goals. It has established audit, nomination and remuneration committees with formally delegated duties and responsibilities and with written terms of reference. From time to time, separate committees may be set up by the Board to consider specific issues when the need arises.
Audit Committee
The audit committee will meet formally at least four times a year and otherwise as required. It will be responsible for ensuring that the financial performance of the Group is properly reported on and monitored, including reviews of the annual and interim accounts, results announcements, internal control systems and procedures and accounting policies, reviewing and monitoring the extent of the non-audit services undertaken by the external auditors and advising on the appointment of external auditors.
The audit committee has undertaken vital tasks throughout the year and safeguards independent oversight of both management and external auditors were exercised.

24 25
For the year ended 30 June 2016
Remuneration Committee
The remuneration committee is expected to meet at such times as required, and not less than twice a year. Executive Directors may attend meetings at the committee’s invitation. The remuneration committee has responsibility for determining, within agreed terms of reference, the Group’s policy on the remuneration packages of senior executives and specific remuneration packages for Executive Directors. This includes agreeing with the Board the framework for remuneration of the CEO, all other Executive Directors, the Corporate Secretary and such other members of the executive management of the Group as it is designated to consider. It is furthermore responsible for determining the total individual remuneration packages of each Director including, where appropriate, bonuses, incentives, pension rights and compensation payments. It is also responsible for making recommendations for grants of options under the Share Option Plans.
The remuneration of Non-executive Directors is a matter for the Board. No Director may be involved in any discussions as to their own remuneration. From time to time, the remuneration committee may consult with shareholders on remuneration matters, regardless of any regulatory requirement or governance guideline recommendation to do so.
The remuneration committee ensures the Group’s remuneration policy and practice align with the Group’s strategy.
Nomination Committee
The Nomination Committee will be an ad hoc committee constituted by the Board as and when required. When constituted it will be chaired by an independent member of the Board. It will have responsibility for reviewing the balance of the Board including its skills and experience, the state of the business and its leadership needs, and give full consideration to succession planning. It will also have responsibility for recommending new appointments to the Board.
Relations with Shareholders
Communication with shareholders is given a high priority by the Board and the Directors are available to enter into dialogue with shareholders. All shareholders are encouraged to attend and vote at the Annual General Meeting during which the Board is available to discuss issues affecting the Company.
The shareholders or potential shareholders of the Company may also request information about the Company through the website www.ibexglobal.com.
Corporate Governance Report

2626
For the year ended 30 June 2016
Directors’ Responsibilities
The Directors are responsible for preparing the Directors’ Report and Strategic Report along with consolidated financial statements of the Group and separate financial statements of the Parent Company in accordance with applicable law and regulations.
Companies law requires the Directors to prepare financial statements for each fiscal year. Under that law, the Directors have elected to prepare consolidated financial statements of the Group and separate financial statements of the Parent Company in accordance with International Financial Reporting Standards (lFRS) as adopted by the European Union. Under UK Companies Law, the Directors must not approve the financial statements unless they are satisfied that they give a true and fair view of the state of affairs of the Group and the Parent Company and of the profit or loss of the Group and the Parent Company for that period.
In preparing these financial statements, the Directors are required to:
• Select suitable accounting policies and then apply them consistently;
• Make judgments and accounting estimates that are reasonable and prudent;
• State whether applicable accounting standards have been followed subject to any material departures disclosed and explained in the financial statements; and
• Prepare the financial statements on a going concern basis unless it is inappropriate to presume that the Group and the Parent Company will continue in business.
The Directors are responsible for keeping adequate accounting records that are sufficient to show and explain the Parent Company’s and Group’s transactions and which disclose with reasonable accuracy at any time the financial position of the Parent Company and the Group and enable them to ensure that the financial statements comply with the Companies Act 2006. The Directors are also responsible for safeguarding the assets of the Parent Company and the Group and, hence, for taking reasonable steps for the prevention and detection of fraud and other irregularities.
Website Publication
The Directors are responsible for the maintenance and integrity of the corporate and financial information included on the Group’s website. The work carried out by the auditors does not involve consideration of these matters and, accordingly, the auditors accept no responsibility for any changes that may have occurred to the financial statements since they were initially presented on the website. Legislation in the United Kingdom governing the preparation and dissemination of the financial statements may differ from legislation in other jurisdictions.
Statement of Directors’ Responsibilities

26 2726
Independent Auditors’ Report on Group Financial Statements
We have audited the Group financial statements of IBEX Global Solutions Plc for the year ended 30 June 2016 which comprise the consolidated statement of comprehensive income, the consolidated statement of financial position, the consolidated statement of changes in equity, the consolidated statement of cash flows and the related notes. The financial reporting framework that has been applied in their preparation is applicable law and International Financial Reporting Standards (IFRSs) as adopted by the European Union.
This report is made solely to the Company’s members, as a body, in accordance with Chapter 3 of Part 16 of the Companies Act 2006. Our audit work has been undertaken so that we might state to the Company’s members those matters we are required to state to them in an auditor’s report and for no other purpose. To the fullest extent permitted by law, we do not accept or assume responsibility to anyone other than the Company and the Company’s members as a body, for our audit work, for this report, or for the opinions we have formed.
Respective responsibilities of directors and auditor
As explained more fully in the Directors’ Responsibilities Statement set out on page 26, the Directors are responsible for the preparation of the Group financial statements and for being satisfied that they give a true and fair view. Our responsibility is to audit and express an opinion on the Group financial statements in accordance with applicable law and International Standards on Auditing (UK and Ireland). Those standards require us to comply with the Auditing Practices Board’s Ethical Standards for Auditors.
Scope of the audit of the financial statements
A description of the scope of an audit of financial statements is provided on the Financial Reporting Council’s website at www.frc.org.uk/auditscopeukprivate.
Opinion on financial statements
In our opinion the Group financial statements:
• give a true and fair view of the state of the Group’s affairs as at 30 June 2016 and of its profit for the year then ended;
• have been properly prepared in accordance with IFRSs as adopted by the European Union;
• have been prepared in accordance with the requirements of the Companies Act 2006.
2828
Opinion on other matter prescribed by the Companies Act 2006
In our opinion the information given in the Strategic Report and Directors’ Report for the financial year for which the Group financial statements are prepared is consistent with the Group financial statements.
Matters on which we are required to report by exception
We have nothing to report in respect of the following matters where the Companies Act 2006 requires us to report to you if, in our opinion:
• certain disclosures of Directors’ remuneration specified by law are not made; or
• we have not received all the information and explanations we require for our audit.
Other matter
We have reported separately on the parent company financial statements of IBEX Global Solutions Plc for the year ended 30 June 2016.
Marc SummersSenior Statutory Auditorfor and on behalf of Grant Thornton UK LLPStatutory Auditor, Chartered AccountantsLondonDate: 27 September 2016
Independent Auditors’ Report on Group Financial Statements

28 29
For the year ended 30 June 2016
28
Consolidated Statement of Comprehensive Income
2016 2015Continuing operations Notes $’000’s $’000’sRevenue 5 255,510 238,806Cost of sales 6 (213,225) (200,027)Gross profit 42,285 38,779
Selling, general and administrative Expenses (34,539) (30,017)Share-based payment (90) 162Exceptional item 8 - (1,375)Other income 20 1,255 1,298 Total selling, general and administrative expenses 6 (33,374) (29,932)
Operating profit 8,911 8,847Other expenses
Finance costs 7, 20 (1,767) (1,604)
Income before taxation 9 7,144 7,243
Income tax expense 30 (658) (830)Net income for the year attributable to the equity
holders of the parent 6,486 6,413Other comprehensive incomeItem that will not be subsequently reclassified to profit or
loss -Actuarial gain/(loss) on retirement benefits 132 (225)
Item that will be subsequently reclassified to profit or lossForeign currency translation adjustment (45) (86)
87 (311) Total comprehensive income attributable to equity
holders of the parent 6,573 6,102
Earnings per share attributable to equity holders of the
parent Basic earnings per share (in US$) 31 0.164 0.162
Diluted earnings per share (in US$) 31 0.164 0.162
The accompanying notes are an integral part of these financial statements.
30
For the year ended 30 June 2016
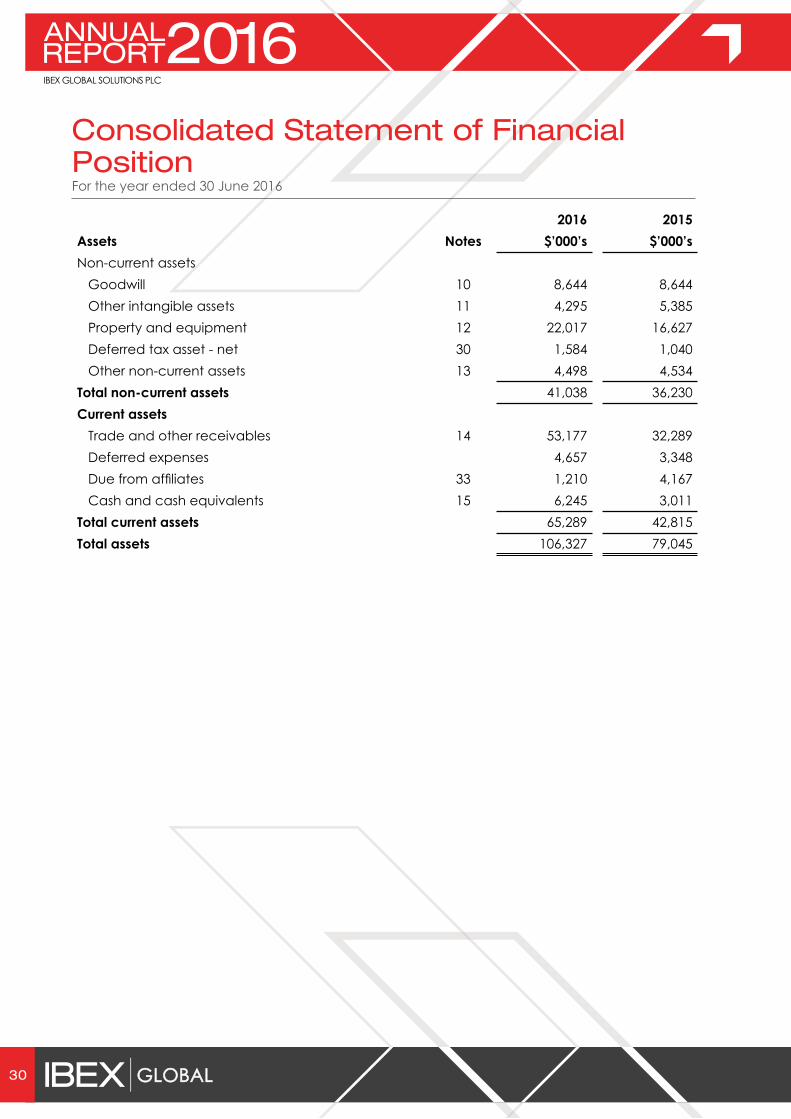
Consolidated Statement of Financial Position
2016 2015Assets Notes $’000’s $’000’sNon-current assets Goodwill 10 8,644 8,644 Other intangible assets 11 4,295 5,385 Property and equipment 12 22,017 16,627 Deferred tax asset - net 30 1,584 1,040 Other non-current assets 13 4,498 4,534 Total non-current assets 41,038 36,230Current assets Trade and other receivables 14 53,177 32,289 Deferred expenses 4,657 3,348 Due from affiliates 33 1,210 4,167 Cash and cash equivalents 15 6,245 3,011Total current assets 65,289 42,815Total assets 106,327 79,045

30 31
For the year ended 30 June 2016
Consolidated Statement of Financial Position
2016 2015Equity and liabilities Notes $’000’s $’000’sEquity attributable to owners of the parent Share capital 16 602 602 Share premium 14,479 14,479 Capital redemption reserve 17 48,530 48,530 Treasury shares (58) (19) Other reserves 1,230 918 Deficit (37,207) (38,986)Total equity 27,576 25,524 Non-current liabilities Deferred revenue 1,376 1,196 Obligation under finance lease 19 6,090 7,159 Long-term financing 20 2,115 4,251Term loan 22 4,000 -Other 21 1,095 1,304 Total non-current liabilities 14,676 13,910 Current liabilities Line of credit 22 17,025 3,273 Obligation under finance lease 19 3,579 3,730 Current portion of financing 20 3,892 3,196 Term loan 22 2,000 - Trade and other payables 23 30,752 25,301 Deferred revenue 6,622 4,066 Due to affiliates 33 205 45 Total current liabilities 64,075 39,611 Total liabilities 78,751 53,521 Total equity and liabilities 106,327 79,045
The accompanying notes are an integral part of these consolidated financial statements.
These consolidated financial statements were approved for issue by the Board of Directors on 27 September 2016 and were signed on its behalf by
Robert Dechant Karl GabelChief Executive Officer Chief Financial Officer
32
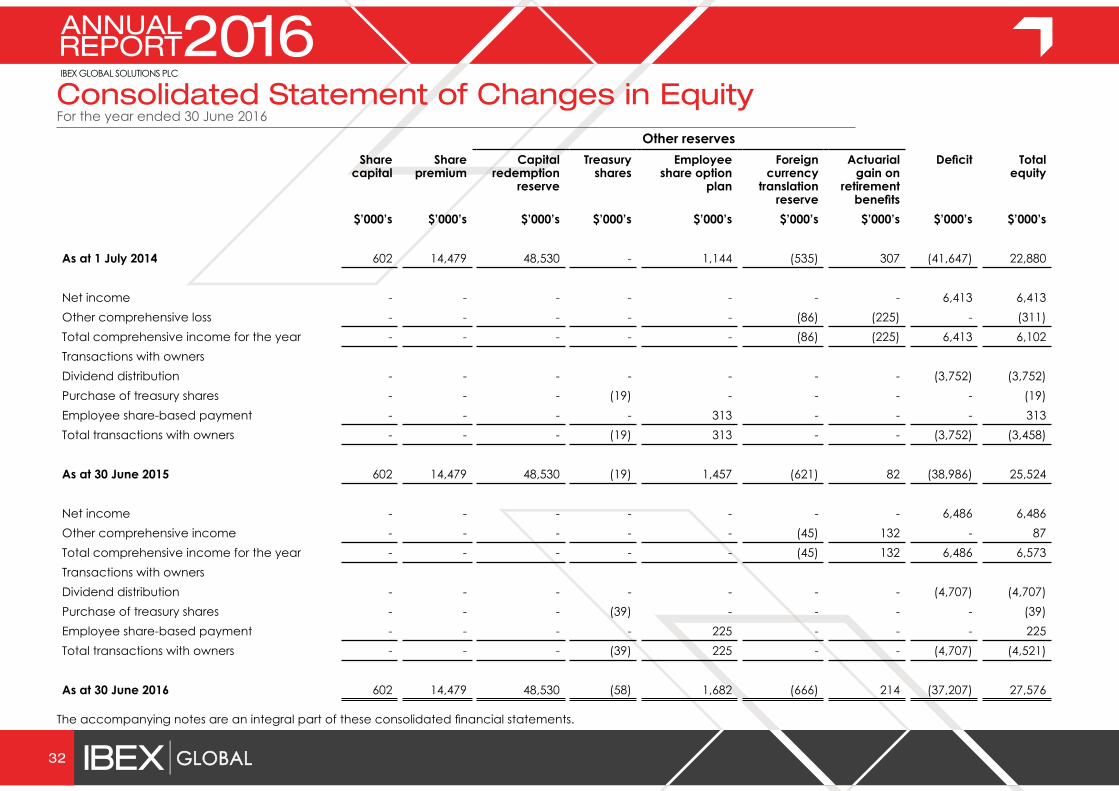
For the year ended 30 June 2016Consolidated Statement of Changes in Equity Other reserves
Share capital
Share premium
Capital redemption
reserve
Treasury shares
Employee share option
plan
Foreign currency
translation reserve
Actuarial gain on
retirement benefits
Deficit Total equity
$’000’s $’000’s $’000’s $’000’s $’000’s $’000’s $’000’s $’000’s $’000’s
As at 1 July 2014 602 14,479 48,530 - 1,144 (535) 307 (41,647) 22,880
Net income - - - - - - - 6,413 6,413Other comprehensive loss - - - - - (86) (225) - (311) Total comprehensive income for the year - - - - - (86) (225) 6,413 6,102Transactions with ownersDividend distribution - - - - - - - (3,752) (3,752) Purchase of treasury shares - - - (19) - - - - (19)Employee share-based payment - - - - 313 - - - 313Total transactions with owners - - - (19) 313 - - (3,752) (3,458)
As at 30 June 2015 602 14,479 48,530 (19) 1,457 (621) 82 (38,986) 25,524
Net income - - - - - - - 6,486 6,486Other comprehensive income - - - - - (45) 132 - 87Total comprehensive income for the year - - - - - (45) 132 6,486 6,573Transactions with ownersDividend distribution - - - - - - - (4,707) (4,707)Purchase of treasury shares - - - (39) - - - - (39)Employee share-based payment - - - - 225 - - - 225Total transactions with owners - - - (39) 225 - - (4,707) (4,521)
As at 30 June 2016 602 14,479 48,530 (58) 1,682 (666) 214 (37,207) 27,576
The accompanying notes are an integral part of these consolidated financial statements.
32
33
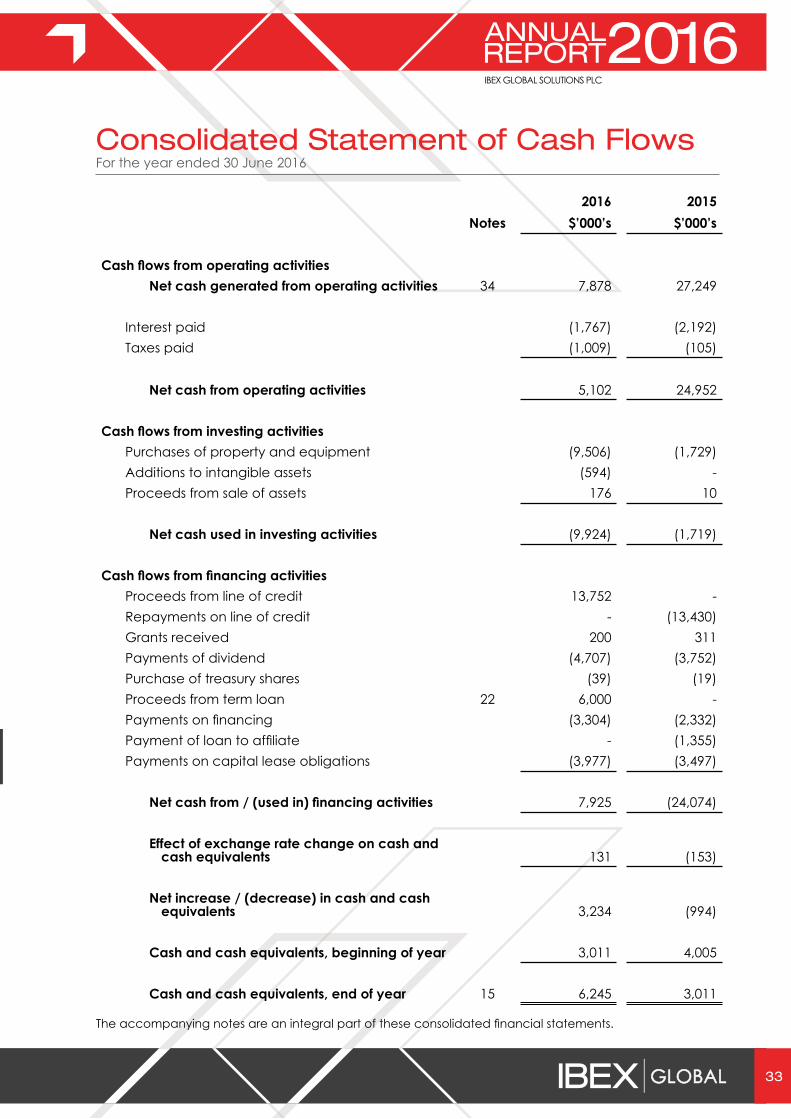
For the year ended 30 June 2016Consolidated Statement of Cash Flows
2016 2015Notes $’000’s $’000’s
Cash flows from operating activities
Net cash generated from operating activities 34 7,878 27,249
Interest paid (1,767) (2,192)Taxes paid (1,009) (105)
Net cash from operating activities 5,102 24,952
Cash flows from investing activitiesPurchases of property and equipment (9,506) (1,729)Additions to intangible assets (594) -Proceeds from sale of assets 176 10
Net cash used in investing activities (9,924) (1,719)
Cash flows from financing activitiesProceeds from line of credit 13,752 - Repayments on line of credit - (13,430)Grants received 200 311Payments of dividend (4,707) (3,752)Purchase of treasury shares (39) (19)Proceeds from term loan 22 6,000 -Payments on financing (3,304) (2,332)Payment of loan to affiliate - (1,355)Payments on capital lease obligations (3,977) (3,497)
Net cash from / (used in) financing activities 7,925 (24,074)
Effect of exchange rate change on cash and cash equivalents 131 (153)
Net increase / (decrease) in cash and cash equivalents 3,234 (994)
Cash and cash equivalents, beginning of year 3,011 4,005
Cash and cash equivalents, end of year 15 6,245 3,011
The accompanying notes are an integral part of these consolidated financial statements.

34
For the year ended 30 June 2016
Notes to the Consolidated Financial Statements
(1) Nature of the business
IBEX Global Solutions Plc (the Holding Company or the Parent Company) was incorporated on 26 March 2013 as IBEX Global Solutions Limited and was re-registered as a public limited company on 4 June 2013. Its registered office is 3rd Floor, 5 Lloyds Avenue, London EC3N 3AE. The Holding Company was incorporated under the Companies Act 2006 with a fiscal year end of 30 June. On 28 June 2013, the Holding Company was admitted to trade on the Alternative Investment Market (AIM), a market operated by the London Stock Exchange Group Plc.
IBEX Global Solutions Plc and subsidiaries (IBEX, IBEX Global, IBEX Group or the Group) is a global portfolio of companies in the contact centre and related business process outsourcing (BPO) business, with operations in the United States, Philippines, the United Kingdom, Pakistan, Senegal, Jamaica and Nicaragua. Service offerings include customer care support, business and consumer inbound and outbound telesales and technical support services. IBEX Group also offers enabling technology solutions including Interactive Voice Response (IVR).
The IBEX Group consists of:
Holding company LocationIBEX Global Solutions Plc UK
30 June 2016
Subsidiaries Location
Percentage of holding
in ordinary shares
Statutory Reporting
Year%
Lovercius Consultants Limited (IBEX Cyprus) Cyprus 100% June 2016IBEX Global Europe S.a.r.l. (IBEX Luxembourg) Luxembourg 100% June 2016TRG Customer Solutions, Inc. (trading as IBEX Global
Solutions, Inc.) USA 100% June 2016TRG Customer Solutions (Canada) Inc. Canada 100% June 2016TRG Marketing Solutions Limited UK 100% June 2016Virtual World (Private) Limited Pakistan 100% June 2016IBEX Philippines Inc. Philippines 100% June 2016IBEX Global Solutions (Philippines) Inc. Philippines 100% June 2016TRGCS Philippines Inc. Philippines 100% June 2016IBEX Global Solutions Senegal S.A. (IBEX Senegal)
Senegal 100%December
2015IBEX Global Solutions (Private) Limited Pakistan 100% June 2016IBEX Global Mena FZE Dubai 100% June 2016IBEX I.P. Holdings Ireland Limited (IBEX Ireland) Ireland 100% June 2016IBEX Global Bermuda Limited Bermuda 100% June 2016IBEX Global Solutions Nicaragua SA (IBEX Nicaragua) Nicaragua 100% June 2016IBEX Global St. Lucia Limited St. Lucia 100% June 2016IBEX Global Jamaica Limited (IBEX Jamaica) Jamaica 100% June 2016
34 35
For the year ended 30 June 2016
Notes to the Consolidated Financial Statements
(2) Basis of preparation
The consolidated financial statements have been prepared in accordance with International Financial Reporting Standards (IFRS), including International Accounting Standards (IAS), and International Financial Reporting Interpretations Committee (IFRIC) interpretations as adopted by the European Union (IFRS as adopted by the EU) and the Companies Act 2006 applicable to companies reporting under IFRS.
The consolidated financial statements have been prepared under the going concern assumption.
(3) Ultimate parent undertaking and controlling entity
The Ultimate Parent Company, The Resource Group International Limited (TRGI), is incorporated in Bermuda. The parent entity of the largest group to include the IBEX Group in its consolidated financial statements is TRGI, and its financial statements are not publicly available. The ultimate controlling party of the Group are the Directors of TRGI.
(4) Summary of significant accounting policies
(a) Basis of consolidation
The consolidated financial statements of the Group comprise the financial statements of the Holding Company and its subsidiaries listed in Note 1. The financial statements of the Holding Company and its subsidiaries are prepared up to the same reporting period and are combined on a line-by-line basis. All intercompany balances, transaction and related unrealised profits and losses are eliminated on consolidation.
The acquisition method of accounting is used to account for the acquisition of the subsidiaries by the Group (except for the common control transactions). On acquisition, the assets and liabilities and contingent liabilities of a subsidiary are measured at their fair values at the date of acquisition. The cost of acquisition is measured at fair value of the assets transferred, equity instruments issued and liabilities incurred or assumed at the acquisition date.
Any excess of the cost of acquisition over the fair values of the identifiable net assets acquired is recognised as goodwill. Any deficiency of the cost of acquisition below the fair values of the identifiable net assets acquired is credited to the consolidated statement of comprehensive income in the period of acquisition.
(b) Basis of measurement
These consolidated financial statements have been prepared on the basis of the historical cost convention, except as otherwise disclosed.
(c) Going Concern
The Group’s business activities, together with the factors likely to affect its future development, performance and position are set out in the Strategic Report on pages 6 to 16. The financial position of the Group, its cash flows, liquidity position and borrowing facilities are described on pages 30, 31 and 33 and Notes 20, 22 and 35 (e) to the financial statements. In addition, Notes 35 to 36 to the financial statements include the Group’s objectives, policies and processes for managing its capital; its financial risk management objectives; details of its financial instruments and hedging activities; and its exposures to credit risk and liquidity risk. The Group’s forecasts and projections,

36
For the year ended 30 June 2016
taking account of reasonably possible changes in trading performance, show that the Group should be able to operate within the level of its current monetary facilities.
The Directors therefore have a reasonable expectation that the Group has adequate resources to continue in operational existence for the foreseeable future. Thus they continue to adopt the going concern basis of accounting in preparation of these financial statements. If for any reason the Group is unable to continue as a going concern, it could have impact on the Group’s ability to realise assets at their recognised values and to discharge liabilities in the normal course of business at the amounts stated in the consolidated financial statements.
(d) Functional and presentation currency
Items included in the financial statements of each of the Group entities are measured using the currency of the primary economic environment in which the entity operates (the functional currency).
EntityFunctional
currencyTRG Customer Solutions, Inc. / Lovercius Consultants Limited / IBEX
Global Europe S.a.r.l. / IBEX Global Solutions Plc / IBEX I.P. Holdings Ireland Limited / IBEX Global Bermuda Limited / IBEX St. Lucia Limited US Dollar
TRG Customer Solutions (Canada) Inc. Canadian DollarTRG Marketing Solutions Limited Pound SterlingIBEX Global Solutions (Private) Limited / Virtual World (Private) Limited Pakistan RupeeIBEX Philippines Inc. / IBEX Global Solutions (Philippines) Inc. / TRGCS
Philippines Inc. Philippine PesoIBEX Global Solutions Senegal S.A. CFA Franc (XOF)IBEX Global Mena FZE Emirati Dirham
IBEX Global Solutions Nicaragua SANicaraguan
CordobaIBEX Global Jamaica Limited Jamaican Dollar
The functional currency for each entity included in the consolidated financial statements is as follows:
The consolidated financial statements are presented in United States Dollars, being the Group’s presentation currency.
Notes to the Consolidated Financial Statements

36 37
For the year ended 30 June 2016
Notes to the Consolidated Financial Statements
Unit of CurrencyConversion Rate
US$Conversion Rate
US$30 June 2016 30 June 2015
Pound Sterling 1.33934 1.57200Pakistan Rupee 0.00954 0.00964Philippine Peso 0.02128 0.02212CFA Franc (XOF) 0.00168 0.00169Canadian Dollar 0.77166 0.80940Emirati Dirham 0.27220 0.27221Nicaraguan Cordoba 0.03502 0.03770Jamaican Dollar 0.00809 -
The closing conversion rates used to convert the foreign currencies as of 30 June 2016 and 2015 are as follows:
(e) Foreign currency translation
The results and financial position of all the Group entities that have a functional currency different from the presentation currency are translated into the presentation currency as follows:
(i) assets and liabilities are translated at the closing exchange rate at year-end;
(ii) income and expenses are translated at the average rate being an approximation to actual; and
(iii) all resulting exchange differences are recognised as a separate component of equity.
On consolidation, exchange differences arising from the translation of the net investment in foreign subsidiaries are taken to other comprehensive income. When a foreign subsidiary, branch or operation is sold, exchange differences that were recorded in equity are reclassified to profit or loss in the consolidated statement of comprehensive income.
(f) Foreign currency transactions
Foreign currency transactions of the Group entities are translated into their respective functional currencies at the rates of exchange approximating to those prevailing on the date of the transaction. Monetary assets and liabilities in foreign currencies are retranslated into their respective functional currencies at the rates of exchange at the end of each reporting period. Exchange gains and losses are included in the consolidated statement of comprehensive income within selling, general and administrative expenses.
(g) Segment reporting
The Group has one operating segment, being the provision of contact centre and related business process outsourcing services.
The single operating segment has been identified on the basis of internal reports that are regularly reviewed by the Chief Operating Decision Maker to allocate resources and assess performance. Executive management, being the executive leadership team, is considered to be the Chief Operating Decision Maker.
38
For the year ended 30 June 2016
(h) Revenue recognition
Revenue is measured at the fair value of the consideration received or receivable, excluding rebates, discount and related taxes.
Revenue from call centre services is recognised as the services are performed on the basis of the number of billable hours or other contractually agreed metrics.
Revenue from inbound and outbound telephonic and internet-based communication services that are customised to the customers’ needs is recognised at the contractual rates as services are provided.
Revenue for the initial training that occurs upon commencement of a new client contract is deferred over the estimated life of the client program and matched against the associated expenses if that training is billed separately to a client. Training revenue is then recognised on a straight-line basis over the life of the client contract as it is not considered to have a standalone value to the customer. The related incremental direct expenses are deferred and charged to selling, general and administrative expenses on a straight-line basis over the life of the client contract as the related revenue is recognised. These incremental direct expenses relate directly to each contract, generate or enhance resources that will be used in satisfying performance obligations in the future and are expected to be recovered in full.
The Group also earns a management fee from the sub-license agreement with TRGI for that portion of the software and services purchased that correspond to the requirements of TRGI and its non-IBEX subsidiaries. Revenue is recognised based on fixed monthly consideration as specified in the agreement (see Note 20).
(i) Grants
Government grants are recognised at fair value where there is a reasonable assurance that the grant will be received and the Group will comply with all attached conditions.
Government grants relating to costs are recognised in the consolidated statement of comprehensive income over the period necessary to match the corresponding costs that are intended to be compensated. These are netted off against the relevant costs in the consolidated statement of comprehensive income.
Government grants relating to property and equipment are deducted from the assets carrying value resulting in a lower depreciation charge over the life of the asset.
(j) Goodwill
Goodwill arising as a result of a business combination represents the excess of the cost of the business combination over the Group’s interest in the net fair value of identifiable assets and liabilities of the acquired business at the date of acquisition. Goodwill is initially recognised as an asset at cost and subsequently measured at cost less impairment in value, if any.
Goodwill is tested for impairment on an annual basis and also when there is an indication of impairment. Impairment losses on goodwill are not reversed. On disposal of an entity, the attributable amount of goodwill is included in the determination of the profit or loss on disposal.
Goodwill is allocated to cash-generating units for the purpose of impairment testing. The allocation is made to those cash-generating units or groups of cash-generating units that are expected to benefit from the business combination in which the goodwill arose.
Notes to the Consolidated Financial Statements

38 39
For the year ended 30 June 2016
(k) Intangible assets
SoftwareSoftware which can be separately identifiable is capitalised as an intangible asset at purchase cost and then amortised over its estimated useful life of three years on a straight-line basis.
Trademarks
Trademarks considered as intangible assets are capitalised at cost of acquisition. Trademarks with an indefinite useful life are not amortised but are tested for impairment annually.
The intangible assets that have an indefinite life are trademarks and are considered to have an indefinite life on the grounds of the proven longevity of the trademarks and the Group’s commitment to maintaining those trademarks.
Patents
Patents are capitalised at cost of acquisition and amortised over their estimated useful life of four years on a straight-line basis.
Intangible assets are stated at cost less accumulated amortisation and impairment in value, if any. Amortisation is included within depreciation and amortisation in the cost of sales and selling, general and administrative expenses. Useful lives of intangible assets, other than goodwill, are reviewed at the end of each reporting period and adjusted if the impact on amortisation is significant.
Gains and losses on the disposal of intangible assets are taken to the consolidated statement of comprehensive income. Subsequent expenditure is capitalised only when it increases the future economic benefits embodied in the specific asset to which it relates. All other expenditure, including expenditure on internally generated intangible assets which do not meet the IAS 38, Intangible Assets, criteria as development costs, is recognised in the consolidated statement of comprehensive income as incurred.
(l) Property and equipment
Property and equipment are recorded at historical cost reduced by the value of grants received that are used to acquire the property and equipment, where applicable. Depreciation is provided using the straight-line method over the estimated useful lives or the shorter of estimated useful life or lease term for leased assets.
Leasehold improvements 20% (or period of the lease if shorter)Furniture, fixture and office equipment 20%Telecommunication and computer equipment 33%Vehicles 20%
Expenditure for maintenance, repairs and improvements that do not prolong the useful life of an asset is charged to operations as incurred. Additions and improvements that substantially extend the useful life of an asset are capitalised. Any tenant allowance (incentives received from lessor) received is recognised as deferred income or reduces the value of property and equipment.
Construction in progress (CIP) is the cost of improvements, buildings or other capital projects that are under construction as of the reporting period. CIP represents a temporary capitalisation of labour, materials, and equipment of an asset under construction. When the constructed asset is substantially
Notes to the Consolidated Financial Statements

40
For the year ended 30 June 2016
complete, costs in the CIP account are classified to one or more of the major asset categories and corresponding reductions must be made to the CIP account.
An item of property and equipment is derecognised upon disposal or when no future economic benefits are expected from its use or disposal. Gains and losses on disposals are determined by comparing the sale proceeds with the carrying amount of the relevant assets. These are recognised in the consolidated statement of comprehensive income.
(m) Assets subject to finance leases
Leases of property and equipment, where the Group has substantially all the risks and rewards of ownership, are classified as finance leases. Assets subject to finance lease are initially recorded at the lower of the present value of minimum lease payments under the lease agreements and the fair value of the leased assets. The related obligation under the lease less financial charges allocated to future periods is shown as a liability. Finance lease obligations are secured by the related assets held under finance leases.
The financial charges are allocated to accounting periods in a manner so as to provide a constant periodic rate of charge on the outstanding liability.
Depreciation on finance lease assets is provided on a straight line basis over the lesser of their estimated useful life or the lease term.
(n) Operating leases
Leases in which a significant portion of the risks and rewards of ownership are retained by the lessor are classified as operating leases. Payments made under operating leases (net of any incentives received from the lessor) are charged to the consolidated statement of comprehensive income on a straight-line basis over the lease term.
(o) Financial instruments
Financial assets and financial liabilities are recognised at the time when the Group becomes a party to the contractual provisions of the instrument.
Financial assets
The Group considers its financial assets to comprise cash, deposits and various other receivable balances that arise from its operations.
Trade receivables, deposits and other receivables that have fixed or determinable payments that are not quoted in an active market are classified as loans and receivables. Loans and receivables are initially recorded at fair value and subsequently at amortised cost using the effective interest rate method, less any impairment. Interest income is recognised by applying the effective interest rate, except for short-term receivables when the recognition of interest would be immaterial.
The carrying amount of the financial asset is reduced by any impairment loss directly for all financial assets with the exception of trade receivables where the carrying amount is reduced through the use of an allowance account. When a trade receivable is considered uncollectable, it is written off against the allowance account. Subsequent recoveries of amounts previously written off are credited against the allowance account. Changes in the carrying amount of the allowance account are recognised in the consolidated statement of comprehensive income. If in a subsequent period the amount of the impairment loss decreases and the decrease can be related objectively to an
Notes to the Consolidated Financial Statements
40 41
For the year ended 30 June 2016
Notes to the Consolidated Financial Statements
event occurring after the impairment was recognised, the previously recognised impairment loss is reversed through the consolidated statement of comprehensive income to the extent that the carrying amount of the financial asset at the date the impairment is reversed does not exceed what the amortised cost would have been had the impairment not been recognised.
The Group derecognises a financial asset or a portion of a financial asset when, and only when, the contractual rights to the cash flows from the assets expire; or it transfers the financial asset and substantially all of the risks and rewards of ownership of the asset to another entity. If the Group neither transfers nor retains substantially all of the risks and rewards of ownership and continues to control the asset, the Group recognises its retained interest in the asset and associated liability for amounts it may have to pay. If the Group retains substantially all the risks and rewards of ownership of a transferred financial asset, the Group continues to recognise the financial asset and also recognises a collateral borrowing for the proceeds received.
Financial liabilities
Financial liabilities are initially measured at fair value and are classified according to the substance of the contractual arrangement entered into. Financial liabilities are subsequently measured at amortised cost. The Group’s financial liabilities comprise trade payables, borrowings and other payables balances that arise from its operations. They are classified as “financial liabilities measured at amortised cost.” Finance charges are accounted for on an accrual basis in the consolidated statement of comprehensive income using the effective interest rate method and are added to the carrying amount of the investment to the extent that is not settled in the period in which they arise. The Group derecognises financial liabilities when the Group’s obligations are discharged, canceled or they expire.
Embedded derivatives
An embedded derivative is one or more implicit or explicit terms in a host contract that affect the cash flows of the contract in a manner similar to a stand-alone derivative instrument. An embedded derivative is accounted for separately from the host contract when it is not closely related to the host contract. The embedded derivative and host contract are considered to be closely related when the economic characteristics and risks of each are considered to be similar. If the embedded derivative is “closely related” to the host then there is no need to separate the embedded derivative. Conversely, if the embedded derivative is not closely related to the host, then the embedded derivative should be separated and carried at fair value through profit or loss. The assessment of whether an embedded derivative is required to be separated from the host contract and accounted for as a derivative is made at the inception of the contract, i.e., when it first becomes a party to the contract. A derivative instrument is a type of contract under which cash flows are linked to movements in some other rate, index, or commodity. It will require relatively little up-front investment, and will be settled at a future date. The details related to the Group’s embedded derivative are discussed in Note 22.
(p) Impairment of non-financial assets
The carrying amounts of the Group’s assets are reviewed at the end of each reporting period to determine whether there is any indication of impairment loss. If any such indication exists, the asset’s recoverable amount is estimated in order to determine the extent of the impairment loss, if any. An impairment loss is recognised for the amount by which the asset’s carrying amount exceeds its recoverable amount. The recoverable amount is the higher of an asset’s fair value less cost to sell and value in use. Impairment losses are charged to the consolidated statement of comprehensive income in selling, general and administrative expenses. During the years ended 30 June 2016 and 2015, no impairment was recorded.
42
For the year ended 30 June 2016
(q) Affiliated companies
Affiliated companies represent the companies under the common control of the Ultimate Parent Company, TRGI.
(r) Cash and cash equivalents
Cash and cash equivalents consist of cash and cheques on hand and bank deposits available on demand.
(s) Share capital, share premium and treasury shares
Share capital represents the nominal (par) value of shares that have been issued and classified as equity.
Share premium includes any premiums received on issue of share capital. Any transaction costs associated with the issuing of shares are deducted from the share premium, net of any related income tax benefits.
Treasury shares represent the amount of the consideration paid when shares are repurchased which includes directly attributable costs, net of tax effects, and are recognised as a deduction from equity. When treasury shares are sold or reissued subsequently, the amount received is recognised as an increase in equity and the resulting surplus or deficit on the transaction is presented within share premium.
(t) Employee stock option plan
The Ultimate Parent Company, TRGI, and the Parent Company adopted an employee stock option plan (the Option Plan), which authorises the granting of stock options to certain employees of the Group to acquire ordinary shares and restricted stock awards (Company Options) over ordinary shares of the Parent Company. Each subsidiary recognises as an expense the services acquired related to the Option Plan for the options granted to its employees over the vesting period with a corresponding increase in the equity.
Any cancellations of the Option Plan are treated as an acceleration of vesting period and any remaining expense is recognised immediately.
For cash settled share-based payment plans, each subsidiary recognises an expense for the services acquired over the vesting period and liability incurred at the fair value of the liability. The Group re-measures the fair value of the liability at the end of each reporting period until the date of settlement, with any changes in value recognised in profit or loss for the period.
(u) Retirement benefits
The subsidiaries of the Holding Company maintain their individual retirement benefit plans as follows:
TRG Customer Solutions Inc. maintains the defined contribution TRG 401(k) Plan (the Retirement Plan), formerly known as the TRG Customer Solutions, Inc. 401(k) Retirement Savings Plan. The Retirement Plan was amended effective 1 January, 2010 to: (i) comply with Economic Growth and Tax Relief Reconciliation Act; (ii) eliminate the hardship withdrawal provision; (iii) change the eligibility to make Elective Deferrals; (iv) change the Vesting Service to the Elapsed Time Method; and (v) rename the Retirement Plan to the TRG 401(k) Plan. The Retirement Plan is a single employer plan including the affiliated companies: TRG iSky, Inc., TRG Holdings, LLC, SatMap Inc. d/b/a Afiniti,and Digital Globe Services, Inc. Employees who meet certain eligibility requirements, as defined, are able to contribute
Notes to the Consolidated Financial Statements
42 43
For the year ended 30 June 2016
up to federal annual maximums. The Retirement Plan provides for company matching contributions of 25.0% of the first 6.0% of employee contributions to the Retirement Plan, which vests 25.0% per year over a four year period. The subsidiary’s contributions to the Retirement Plan for the fiscal years ended 30 June 2016 and 2015 were $67,860 and $68,682, respectively.
IBEX Philippines Inc. operates an unfunded defined benefit plan. Under this plan, pension costs are actuarially determined using the projected unit credit method. This method considers each period of service as giving rise to an additional unit of benefit entitlement and measures each unit separately to build up the final obligation. Gains or losses on the curtailment or settlement of pension benefits are recognised when the curtailment or settlement occurs. In line with IAS 19 (Revised 2011), Employee Benefits, all actuarial gains and losses are recognised in the year in which they arise, with re-measurements presented within other comprehensive income. The net interest cost is derived by applying a single discount rate to the net surplus or deficit of the fund. These gains and losses are recognised over the expected average remaining working lives of the employees participating in the plan. Otherwise, the actuarial gain or loss is not recognised. When the benefits of the pension plan are improved, the portion of the increased benefit relating to past service by employees is recognised in the consolidated statement of comprehensive income on a straight-line basis over the average period until the benefits become vested. To the extent that the benefits vest immediately, the expense is recognised immediately in the consolidated statement of comprehensive income.
Virtual World (Private) Limited and IBEX Global Solutions (Private) Limited operates a defined contribution plan (i.e. recognised provident fund scheme) for all its permanent employees. Equal monthly contributions at the rate of 6.5% of the basic salary [Virtual World (Private) Limited] and 6.5% of the gross salary [IBEX Global Solutions (Private) Limited] are made to Provident Fund (the Fund) both by the subsidiary and employees. The assets of the Fund are held separately under the control of Trustees. Contributions made by the subsidiary are charged to the consolidated statement of comprehensive income.
TRG Marketing Solutions Limited is currently operating a defined contribution pension with a third party NOW: Pensions. Under this scheme, TRG Marketing Solutions Limited makes contributions for employees who have not opted out of the voluntary pension scheme. The total expense for this plan during the year is $4,504 (2015: nil). Last year, TRG Marketing Solutions Limited operated the TRG Friends Life (No1) Personal Pensions Scheme which was a money purchase scheme under which it made contributions for some employees. This plan was closed during the year when the last employee enrolled in this plan left the company. The total expense for that plan during the period was $293 (2015: $1,757).
(v) Taxation
Current taxation
The charge for current taxation is based on taxable income at the current rates of taxation of the respective countries of incorporation of the Group entities after taking into account applicable tax credits, rebates and exemptions available, if any.
Management periodically evaluates positions taken in tax returns with respect to situations in which applicable tax regulation is subject to interpretation. It establishes provisions where appropriate on the basis of amounts expected to be paid to the tax authorities.
Deferred taxation
Deferred tax is provided on all temporary differences at the end of each reporting period, between the tax base of the assets and liabilities and their carrying amounts for financial reporting purposes.
Notes to the Consolidated Financial Statements

44
For the year ended 30 June 2016
Deferred tax liabilities are recognised for all taxable temporary differences. Deferred tax assets are recognised for all deductible temporary differences and unused tax losses to the extent that it is probable that the deductible temporary differences will reverse in the future and sufficient taxable profits will be available against which the deductible temporary differences and unused tax losses can be utilised. However, deferred tax is not accounted for if it arises from initial recognition of an asset or liability in a transaction other than a business combination that at the time of the transaction affects neither accounting nor taxable profit or loss.
The carrying amount of all deferred tax assets is reviewed at the end of each reporting period and reduced to the extent that it is no longer probable that sufficient taxable profits will be available to allow all or part of the deferred tax assets to be utilised.
Deferred tax assets and liabilities are measured at the tax rates that are expected to apply to the period when the asset is realised or the liability is settled, based on the tax rates (and tax laws) that have been enacted or substantively enacted at the end of the reporting period.
(w) Borrowing costs
Borrowing costs relating to the acquisition, construction or production of a qualifying asset are recognised as part of the cost of that asset. All other borrowing costs are recognised as an expense in the period in which they are incurred.
(x) Investment in subsidiaries
Investment in subsidiaries is carried at cost and tested for impairment on an annual basis.
The preparation of the consolidated financial statements requires the use of certain critical estimates that affect the reported amounts of assets and liabilities, revenues and expenses. It also requires management to exercise its judgment in the process of applying the Group’s accounting policies.
Estimates and judgments are continually evaluated and are based on historical experience and other factors, including expectations of future events that are believed to be reasonable under the circumstances. Due to the inherent uncertainty involved in making those estimates, actual results reported in future periods could differ from those estimates. Revisions to accounting estimates are recognised in the period in which the estimates are revised and in any future periods affected.
In the process of applying Group’s accounting policies, management has made the following estimates and judgments which are significant to the consolidated financial statements:
Recognition of training revenue and associated incremental direct expenses
Management have considered a number of alternative options for the recognition of training revenue and associated incremental direct expenses and following this review, they have concluded the following:
- as training revenue does not have a standalone value to the customer it should be amortised on a straight-line basis over the life of the client contract.
- as incremental direct expenses relate directly to each customer contract, generated or enhanced resources that will be used in satisfying performance obligations in the future and are expected to be recovered in full should be deferred and amortised on a straight-line basis over the life of the client contract.
Notes to the Consolidated Financial Statements

44 45
For the year ended 30 June 2016
Impairment of goodwill
The calculation for considering the impairment of the carrying amount of goodwill requires a comparison of the present value of the cash-generating units to which goodwill has been allocated, to the value of goodwill and the associated assets in the consolidated statement of financial position. The calculation of present value requires an estimate of the future cash flows expected to arise from the cash generating unit, the selection of a suitable discount rate and terminal value.
The key assumptions made in relation to the impairment of goodwill are set out in Note 10.
Staff retirement plans and other employee benefits
The net defined benefit pension plan assets or liabilities are recognised in the Group’s consolidated statement of financial position. The determination of the position requires assumptions to be made regarding future salary increases, mortality, discount rates and inflation. The key assumptions made in relation to the pension plans are set out Notes 27 and 29.
Provision for taxation
Management has estimated the stand-alone tax position of Group entities for inclusion in these consolidated financial statements. The key assumptions made in relation to tax provisioning are set out in Note 30.
Separation of embedded derivative from the line of credit
Management has assessed whether an embedded derivative is required to be separated from the current line of credit in these consolidated financial statements. The key judgments made in relation to this are set out in Note 22.
(z) Exceptional items
Exceptional items are disclosed separately in the consolidated financial statements where it is necessary to do so to provide further understanding of the financial performance of the Group. They are material items of income or expense that have been shown separately due to the significance of their nature and amount. Examples of exceptional items are severance and bonus related to resignation of an executive officer and fees related to early termination of line of credit.
(aa) Standards, Interpretations and Amendments not yet effective
The Group has not early adopted the following new standards, amendments or interpretations that have been issued but are not yet effective. The Directors anticipate that the adoption of these standards will not result in significant changes to the Group’s accounting policies.
• Amendments to IFRS 11, Joint Arrangements (effective 1 January 2016)
• Amendments to IFRS 10 and IAS 28 (Sale or Contribution of Assets between an Investor and its Associate or Joint Venture) (effective 1 January 2016)
• Annual Improvement to IFRSs 2012-2014 Cycle (effective 1 January 2016)
Notes to the Consolidated Financial Statements

46
For the year ended 30 June 2016
(5) Operating segments
These consolidated financial statements have been prepared on the basis of a single operating segment. Whilst the Group operates in different locations, there are no multiple products or lines of services upon which the results reported to the Chief Operating Decision Maker are segregated and analysed.
94.6% and 93.6% of the total revenue was earned from customers in the United States of America for the years ended 30 June 2016 and 2015, respectively.
The following table summarises those non-related party customers with revenue or accounts receivable in excess of 5.0% total revenue or total receivables for the years ended 30 June 2016 and 2015. The revenue analysis below does not form part of the Group’s segmental reporting but is provided voluntarily.
30 June 2016Revenue Accounts receivable
Amount Percentage of total
Amount Percentage of total
$’000’s % $’000’s %
Client 1* 98,695 39 15,847 34Client 2 50,693 20 14,083 30Client 3 47,786 19 5,804 12
197,174 78 35,734 76Others 58,336 22 11,134 24
255,510 100 46,868 100
30 June 2016Revenue Accounts receivable
Amount Percentage of total
Amount Percentage of total
$’000’s % $’000’s %
Client 1* 73,793 31 5,788 21Client 2 29,490 12 2,173 8Client 3 55,937 23 7,422 27Client 4* 28,270 12 2,551 9
187,490 78 17,934 65Others 51,316 22 10,047 35
238,806 100 27,981 100
* In July 2015, two of the Group’s major clients merged.
The above clients are primarily Fortune 100 and/or Fortune 500 companies.
Notes to the Consolidated Financial Statements

46 47
For the year ended 30 June 2016
Revenues are attributed to geographic areas based upon the location in which the sale originated. The Holding Company is domiciled in the United Kingdom.
Non-current assets located outside of the United Kingdom comprises the majority of assets of TRG Customer Solutions Inc., IBEX Philippines Inc. and IBEX Global Solutions (Philippines) Inc. The non-current assets outside of the UK as at 30 June 2016 and 2015 are as follows:
30 June 2016
30 June 2015
Location $’000’s $’000’s
TRG Customer Solutions, Inc. USA 21,284 23,374IBEX Philippines Inc. Philippines 1,405 2,114IBEX Global Solutions (Philippines) Inc. Philippines 11,525 8,694Others Various 6,518 1,742
40,732 35,924
(6) Expenses by nature
30 June 2016
30 June 2015
$’000’s $’000’s
Salaries and other employee benefits (Note 28) 197,536 188,401Depreciation and amortisation 10,183 7,797Foreign currency losses 209 122Other expenses 38,671 33,639
246,599 229,959
Analysed as:Cost of sales 213,225 200,027Selling, general and administrative expenses 33,374 29,932
246,599 229,959
Notes to the Consolidated Financial Statements

48
For the year ended 30 June 2016
Notes to the Consolidated Financial Statements
The analysis of auditors’ remuneration, included under Other Expenses, is as follows:
30 June 2016
30 June 2015
$’000’s $’000’sAudit fees:Audit of Parent Company and consolidated
financial statements 29 29Audit of Parent Company’s subsidiaries
pursuant to legislation 165 154194 183
Non-audit fees:Tax compliance services 1 3Other services 40 41
41 44
(7) Finance costs
30 June 2016
30 June 2015
$’000’s $’000’sInterest on bank borrowings 575 842Interest on invoice discounting 131 15Finance charges on finance lease and
financing arrangements 1,038 732Bank charges 23 15
1,767 1,604
(8) Exceptional items
30 June 2016
30 June 2015
$’000’s $’000’sSeverance and bonus - 1,375
- 1,375
As disclosed in remuneration of Directors in the Directors’ Report, Stephen M. Kezirian resigned as CEO and left his post as Executive Director effective 7 October 2014, and by agreement provided transition assistance through to 31 December 2014. The financial terms of the aforementioned agreement have been reflected in the disclosure above.
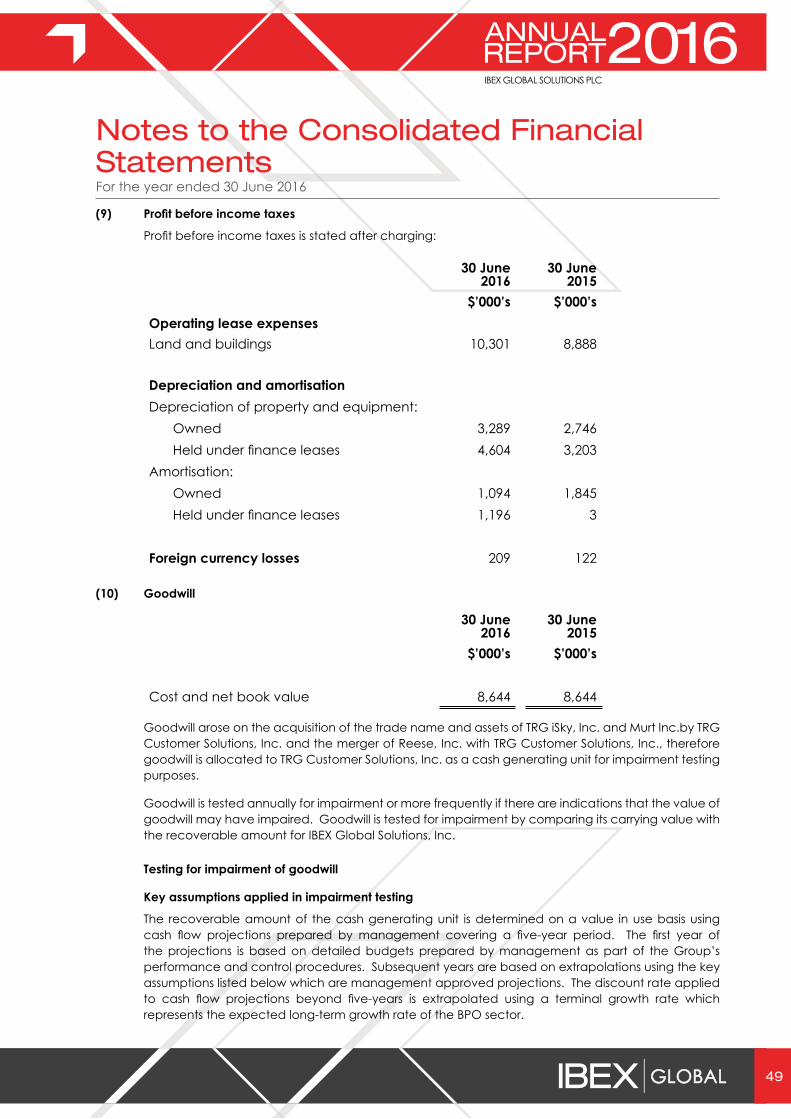
48 49
For the year ended 30 June 2016
Notes to the Consolidated Financial Statements
(9) Profit before income taxes
Profit before income taxes is stated after charging:
30 June 2016
30 June 2015
$’000’s $’000’sOperating lease expensesLand and buildings 10,301 8,888
Depreciation and amortisationDepreciation of property and equipment:
Owned 3,289 2,746Held under finance leases 4,604 3,203
Amortisation:Owned 1,094 1,845Held under finance leases 1,196 3
Foreign currency losses 209 122
(10) Goodwill
30 June 2016
30 June 2015
$’000’s $’000’s
Cost and net book value 8,644 8,644
Goodwill arose on the acquisition of the trade name and assets of TRG iSky, Inc. and Murt Inc.by TRG Customer Solutions, Inc. and the merger of Reese, Inc. with TRG Customer Solutions, Inc., therefore goodwill is allocated to TRG Customer Solutions, Inc. as a cash generating unit for impairment testing purposes.
Goodwill is tested annually for impairment or more frequently if there are indications that the value of goodwill may have impaired. Goodwill is tested for impairment by comparing its carrying value with the recoverable amount for IBEX Global Solutions, Inc.
Testing for impairment of goodwill
Key assumptions applied in impairment testing
The recoverable amount of the cash generating unit is determined on a value in use basis using cash flow projections prepared by management covering a five-year period. The first year of the projections is based on detailed budgets prepared by management as part of the Group’s performance and control procedures. Subsequent years are based on extrapolations using the key assumptions listed below which are management approved projections. The discount rate applied to cash flow projections beyond five-years is extrapolated using a terminal growth rate which represents the expected long-term growth rate of the BPO sector.
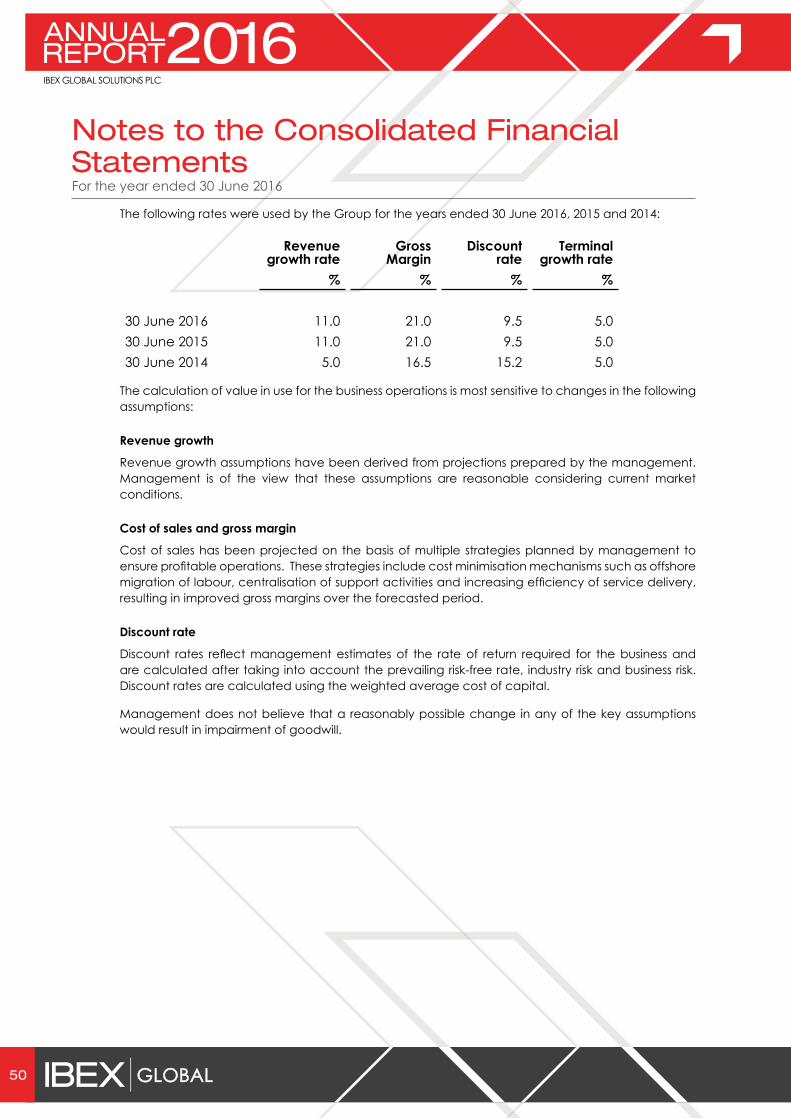
50
For the year ended 30 June 2016
Notes to the Consolidated Financial Statements
The following rates were used by the Group for the years ended 30 June 2016, 2015 and 2014:
Revenue growth rate
Gross Margin
Discount rate
Terminal growth rate
% % % %
30 June 2016 11.0 21.0 9.5 5.030 June 2015 11.0 21.0 9.5 5.030 June 2014 5.0 16.5 15.2 5.0
The calculation of value in use for the business operations is most sensitive to changes in the following assumptions:
Revenue growth
Revenue growth assumptions have been derived from projections prepared by the management. Management is of the view that these assumptions are reasonable considering current market conditions.
Cost of sales and gross margin
Cost of sales has been projected on the basis of multiple strategies planned by management to ensure profitable operations. These strategies include cost minimisation mechanisms such as offshore migration of labour, centralisation of support activities and increasing efficiency of service delivery, resulting in improved gross margins over the forecasted period.
Discount rate
Discount rates reflect management estimates of the rate of return required for the business and are calculated after taking into account the prevailing risk-free rate, industry risk and business risk. Discount rates are calculated using the weighted average cost of capital.
Management does not believe that a reasonably possible change in any of the key assumptions would result in impairment of goodwill.
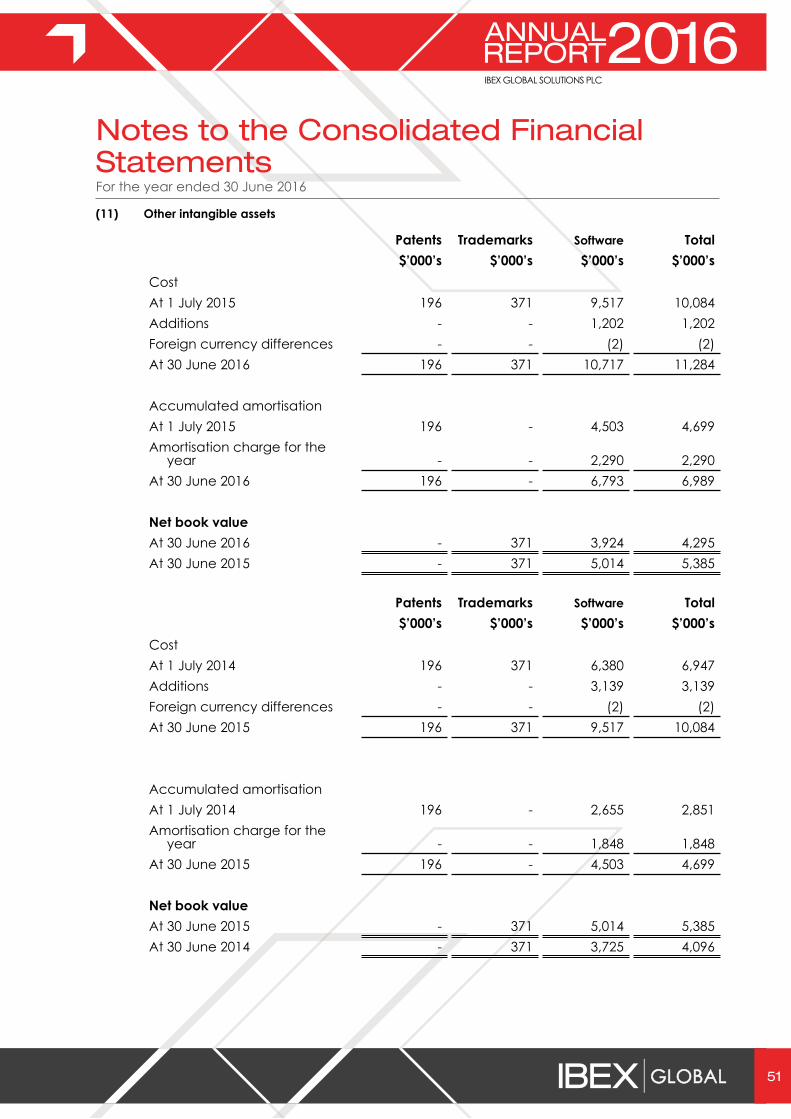
50 51
For the year ended 30 June 2016
Notes to the Consolidated Financial Statements
(11) Other intangible assets
Patents Trademarks Software Total$’000’s $’000’s $’000’s $’000’s
CostAt 1 July 2015 196 371 9,517 10,084Additions - - 1,202 1,202Foreign currency differences - - (2) (2)At 30 June 2016 196 371 10,717 11,284
Accumulated amortisationAt 1 July 2015 196 - 4,503 4,699Amortisation charge for the
year - - 2,290 2,290At 30 June 2016 196 - 6,793 6,989
Net book valueAt 30 June 2016 - 371 3,924 4,295At 30 June 2015 - 371 5,014 5,385
Patents Trademarks Software Total$’000’s $’000’s $’000’s $’000’s
CostAt 1 July 2014 196 371 6,380 6,947Additions - - 3,139 3,139Foreign currency differences - - (2) (2)At 30 June 2015 196 371 9,517 10,084
Accumulated amortisationAt 1 July 2014 196 - 2,655 2,851Amortisation charge for the
year - - 1,848 1,848At 30 June 2015 196 - 4,503 4,699
Net book valueAt 30 June 2015 - 371 5,014 5,385At 30 June 2014 - 371 3,725 4,096
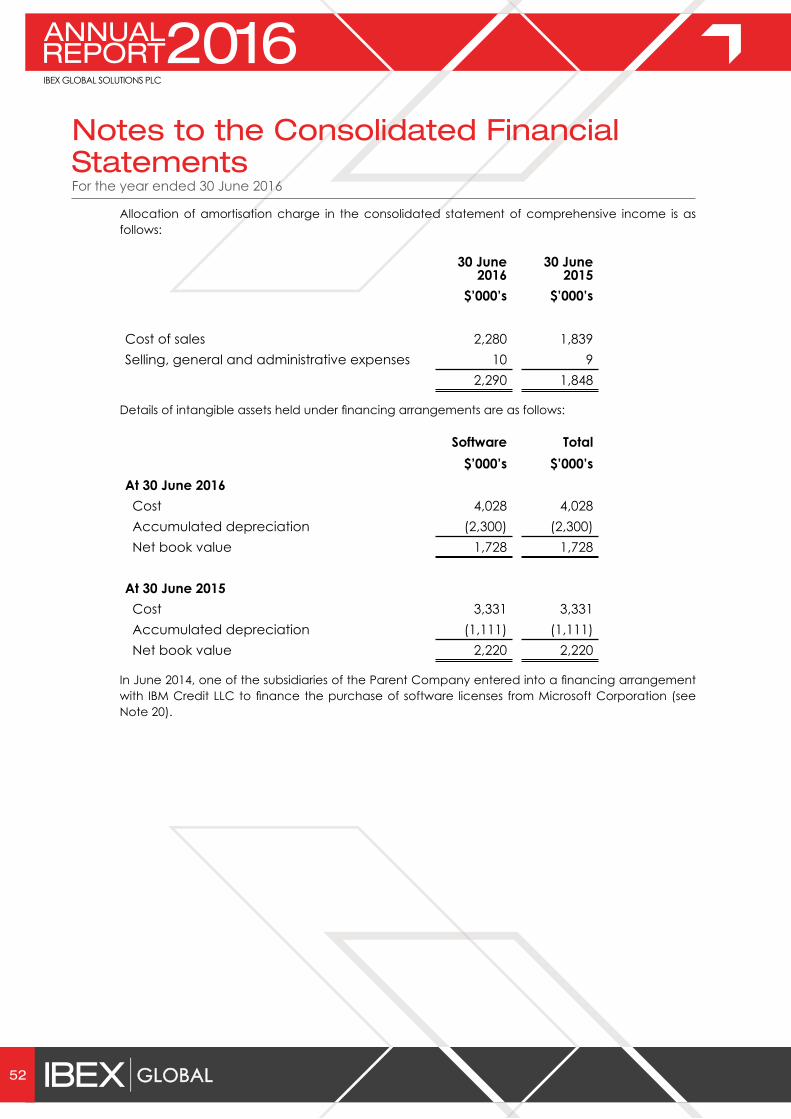
52
For the year ended 30 June 2016
Notes to the Consolidated Financial Statements
Allocation of amortisation charge in the consolidated statement of comprehensive income is as follows:
30 June 2016
30 June 2015
$’000’s $’000’s
Cost of sales 2,280 1,839Selling, general and administrative expenses 10 9
2,290 1,848
Details of intangible assets held under financing arrangements are as follows:
Software Total$’000’s $’000’s
At 30 June 2016 Cost 4,028 4,028 Accumulated depreciation (2,300) (2,300) Net book value 1,728 1,728
At 30 June 2015 Cost 3,331 3,331 Accumulated depreciation (1,111) (1,111) Net book value 2,220 2,220
In June 2014, one of the subsidiaries of the Parent Company entered into a financing arrangement with IBM Credit LLC to finance the purchase of software licenses from Microsoft Corporation (see Note 20).
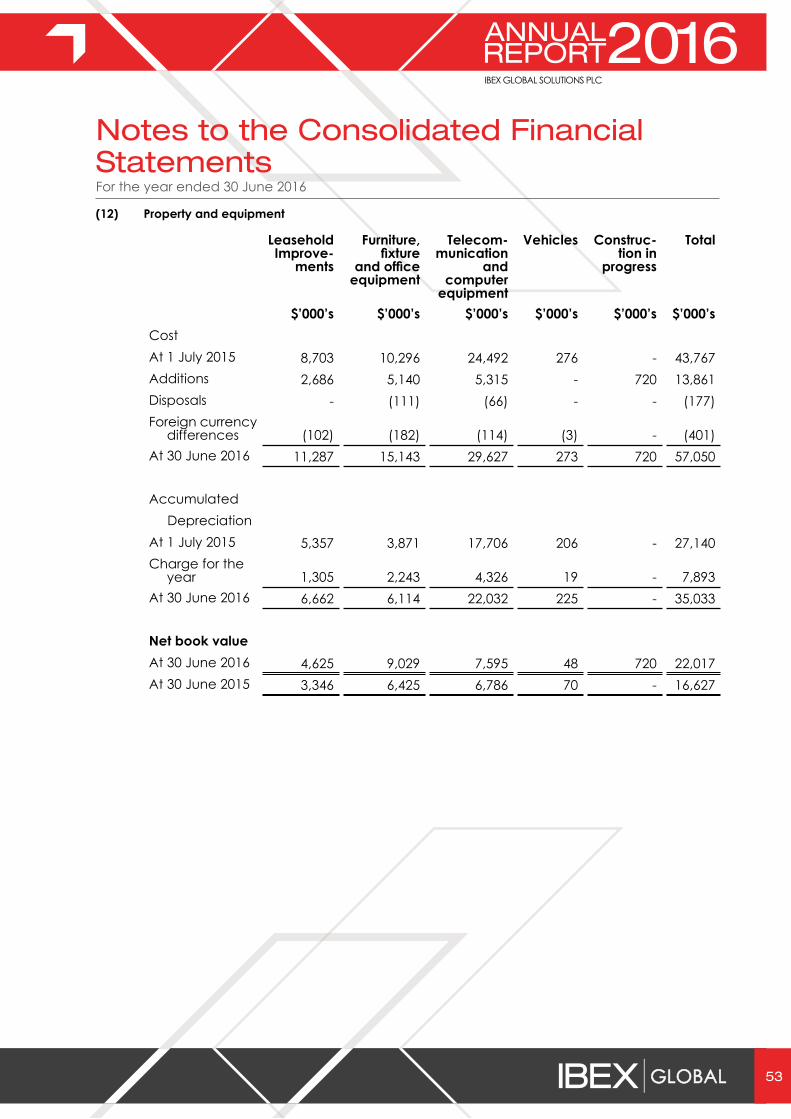
52 53
For the year ended 30 June 2016
Notes to the Consolidated Financial Statements
(12) Property and equipment
Leasehold Improve-
ments
Furniture, fixture
and office equipment
Telecom-munication
and computer
equipment
Vehicles Construc-tion in
progress
Total
$’000’s $’000’s $’000’s $’000’s $’000’s $’000’sCostAt 1 July 2015 8,703 10,296 24,492 276 - 43,767Additions 2,686 5,140 5,315 - 720 13,861Disposals - (111) (66) - - (177)Foreign currency
differences (102) (182) (114) (3) - (401)At 30 June 2016 11,287 15,143 29,627 273 720 57,050
Accumulated DepreciationAt 1 July 2015 5,357 3,871 17,706 206 - 27,140Charge for the
year 1,305 2,243 4,326 19 - 7,893At 30 June 2016 6,662 6,114 22,032 225 - 35,033
Net book valueAt 30 June 2016 4,625 9,029 7,595 48 720 22,017At 30 June 2015 3,346 6,425 6,786 70 - 16,627

54
For the year ended 30 June 2016
Notes to the Consolidated Financial Statements
Leasehold Improvements
Furniture, fixture
and office equipment
Telecommunication and computer
equipment
Vehicles Total
$’000’s $’000’s $’000’s $’000’s $’000’sCostAt 1 July 2014 7,234 8,017 19,944 268 35,463Additions 1,591 2,477 4,634 21 8,723Disposals - - (3) (8) (11)Foreign currency
differences (122) (198) (83) (5) (408)At 30 June 2015 8,703 10,296 24,492 276 43,767
Accumulated depreciationAt 1 July 2014 4,146 2,489 14,370 186 21,191Charge for the
year 1,211 1,382 3,336 20 5,949At 30 June 2015 5,357 3,871 17,706 206 27,140
Net book valueAt 30 June 2015 3,346 6,425 6,786 70 16,627At 30 June 2014 3,088 5,528 5,574 82 14,272

54 55
For the year ended 30 June 2016
Notes to the Consolidated Financial Statements
Details of property and equipment held under finance lease and financing arrangements are as follows:
Leasehold Improvements
Furniture, fixture
and office equipment
Telecommunication and computer
equipment
Vehicles Total
$’000’s $’000’s $’000’s $’000’s $’000’sAt 30 June 2016 Cost 4,430 9,393 7,430 57 21,310 Accumulated
depreciation (2,468) (2,812) (4,114) (30) (9,424) Net book value 1,962 6,581 3,316 27 11,886
At 30 June 2015 Cost 3,787 11,295 1,131 59 16,272 Accumulated
depreciation (1,718) (3,615) (444) (19) (5,796) Net book value 2,069 7,680 687 40 10,476
(13) Other non-current assets
Other non-current assets consist of the following:
30 June 2016
30 June 2015
$’000’s $’000’s
Long-term deposits 2,346 1,218Long-term deferred expenses 938 1,014Long-term prepayment 1,161 1,369Other 53 933
4,498 4,534
On 31 March 2013, the Holding Company entered into a contract of Standard Terms and Conditions with SatMap Inc. (SatMap), subsequently amended on 31 March 2013 and April 2013 (the contract and the two amendments collectively, Agreement). Under the Agreement, the Holding Company (a) issued additional share capital of $1.0 million to TRGI, direct parent of the Holding Company and the indirect parent of SatMap; and (b) issued a note in the amount of $1.0 million payable to SatMap. In exchange, the Holding Company received an asset of $2.0 million in dedicated data services (up to 2000 call-centre seats) from SatMap to be amortised over 120 months. The asset represents an advance payment for the proprietary artificial intelligence and pattern recognition technology invented and developed by SatMap (SatMap Services). The SatMap Services integrate with call-centre telephony and agent staffing to connect in real time customers with agents most likely to produce improved performance and service in call outcomes for such customers. As of 14 October 2013, the Holding Company (with the consent of SatMap) assigned all of its rights and obligations

56
For the year ended 30 June 2016
Notes to the Consolidated Financial Statements
under the Agreement and the note to TRG Customer Solutions, Inc. d/b/a IBEX Global Solutions, Inc. (IBEX US), which assumed all such rights and obligations. The assignment and assumption of the Agreement and the note enables IBEX US to use the SatMap Services in its call centres. IBEX US deploys the SatMap Services in its call centres to enhance performance and as a value-added differentiator for its clients, producing more revenue for both the clients and IBEX US. The total value (net of amortisation) of this asset as of 30 June 2016 is $1.4 million, of which $1.2 million is classified as a non-current asset (long-term prepayment), and $0.2 million is classified as a current asset. The total value (net of amortisation) of this asset as of 30 June 2015 is $1.6 million, of which $1.4 million is classified as a non-current asset (long-term prepayment), and $0.2 million is classified as a current asset.
(14) Trade and other receivables
Trade and other receivables, which are stated at fair value, consist of the following:
30 June 2016
30 June 2015
$’000’s $’000’s
Trade receivables – gross 47,452 28,507Less provision for doubtful debts (584) (526)Trade receivables – net 46,868 27,981Prepayments and other receivables 5,555 3,929Deposits 754 379
53,177 32,289
Provision for doubtful debts
30 June 2016
30 June 2015
$’000’s $’000’s
Balance as of 1 July 526 374Charge for the year 241 184Foreign exchange differences (15) (23)Reversals/write offs against provision (168) (9)Balance as of 30 June 584 526
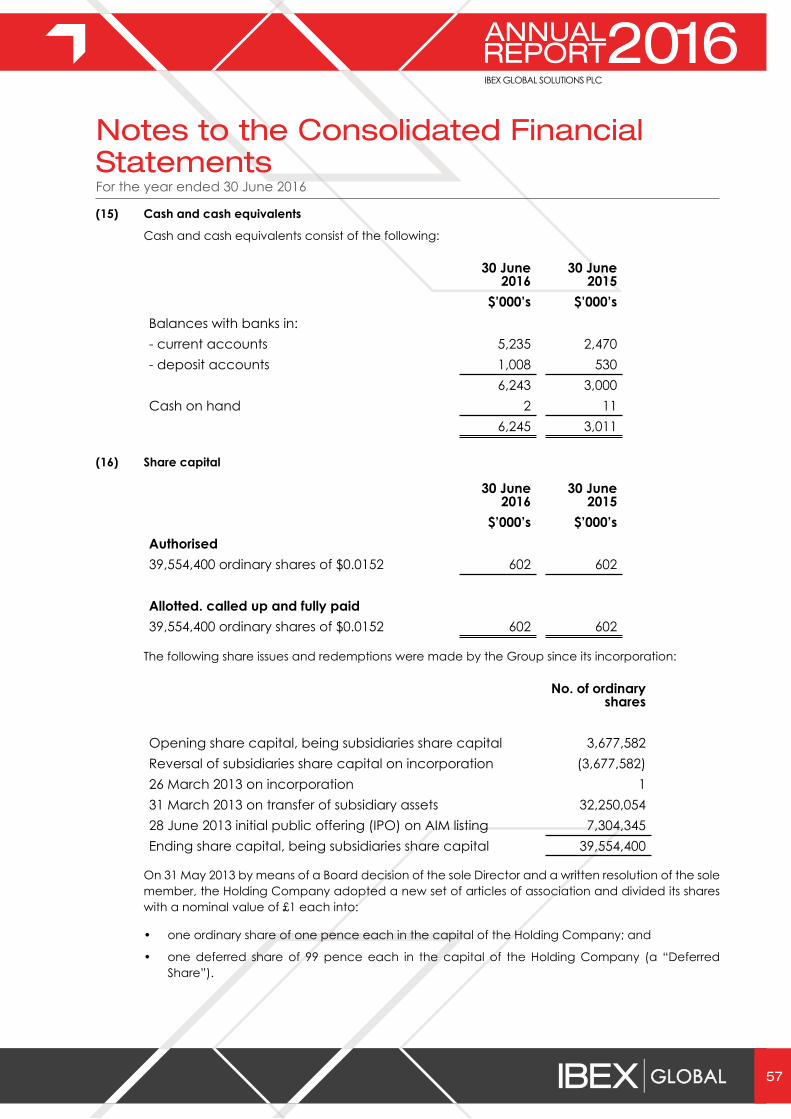
56 57
For the year ended 30 June 2016
Notes to the Consolidated Financial Statements
(15) Cash and cash equivalents
Cash and cash equivalents consist of the following:
30 June 2016
30 June 2015
$’000’s $’000’sBalances with banks in:- current accounts 5,235 2,470- deposit accounts 1,008 530
6,243 3,000Cash on hand 2 11
6,245 3,011
(16) Share capital
30 June 2016
30 June 2015
$’000’s $’000’sAuthorised39,554,400 ordinary shares of $0.0152 602 602
Allotted. called up and fully paid39,554,400 ordinary shares of $0.0152 602 602
The following share issues and redemptions were made by the Group since its incorporation:
No. of ordinary shares
Opening share capital, being subsidiaries share capital 3,677,582Reversal of subsidiaries share capital on incorporation (3,677,582)26 March 2013 on incorporation 131 March 2013 on transfer of subsidiary assets 32,250,05428 June 2013 initial public offering (IPO) on AIM listing 7,304,345Ending share capital, being subsidiaries share capital 39,554,400
On 31 May 2013 by means of a Board decision of the sole Director and a written resolution of the sole member, the Holding Company adopted a new set of articles of association and divided its shares with a nominal value of £1 each into:
• one ordinary share of one pence each in the capital of the Holding Company; and
• one deferred share of 99 pence each in the capital of the Holding Company (a “Deferred Share”).

58
For the year ended 30 June 2016
Notes to the Consolidated Financial Statements
On 31 May 2013 the Holding Company received an application for 100 ordinary shares of one pence each from Mohammed Khaishgi (at par). Mohammed Khaishgi is a Director on TRGI’s Board. On the same date, by means of a Board decision of the sole Director and a written resolution of the sole member, the Holding Company granted its Directors a general and unconditional authority under section 551 of the Companies Act 2006 to allot shares in the Holding Company up to an aggregate nominal amount of £1. Thereafter, 100 ordinary shares of one pence each were issued to Mohammed Khaishgi for an aggregate subscription price of £1.
On 31 May 2013 by means of a Board decision of the sole Director and a written resolution of the eligible shareholder, the Holding Company agreed to purchase 32,000,000 Deferred Shares from TRGI for a total consideration of £1. On the same date, the Holding Company entered into an off-market share purchase agreement with TRGI to effect such transfer of Deferred Shares and upon completion of such share buyback, the Deferred Shares were cancelled.
On 31 May 2013 Mohammed Khaishgi sold his interest in 100 ordinary shares of one pence each in the Holding Company to TRGI for aggregate consideration of £1.
At the conclusion of the above series of transactions, the Holding Company’s share capital consists of 32,250,055 ordinary shares of one pence each, with a nominal share capital of £322,500. The Holding Company issued additional shares with a nominal value of £73,043 at the time of admission to AIM.
All shares are equally eligible to receive dividends and the repayment of capital, and represent one vote each at the Annual General Meeting.
Purchase of treasury shares
In accordance with the terms of the general authority to make market purchases of Holding Company’s own shares granted to it by shareholders of the Company on 20 November 2015, and the announcement made by the Holding Company on 24 August 2015 to extend the period for making purchases of its own shares until such time as the Board shall choose to terminate for a total up to $1.0 million, the Holding Company acquired for cash in the market a total of 39,082 ordinary

58 59
For the year ended 30 June 2016
Notes to the Consolidated Financial Statements
shares as of 30 June 2016. The acquired shares were held in treasury.
Below are the details of treasury shares as of the year ended 30 June 2016.
Acquisition date No. of Shares Price per share (in US$)
Total price (in US$)
19 March 2015 13,888 1.08 14,93028 May 2015 749 1.24 92829 May 2015 700 1.31 9173 June 2015 725 1.56 1,1319 June 2015 745 1.80 1,34230 June 2015 725 1.98 1,4363 July 2015 725 2.00 1,44824 July 2015 725 1.96 1,4245 November 2015 725 2.00 1,45210 November 2015 740 1.96 1,45112 November 2015 735 1.97 1,44919 November 2015 730 1.91 1,39624 November 2015 700 1.91 1,3371 December 2015 745 1.92 1,4308 December 2015 725 1.66 1,20311 December 2015 1,000 1.67 1,66914 December 2015 2,000 1.67 3,35015 December 2015 2,000 1.67 3,33716 December 2015 2,000 1.68 3,36517 December 2015 2,000 1.68 3,36718 December 2015 2,000 1.64 3,28621 December 2015 2,000 1.56 3,12722 December 2015 2,000 1.67 3,338Total 39,082 58,113
The following is the movement of number of ordinary share in issue during fiscal years 2016 and 2015:
30 June 2016
30 June 2015
$’000’s $’000’sOrdinary shares in issue as of 1 July 39,537,593 39,554,400Purchase of shares held in treasury (22,275) (16,807)Ordinary shares in issue as of 30 June 39,515,318 39,537,593

60
For the year ended 30 June 2016
Notes to the Consolidated Financial Statements
The following are the major shareholders (holds 10% or more of Company’s shares):
30 June 2016 30 June 2015% %
TRGI 71.05 71.09Miton Asset Management 16.90 12.00
(17) Capital redemption reserve
30 June 2016 $’000’s
30 June 2015$’000’s
Balance as of 30 June 48,530 48,530
(18) Share option plan
The Group maintains the following share-based payment plans:
Company Stock Plan 2013 Equity-settledPhantom Stock Plan Cash-settled
Any cancellations of grants other than due to termination of employment are treated as acceleration of vesting period and any remaining expense are recognised immediately.
Company Stock Plan 2013
TRGI and the Parent Company adopted an employee stock option plan on 4 June 2013 (the Company Stock Plan 2013). The Company Stock Plan 2013 is composed of both Pre-IPO and Post-IPO plans. The employee stock option plan was adopted to enable certain executives and employees of the Group to be granted options to acquire ordinary shares and restricted stock awards (the Company Options) not to exceed the maximum of 4,301,890 shares with 1,760,892 and 4,147,174 options for ordinary shares of the Parent Company outstanding under the Pre-IPO plan as of 30 June 2016 and 2015, respectively. The maximum allowable shares under the Post-IPO plan is 5,008,341 with 2,853,687 authorized as of 30 June 2016. 2,750,427 and 1,879,717 were outstanding as of 30 June 2016 and 2015 respectively. The options under the Pre-IPO plan are shares of the Parent Company already held by TRGI. When an employee leaves the Company with unexercised stock options under the Pre-IPO plan, these options are returned to TRGI. In contrast, the options under the Post-IPO plan are returned to the Plan for reissuance.
The obligation to issue shares under both plans are with TRGI and the Parent Company, therefore, each individual entity within the Group accounts for these grants by recognising a share-based payment expense for the plan with the corresponding increase in equity. On November 19, 2015, the Company submitted an application for 1,000,000 ordinary shares to receive block admission on the AIM market.
Phantom Stock Plan
Certain subsidiaries of the Parent Company have established the Phantom Stock Plan in order to provide financial incentives to their officers, employees and consultants that are tied to the value of the Parent Company and thereby aligning their interests with the Parent Company’s stockholders.

60 61
For the year ended 30 June 2016
Notes to the Consolidated Financial Statements
For cash settled share-based payment plan, each entity recognises an expense for the services acquired over the vesting period and liability incurred at the fair value of the liability. The entity measures the fair value of the liability at the end of each reporting period until the date of settlement, with any changes in value recognised in profit or loss for the period.
COMPANY STOCK PLAN 2013
The main features of the Company Stock Plan 2013 (which is not yet approved by HM Revenue and Customs) are summarised below:
Eligibility
Options may be granted under the Company Stock Plan 2013 at the discretion of the Board of the Parent Company or a committee of the Board of the Parent Company to employees and/or Directors of the Group.
Scheme limit
No new grants may be issued under the Pre-IPO Plan. The Post-IPO Plan may issue a maximum of 5,008,341 options for new shares with 2,853,687 currently authorized to issue by the Board of Directors.
Grant of options
Options may be granted at any time, at the discretion of the Board of the Parent Company or a committee of the Board of the Parent Company, provided that the grant of Company Options follows the terms of any share dealing, corporate governance code adopted by the Group, the AIM rules and regulations applicable from time to time, or exceed the number of shares authorised and reserved for the Company Stock Plan 2013.
Exercise price
The exercise price payable per ordinary share is:
• in the case of an employee of the Group owning 10 (ten) percent or more of the voting power of all classes of share of the Parent Company, the Ultimate Parent Company or any company in the Group, the exercise of the option shall be equal to or greater than 110 per cent of the fair market value of the ordinary shares on the date the option is granted; and
• in the case of any other employee, the exercise of the option shall be equal to or greater than 100 per cent of the fair market value.
The fair market value shall, where possible, be the closing price per share of the Parent Company as reported on the London Stock Exchange on the date of grant converted to US Dollars.
Amendment and termination
The Company Stock Plan 2013 may be altered or terminated at any time.
Change of control
In the event of a change of control of TRGI or the Parent Company, a certain percentage of the stock may vest and the administrator of the Company Stock Plan 2013 also has discretion as to how the remaining options are determined.

62
For the year ended 30 June 2016
During the years ended 30 June 2016 and 2015, the Group granted 920,523 and 1,508,576 share options under the Post-IPO plan to its employees, respectively. There were no options granted under the Pre-IPO plan for both fiscal years. The weighted average exercise price of options granted during fiscal years 2016 and 2015 was $1.71 and $1.88, respectively. The options have a maximum contractual term of no longer than ten years from their date of grant and vest and become exercisable over a maximum period of 48 months in accordance with terms of the grant agreement. No options had been exercised as at 30 June 2015. In fiscal year 2016, 29,888 options were exercised under Pre-IPO plan.
The Group estimates the fair value of its stock options on the date of the grant using the Black Scholes option pricing model, which requires the use of certain estimates and assumptions that affect the reported amount of share-based compensation cost recognised in the profit or loss. These include estimates of the expected term of stock options, expected volatility of the Parent Company’s shares, expected dividends and the risk-free interest rate:
(a) Expected term
The expected term of options granted is ten years. In estimating the expected term, the Group assumes all options will be exercised at the contractual term of the option.
(b) Volatility
Management used an average volatility of 25.5% and 26.1% for grant calculations for the years ended 30 June 2016 and 2015, respectively.
(c) Expected dividends
The expected average dividend yield is 7.3% and 7.1% for 2016 and 2015, respectively.
(d) Risk-free rate
The risk-free rate is the continuously compounded United States nominal treasury rate corresponding to the term of the option. The average risk-free rate used for options granted during the years ended 30 June 2016 and 2015 were 1.9% and 2.1%, respectively.
Notes to the Consolidated Financial Statements
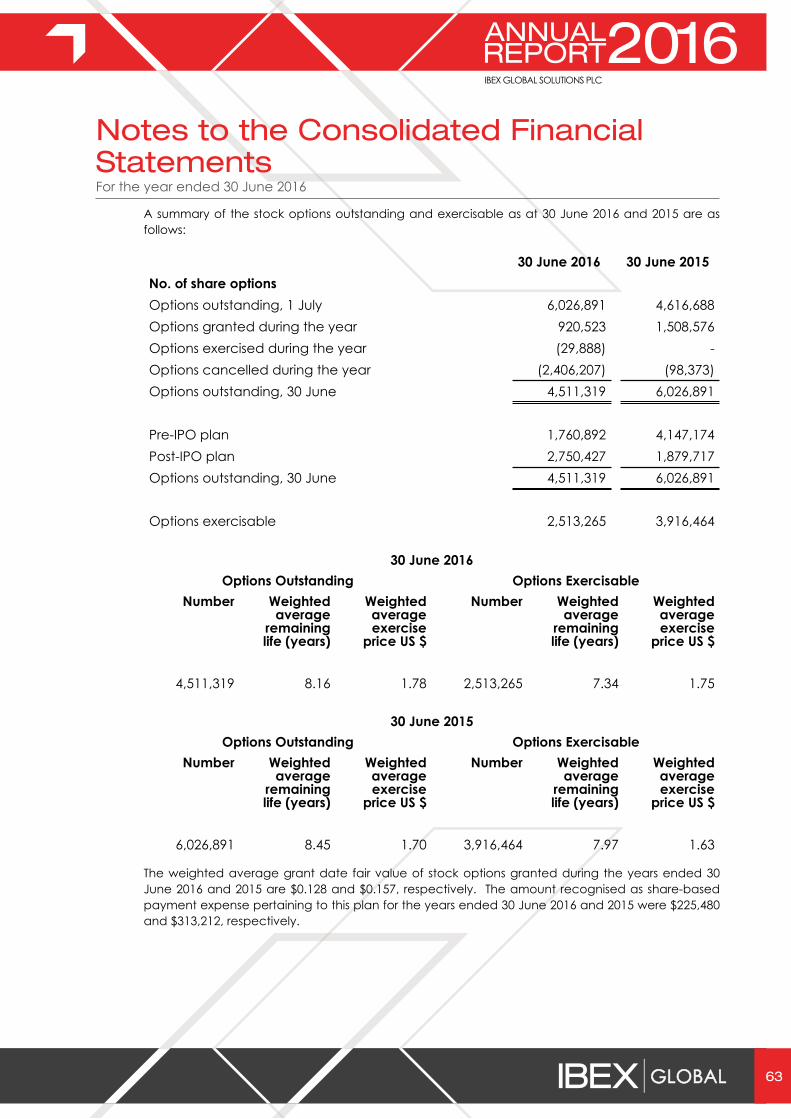
62 63
For the year ended 30 June 2016
A summary of the stock options outstanding and exercisable as at 30 June 2016 and 2015 are as follows:
30 June 2016 30 June 2015No. of share optionsOptions outstanding, 1 July 6,026,891 4,616,688Options granted during the year 920,523 1,508,576Options exercised during the year (29,888) -Options cancelled during the year (2,406,207) (98,373)Options outstanding, 30 June 4,511,319 6,026,891
Pre-IPO plan 1,760,892 4,147,174Post-IPO plan 2,750,427 1,879,717Options outstanding, 30 June 4,511,319 6,026,891
Options exercisable 2,513,265 3,916,464
30 June 2016Options Outstanding Options Exercisable
Number Weighted average
remaining life (years)
Weighted average exercise
price US $
Number Weighted average
remaining life (years)
Weighted average exercise
price US $
4,511,319 8.16 1.78 2,513,265 7.34 1.75
30 June 2015Options Outstanding Options Exercisable
Number Weighted average
remaining life (years)
Weighted average exercise
price US $
Number Weighted average
remaining life (years)
Weighted average exercise
price US $
6,026,891 8.45 1.70 3,916,464 7.97 1.63
The weighted average grant date fair value of stock options granted during the years ended 30 June 2016 and 2015 are $0.128 and $0.157, respectively. The amount recognised as share-based payment expense pertaining to this plan for the years ended 30 June 2016 and 2015 were $225,480 and $313,212, respectively.
Notes to the Consolidated Financial Statements
64
For the year ended 30 June 2016
PHANTOM STOCK PLAN
The main features of the Phantom Stock Plan are summarised below:
Phantom Stock Option
A Phantom Stock Option is the right to receive upon exercise an amount equal to the difference between
(a) the fair value of the share of stock at the time of exercise; and
(b) the exercise price of the option per share of stock.
The following subsidiaries of the Parent Company have established the Phantom Stock Option Plan:
• Virtual World (Private) Limited
• IBEX Global Solutions (Private) Limited
• IBEX Philippines Inc.
• IBEX Global Solutions (Philippines) Inc.
• IBEX Global Solutions Senegal S.A.
Eligibility and grant of options
Options may be granted by the Chief Executive Officer under the Phantom Stock Plan with the approval of a committee of the Board of the respective entity.
Exercise price and exercise date
The exercise price of the options granted under this plan will be provided in the grant notice. Vested options are exercisable at any time after vesting within the terms of the Securities Dealing Code and AIM regulations.
Amendment and termination
The Board of Directors of the respective entity may amend or terminate these plans at any time. This plan shall continue until terminated by the Board of the respective entity.
During the year ended 30 June 2016, the subsidiaries included in the Group granted 239,864 Phantom Stock Options to their respective employees (2015: nil). The weighted average exercise price of all options granted in 2016 was $1.58 (2015: nil). The options have a maximum contractual term of no longer than ten years from their date of grant and vest and become exercisable over a maximum period of 48 months in accordance with terms of the grant agreement. In fiscal year 2016, 42,339 options were exercised under Phantom Stock plan.
The grants of the Phantom Stock Options are treated as cash settled share-based payment transactions under IFRS 2, Share-based Payment. The fair value of the liability is measured at the end of each reporting period and settlement date and changes in fair value are recognised in profit or loss for the period. The Parent Company uses the Black Scholes option pricing model, which requires the use of certain estimates and assumptions that affect the reported amount of share-based compensation cost recognised in the profit or loss. These include estimates of the expected term of stock options, expected volatility of the Parent Company’s shares, expected dividends and the risk-free interest rate:
Notes to the Consolidated Financial Statements
64 65
For the year ended 30 June 2016
(a) Expected term
The expected term of options granted is ten years. In estimating the expected term, the Group assumes all options will be exercised at the contractual term of the option.
(b) Volatility
Management used a volatility of 24.5% and 26.7% for measurement of fair value of options as at 30 June 2016 and 2015, respectively.
(c) Expected dividends
The expected dividend yield is 7.3% and 7.1% for 2016 and 2015, respectively.
(d) Risk-free rate
The risk free rate is the continuously compounded United States nominal treasury rate corresponding to the term of the option. The risk free rate used for computation of fair value of options as at 30 June 2016 and 2015 were 1.3% and 2.1%, respectively.
A summary of the stock options outstanding and exercisable as at 30 June 2016 and 2015 are as follows:
30 June 2016
30 June 2015
No. of share optionsOptions outstanding, 1 July 697,924 771,388Options granted during the year 239,864 -Options exercised during the year (42,339) -Options cancelled during the year (19,824) (73,464)Options outstanding, 30 June 875,625 697,924
Options exercisable 591,130 491,878
30 June 2016Options Outstanding Options Exercisable
Number Weighted average
remaining life (years)
Weighted average exercise
price US $
Number Weighted average
remaining life (years)
Weighted average exercise
price US $
875,625 7.78 1.79 591,130 6.98 1.77
Notes to the Consolidated Financial Statements

66
For the year ended 30 June 2016
30 June 2015Options Outstanding Options Exercisable
Number Weighted average
remaining life (years)
Weighted average exercise
price US $
Number Weighted average
remaining life (years)
Weighted average exercise
price US $
697,924 8.01 1.88 491,878 7.98 1.74
The weighted average fair value of the Phantom Stock Options as at 30 June 2016 and 2015 are $.051 and $0.264, respectively. For the year ended 30 June 2016 and 2015, the Group recognised income on share-based payment amounting to $135,137 and $475,208, respectively. A total of 491,878 Phantom Stock Options having total intrinsic value of $174,408 have vested as at 30 June 2015. There were no Phantom Stock Options with intrinsic value as of 30 June 2015. The liability under the Phantom Stock Plan as at 30 June 2016 and 2015 was included as other non-current liabilities (Note 21).
(19) Liabilities against assets subject to finance lease
Liabilities against assets subject to finance lease are secured by the related assets held under finance leases. Future minimum lease payments at 30 June 2016 and 2015 are as follows:
30 June 2016 30 June 2015Minimum
lease payments
Present value of payments
Minimum lease
payments
Present value of payments
$’000’s $’000’s $’000’s $’000’s
Within one year 4,169 3,579 4,358 3,730After one year but
not more than five years 6,598 6,090 8,079 7,159
Total minimum lease payments 10,767 9,669 12,437 10,889
Less amounts representing finance charges (1,098) - (1,548) -
Present value of minimum lease payments 9,669 9,669 10,889 10,889
Less current portion shown under current liabilities (3,579) (3,579) (3,730) (3,730)
Obligation under finance lease – non-current 6,090 6,090 7,159 7,159
These lease arrangements have interest rates ranging from 6.0% to 8.0% and 5.0% to 10.0% for the years ended 30 June 2016 and 30 June 2015, respectively. At the end of the lease term, the ownership of the assets shall be transferred to the respective entities of the Group.
Notes to the Consolidated Financial Statements

66 67
For the year ended 30 June 2016
(20) Financing arrangements
In June 2014, the US subsidiary of the Holding Company (TRG Customer Solutions, Inc., TRG CS or IBEX US) entered into a $3.3 million three-year financing agreement (IBM Agreement) with IBM Credit LLC (IBM) to finance the purchase of software licenses (under a Select Agreement) from Microsoft Corporation (Microsoft). In June 2014, IBEX US also entered into a three-year Enterprise Agreement with Microsoft for the use of certain cloud software services for approximately $1.1 million in year one, with minimum service commitments of approximately $50,000 in each of years two and three. The monthly financing payments under the IBM Agreement are approximately $103,000 per month for 36 months which began in July 2014. The monthly payments under the Microsoft Enterprise Agreement during year one were approximately $100,000 per month which began in July 2014, with minimum monthly service commitments of approximately $4,000 in each of years two and three.
IBEX US acquired the Microsoft software licenses and cloud services to accommodate the needs of the IBEX Group and to facilitate the acquisition by the Holding Company’s parent, TRGI, of software for TRGI and its non-IBEX subsidiaries. Consequently, TRGI, the Holding Company and IBEX US have entered into an agreement as of July 2014 under which the Holding Company has sub-licensed to TRGI the use, for a fixed monthly consideration (that includes a management fee / mark-up), of that portion of the software and services purchased that correspond to the requirements of TRGI and its non-IBEX subsidiaries. The management fee of $1.4 million and $2.7 million for the years ended 30 June 2016 and 2015, respectively, was shown as Other Income (2016: $1.2 million, 2015: $1.3 million) and set-off against Cost of Sales (2016: $52 thousand, 2015: $1.2 million) and Finance Costs (2016: $0.1 million, 2015: $0.2 million) in the consolidated statement of comprehensive income.
In addition, IBEX US has financed the purchase of various property and equipment and software during the fiscal year 2016 and 2015 with CIT Finance LLC (CIT) and IBM. As of 30 June 2016 and 2015, IBEX US has financed $12.2 million and $9.8 million, respectively, of assets with CIT and IBM at the interest rates ranging from 6.0% to 8.0% per annum for the years ended 30 June 2016 and 2015. Also in the fiscal year 2016, IBEX US availed of a non-revolving line of credit from PNC to finance capital expenditures (Note 22).
As of 30 June 2016 and 2015, the outstanding liabilities from these transactions are shown in the consolidated statement of financial position as follows:
30 June 2016Current Non-current$’000’s $’000’s
IBM Credit LLC 2,607 890CIT Finance LLC 661 90PNC 624 1,135
3,892 2,115
Notes to the Consolidated Financial Statements

68
For the year ended 30 June 2016
30 June 2015Current Non-current$’000’s $’000’s
IBM Credit LLC 2,514 3,501CIT Finance LLC 682 750
3,196 4,251
Future minimum lease payments to IBM and CIT at 30 June 2016 and 2015 are as follows:
30 June 2016 30 June 2015Minimum
lease payments
Present value of payments
Minimum lease
payments
Present value of payments
$’000’s $’000’s $’000’s $’000’s
Within one year 4,155 3,892 3,626 3,196After one year but
not more than five years 2,189 2,115 4,404 4,251
Total minimum lease payments 6,344 6,007 8,030 7,447
Less amounts representing finance charges (337) - (583) -
Present value of minimum lease payments 6,007 6,007 7,447 7,447
Less current portion shown under current liabilities (3,892) (3,892) (3,196) (3,196)
Obligation under finance lease – non-current 2,115 2,115 4,251 4,251
Notes to the Consolidated Financial Statements

68 69
For the year ended 30 June 2016
(21) Other non-current liabilities
30 June 2016
30 June 2015
$’000’s $’000’s
Deferred rent – long-term 428 649Pensions - defined benefit plan (Note 27) 633 494Phantom stock plan (Note 18) 26 161Other 8 -
1,095 1,304
(22) Working capital line of credit
On 8 November 2013, a subsidiary of IBEX (the Subsidiary) signed a Revolving Credit and Security Agreement with PNC for a new $35.0 million Revolving Line Of Credit (RLOC) to replace the Capital Source Bank $20.0 million RLOC. The said agreement will mature on 7 November 2016 and promises an interest rate of LIBOR +2.50% and or the PNC Commercial Lending Rate (as publically announced) +0.25%. During the course of the fiscal year 2014, the Subsidiary entered into a waiver and an amendment (Amendment 1) whereby PNC waived the Borrowers technical non-compliance with a certain covenant cap. On 2 October 2014, the Subsidiary entered into an amendment (Amendment 2) whereby PNC increased the caps associated with certain covenants, increased indebtedness, and waived past technical covenant non-compliance events.
In this agreement, the Subsidiary derived value from the choice of interest rates, depending on the rate selected. This value changes in response to the changes in the various interest rates alternatives. Thus, a derivative is embedded within the loan commitment, i.e. the facility terms which are agreed for a fixed period until 2016. The part of the value associated with the loan commitment derivative (the embedded derivative part) is derived from the potential interest rate differential between the alternative rates, i.e. it creates economic characteristics that are different to a typical loan commitment.
The Subsidiary assessed that the derivative is considered to be closely related and is not separated as part of the loan commitment due to the following factors: (1) the instrument can be settled in a way that PNC would recover substantially all of its investment (the borrowed principal) since the derivative only impacts the choice in interest rate; and (2) PNC will not generate a rate of return that is at least twice that of the market return because no matter which rate is selected, each interest rate alternative available to the Subsidiary (each of the PNC, FFOR and 2 LIBOR rates) represents a market rate of interest and would be impacted in the same way by market factors.
During the course of the fiscal year 2015 the Subsidiary entered into an amendment (Amendment 3) whereby PNC increased caps associated with certain covenants. On 19 June 2015 the Subsidiary entered into an amendment (Amendment 4) whereby PNC consented to permit the Subsidiary to sell specific receivables to Citibank, N.A. On 26 June 2015, the Subsidiary entered into an amendment (Amendment 5) whereby PNC increased the RLOC to $40.0 million, with a potential increase of up to a total of $50.0 million (subject to PNC approval and conditions), included a $10.0 million non-revolving line of credit to finance capital expenditures, reduced the interest rate to LIBOR +1.75% and/or the PNC Commercial Lending Rate for domestic loans, extended the maturity date to May 2020, and included certain standard financial covenants.
Notes to the Consolidated Financial Statements
70
For the year ended 30 June 2016
On 30 June 2016 the Subsidiary entered into an amendment (Amendment 6) whereby PNC extended a $6.0 million Term Loan A which will be amortised in 36 consecutive equal monthly instalments. PNC would also extend a $4.0 million Term Loan B to be also amortised in 36 consecutive equal monthly instalments and would be drawn down subject to certain conditions. The maximum amount of Equipment Loan shall now be $3.0 million.
On 22 July 2016 the Subsidiary entered into an amendment (Incremental Amendment 6) with PNC RSCA to further define the clauses in Amendment 6 without changing the main terms. Under Amendment 6 as well as Incremental Amendment 6 the Subsidiary is required to enter into a Lender-Provided Interest Rate Hedge in an amount not less than fifty percent (50%) of Term Loan A and Term Loan B within a specified period from their respective funding. The Subsidiary has therefore entered into a Lender-Provided Interest Rate Hedge on 15 August 2016 in relation to Term Loan A.
(23) Trade and other payables
30 June 2016
30 June 2015
$’000’s $’000’s
Trade payables 6,212 2,820Accrued expenses and payables 7,704 5,719Accrued salaries and wages 16,836 16,762
30,752 25,301
(24) Grants
The Group received grants from various US states as follows:
• The Group recorded grant income of $200,000 from State of Texas for the provision of employee instruction/training and associated expenses in support of the Group’s commitment to maintain and increase jobs and income in Texas in each of the years ended 30 June 2016 and 2015. The Grant Contract is effective for the period commencing 2 January 2014 and ending on 31 December 2019. The total amount awarded to the Group under this Grant Contract is $600,000. These funds were treated as a reduction in Cost of Sales for the years ended 30 June 2016 and 2015.
• The Group recorded grant income of $111,000 from State of Tennessee, Department of Economic and Community Development for the provision of employee instruction/training and associated expenses in support of the Group’s commitment to maintain and increase jobs and income in Tennessee in 30 June 2015. The Grant Contract is effective for the period commencing 21 May 2012 and ended on 20 May 2015. The total amount awarded to the Group under this Grant Contract is $595,000. These funds were treated as a reduction in Cost of Sales for the year ended 30 June 2015.
(25) Contingencies and commitments
Contingencies
The Group and its subsidiaries are subject to claims and lawsuits filed in the ordinary course of business. Management does not anticipate that the outcome of any of the proceedings will have a material adverse effect on the Group’s business results, operations, liquidity, or financial condition. Although
Notes to the Consolidated Financial Statements
70 71
For the year ended 30 June 2016
management does not believe that any such proceedings will have material adverse effect, no assurances to that effect can be given based on the uncertainty of litigation and demands of third parties.
In March 2012, an ex-employee of a related company filed a complaint in the West Virginia Human Rights Commission (WVHRC), alleging unlawful discrimination due to race and unlawful retaliation. The plaintiff was a former employee of TRG Insurance Solutions, Inc. (TRGIS), a then-sister corporation of IBEX US. TRGIS was an entirely separate corporation with its own lines of business, management and employees. Plaintiff asserted that IBEX US did not offer her a job because of her race and in retaliation for her having previously filed a discrimination complaint against TRGIS, a different company. IBEX US defended on the grounds (among others) that (1) its records show race-neutral employment practices, and (2) IBEX US as a matter of law cannot be liable for retaliating against a person whom it never employed. This case was tried in December 2012, before a temporary administrative law judge (ALJ) of the WVHRC. The ALJ issued orders in 2014 awarding damages, costs and attorney’s fees to plaintiff totalling $246,000. In the orders, the ALJ acknowledged that he was creating new law in finding for plaintiff. IBEX US appealed these orders to the WVHRC. In July 2015, the WVHRC affirmed the orders entered by the ALJ. IBEX US timely filed its appeal (of the decision of the WVHRC) to the Circuit Court of Kanawha County, West Virginia (the “Circuit Court), which was the next step in the judicial process. IBEX US won the matter on appeal at the Circuit Court, and the decision was reversed. The plaintiff has appealed the matter to the Supreme Court of West Virginia, where the matter is currently being reviewed. IBEX US does not believe that this case has any merit, and is optimistic that the Supreme Court of West Virginia will affirm the decision reached by the Circuit Court.
A case was filed in November 2014 in the US District Court of Tennessee as a collective action under the US Fair Labor Standards Act (FLSA) and Tennessee law, alleging that plaintiff were forced to work “off the clock” without being paid for the “off the clock” time. In December 2014, a similar FLSA collective action case was filed against IBEX US in the US District Court for the District of Columbia. In the last several years, similar wage hour claims have been filed against many other BPO companies in the United States. Plaintiffs in both cases had executed mandatory arbitration agreements with IBEX US. In February 2015, the two cases were consolidated in Tennessee and Plaintiff agreed to submit all claims to mediation and then binding arbitration (a date has not been set). Presently, there are approximately 3,500 individuals, who have opted into the lawsuit. Discovery and internal investigations into this matter are ongoing. Plaintiff have not made any claim for any identified amount of damages and at this time, damages cannot reasonably be determined. IBEX is defending this case vigorously.
In March 2015, IBEX US received a notice from one of its major clients of a claim for indemnification under applicable client service agreements. This notice resulted from a data security breach that occurred during late 2014 at one of the Group’s call centres. IBEX and the client had cooperated to investigate the problem and take appropriate remedial action. There was no evidence of any financial loss to any customer of the client. Taking into account the facts and circumstances known at this point, together with applicable insurance coverage, IBEX US believes that this potential indemnity claim should fall within the applicable insurance policy limitations.
Commitments
The Group has an annual telecommunication service commitment with two of its carriers. The carrier agreement was signed in January 2015 for a three-year term with the minimum annual commitment for $600,000. The agreement has a provision for an early termination at its one-year anniversary with a sixty day written notice. A second carrier agreement was signed in July 2016 for a three-year term with minimum annual commitment for $691,900.
Notes to the Consolidated Financial Statements

72
For the year ended 30 June 2016
The Group is also subject to early termination provisions in certain telecommunications contracts, which if enforced by the telecommunications providers, would subject the Group to early terminations fees. To date, these early termination provisions had not been triggered by the Group.
(26) Operating leases
Certain Group companies have access to computer equipment, software, office facilities, furniture and fixtures and office premises under operating lease arrangements, of which certain arrangements have renewal options and escalation clauses for operating expenses and inflation. Rent expense is recognised on a straight-line basis over the life of the lease term. Future minimum lease rentals under operating leases subsequent to the reporting period are as follows:
30 June 2016
30 June 2015
$’000’s $’000’s
Within one year 7,172 6,929After one year but not more than five years 15,015 16,586More than five years - 605
22,187 24,120
Rental expenditure was approximately $10.3 million and $8.9 million for the years ended 30 June 2016 and 2015, respectively.
(27) Retirement benefits obligations
IBEX Philippines Inc. and IBEX Global Solutions (Philippines) Inc. operates an unfunded defined benefit plan for qualifying employees. Under this plan, the employees are entitled to one half month’s salary for every year of service, with six months or more of service considered as one year. One half month’s salary has been defined to include the following:
• 15 days salary based on the latest salary rate
• cash equivalent to 5 days service incentive leave
• one-twelfth of the 13th month’s pay
An employee is entitled to retirement benefits only upon attainment of a retirement age of 60 years and completion of at least five years of previously credited service. No other post-retirement benefits are provided to these employees. The most recent actuarial valuations of the present value of the defined benefit obligation were carried out on 30 June 2016. The present value of the defined benefit obligation, and the related current service cost and past service cost, were measured using the projected unit credit method.
IAS 19 (Revised 2011), Employee Benefits, is applicable for accounting periods beginning on or after 1 January 2013. This revised standard made various changes to the accounting for defined benefit pension schemes including requiring all remeasurements (actuarial gains and losses) to be recognised in other comprehensive income and a different calculation of the net interest cost to be recognised in profit or loss.
Notes to the Consolidated Financial Statements

72 73
For the year ended 30 June 2016
The principal assumptions used for the purposes of the actuarial valuations are as follows:
30 June 2016
30 June 2015
% %
Discount rate 5.4 4.8Expected rate of salary increase 2.0 3.0
Amounts recognised within Cost of Sales in the consolidated statement of comprehensive income in respect of defined benefit plan are as follows:
30 June 2016
30 June 2015
$’000’s $’000’s
Current service cost 239 98Interest on obligation 24 98
263 107
The amount included in the consolidated statement of financial position in respect of its defined benefit plan obligation as of 30 June 2016 and 2015 are as follows:
30 June 2016
30 June 2015
$’000’s $’000’s
Present value of unfunded defined benefit obligation 633 494633 494
The movements in the defined benefit plan obligation for the years ended are as follows:
30 June 2016
30 June 2015
$’000’s $’000’s
Present value of defined benefit obligation, 1 July 494 173Foreign exchange differences 8 (11)Current service cost 239 98Interest cost 24 9Actuarial loss / (gains) (132) 225Present value of defined benefit obligation, 30 June 633 494
Notes to the Consolidated Financial Statements

74
For the year ended 30 June 2016
The historical information of the amounts for the current and previous annual periods is as follows:
30 June 2016
30 June 2015
30 June 2014
30 June 2013
$’000’s $’000’s $’000’s $’000’s
Present value of defined benefit obligation
633 494 173 178
The Group is yet to contribute to a plan asset as of 30 June 2016.
(28) Employee information
Expenses recognised for employee benefits are analysed below:
30 June 2016
30 June 2015
$’000’s $’000’s
Salaries and other employee costs 161,478 152,293Social security and other taxes 35,421 35,921Share-based payment 90 (162)Retirement – contribution plan 284 242Pensions – defined benefits plan (Note 27) 263 107
197,536 188,401
Average number of employees are analysed below:
30 June 2016
30 June 2015
$’000’s $’000’s
Direct labour 14,836 11,927Administrative staff 1,002 854
15,838 12,781
Notes to the Consolidated Financial Statements

74 75
For the year ended 30 June 2016
(29) Remuneration of key management personnel
30 June 2016
30 June 2015
$’000’s $’000’sKey management personnel including DirectorsManagerial remuneration 7,769 7,475Short-term employee benefits 2,541 3,376Retirement benefits 199 32Employee share option expense 208 272
10,717 11,155
30 June 2016
30 June 2015
$’000’s $’000’sDirectorsManagerial remuneration 1,300 1,936Short-term employee benefits 122 837Retirement benefits 8 2Employee share option expense 95 197
1,525 2,972
The key management personnel include the senior management team, having an annual base salary of $100,000 or more.
The number of key management personnel including Directors was 48 and 55 for the years ended 30 June 2016 and 2015, respectively.
The number of key management personnel including Directors participating in defined contribution retirement benefit schemes was 20 and 22 for the years ended 30 June 2016 and 2015, respectively.
As disclosed in remuneration of Directors in Directors’ Report, Stephen M. Kezirian resigned as CEO and left his post as Executive Director effective 7 October 2014, and by agreement provided transition assistance through to 31 December 2014. The financial terms of the aforementioned agreement have been reflected in the disclosure above. Mr. Kezirian’s options continued vesting until the day after the first anniversary of his resignation date, and any of Mr. Kezirian’s vested options became exercisable up until April 2016 after which the options expired. Mohammed Khaishgi, a Non-executive Director, succeeded Mr. Kezirian as interim CEO. Robert T. Dechant became CEO and an Executive Director on 1 May 2015. Mr. Khaishgi continues as a Non-executive Director.
Notes to the Consolidated Financial Statements

76
For the year ended 30 June 2016
Remuneration for highest paid Director
30 June 2016
30 June 2015
$’000’s $’000’s
Managerial remuneration 150 729Short-term employee benefits 780 792Retirement benefits 12 2Employee share option expense - 46
942 1,569
(30) Income taxes
The tax provision consists of the following:
30 June 2016
30 June 2015
$’000’s $’000’s
Current 1,201 676Deferred (543) 154Income tax expense 658 830
The US tax provision calculations include TRG Customer Solutions, Inc. (trading as IBEX Global Solutions, Inc.). Additionally, included in the provision are TRG Marketing Solutions Limited (UK), IBEX Luxembourg, Virtual World (Private) Limited (Pakistan), IBEX Global Solutions (Private) Limited (Pakistan), IBEX Senegal, and IBEX Philippines Inc.
Deferred income taxes reflect the net tax effects of temporary differences between the carrying amounts of assets and liabilities for financial reporting purposes and the amounts used for income tax purposes, as well as net operating losses and tax credit carry forwards. Deferred tax assets and liabilities are measured using the enacted tax rates that will apply to taxable income in the periods the deferred tax item is expected to be settled or realised. The tax effects of the Group’s temporary differences and carry forwards are shown at the succeeding page.
Notes to the Consolidated Financial Statements

76 77
For the year ended 30 June 2016
Tax effect of deductible / (taxable) temporary differences
30 June 2016
30 June 2015
$’000’s $’000’sTax effect of deductible temporary differences:- Provisions and write offs against trade debts 454 193- Unpaid accrued expenses/compensation 101 215- Deferred revenue 342 89- Net operating losses 3,443 3,510- Property and equipment 55 35
4,395 4,042Tax effect of taxable differences:- Property and equipment (337) (899)- Intangible assets (1,158) (1,032)
(1,495) (1,931)
Less deferred tax asset not recognised (1,316) (1,071)Total deferred tax 1,584 1,040
Comprising:Deferred tax asset 3,079 2,971Deferred tax liability (1,495) (1,931)
1,584 1,040
Deferred tax assets on deductible temporary differences (including unused tax losses) are recognised to the extent that realisation of the related tax benefit is probable on the basis of the Group’s current expectations of future taxable profits. Unrecognised deductible temporary differences represent net operating losses of Group’s European, Canadian and Philippine subsidiaries as, the management is of the prudent view that, it is not probable that sufficient taxable profits will be available for those subsidiaries in the foreseeable future against which unused tax losses can be utilised.
At 30 June 2016, the Group’s US federal net operating loss carry forward for income tax purposes are $5.2 million (30 June 2015: $5.9 million) which will begin to expire in 2034. The Group’s Canadian subsidiary has net operating loss carry forward of $1.8 million (30 June 2015: $1.7 million), expiring over the period 2027 through 2036. The Group’s European subsidiaries have net operating loss carry forward of $3.9 million (30 June 2015: $3.4 million). These amounts are based on the income tax returns filed for the year ended 30 June 2015 and estimated amounts for the year ended 30 June 2016.
Management has evaluated the Group’s tax positions and concluded that the Group had taken no uncertain tax positions that require adjustment to the consolidated financial statements. The Group recognises interest and penalties related to uncertain tax positions in income tax expense. As of 30 June 2016, the Group had no provision for interest or penalties related to uncertain tax positions. The years 2012-2015 are open to examination by the tax authorities.
Notes to the Consolidated Financial Statements

78
For the year ended 30 June 2016
Reconciliation of effective tax rate
30 June 2016
30 June 2015
$’000’s $’000’s
Income before taxation 7,144 7,243Income tax expense (658) (830)Net income for the year 6,486 6,413
A reconciliation between the applicable tax rate (34% US statutory federal income tax rate) and effective tax rate is as follows:
30 June 2016 30 June 2015% $’000’s % $’000’s
Income tax expense using applicable tax rate (34) (2,429) (34) (2,462)State taxes (net of federal tax effect) (5) (390) (4) (321)Effect of tax and exchange rates in foreign
jurisdictions(1) (61) (9) (614)
Non-deductible expenses / exempt income 38 2,727 27 1,921Prior year provision (4) (260) (2) (136)Change in unrecognised temporary differences (3) (245) 11 782
(9) (658) (11) (830)
(31) Earnings per share
(a) Basic
Basic earnings per share is calculated by dividing the profit attributable to equity holders of the Holding Company by the weighted average number of ordinary shares in issue during the year.
30 June 2016
30 June 2015
$’000’s $’000’s
Profit attributable to equity holders of the Holding Company (in US$'000's)
6,486 6,413
Weighted average number of ordinary shares in issue
39,523,391 39,549,407
Basic earnings per share (in US$) 0.164 0.162
Notes to the Consolidated Financial Statements
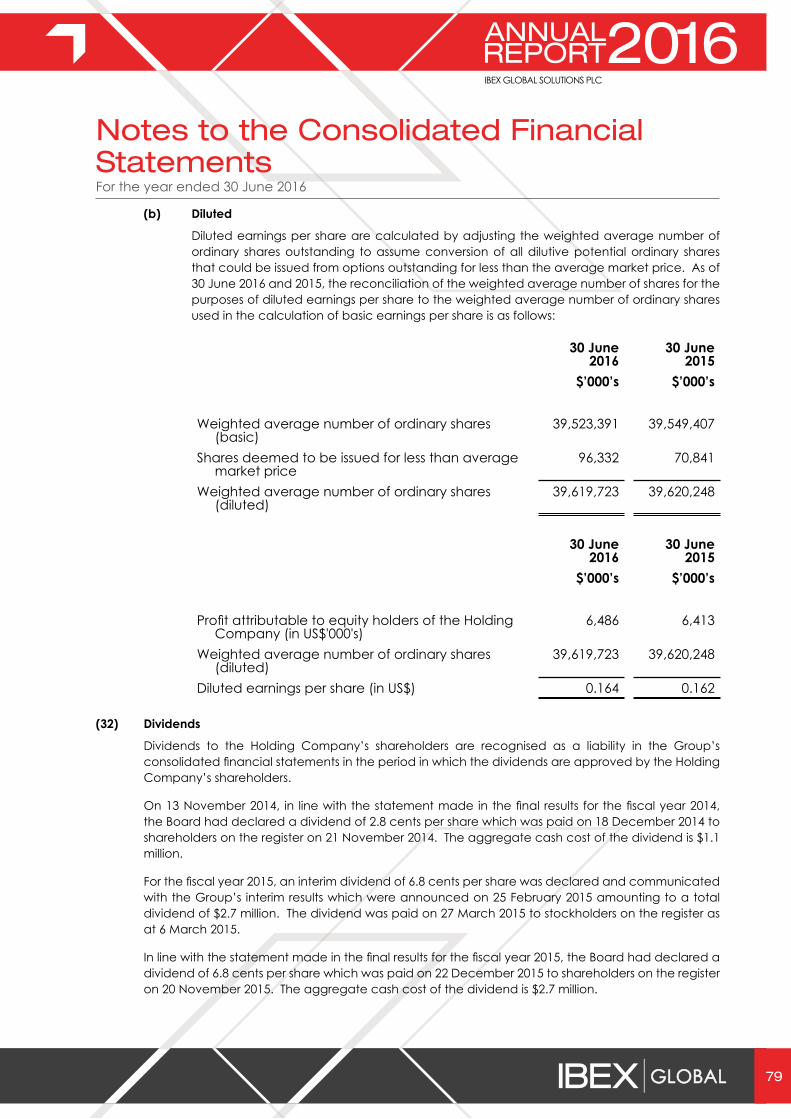
78 79
For the year ended 30 June 2016
(b) Diluted
Diluted earnings per share are calculated by adjusting the weighted average number of ordinary shares outstanding to assume conversion of all dilutive potential ordinary shares that could be issued from options outstanding for less than the average market price. As of 30 June 2016 and 2015, the reconciliation of the weighted average number of shares for the purposes of diluted earnings per share to the weighted average number of ordinary shares used in the calculation of basic earnings per share is as follows:
30 June 2016
30 June 2015
$’000’s $’000’s
Weighted average number of ordinary shares (basic)
39,523,391 39,549,407
Shares deemed to be issued for less than average market price
96,332 70,841
Weighted average number of ordinary shares (diluted)
39,619,723 39,620,248
30 June 2016
30 June 2015
$’000’s $’000’s
Profit attributable to equity holders of the Holding Company (in US$'000's)
6,486 6,413
Weighted average number of ordinary shares (diluted)
39,619,723 39,620,248
Diluted earnings per share (in US$) 0.164 0.162
(32) Dividends
Dividends to the Holding Company’s shareholders are recognised as a liability in the Group’s consolidated financial statements in the period in which the dividends are approved by the Holding Company’s shareholders.
On 13 November 2014, in line with the statement made in the final results for the fiscal year 2014, the Board had declared a dividend of 2.8 cents per share which was paid on 18 December 2014 to shareholders on the register on 21 November 2014. The aggregate cash cost of the dividend is $1.1 million.
For the fiscal year 2015, an interim dividend of 6.8 cents per share was declared and communicated with the Group’s interim results which were announced on 25 February 2015 amounting to a total dividend of $2.7 million. The dividend was paid on 27 March 2015 to stockholders on the register as at 6 March 2015.
In line with the statement made in the final results for the fiscal year 2015, the Board had declared a dividend of 6.8 cents per share which was paid on 22 December 2015 to shareholders on the register on 20 November 2015. The aggregate cash cost of the dividend is $2.7 million.
Notes to the Consolidated Financial Statements
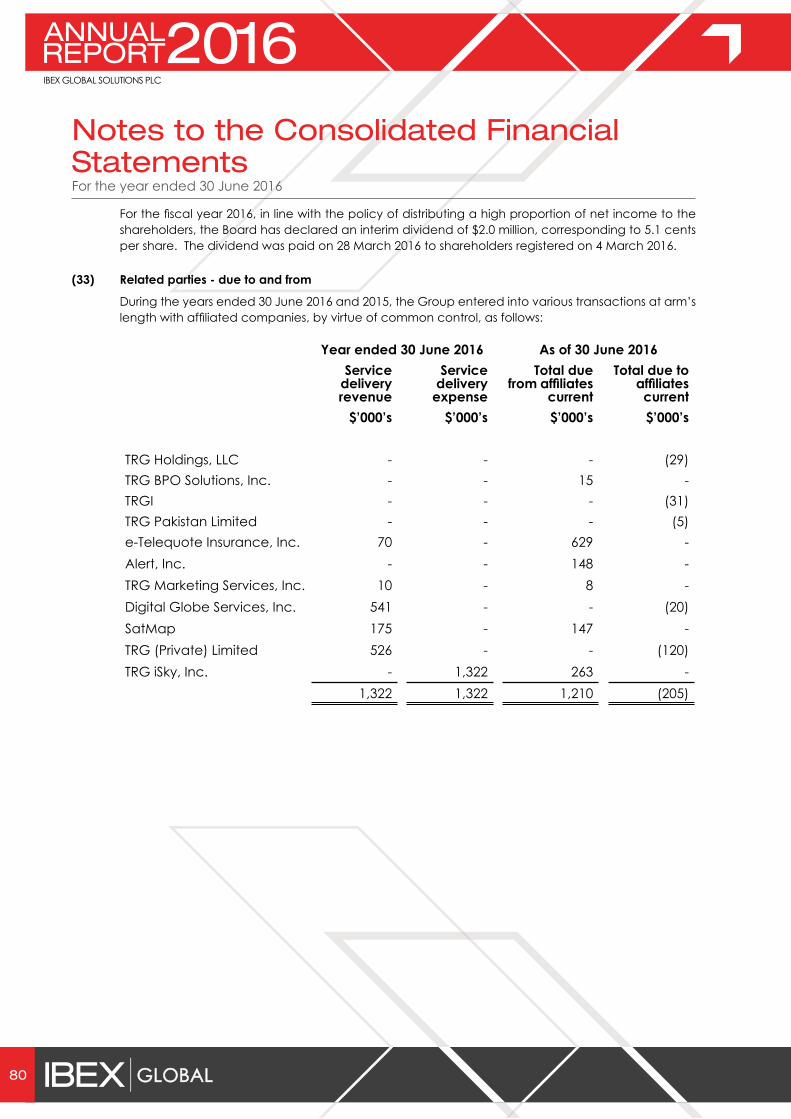
80
For the year ended 30 June 2016
For the fiscal year 2016, in line with the policy of distributing a high proportion of net income to the shareholders, the Board has declared an interim dividend of $2.0 million, corresponding to 5.1 cents per share. The dividend was paid on 28 March 2016 to shareholders registered on 4 March 2016.
(33) Related parties - due to and from
During the years ended 30 June 2016 and 2015, the Group entered into various transactions at arm’s length with affiliated companies, by virtue of common control, as follows:
Year ended 30 June 2016 As of 30 June 2016Service
delivery revenue
Service delivery
expense
Total due from affiliates
current
Total due to affiliates current
$’000’s $’000’s $’000’s $’000’s
TRG Holdings, LLC - - - (29)TRG BPO Solutions, Inc. - - 15 -TRGI - - - (31)TRG Pakistan Limited - - - (5)e-Telequote Insurance, Inc. 70 - 629 -Alert, Inc. - - 148 -TRG Marketing Services, Inc. 10 - 8 -Digital Globe Services, Inc. 541 - - (20)SatMap 175 - 147 -TRG (Private) Limited 526 - - (120)TRG iSky, Inc. - 1,322 263 -
1,322 1,322 1,210 (205)
Notes to the Consolidated Financial Statements

80 81
For the year ended 30 June 2016
Year ended 30 June 2015 As of 30 June 2015Service
delivery revenue
Service delivery
expense
Total due from affiliates
current
Total due to affiliates
current$’000’s $’000’s $’000’s $’000’s
TRG Holdings, LLC - - 42 -TRG BPO Solutions, Inc. - - 958 -TRGI - - 891 -TRG Pakistan Limited - - - (6)e-Telequote Insurance, Inc. 828 - 1,981 -Alert, Inc. 185 - 146 -TRG Marketing Services, Inc. 21 - 5 -Digital Globe Services, Inc. 585 - 40 -SatMap 121 - 104 -TRG (Private) Limited - - - (7)TRG iSky, Inc. 629 328 - (32)
2,369 328 4,167 (45)
As of 30 June 2014, one of the subsidiary of the Holding Company has an outstanding loan of $1.9 million which represents unsecured finance facility provided by TRG (Private) Limited, an associated company, out of total facility limit of $2.4 million to meet working capital needs. It carries mark-up at the average rate of 12.9% per annum which is equivalent to borrowing cost of TRG (Private) Limited. During the fiscal year 2014, an amount of $0.3 million is advanced to that subsidiary of the Holding Company and repayment of $27 thousand was made by that subsidiary of the Holding Company. The principal along with the mark-up is payable on 1 September 2017. On 31 October 2014, the Holding Company entered into loan amendment agreement with TRG (Private) Limited allowing it to make early repayments on its outstanding loan. Pursuant to the amendment, on the same date, the Holding Company made a partial repayment of $1.0 million on its outstanding loan and paid down additional $0.9 million for a total payment of $1.9 million during the fiscal year 2015.
On 11 September 2015, the Group received payment from e-Telequote Insurance, Inc. amounting to $1.0 million.
Notes to the Consolidated Financial Statements
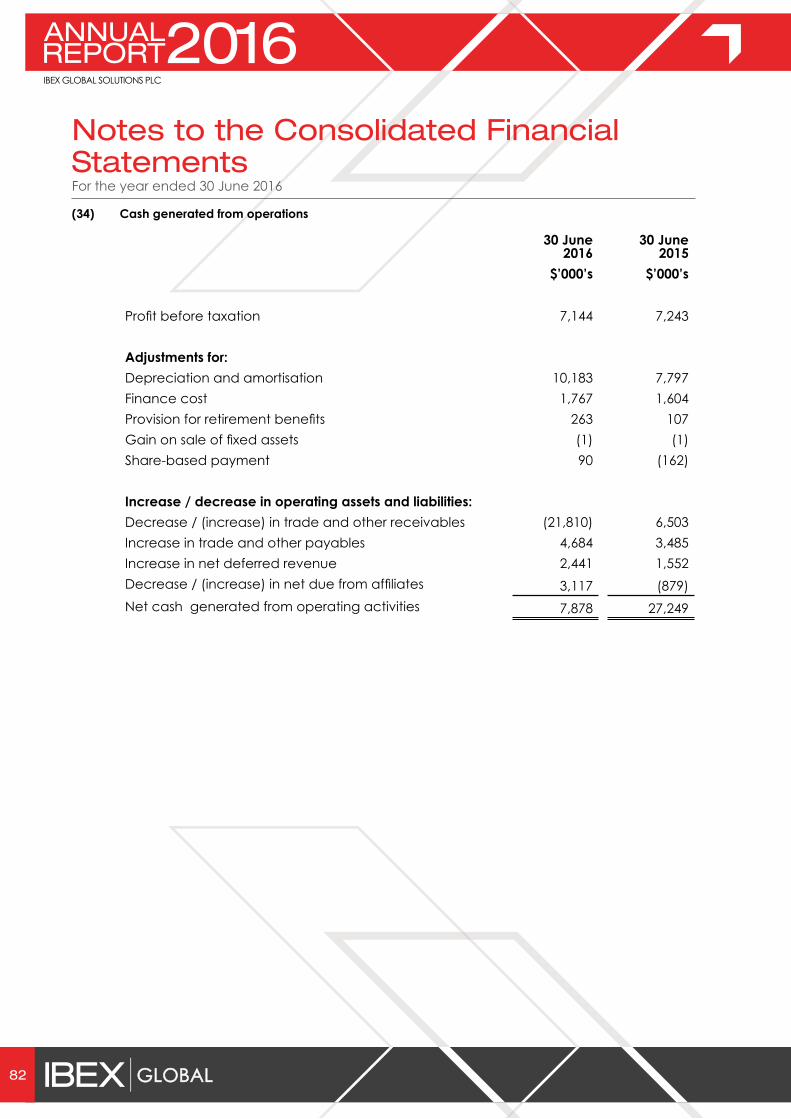
82
For the year ended 30 June 2016
(34) Cash generated from operations
30 June 2016
30 June 2015
$’000’s $’000’s
Profit before taxation 7,144 7,243
Adjustments for:Depreciation and amortisation 10,183 7,797Finance cost 1,767 1,604Provision for retirement benefits 263 107Gain on sale of fixed assets (1) (1)Share-based payment 90 (162)
Increase / decrease in operating assets and liabilities:Decrease / (increase) in trade and other receivables (21,810) 6,503Increase in trade and other payables 4,684 3,485Increase in net deferred revenue 2,441 1,552Decrease / (increase) in net due from affiliates 3,117 (879)Net cash generated from operating activities 7,878 27,249
Notes to the Consolidated Financial Statements
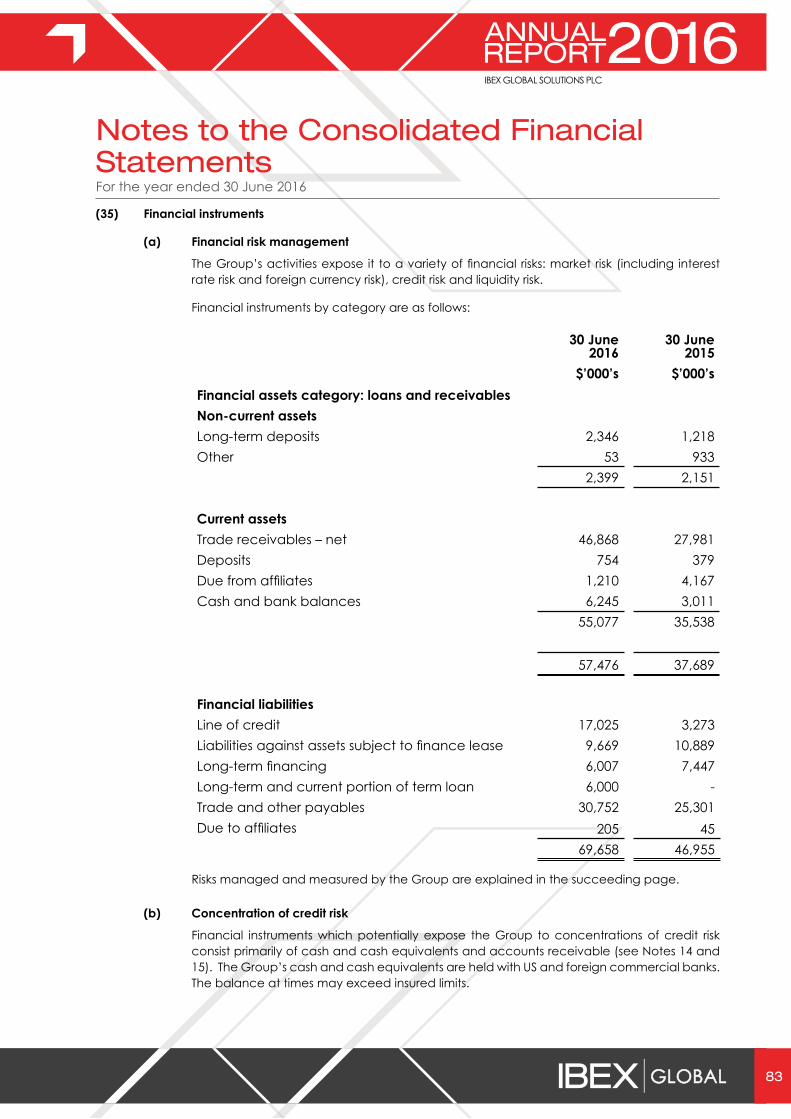
82 83
For the year ended 30 June 2016
(35) Financial instruments
(a) Financial risk management
The Group’s activities expose it to a variety of financial risks: market risk (including interest rate risk and foreign currency risk), credit risk and liquidity risk.
Financial instruments by category are as follows:
30 June 2016
30 June 2015
$’000’s $’000’sFinancial assets category: loans and receivablesNon-current assetsLong-term deposits 2,346 1,218Other 53 933
2,399 2,151
Current assetsTrade receivables – net 46,868 27,981Deposits 754 379Due from affiliates 1,210 4,167Cash and bank balances 6,245 3,011
55,077 35,538
57,476 37,689
Financial liabilitiesLine of credit 17,025 3,273Liabilities against assets subject to finance lease 9,669 10,889Long-term financing 6,007 7,447Long-term and current portion of term loan 6,000 -Trade and other payables 30,752 25,301Due to affiliates 205 45
69,658 46,955
Risks managed and measured by the Group are explained in the succeeding page.
(b) Concentration of credit risk
Financial instruments which potentially expose the Group to concentrations of credit risk consist primarily of cash and cash equivalents and accounts receivable (see Notes 14 and 15). The Group’s cash and cash equivalents are held with US and foreign commercial banks. The balance at times may exceed insured limits.
Notes to the Consolidated Financial Statements

84
For the year ended 30 June 2016
Credit rating breakup of balances:
30 June 2016
30 June 2015
$’000’s $’000’s
AA 1,064 593AA- 1,459 638A-1+ 174 131A-1 - 639A+ 1,180 480A 82 1A- 1,482 64BBB+ - -BBB 723 422BBB- 79 -Non-rated 2 43
6,245 3,011
Credit rating breakup of balances:The maximum exposure to credit risk as at 30 June 2016 and 2015 is tabulated below.
30 June 2016
30 June 2015
$’000’s $’000’sFinancial assets category: loans and receivablesNon-current assetsLong-term deposits 2,346 1,218Other 53 933
2,399 2,151
Current assetsTrade receivables – net 46,868 27,981Deposits 754 379Due from affiliates 1,210 4,167Cash and bank balances 6,245 3,011
55,077 35,538
57,476 37,689
The Group’s exposure to concentration of credit risk with clients representing greater than 5.0% of the consolidated revenue or receivable balances (refer Note 5).
Notes to the Consolidated Financial Statements
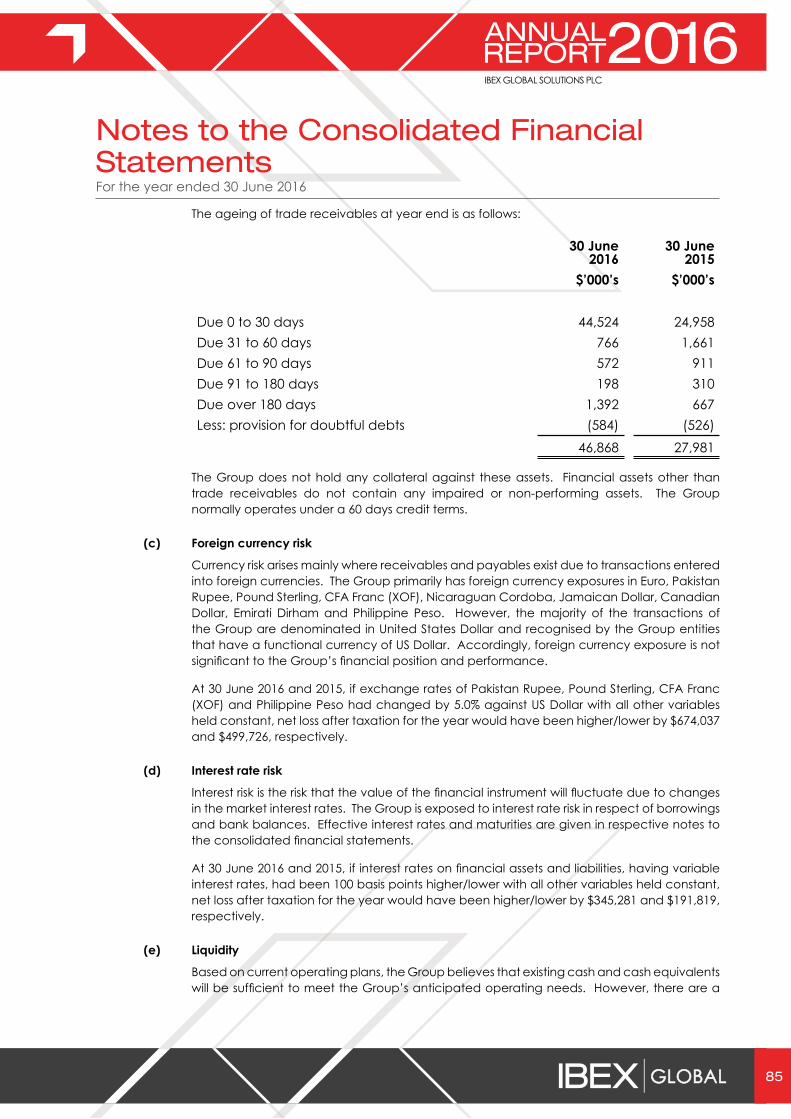
84 85
For the year ended 30 June 2016
The ageing of trade receivables at year end is as follows:
30 June 2016
30 June 2015
$’000’s $’000’s
Due 0 to 30 days 44,524 24,958Due 31 to 60 days 766 1,661Due 61 to 90 days 572 911Due 91 to 180 days 198 310Due over 180 days 1,392 667Less: provision for doubtful debts (584) (526)
46,868 27,981
The Group does not hold any collateral against these assets. Financial assets other than trade receivables do not contain any impaired or non-performing assets. The Group normally operates under a 60 days credit terms.
(c) Foreign currency risk
Currency risk arises mainly where receivables and payables exist due to transactions entered into foreign currencies. The Group primarily has foreign currency exposures in Euro, Pakistan Rupee, Pound Sterling, CFA Franc (XOF), Nicaraguan Cordoba, Jamaican Dollar, Canadian Dollar, Emirati Dirham and Philippine Peso. However, the majority of the transactions of the Group are denominated in United States Dollar and recognised by the Group entities that have a functional currency of US Dollar. Accordingly, foreign currency exposure is not significant to the Group’s financial position and performance.
At 30 June 2016 and 2015, if exchange rates of Pakistan Rupee, Pound Sterling, CFA Franc (XOF) and Philippine Peso had changed by 5.0% against US Dollar with all other variables held constant, net loss after taxation for the year would have been higher/lower by $674,037 and $499,726, respectively.
(d) Interest rate risk
Interest risk is the risk that the value of the financial instrument will fluctuate due to changes in the market interest rates. The Group is exposed to interest rate risk in respect of borrowings and bank balances. Effective interest rates and maturities are given in respective notes to the consolidated financial statements.
At 30 June 2016 and 2015, if interest rates on financial assets and liabilities, having variable interest rates, had been 100 basis points higher/lower with all other variables held constant, net loss after taxation for the year would have been higher/lower by $345,281 and $191,819, respectively.
(e) Liquidity
Based on current operating plans, the Group believes that existing cash and cash equivalents will be sufficient to meet the Group’s anticipated operating needs. However, there are a
Notes to the Consolidated Financial Statements

86
For the year ended 30 June 2016
number of assumptions built into the Group’s current operating plans. If these assumptions do not materialise, the Group may need to seek additional financing from the new RLOC with PNC or management may need to implement a reduced spending plan.
Financial liabilities in accordance with their contractual maturities are presented below.
30 June 2016Carrying
ValueTotal
contractual cash flows
Less thanone
year
Between one
to two years
Between two
to five years
$’000’s $’000’s $’000’s $’000’s $’000’s
Line of credit 17,025 17,025 17,025 - -Liabilities against
assets subject to finance lease 9,669 10,768 4,230 3,856 2,682
Long-term financing 6,007 6,344 4,155 1,667 522Term loan 6,000 6,463 2,254 2,155 2,054Trade and other
payables 30,752 30,752 30,752 - -Due to affiliates 205 205 205 - -
69,658 71,557 58,621 7,678 5,258
30 June 2015Carrying
ValueTotal
contractual cash flows
Less thanone
year
Between one
to two years
Between two
to five years
$’000’s $’000’s $’000’s $’000’s $’000’s
Line of credit 3,273 3,273 3,273 - -Liabilities against
assets subject to finance lease 10,889 12,437 4,359 3,753 4,325
Long-term financing 7,447 8,030 3,626 3,397 1,007Trade and other
payables 25,301 25,301 25,301 - -Due to affiliates 45 45 45 - -
46,955 49,086 36,604 7,150 5,332
(f) Fair value of financial instruments
Fair value is the amount for which an asset could be exchanged, or a liability settled, between knowledgeable willing parties in an arm’s length transaction. Consequently, differences can arise between the carrying value and fair value estimates.
Notes to the Consolidated Financial Statements

86 87
For the year ended 30 June 2016
The estimated fair value of financial assets and liabilities is considered not significantly different from carrying values as the items are either short-term in nature or periodically re-priced.
(36) Capital risk management
The Board’s objective is to maintain a capital structure that supports the Group’s strategic objectives and shareholders’ value. The Group’s capital consists of cash and cash equivalents, debt balances (working capital line of credit, long-term and short-term lease liabilities, and term loan) and equity attributable to equity holders.
The following table summarises the Capital of the Group:
30 June 2016
30 June 2015
$’000’s $’000’s
Borrowings 38,701 21,609Cash and cash equivalents (6,245) (3,011)Net Debt (Note 37) 32,456 18,598Equity 27,576 25,524Total Capital of the Group 60,032 44,122
The Group leverages the Working Capital Revolving Line of Credit to fund its working capital cycle as necessary. These borrowings, together with cash generated through operations, may be loaned internally or contributed as equity to certain subsidiaries.
Notes to the Consolidated Financial Statements
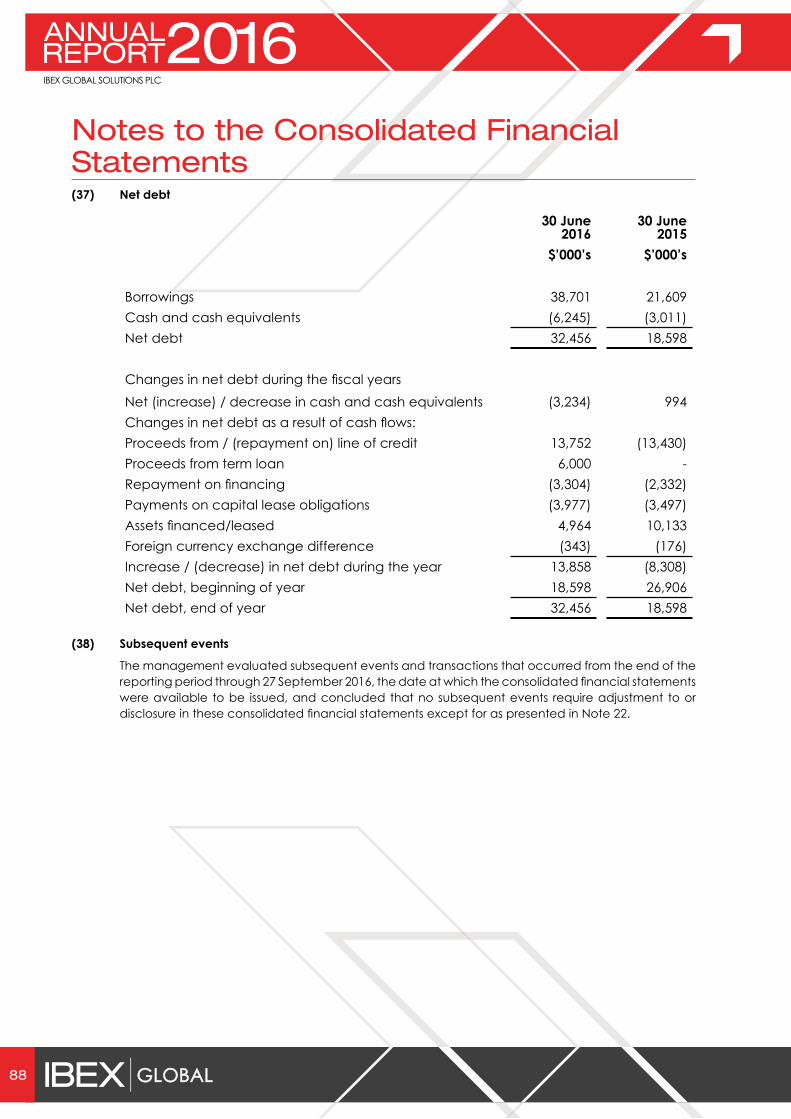
88
(37) Net debt
30 June 2016
30 June 2015
$’000’s $’000’s
Borrowings 38,701 21,609Cash and cash equivalents (6,245) (3,011)Net debt 32,456 18,598
Changes in net debt during the fiscal yearsNet (increase) / decrease in cash and cash equivalents (3,234) 994Changes in net debt as a result of cash flows:Proceeds from / (repayment on) line of credit 13,752 (13,430)Proceeds from term loan 6,000 -Repayment on financing (3,304) (2,332)Payments on capital lease obligations (3,977) (3,497)Assets financed/leased 4,964 10,133Foreign currency exchange difference (343) (176)Increase / (decrease) in net debt during the year 13,858 (8,308)Net debt, beginning of year 18,598 26,906Net debt, end of year 32,456 18,598
(38) Subsequent events
The management evaluated subsequent events and transactions that occurred from the end of the reporting period through 27 September 2016, the date at which the consolidated financial statements were available to be issued, and concluded that no subsequent events require adjustment to or disclosure in these consolidated financial statements except for as presented in Note 22.
Notes to the Consolidated Financial Statements

88 89
We have audited the financial statements of IBEX Global Solutions Plc for the year ended 30 June 2016 which comprise the statement of financial position, the statement of changes in equity, the statement of cash flows and the related notes. The financial reporting framework that has been applied in their preparation is applicable law and International Financial Reporting Standards (IFRSs) as adopted by the European Union and as applied in accordance with the provisions of the Companies Act 2006.
This report is made solely to the Company’s members, as a body, in accordance with Chapter 3 of Part 16 of the Companies Act 2006. Our audit work has been undertaken so that we might state to the Company’s members those matters we are required to state to them in an auditor’s report and for no other purpose. To the fullest extent permitted by law, we do not accept or assume responsibility to anyone other than the Company and the Company’s members as a body, for our audit work, for this report, or for the opinions we have formed.
Respective responsibilities of directors and auditor
As explained more fully in the Directors’ Responsibilities Statement set out on page 26 the Directors are responsible for the preparation of the financial statements and for being satisfied that they give a true and fair view. Our responsibility is to audit and express an opinion on the financial statements in accordance with applicable law and International Standards on Auditing (UK and Ireland). Those standards require us to comply with the Auditing Practices Board’s Ethical Standards for Auditors.
Scope of the audit of the financial statements
A description of the scope of an audit of financial statements is provided on the Financial Reporting Council’s website at www.frc.org.uk/auditscopeukprivate.
Opinion on financial statements
In our opinion the financial statements:
• give a true and fair view of the state of the Company’s affairs as at 30 June 2016;
• have been properly prepared in accordance with IFRSs as adopted by the European Union and as applied in accordance with the provisions of the Companies Act 2006; and
• have been prepared in accordance with the requirements of the Companies Act 2006.
Opinion on other matter prescribed by the Companies Act 2006
In our opinion the information given in the Strategic Report and Directors’ Report for the financial year for which the financial statements are prepared is consistent with the financial statements.
Independent Auditors’ Report on Parent Company Financial Statements

90
For the year ended 30 June 2016
Matters on which we are required to report by exception
We have nothing to report in respect of the following matters where the Companies Act 2006 requires us to report to you if, in our opinion:
• adequate accounting records have not been kept by the parent company, or returns adequate for our audit have not been received from branches not visited by us; or
• the parent company financial statements are not in agreement with the accounting records and returns; or
• certain disclosures of Directors’ remuneration specified by law are not made; or
• we have not received all the information and explanations we require for our audit.
Other matter
We have reported separately on the Group financial statements of IBEX Global Solutions Plc for the year ended 30 June 2016.
Marc SummersSenior Statutory Auditorfor and on behalf of Grant Thornton UK LLPStatutory Auditor, Chartered AccountantsLondonDate: 27 September 2016
Independent Auditors’ Report on Parent Company Financial Statements

90 91
For the year ended 30 June 2016
Parent Company Statement of Financial Position
2016 2015
Assets Notes $’000’s $’000’s
Non-current assets
Due from related parties – non-current 10 1,943 1,943
Investments in subsidiaries 4 57,169 57,126
Total non-current assets 59,112 59,069
Current assets
Prepayments and others 9 178 99
Due from related parties - current 10 14,173 7,634
Cash and cash equivalents 5 1,180 480
Total current assets 15,531 8,213
Total assets 74,643 67,282
Equity and liabilities
Equity attributable to owners of the parent
Share capital 6 602 602
Share premium 14,479 14,479
Capital redemption reserve 7 48,530 48,530
Treasury shares (58) (19)
Foreign currency translation reserve 228 228
Retained earnings 10,268 3,297
Total equity 74,049 67,117
Current liabilities
Trade and other payables 11 594 165
Total equity and liabilities 74,643 67,282
The accompanying notes are an integral part of these financial statements.
These financial statements were approved for issue by the Board of Directors on 27 September 2016 and were signed on its behalf by
Robert Dechant Karl GabelChief Executive Officer Chief Financial OfficerRegistered Number: 08462510

92
For the year ended 30 June 2016Parent Company Statement of Changes in Equity
Share capital
Share premium
Capital redemption
reserve
Treasury shares
Foreign currency
translation reserve
Retained earnings
Total equity
$’000’s $’000’s $’000’s $’000’s $’000’s $’000’s $’000’sAs at 1 July 2014 602 14,479 48,530 - 228 49 63,888
Net profit - - - - - 7,000 7,000Total comprehensive income for the year - - - - - 7,000 7,000
Transactions with ownersDividend distribution - - - - - (3,752) (3,752) Purchase of treasury shares - - - (19) - - (19)
- - - (19) - (3,752) (3,771)
As at 30 June 2015 602 14,479 48,530 (19) 228 3,297 67,117
Net profit - - - - - 11,678 11,678Total comprehensive income for the year - - - - - 11,678 11,678
Transactions with ownersDividend distribution - - - - - (4,707) (4,707)Purchase of treasury shares - - - (39) - - (39)
- - - (39) - (4,707) (4,746)
As at 30 June 2016 602 14,479 48,530 (58) 228 10,268 74,049
The accompanying notes are an integral part of these financial statements.v

92
93
For the year ended 30 June 2016
Parent Company Statement of Cash Flows
30 June 2016
30 June 2015
Note $’000’s $’000’sCash flows from operating activities
Net cash from operating activities 12 5,450 5,605
Interest paid - (588)
Net cash from operating activities 5,450 5,017
Cash flows from investing activitiesAdditional investment in subsidiaries (4) -
Net cash used in financing activities (4) -
Cash flows from financing activitiesPayment of dividend (4,707) (3,752)Purchase of treasury shares (39) (19)Payment of loan to affiliate - (1,355)
Net cash used in financing activities (4,746) (5,126)
Net increase / (decrease) in cash and cash equivalents 700 (109)
Cash and cash equivalents, beginning of year 480 589
Cash and cash equivalents, end of year 1,180 480
The accompanying notes are an integral part of these financial statements.

94
For the year ended 30 June 2016
(1) Summary of significant accounting policies
(a) Basis of preparation
The separate financial statements of IBEX Global Solutions Plc (the Company or the Parent Company) are presented in accordance with applicable law and International Financial Reporting Standards (IFRS) as adopted by the European Union and as applied in accordance with the provisions of the Companies Act 2006.
The principal accounting policies used in the preparation of the separate financial statements of the Parent Company are summarised below. They have all been applied consistently throughout the period.
(b) Investments in subsidiaries
Investments in subsidiaries are carried at cost and tested for impairment on an annual basis.
(c) Financial instruments
Financial assets and financial liabilities are recognised at the time when the Company becomes a party to the contractual provisions of the instrument.
Financial assets
The Company considers its financial assets to comprise cash, deposits and various other receivable balances that arise from its operations.
Trade receivables, deposits and other receivables that have fixed or determinable payments that are not quoted in an active market are classified as loans and receivables. Loans and receivables are initially recorded at fair value and subsequently at amortised cost using the effective interest rate method, less any impairment. Interest income is recognised by applying the effective interest rate, except for short-term receivables when the recognition of interest would be immaterial.
The carrying amount of the financial asset is reduced by any impairment loss directly for all financial assets with the exception of trade receivables where the carrying amount is reduced through the use of an allowance account. When a trade receivable is considered uncollectable, it is written off against the allowance account. Subsequent recoveries of amounts previously written off are credited against the allowance account. Changes in the carrying amount of the allowance account are recognised in the profit or loss. If in a subsequent period the amount of the impairment loss decreases and the decrease can be related objectively to an event occurring after the impairment was recognised, the previously recognised impairment loss is reversed through the profit or loss to the extent that the carrying amount of the financial asset at the date the impairment is reversed does not exceed what the amortised cost would have been had the impairment not been recognised.
The Company derecognises a financial asset or a portion of financial asset when, and only when, the contractual rights to the cash flows from the assets expire; or it transfers the financial asset and substantially all of the risks and rewards of ownership of the asset to another entity. If the Company neither transfers nor retains substantially all of the risks and rewards of ownership and continues to control the asset, the Company recognises its
Notes to the Parent Company Financial Statements
94 95
For the year ended 30 June 2016
retained interest in the asset and associated liability for amounts it may have to pay. If the Company retains substantially all the risks and rewards of ownership of a transferred financial asset, the Company continues to recognise the financial asset and also recognises a collateral borrowing for the proceeds received.
Financial liabilities
Financial liabilities are initially measured at fair value and are classified according to the substance of the contractual arrangement entered into. Financial liabilities are subsequently measured at amortised cost. The Company’s financial liabilities comprise trade payables, borrowings and other payables balances that arise from its operations. They are classified as “financial liabilities measured at amortised cost.” Finance charges are accounted for on an accrual basis in the profit or loss using the effective interest rate method and are added to the carrying amount of the investment to the extent that is not settled in the period in which they arise. The Company derecognises financial liabilities when the Company’s obligations are discharged, cancelled or they expire.
(d) Impairment of non-financial assets
The carrying amounts of the Company’s assets are reviewed at the end of each reporting period to determine whether there is any indication of impairment loss. If any such indication exists, the asset’s recoverable amount is estimated in order to determine the extent of the impairment loss, if any. An impairment loss is recognised for the amount by which the asset’s carrying amount exceeds its recoverable amount. The recoverable amount is the higher of an asset’s fair value less cost to sell and value in use. Impairment losses are charged to the profit or loss in selling, general and administrative expenses. During the periods ended 30 June 2016 and 2015 no impairment was recorded.
(e) Affiliated companies
Affiliated companies represent the companies under the common control of the Ultimate Parent Company, TRGI.
(f) Cash and cash equivalents
Cash and cash equivalents consist of cash and cheques on hand and bank deposits available on demand.
(g) Share capital, share premium and treasury shares
Share capital represents the nominal (par) value of shares that have been issued and classified as equity.
Share premium includes any premiums received on issue of share capital. Any transaction costs associated with the issuing of shares are deducted from the share premium, net of any related income tax benefits.
Treasury shares represent the amount of the consideration paid when shares are repurchased which includes directly attributable costs, net of tax effects, and are recognised as a deduction from equity. When treasury shares are sold or reissued subsequently, the amount received is recognised as an increase in equity and the resulting surplus or deficit on the transaction is presented within share premium.
Notes to the Parent Company Financial Statements

96
For the year ended 30 June 2016
(h) Taxation
Current taxation
The charge for current taxation is based on taxable income at the current rates of taxation after taking into account applicable tax credits, rebates and exemptions available, if any.
Management periodically evaluates positions taken in tax returns with respect to situations in which applicable tax regulation is subject to interpretation. It establishes provisions where appropriate on the basis of amounts expected to be paid to the tax authorities.
Deferred taxation
Deferred tax is provided on all temporary differences at the end of each reporting period, between the tax base of the assets and liabilities and their carrying amounts for financial reporting purposes.
Deferred tax liabilities are recognised for all taxable temporary differences. Deferred tax assets are recognised for all deductible temporary differences and unused tax losses to the extent that it is probable that the deductible temporary differences will reverse in the future and sufficient taxable profits will be available against which the deductible temporary differences and unused tax losses can be utilised. However, deferred tax is not accounted for if it arises from initial recognition of an asset or liability in a transaction other than a business combination that at the time of the transaction affects neither accounting nor taxable profit or loss.
The carrying amount of all deferred tax assets is reviewed at the end of each reporting period and reduced to the extent that it is no longer probable that sufficient taxable profits will be available to allow all or part of the deferred tax assets to be utilised.
Deferred tax assets and liabilities are measured at the tax rates that are expected to apply to the period when the asset is realised or the liability is settled, based on the tax rates (and tax laws) that have been enacted or substantively enacted at the end of the reporting period.
(i) Foreign Currency Transactions
The accounting records of the Company are maintained in U.S. Dollars. Foreign currency transactions during the period are translated into the functional currency at exchange rates which approximate those prevailing on transaction dates.
Foreign currency gains and losses resulting from the settlement of such transactions and from the translation at exchange rates at the end of the reporting period of monetary assets and liabilities denominated in foreign currencies are recognised in the profit or loss.
(2) Profit for the years ended 30 June 2016 and 2015
As permitted by Section 408 of the Companies Act 2006, the profit or loss account for the Company is not presented as part of these financial statements. The Company reported total comprehensive income of $11.7 million and $7.0 million for the years ended 30 June 2016 and 2015, respectively.
The auditors’ remuneration for the audit of the Company is $4,550 and $4,787 for the years ended 30 June 2016 and 2015, respectively.
Notes to the Parent Company Financial Statements
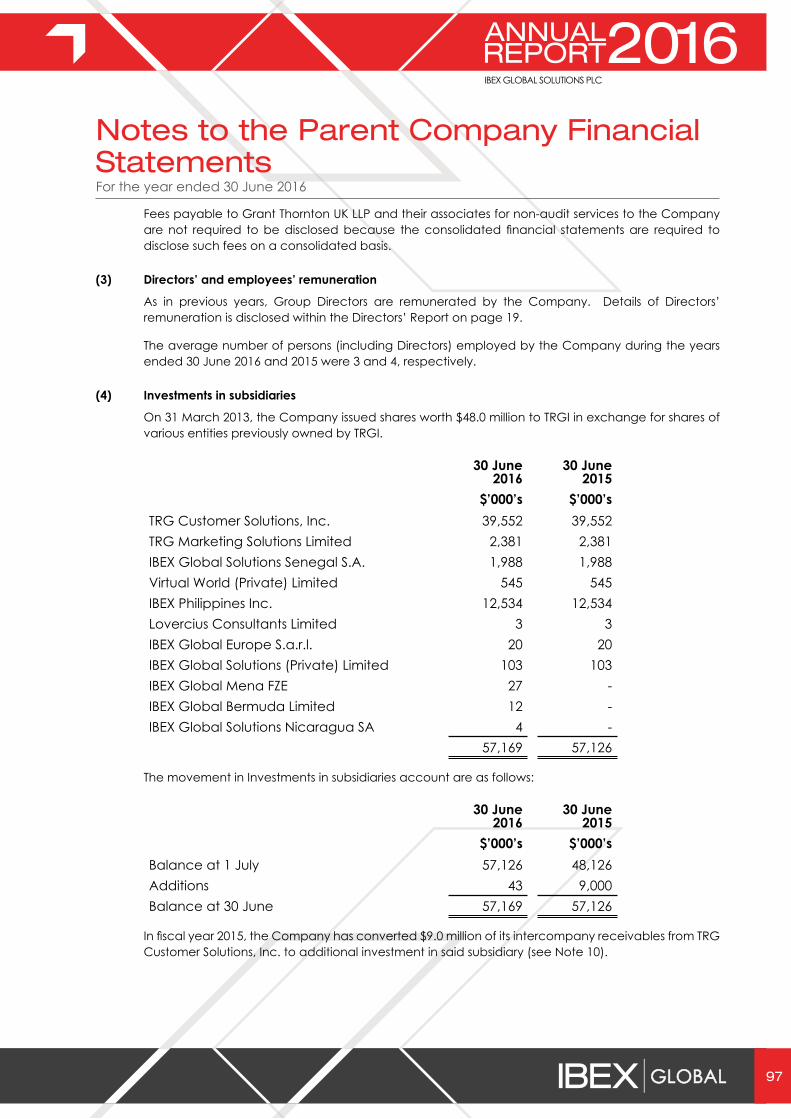
96 97
For the year ended 30 June 2016
Fees payable to Grant Thornton UK LLP and their associates for non-audit services to the Company are not required to be disclosed because the consolidated financial statements are required to disclose such fees on a consolidated basis.
(3) Directors’ and employees’ remuneration
As in previous years, Group Directors are remunerated by the Company. Details of Directors’ remuneration is disclosed within the Directors’ Report on page 19.
The average number of persons (including Directors) employed by the Company during the years ended 30 June 2016 and 2015 were 3 and 4, respectively.
(4) Investments in subsidiaries
On 31 March 2013, the Company issued shares worth $48.0 million to TRGI in exchange for shares of various entities previously owned by TRGI.
30 June 2016
30 June 2015
$’000’s $’000’sTRG Customer Solutions, Inc. 39,552 39,552TRG Marketing Solutions Limited 2,381 2,381IBEX Global Solutions Senegal S.A. 1,988 1,988Virtual World (Private) Limited 545 545IBEX Philippines Inc. 12,534 12,534Lovercius Consultants Limited 3 3IBEX Global Europe S.a.r.l. 20 20IBEX Global Solutions (Private) Limited 103 103IBEX Global Mena FZE 27 -IBEX Global Bermuda Limited 12 -IBEX Global Solutions Nicaragua SA 4 -
57,169 57,126
The movement in Investments in subsidiaries account are as follows:
30 June 2016
30 June 2015
$’000’s $’000’sBalance at 1 July 57,126 48,126Additions 43 9,000Balance at 30 June 57,169 57,126
In fiscal year 2015, the Company has converted $9.0 million of its intercompany receivables from TRG Customer Solutions, Inc. to additional investment in said subsidiary (see Note 10).
Notes to the Parent Company Financial Statements

98
For the year ended 30 June 2016
The following is the information on the Company’s subsidiaries:
Subsidiaries Country of incorporation
Percentage of holding
in ordinary shares
%Lovercius Consultants Limited (IBEX
Cyprus)Cyprus 100%
IBEX Global Europe S.a.r.l. (IBEX Luxembourg)
Luxembourg 100%
TRG Customer Solutions, Inc. (trading as IBEX Global Solutions, Inc.)
USA 100%
TRG Customer Solutions (Canada) Inc. Canada 100%TRG Marketing Solutions Limited UK 100%Virtual World (Private) Limited Pakistan 100%IBEX Philippines Inc. Philippines 100%IBEX Global Solutions (Philippines) Inc. Philippines 100%TRGCS Philippines Inc. Philippines 100%IBEX Global Solutions Senegal S.A. (IBEX
Senegal)Senegal 100%
IBEX Global Solutions (Private) Limited Pakistan 100%IBEX Global Mena FZE Dubai 100%IBEX I.P. Holdings Ireland Limited (IBEX
Ireland)Ireland 100%
IBEX Global Bermuda Limited Bermuda 100%IBEX Global Solutions Nicaragua SA
(IBEX Nicaragua)Nicaragua 100%
IBEX Global St. Lucia Limited St. Lucia 100%IBEX Global Jamaica Limited (IBEX
Jamaica)Jamaica 100%
(5) Cash and cash equivalents
30 June 2016
30 June 2015
$’000’s $’000’sBalances with banks in current accounts 1,180 480
1,180 480
Notes to the Parent Company Financial Statements

98 99
For the year ended 30 June 2016
(6) Share capital
30 June 2016
30 June 2015
$’000’s $’000’sAuthorised39,554,400 ordinary shares of $0.0152 602 602
Allotted. called up and fully paid39,554,400 ordinary shares of $0.0152 602 602
The Company’s share capital consists of 32,250,055 ordinary shares of one pence each, with a nominal share capital of £322,500. The Company issued additional shares with a nominal value of £73,043 at the time of admission to the London Stock Exchange’s Alternative Investment Market (AIM).
All shares are equally eligible to receive dividends and the repayment of capital, and represent one vote each at the Annual General Meeting.
Purchase of treasury shares
In accordance with the terms of the general authority to make market purchases of Holding Company’s own shares granted to it by shareholders of the Company on 20 November 2015, and the announcement made by the Holding Company on 24 August 2015 to extend the period for making purchases of its own shares until such time as the Board shall choose to terminate for a total up to $1.0 million, the Holding Company acquired for cash in the market a total of 39,082 ordinary shares as of 30 June 2016. The acquired shares were held in treasury.
Notes to the Parent Company Financial Statements

100
For the year ended 30 June 2016
Below are the details of treasury shares as of the year ended 30 June 2016.
Acquisition date No. of Shares Price per share (in US$)
Total price (in US$)
19 March 2015 13,888 1.08 14,93028 May 2015 749 1.24 92829 May 2015 700 1.31 9173 June 2015 725 1.56 1,1319 June 2015 745 1.80 1,34230 June 2015 725 1.98 1,4363 July 2015 725 2.00 1,44824 July 2015 725 1.96 1,4245 November 2015 725 2.00 1,45210 November 2015 740 1.96 1,45112 November 2015 735 1.97 1,44919 November 2015 730 1.91 1,39624 November 2015 700 1.91 1,3371 December 2015 745 1.92 1,4308 December 2015 725 1.66 1,20311 December 2015 1,000 1.67 1,66914 December 2015 2,000 1.67 3,35015 December 2015 2,000 1.67 3,33716 December 2015 2,000 1.68 3,36517 December 2015 2,000 1.68 3,36718 December 2015 2,000 1.64 3,28621 December 2015 2,000 1.56 3,12722 December 2015 2,000 1.67 3,338Total 39,082 58,113
The following is the movement of number of ordinary share in issue during fiscal years 2016 and 2015:
30 June 2016
30 June 2015
$’000’s $’000’sOrdinary shares in issue as of 1 July 39,537,593 39,554,400Purchase of shares held in treasury (22,275) (16,807)Ordinary shares in issue as of 30 June 39,515,318 39,537,593
Notes to the Parent Company Financial Statements

100 101
For the year ended 30 June 2016
The following are the major shareholders (holds 10% or more of Company’s shares):
30 June 2016
30 June 2015
% %TRGI 71.05 71.09Miton Asset Management 16.90 12.00
(7) Capital redemption reserve
30 June 2016
30 June 2015
$’000’s $’000’sBalance as of 30 June 48,530 48,530
(8) Dividends
Dividend distributions to the Company’s shareholders are recognised as a liability in the Company’s financial statements in the period in which the dividends are approved by the Company’s shareholders.
On 13 November 2014, in line with the statement made in the final results for the fiscal year 2014, the Board had declared a dividend of 2.8 cents per share which was paid on 18 December 2014 to shareholders on the register on 21 November 2014. The aggregate cash cost of the dividend is $1.1 million.
For the fiscal year 2015, an interim dividend of 6.8 cents per share was declared and communicated with the Group’s interim results which were announced on 25 February 2015 amounting to a total dividend of $2.7 million. The dividend was paid on 27 March 2015 to stockholders on the register as at 6 March 2015.
In line with the statement made in the final results for the fiscal year 2015, the Board had declared a dividend of 6.8 cents per share which was paid on 22 December 2015 to shareholders on the register on 20 November 2015. The aggregate cash cost of the dividend is $2.7 million.
For the fiscal year 2016, in line with the policy of distributing a high proportion of net income to the shareholders, the Board has declared an interim dividend of $2.0 million, corresponding to 5.1 cents per share. The dividend was paid on 28 March 2016 to shareholders registered on 4 March 2016.
(9) Prepayments and others
30 June 2016
30 June 2015
$’000’s $’000’sPrepayments and others 178 99
178 99
Notes to the Parent Company Financial Statements

102
For the year ended 30 June 2016
(10) Related parties - due to and from
During the years ended 30 June 2016 and 2015, the Company entered into various transactions at arm’s length with related companies, by virtue of common control, as follows:
30 June 2016 As of 30 June 2016Service
delivery revenue
Service delivery expense
Total due from affiliates
non-current
Total due from affiliates current
Total due to
affiliates current
Net due from (to) affiliates current
$’000’s $’000’s $’000’s $’000’s $’000’s $’000’s
TRG Customer Solutions, Inc. - - - 2,480 - 2,480
TRG Marketing Solutions Limited - - - - (131) (131)
IBEX Global Solutions Senegal S.A. - - - 149 - 149
IBEX Philippines, Inc. - - - 1,021 - 1,021IBEX Global Solutions
Philippines, Inc. - - - 2,877 - 2,877Virtual World
(Private) Limited - - 1,943 152 - 152IBEX Global Mena
FZE - - - 611 - 611IBEX Ireland - - - 52 - 52IBEX Global
Bermuda Limited - - - 322 - 322IBEX Luxembourg - - - 2,309 - 2,309IBEX Nicaragua - - - 1,711 (4) 1,707IBEX Jamaica - - - 1,636 - 1,636IBEX Global Solutions
Private Limited - - - 1,036 - 1,036Transactions with
IBEX affiliates - - 1,943 14,356 (135) 14,221
TRGI - - - - (3) (3)Digital Globe
Services, Inc. - - - - (45) (45)Transactions with
non-IBEX affiliates - - - - (48) (48)- - 1,943 14,356 (183) 14,173
Notes to the Parent Company Financial Statements

102 103
For the year ended 30 June 2016
30 June 2016 As of 30 June 2016Service
delivery revenue
Service delivery expense
Total due from affiliates
non-current
Total due from affiliates current
Total due to
affiliates current
Net due from (to) affiliates current
$’000’s $’000’s $’000’s $’000’s $’000’s $’000’s
TRG Customer Solutions, Inc. - - - 2,581 - 2,581
TRG Marketing Solutions Limited - - - 44 - 44
IBEX Global Solutions Senegal S.A. - - - 121 - 121
IBEX Philippines, Inc. - - - 876 - 876IBEX Global Solutions
Philippines, Inc. - - - 15 - 15Virtual World
(Private) Limited - - 1,943 62 - 62IBEX Global Mena
FZE - - - 350 - 350IBEX Ireland - - - 28 - 28IBEX Global
Bermuda Limited - - - 512 - 512IBEX Luxembourg - - - 2,596 - 2,596IBEX Global Solutions
Private Limited - - - 453 - 453Transactions with
IBEX affiliates - - 1,943 7,638 - 7,638
TRGI - - - - (3) (3)Digital Globe
Services, Inc. - - - - (1) (1)Transactions with
non-IBEX affiliates - - - - (4) (4)- - 1,943 7,638 (4) 7,634
In fiscal year 2015, the Company has converted $9.0 million of its intercompany receivables from TRG Customer Solutions, Inc. to additional investment in said subsidiary.
Notes to the Parent Company Financial Statements

104
For the year ended 30 June 2016
(11) Trade and other payables
30 June 2016
30 June 2015
$’000’s $’000’s
Accounts payable 166 121Accrued expenses and payables 49 44Accrued salaries and wages 379 -
594 165
(12) Cash used in operations
30 June 2016
30 June 2015
$’000’s $’000’s
Profit before taxation 11,678 6,995Changes in operating assets and liabilities:Increase in trade and other receivables (79) (6)Increase / (decrease) in trade and other payables 429 (30)Increase in net due from affiliates (6,578) (1,354)Net cash from operating activities 5,450 5,605
(13) Capital commitments
There were no capital commitments at 30 June 2016 or 30 June 2015.
Notes to the Parent Company Financial Statements
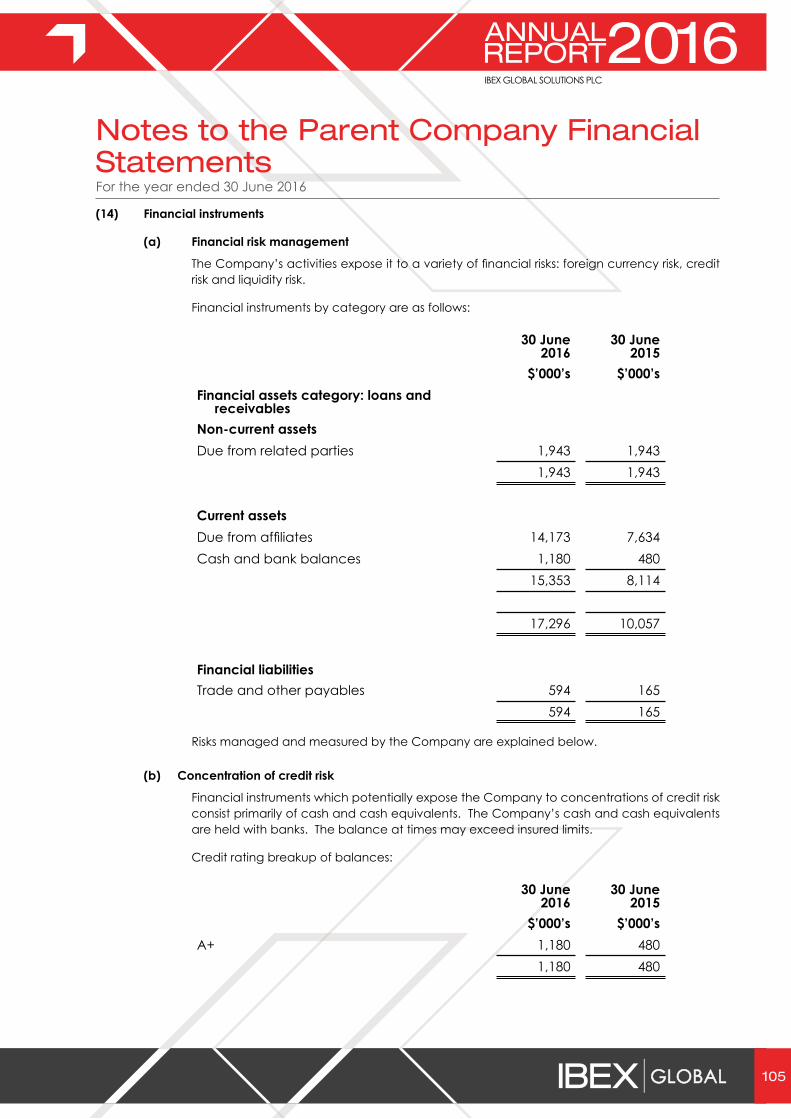
104 105
For the year ended 30 June 2016
(14) Financial instruments
(a) Financial risk management
The Company’s activities expose it to a variety of financial risks: foreign currency risk, credit risk and liquidity risk.
Financial instruments by category are as follows:
30 June 2016
30 June 2015
$’000’s $’000’sFinancial assets category: loans and
receivablesNon-current assetsDue from related parties 1,943 1,943
1,943 1,943
Current assetsDue from affiliates 14,173 7,634Cash and bank balances 1,180 480
15,353 8,114
17,296 10,057
Financial liabilitiesTrade and other payables 594 165
594 165
Risks managed and measured by the Company are explained below.
(b) Concentration of credit risk
Financial instruments which potentially expose the Company to concentrations of credit risk consist primarily of cash and cash equivalents. The Company’s cash and cash equivalents are held with banks. The balance at times may exceed insured limits.
Credit rating breakup of balances:
30 June 2016
30 June 2015
$’000’s $’000’sA+ 1,180 480
1,180 480
Notes to the Parent Company Financial Statements

106
For the year ended 30 June 2016
The maximum exposure to credit risk as at 30 June 2016 and 2015 is tabulated below.
30 June 2016
30 June 2015
$’000’s $’000’sFinancial assets category: loans and
receivablesNon-current assetsDue from related parties 1,943 1,943
1,943 1,943
Current assetsDue from affiliates 14,173 7,634Cash and bank balances 1,180 480
15,353 8,114
17,296 10,057
The Company does not hold any collateral against these assets. Financial assets do not contain any impaired or non-performing assets.
(c) Foreign currency risk
Currency risk arises mainly where receivables and payables exist due to transactions entered into foreign currencies. The Company primarily has foreign currency exposures in Euro, Pakistan Rupee, Pound Sterling, CFA Franc (XOF), Nicaraguan Cordoba, Jamaican Dollar, Canadian Dollar, Emirati Dirham and Philippine Peso. However, the majority of the transactions of the Company are denominated in US$ and recognised by Group entities that have a functional currency of US$. Accordingly, foreign currency exposure is not significant to the Company’s financial position and performance.
(d) Liquidity
Based on current operating plans, the Company believes that existing cash and cash equivalents will be sufficient to meet the Company’s anticipated operating needs. However, there are a number of assumptions built into the Company’s current operating plans. If these assumptions do not materialise, the Company may need to implement a reduced spending plan.
Notes to the Parent Company Financial Statements
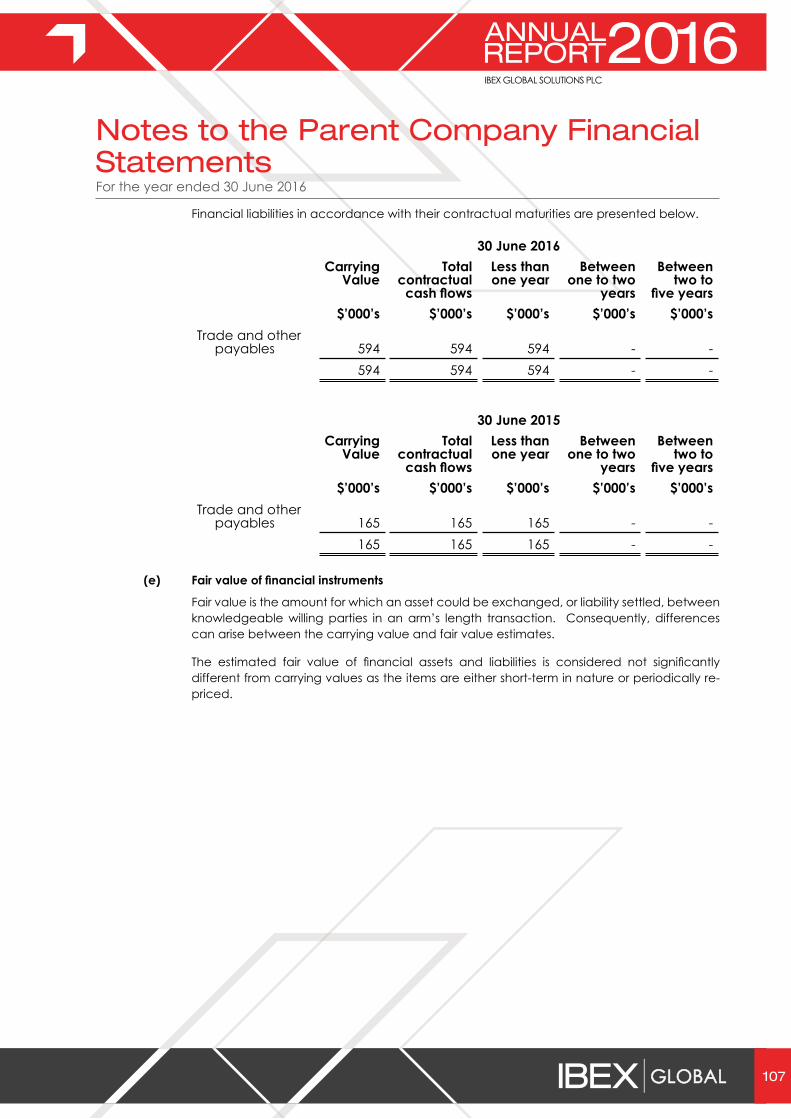
106 107
For the year ended 30 June 2016
Financial liabilities in accordance with their contractual maturities are presented below.
30 June 2016Carrying
ValueTotal
contractual cash flows
Less than one year
Between one to two
years
Between two to
five years$’000’s $’000’s $’000’s $’000’s $’000’s
Trade and other payables 594 594 594 - -
594 594 594 - -
30 June 2015Carrying
ValueTotal
contractual cash flows
Less than one year
Between one to two
years
Between two to
five years$’000’s $’000’s $’000’s $’000’s $’000’s
Trade and other payables 165 165 165 - -
165 165 165 - -
(e) Fair value of financial instruments
Fair value is the amount for which an asset could be exchanged, or liability settled, between knowledgeable willing parties in an arm’s length transaction. Consequently, differences can arise between the carrying value and fair value estimates.
The estimated fair value of financial assets and liabilities is considered not significantly different from carrying values as the items are either short-term in nature or periodically re-priced.
Notes to the Parent Company Financial Statements

© 2016 IBEX Global All Rights Reserved
www.ibexglobal.com