ic - nitin spinners template edited...
TRANSCRIPT

Nitin Spinners Ltd.Spinning growth on capacity expansion Initiating Coverage December 14, 2015
IndiaNivesh Research IndiaNivesh Securities Limited|Research Analyst SEBI Registration No. INH000000511 601 & 602, Sukh Sagar, N. S. Patkar Marg, Girgaum Chowpatty, Mumbai 400 007. Tel: (022) 66188800
IndiaNivesh Research is also available on Bloomberg INNS, Thomson First Call, Reuters and Factiva INDNIV.
Nitin Spinners Ltd (NSL) is aggressively expanding its capacities to capitalise on the expected demand revival in textile sector. Catering to diversified textile segments including apparel, made‐ups, denim, intimate wear, among others, the company is well poised to take advantage of any improvement in demand world‐wide. We expect sales of the company to grow at 21.6% CAGR over FY15‐FY18E period. We expect the return ratios of the company to improve further post completion of capacity expansion plans. We initiate coverage on NSL with BUY rating and target price of Rs 112 with long term horizon.
Key Investment Rationale:
Raw material scenario favorable: World cotton production is expected to decline 10% while consumption is likely to increase ~2% yoy in 2015‐16 (August to July period), as per USDA. World ending stocks are expected to be lower by 4% yoy in cotton season 2015. With declining ending stocks, we opine that the prices can start rising at a gradual pace over a period of time, which would be beneficial for the entire textile chain, especially for yarn manufacturers.
Focus on value added products: Specialty yarns constitute 15% of total sales of NSL. It is expanding into finer count yarns which provides better margin than basic yarn. It has forward integrated into knitted fabrics which use 100% in‐house yarn that enhances the margins of the company. Going forward, it plans to move further into value added products which includes dyed and mélange yarns.
Self sufficiency in power and strategic location: NSL has secured low power cost (spinning is a power intensive process) through coal based captive power of 10.5 MW and tie‐up with IEX and SEBs. It is strategically located with proximity to customers and raw material sources.
Almost trebling capacity over FY14‐FY18E: NSL doubled its spinning capacity to 150,096 spindles in FY15 from 77,616 spindles in FY14. Going forward, it is adding 73000 spindles which would be commencing operations from March 2017. This would imply almost trebling of capacity over FY14 to FY18E. We expect sales CAGR of 21.6% over FY15‐FY18E driven by volume growth of 18.5% CAGR.
ROE healthy at 24.5%: Post FY12, return ratios of NSL increased significantly on improved profitability and no capex till FY14. ROCE / ROE of the company increased to 22.6% / 26.4% in FY14 from 6.3% / 0.3% in FY12. The company embarked on expansion plans from FY15 followed by another expansion in FY18E, which would be impacting ROCE. However, we expect an improvement in return ratios post the completion of the capacity addition in FY17E. We expect ROCE/ ROE to decline to 19.2% / 23.7% in FY18E respectively.
Valuation: At CMP of Rs 64, the stock trades at PER of 6.2x, 5.9x and 3.8x its FY16E, FY17E and FY18E EPS of Rs 10.3, Rs 10.8 and Rs 16.8 respectively. The company has traded at average one year forward PE of 8.8x since FY10. Currently, peers are trading at average PE multiple of 7.5x FY17E earnings. However, this valuation is likely to improve going forward with demand improvement and stability in raw material scenario. We value Nitin Spinners Ltd at 6.7x (discount of 10% to peers due to high debt and lower PAT growth) its FY18E earnings arriving at target price of Rs 112 per share. FY18E is likely to be a game changing year for the company due to new capacities coming into operations. We recommend BUY rating on the stock with long term horizon.
Key Risk: Volatility in cotton prices, Rupee appreciation, High debt equity, Economic slowdown
Source: Company, IndiaNivesh, Research
Financial Performance
YE March (Rs Mn) Net Sales EBITDA PAT EPS(Rs) RoCE(%) RoE(%) Adj. P/E(x) EV/EBITDA(x)
FY14 4883 939 348 7.6 22.6 26.4 8.4 5.0
FY15 6165 992 410 8.9 14.0 24.5 7.2 6.8
FY16E 7710 1414 474 10.3 18.4 22.7 6.2 4.6
FY17E 8295 1574 496 10.8 14.4 19.6 5.9 5.5
FY18E 11080 2165 770 16.8 19.2 23.7 3.8 3.6
Daljeet S. Kohli
Head of Research
Tel: +91 22 66188826
Prerna Jhunjhunwala
Research Analyst
Tel: +91 22 66188848
Current Previous
CMP : Rs. 64
Rating : BUY Rating : NR
Target : Rs.112 Target : Rs. NR
STOCK INFO Co. Name Nitin Spinners Ltd BSE 532698 NSE NITINSPIN Bloomberg NSPL IN Reuters NISP.BO Sector Textiles Index S&P BSE SmallCap Face Value (Rs) 10 Equity Capital (Rs mn) 458 Mkt Cap (Rs mn) 2,933 52w H/L (Rs) (Adj.) 107/26 3m Avg Daily Volume (BSE + NSE) 288,969
SHAREHOLDING PATTERN % (as on Sept. 2015) Promoters 64.0 FIIs 0.0 DIIs 0.0 Public & Others 36.0 Source: BSE
STOCK PER. (%) 1m 3m 12m Nitin Spinners 2 17 120 Sensex ‐5 ‐2 ‐8 Source: Capitaline, IndiaNivesh Research
Nitin Spinners Ltd. v/s SENSEX
Source: Capitaline, IndiaNivesh Research
0
50
100
150
200
250
300
350
400
Dec/2014
Jan/2015
Feb/2015
Mar/2015
Apr/2015
May/2015
Jun/2015
Jul/2015
Aug/2015
Sep/2015
Oct/2015
Nov/2015
Dec/2015
Nitin Spinners Sensex

Initiating Coverage (contd...)
Nitin Spinners Ltd. (contd...) December 14, 2015 | 2
Investment Rationale
Robust industry scenario to support aggressive capex
Indian spinning industry – cost efficient globally
India is amongst the most competitive countries for spinning yarns in the world, as evident
from the production cost comparison 2014 report of International Textile Manufacturers
Federation. The competitiveness of the process lies in the cheap labour cost and abundant
raw material availability as compared to other countries like China, Korea, Turkey and USA.
Labour cost of China is ~3x higher than India, while Indonesian labour cost is higher by ~1.6x
over India. India is the largest producer of cotton in the world and abundant availability of
raw material provides an economic moat to Indian spinning industry. Indonesia and USA are
marginally cheaper than India in totality due to lower power and interest cost. However,
relatively large spinning capacities and abundant raw material availability in India provides a
competitive advantage to India over Indonesia and USA.
Total Manufacturing cost for Spinning Comparative Labour cost – India cheapest
Source: ITMF‐International Production Cost Comparison 2014, IndiaNivesh Research Source: ITMF‐International Production Cost Comparison 2014, IndiaNivesh Research
Comparative Power cost – USA cheapest Comparative Raw Material cost – USA cheapest
Source: ITMF‐International Production Cost Comparison 2014, IndiaNivesh Research Source: ITMF‐International Production Cost Comparison 2014, IndiaNivesh Research
Global spinning capacity – India higher capacity than Indonesia and USA
Source: ITMF – International Cotton Industry Statistics 2013, IndiaNivesh Research
3.333.51 3.52
3.68
4.51
0.00
0.50
1.00
1.50
2.00
2.50
3.00
3.50
4.00
4.50
5.00
Indonesia USA India Turkey China
USD
per kg
0.05
0.45
0.03
0.17
0.10
0.00
0.05
0.10
0.15
0.20
0.25
0.30
0.35
0.40
0.45
0.50
Indonesia USA India Turkey China
USD
per kg
0.26
0.16
0.29
0.26
0.42
0.00
0.05
0.10
0.15
0.20
0.25
0.30
0.35
0.40
0.45
Indonesia USA India Turkey China
USD
per kg
2.04
1.81
2.062.21
2.86
0.00
0.50
1.00
1.50
2.00
2.50
3.00
Indonesia USA India Turkey China
USD
per kg
Spinning capacity (million) Spindles % of world Rotors % of world
China 110.0 45.0 2.7 32.6
India 49.5 20.2 0.8 9.8
Indonesia 11.8 4.8 0.1 1.5
USA 0.7 0.3 0.3 3.6

Initiating Coverage (contd...)
Nitin Spinners Ltd. (contd...) December 14, 2015 | 3
Indian textile industry poised for growth
Global textile and apparel sector is likely to reach USD 1300 bn by 2023 from USD 773 bn in
2013, as per Technopak analysis (September 2014 report). Indian textile and apparel industry
is estimated to reach USD 237 bn in 2023 from USD 99 bn in 2013, signifying CAGR of 9.1%
over the period. This includes domestic as well as exports segment. Domestic industry worth
USD 59 bn in 2013 is likely to grow at a CAGR of 9.2% over 2013‐2023 to reach USD 142 bn by
2023. This is on account of higher economic growth, rising consumer purchasing power and
favorable demographic profile. Indian textile and apparel exports, worth USD 40 bn in 2013,
are likely to reach USD 95 bn by 2023 bn, signifying growth of 9% CAGR. This is on account of
increasing competitiveness against other exporting countries. Rising Chinese domestic
consumption, labour issues in China and Bangladesh, increasing power cost and depreciating
Rupee vis‐a‐vis other exporting countries are turning favorable for Indian exports.
Global Trade in Textiles and Apparel Indian textile and apparel sector to grow at CAGR of 9.5%
Source: Technopak, IndiaNivesh Research Source: Technopak, IndiaNivesh Research
Raw material scenario – cotton ‐ favorable for the industry
Cotton prices have been range bound over the last one year (Shankar‐6 prices in the range of
Rs 80‐100 per kg). World cotton production is expected to decline 10% while consumption is
likely to increase ~2% yoy in marketing year 2015‐16 (August to July period), as per US
Department of Agriculture (USDA). World ending stocks are expected to be lower by 4% yoy
at 107 mn bales against 112 mn bales in cotton season 2015. With declining ending stocks,
we expect that the cotton prices are not likely to show steep decline in prices. We opine that
the prices can start rising at a gradual pace over a period of time, which would be beneficial
for the entire textile chain, especially for yarn manufacturers.
Cotton Prices (Shankar‐6)
0
20
40
60
80
100
120
140
Apr‐2014
Jun‐2014
Aug‐…
Oct‐2014
Dec‐2014
Feb‐2015
Apr‐2015
Jun‐2015
Aug‐…
Oct‐2015
Rs per kg
Source: Bloomberg, IndiaNivesh Research
205 288 345 420530
223
362428
580
770
428
650
773
1000
1300
0
200
400
600
800
1000
1200
1400
2003 2008 2013 2018(P) 2023(P)
USD
Bn
Apparel Textiles
33 4060
9554
59
90
142
8799
150
237
0
50
100
150
200
250
2012 2013 2018(P) 2023 (P)
Exports Domestic

Initiating Coverage (contd...)
Nitin Spinners Ltd. (contd...) December 14, 2015 | 4
Strong business model of NSL
Strategic location
NSL is about 16 kilometers away from Bhilwara District, which is one of the textile hubs of
the country. This proximity ensures availability of skilled & unskilled labour. Further, the
basic raw material i.e. cotton is available in the surrounding areas viz., Bhilwara, Bijaynagar,
Asind and other adjoining areas like Nagaur, Merta City, Sumerpur and Beawar within
Rajasthan state itself. Proximity to raw material sources provide advantages like better
quality raw material availability in smallest time providing opportunity to keep inventory
levels low. With better availability of cotton around the year and focus on reducing working
capital, the company has been able to reduce its inventory levels to 53 days in FY15 from 73
days in FY11.
Reducing inventory days
7366 67
53 56 55 55 54
0
10
20
30
40
50
60
70
80
FY11 FY12 FY13 FY14 FY15 FY16E FY17E FY18E
No. of Days
Source: Company, IndiaNivesh Research
Focus on value added products
NSL manufactures yarn for variety of end applications including shirting, home furnishing,
carpets, denims, medical textiles, terry towels, intimate wear and others. Specialty yarns
constitute 15% of the total turnover of the company. The company also manufactures value
added yarns including slub and compact yarn which command premium over basic cotton
yarn. It is expanding into finer count yarns which provides better margin than basic yarn. It
has forward integrated into knitted fabrics which use 100% in‐house yarn that enhances the
margins of the company. Going forward, NSL plans to move further into value added
products which includes dyed and mélange yarns. It’s up gradation to higher quality products
are visible from average realization which has been increasing over FY07‐FY14. In FY15,
average realization fell by 5.9% yoy due to continuous decline in cotton prices by ~22.8% yoy.
Captive Power of 10.5 MW
Spinning is a power intensive process. Generally, the power requirement is 2.5‐4 units per kg
of production. Power efficiency is one of the key success factors of any spinning company.
NSL has coal‐based captive power plant of 10.5 MW. The company has availed coal linkage
from Coal India which ensures timely availability of feed at reasonable cost. NSL also avails
power from IEX and SEB in case of additional requirement. The power cost as percentage to
sales decreased to 8.3% in FY15 from its peak of 13.5% in FY08. In our opinion, this decline is
reasonable to compete in domestic and international market.

Initiating Coverage (contd...)
Nitin Spinners Ltd. (contd...) December 14, 2015 | 5
Power cost as % to sales
Source: Company, IndiaNivesh Research
Diversify geographical risk
NSL is following change in strategy by focusing on domestic markets too. NSL has been an
exporter from inception. It was registered as a 100% EOU earlier, which was later converted
to DTA (domestic unit) in FY09. This provided the company with flexibility to sell in domestic
and export market. Currently, 64% of company revenues come from exports while domestic
contributes 36% to topline. The management plans to increase the share of domestic
revenues to 45% to de‐risk its business from the fluctuations of foreign exchange risk and
diversify client base. A diversified geographical mix would enable the company to mitigate
global risk and focus on Indian market would enable the company to capitalize on the
domestic growth.
Increasing share of domestic revenues
Source: Company, IndiaNivesh Research
Exit from CDR in shortest time signifies strong business model
NSL entered into Corporate Debt Restructuring (CDR) mechanism in FY09 due to forex losses
and adverse business scenario in FY08. NSL had captive furnace oil based power plant before
FY10. In FY09 when oil prices reached levels of USD 150, the power cost of the company
peaked to 13.3% of sales. High cotton prices and high power cost coupled with foreign
exchange loss resulted in loss at EBITDA level in FY09. However, with the adoption of sound
forex policies, change in business strategies and improvement in business scenario, the
company exited CDR in FY14. As per the management, NSL’s exit from CDR is the shortest
turnaround in the history of CDR mechanism. The exit from CDR would provide the company
with operational and financial flexibility and enable it to pursue capex plans.
10.3 10.2
13.5 13.3
10.4
8.69.0
8.6
7.2
8.3 8.4 8.28.0
6.0
7.0
8.0
9.0
10.0
11.0
12.0
13.0
14.0
FY6
FY7
FY8
FY9
FY10
FY11
FY12
FY13
FY14
FY15
FY16E
FY17E
FY18E
% of sales
81.2
68.8
51.1
64.471.1 71.3
77.5
68.663.6
18.8
31.2
48.9
35.628.9 28.7
22.5
31.436.4
0
10
20
30
40
50
60
70
80
90
FY07 FY08 FY09 FY10 FY11 FY12 FY13 FY14 FY15
%
Exports Domestic
Initiating Coverage (contd...)
Nitin Spinners Ltd. (contd...) December 14, 2015 | 6
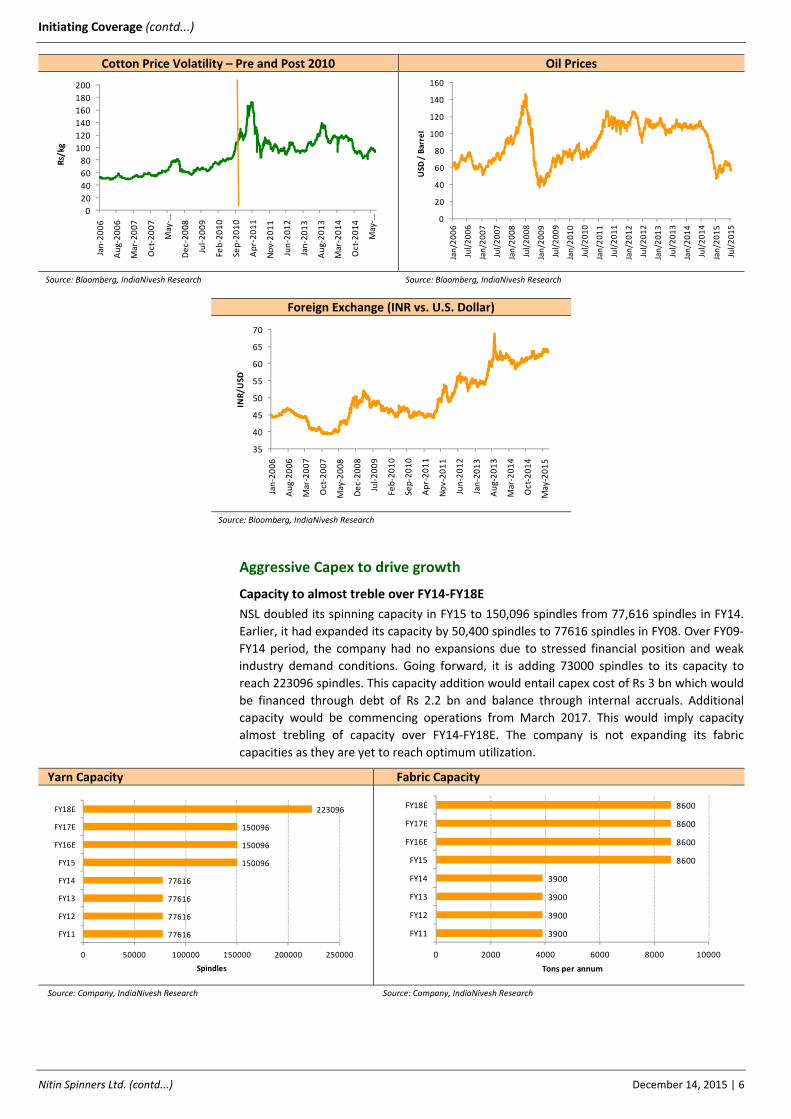
Cotton Price Volatility – Pre and Post 2010 Oil Prices
Source: Bloomberg, IndiaNivesh Research Source: Bloomberg, IndiaNivesh Research
Foreign Exchange (INR vs. U.S. Dollar)
Source: Bloomberg, IndiaNivesh Research
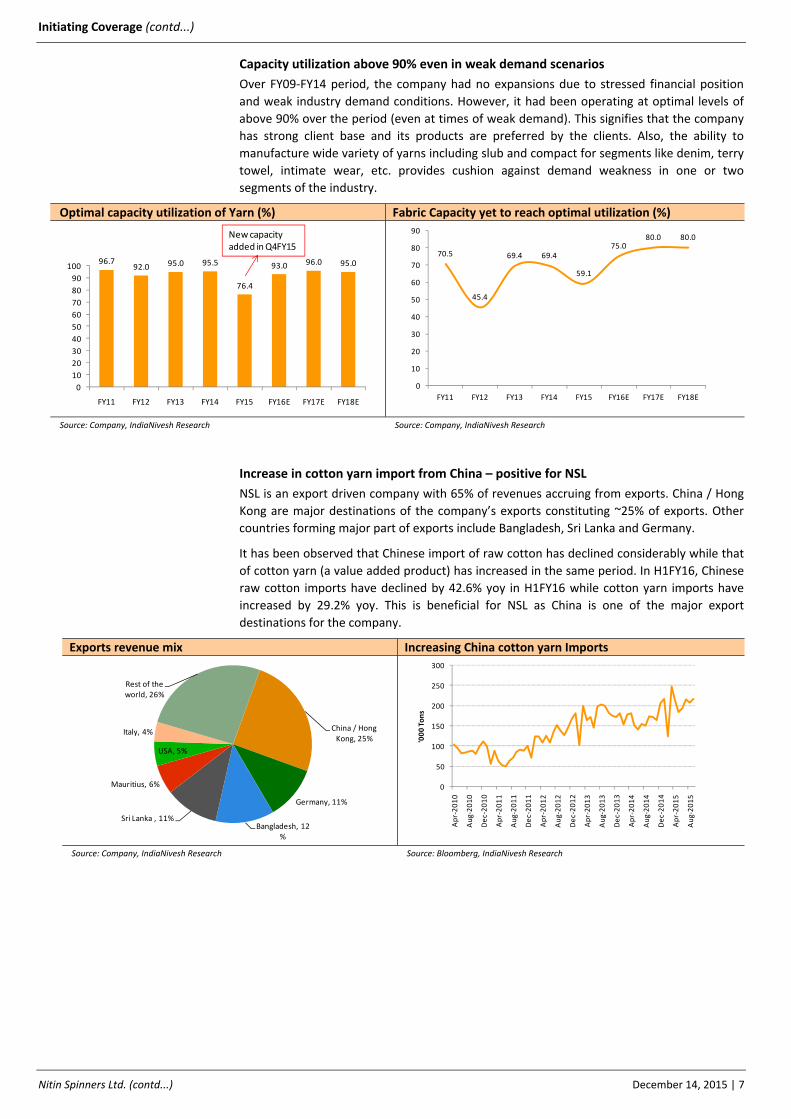
Aggressive Capex to drive growth
Capacity to almost treble over FY14‐FY18E
NSL doubled its spinning capacity in FY15 to 150,096 spindles from 77,616 spindles in FY14.
Earlier, it had expanded its capacity by 50,400 spindles to 77616 spindles in FY08. Over FY09‐
FY14 period, the company had no expansions due to stressed financial position and weak
industry demand conditions. Going forward, it is adding 73000 spindles to its capacity to
reach 223096 spindles. This capacity addition would entail capex cost of Rs 3 bn which would
be financed through debt of Rs 2.2 bn and balance through internal accruals. Additional
capacity would be commencing operations from March 2017. This would imply capacity
almost trebling of capacity over FY14‐FY18E. The company is not expanding its fabric
capacities as they are yet to reach optimum utilization.
Yarn Capacity Fabric Capacity
Source: Company, IndiaNivesh Research Source: Company, IndiaNivesh Research
0
20
40
60
80
100
120
140
160
180
200
Jan‐2006
Aug‐2006
Mar‐2007
Oct‐2007
May‐ …
Dec‐2008
Jul‐2009
Feb‐2010
Sep‐2010
Apr‐2011
Nov‐2011
Jun‐2012
Jan‐2013
Aug‐2013
Mar‐2014
Oct‐2014
May‐ …
Rs/kg
0
20
40
60
80
100
120
140
160
Jan/2006
Jul/2006
Jan/2007
Jul/2007
Jan/2008
Jul/2008
Jan/2009
Jul/2009
Jan/2010
Jul/2010
Jan/2011
Jul/2011
Jan/2012
Jul/2012
Jan/2013
Jul/2013
Jan/2014
Jul/2014
Jan/2015
Jul/2015
USD
/ Barrel
35
40
45
50
55
60
65
70
Jan‐2006
Aug‐2006
Mar‐2007
Oct‐2007
May‐2008
Dec‐2008
Jul‐2009
Feb‐2010
Sep‐2010
Apr‐2011
Nov‐2011
Jun‐2012
Jan‐2013
Aug‐2013
Mar‐2014
Oct‐2014
May‐2015
INR/U
SD
77616
77616
77616
77616
150096
150096
150096
223096
0 50000 100000 150000 200000 250000
FY11
FY12
FY13
FY14
FY15
FY16E
FY17E
FY18E
Spindles
3900
3900
3900
3900
8600
8600
8600
8600
0 2000 4000 6000 8000 10000
FY11
FY12
FY13
FY14
FY15
FY16E
FY17E
FY18E
Tons per annum
Initiating Coverage (contd...)
Nitin Spinners Ltd. (contd...) December 14, 2015 | 7
China / Hong Kong, 25%
Germany, 11%
Bangladesh, 12%
Sri Lanka , 11%
Mauritius, 6%
USA, 5%
Italy, 4%
Rest of the world, 26%
0
50
100
150
200
250
300
Apr‐2010
Aug‐2010
Dec‐2010
Apr‐2011
Aug‐2011
Dec‐2011
Apr‐2012
Aug‐2012
Dec‐2012
Apr‐2013
Aug‐2013
Dec‐2013
Apr‐2014
Aug‐2014
Dec‐2014
Apr‐2015
Aug‐2015
'000 Tons
96.792.0 95.0 95.5
76.4
93.0 96.0 95.0
0
10
20
30
40
50
60
70
80
90
100
FY11 FY12 FY13 FY14 FY15 FY16E FY17E FY18E
New capacity added in Q4FY15
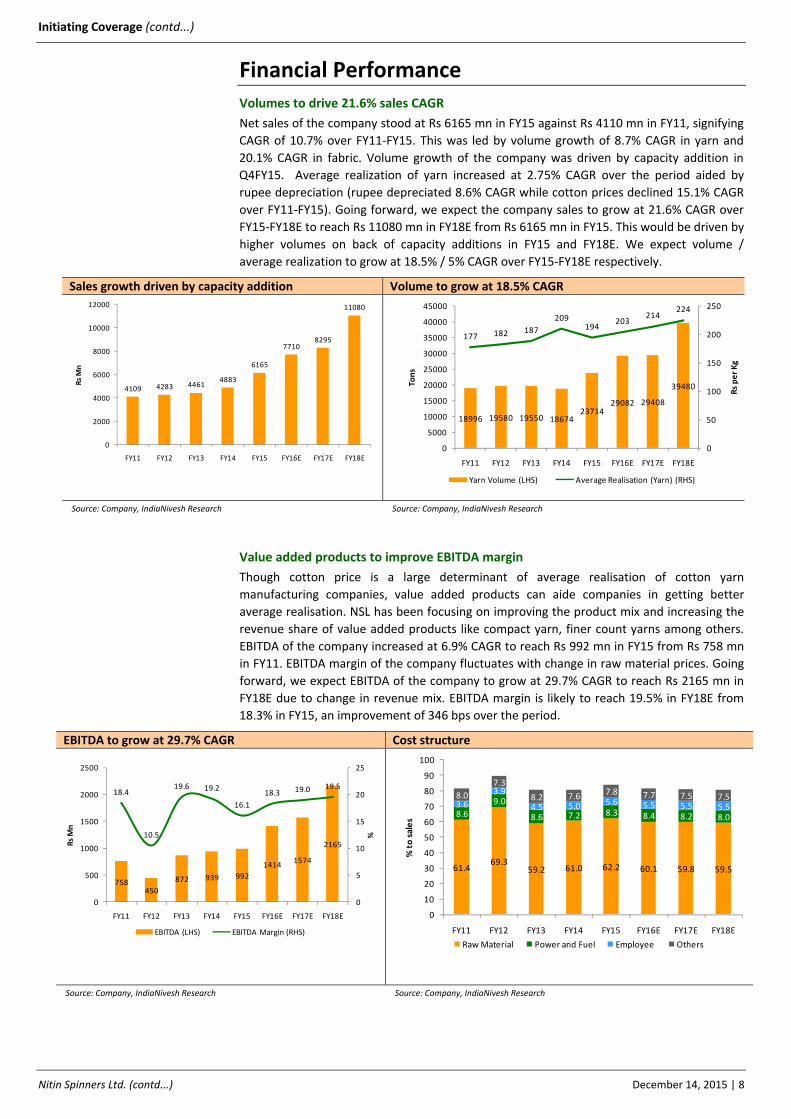
Capacity utilization above 90% even in weak demand scenarios
Over FY09‐FY14 period, the company had no expansions due to stressed financial position
and weak industry demand conditions. However, it had been operating at optimal levels of
above 90% over the period (even at times of weak demand). This signifies that the company
has strong client base and its products are preferred by the clients. Also, the ability to
manufacture wide variety of yarns including slub and compact for segments like denim, terry
towel, intimate wear, etc. provides cushion against demand weakness in one or two
segments of the industry.
Optimal capacity utilization of Yarn (%) Fabric Capacity yet to reach optimal utilization (%)
Source: Company, IndiaNivesh Research Source: Company, IndiaNivesh Research
Increase in cotton yarn import from China – positive for NSL
NSL is an export driven company with 65% of revenues accruing from exports. China / Hong
Kong are major destinations of the company’s exports constituting ~25% of exports. Other
countries forming major part of exports include Bangladesh, Sri Lanka and Germany.
It has been observed that Chinese import of raw cotton has declined considerably while that
of cotton yarn (a value added product) has increased in the same period. In H1FY16, Chinese
raw cotton imports have declined by 42.6% yoy in H1FY16 while cotton yarn imports have
increased by 29.2% yoy. This is beneficial for NSL as China is one of the major export
destinations for the company.
Exports revenue mix Increasing China cotton yarn Imports
Source: Company, IndiaNivesh Research Source: Bloomberg, IndiaNivesh Research
70.5
45.4
69.4 69.4
59.1
75.080.0 80.0
0
10
20
30
40
50
60
70
80
90
FY11 FY12 FY13 FY14 FY15 FY16E FY17E FY18E
Initiating Coverage (contd...)
Nitin Spinners Ltd. (contd...) December 14, 2015 | 8
758450
872 939 992
14141574
2165
18.4
10.5
19.6 19.2
16.1
18.3 19.0 19.5
0
5
10
15
20
25
0
500
1000
1500
2000
2500
FY11 FY12 FY13 FY14 FY15 FY16E FY17E FY18E
%
Rs Mn
EBITDA (LHS) EBITDA Margin (RHS)
Financial Performance
Volumes to drive 21.6% sales CAGR
Net sales of the company stood at Rs 6165 mn in FY15 against Rs 4110 mn in FY11, signifying
CAGR of 10.7% over FY11‐FY15. This was led by volume growth of 8.7% CAGR in yarn and
20.1% CAGR in fabric. Volume growth of the company was driven by capacity addition in
Q4FY15. Average realization of yarn increased at 2.75% CAGR over the period aided by
rupee depreciation (rupee depreciated 8.6% CAGR while cotton prices declined 15.1% CAGR
over FY11‐FY15). Going forward, we expect the company sales to grow at 21.6% CAGR over
FY15‐FY18E to reach Rs 11080 mn in FY18E from Rs 6165 mn in FY15. This would be driven by
higher volumes on back of capacity additions in FY15 and FY18E. We expect volume /
average realization to grow at 18.5% / 5% CAGR over FY15‐FY18E respectively.
Sales growth driven by capacity addition Volume to grow at 18.5% CAGR
Source: Company, IndiaNivesh Research Source: Company, IndiaNivesh Research
Value added products to improve EBITDA margin
Though cotton price is a large determinant of average realisation of cotton yarn
manufacturing companies, value added products can aide companies in getting better
average realisation. NSL has been focusing on improving the product mix and increasing the
revenue share of value added products like compact yarn, finer count yarns among others.
EBITDA of the company increased at 6.9% CAGR to reach Rs 992 mn in FY15 from Rs 758 mn
in FY11. EBITDA margin of the company fluctuates with change in raw material prices. Going
forward, we expect EBITDA of the company to grow at 29.7% CAGR to reach Rs 2165 mn in
FY18E due to change in revenue mix. EBITDA margin is likely to reach 19.5% in FY18E from
18.3% in FY15, an improvement of 346 bps over the period.
EBITDA to grow at 29.7% CAGR Cost structure
Source: Company, IndiaNivesh Research Source: Company, IndiaNivesh Research
4109 4283 44614883
6165
77108295
11080
0
2000
4000
6000
8000
10000
12000
FY11 FY12 FY13 FY14 FY15 FY16E FY17E FY18E
Rs Mn
18996 19580 19550 1867423714
29082 29408
39480
177 182 187
209194
203214
224
0
50
100
150
200
250
0
5000
10000
15000
20000
25000
30000
35000
40000
45000
FY11 FY12 FY13 FY14 FY15 FY16E FY17E FY18E
Rs per Kg
Tons
Yarn Volume (LHS) Average Realisation (Yarn) (RHS)
61.469.3
59.2 61.0 62.2 60.1 59.8 59.5
8.6
9.0
8.6 7.2 8.3 8.4 8.2 8.0
3.6
3.9
4.5 5.0 5.6 5.5 5.5 5.58.0
7.3
8.2 7.6 7.8 7.7 7.5 7.5
0
10
20
30
40
50
60
70
80
90
100
FY11 FY12 FY13 FY14 FY15 FY16E FY17E FY18E
% to sales
Raw Material Power and Fuel Employee Others

Initiating Coverage (contd...)
Nitin Spinners Ltd. (contd...) December 14, 2015 | 9
PAT margin to be impacted in near term on higher tax rate and interest cost
Reported PAT of the company increased at a CAGR of 57% over FY11‐FY15 to reach Rs 410
mn in FY15 against Rs 67 mn in FY11. However, adjusting for exceptional items in FY11 (for
excess depreciation charged on change in accounting norms), PAT increased at 15.2% CAGR
over the same period. Adjusted PAT margin increased from 5.7% in FY11 to 6.6% in FY15 on
higher other income. PAT margin of the company has largely been moving in‐line with
EBITDA margin.
Despite EBITDA growth of 29.7% CAGR, PAT is likely to grow at 23.4% CAGR over FY15‐18E.
We expect PAT of the company to reach Rs 770 mn in FY18E with margin of 7.0%. This is due
to higher effective tax rate, higher depreciation and interest cost due to ongoing capex. The
company is likely to pay full tax rate of 34.3% from FY16E against 23.8% rate paid in FY15.
Depreciation and interest are likely to grow at 29.4% and 20.5% CAGR over FY15‐18E,
lowering the bottom‐line growth.
PAT to grow at 23.4% CAGR
Source: Company, IndiaNivesh Research
Return ratios healthy despite lower PAT margin
Post FY12, the return ratios of the company increased significantly on improved profitability
and no capex till FY14. ROCE / ROE of the company increased to 22.6% / 26.4% in FY14 from
6.3% / 0.3% in FY12. The company embarked on expansion plans from FY15 followed by
another expansion in FY18E, which would be impacting ROCE due to higher capital work in
progress till FY17E. Also, higher effective tax rate and lower PAT margin would impact the
return ratios of the company. However, we expect an improvement in return ratios post the
completion of the capacity addition in FY17E and report improved performance from FY18E.
We expect ROCE/ ROE to reach 19.2% / 23.7% in FY18E respectively.
ROE of 23.7% in FY18E
Source: Company, IndiaNivesh Research
2333
241348
410474 496
770
5.7
0.1
5.4
7.16.6
6.1 6.0
7.0
‐3
‐1
1
3
5
7
9
0
100
200
300
400
500
600
700
800
900
FY11 FY12 FY13 FY14 FY15 FY16E FY17E
%
Rs Mn
Adj. PAT (LHS) Adj. PAT Margin (RHS)
14.0
6.3
20.5 22.6
14.0
18.4
14.4
19.2
7.8
0.3
14.0
26.424.5
22.7
19.6
23.7
0.0
5.0
10.0
15.0
20.0
25.0
30.0
FY11 FY12 FY13 FY14 FY15 FY16E FY17E FY18E
ROCE ROE
Capex period ‐capacity WIP

Initiating Coverage (contd...)
Nitin Spinners Ltd. (contd...) December 14, 2015 | 10
35
40
45
50
55
60
65
70
Jan‐2006
Jul‐2006
Jan‐2007
Jul‐2007
Jan‐2008
Jul‐2008
Jan‐2009
Jul‐2009
Jan‐2010
Jul‐2010
Jan‐2011
Jul‐2011
Jan‐2012
Jul‐2012
Jan‐2013
Jul‐2013
Jan‐2014
Jul‐2014
Jan‐2015
Jul‐2015
INR/U
SD
0
20
40
60
80
100
120
140
160
180
200
Jan‐2006
Jul‐2006
Jan‐2007
Jul‐2007
Jan‐2008
Jul‐2008
Jan‐2009
Jul‐2009
Jan‐2010
Jul‐2010
Jan‐2011
Jul‐2011
Jan‐2012
Jul‐2012
Jan‐2013
Jul‐2013
Jan‐2014
Jul‐2014
Jan‐2015
Jul‐2015
Rs/kg
100113 123
177 182 187209
194
0
50
100
150
200
250
FY08 FY09 FY10 FY11 FY12 FY13 FY14 FY15
Rs/kg
Raw Material / EPS 100 bps↓ 50 bps↓ Base Case 50 bps ↑ 100 bps ↑
FY16E 59.1 59.6 60.1 60.6 61.1
% Change in EPS 10.8 5.4 0.0 ‐5.4 ‐10.8
FY17E 58.8 59.3 59.8 60.3 60.8
% Change in EPS 11.0 5.5 0.0 ‐5.5 ‐11.0
FY18E 58.5 59.0 59.5 60.0 60.5
% Change in EPS 9.5 4.8 0.0 ‐4.8 ‐9.5
Key risks
Cotton price volatility may impact profitability
NSL is a cotton yarn manufacturing company with raw material cost forming ~60% of its
sales. Key raw material of the company is cotton, which fluctuates depending on the demand
and supply scenario in global as well as domestic markets. Though value added yarn and
presence of fabrics provides some cushion to this risk, NSL cannot mitigate this risk
completely. Steep volatility in cotton prices could impact the performance of the company
on short term basis at any particular time. As per our analysis, 100 bps movement in raw
material cost as percentage to sales could impact EPS by 10.8% in FY16E, 11% in FY17E and
9.5% in FY18E.
Sensitivity of raw material cost to EPS
Source: IndiaNivesh Research
Rupee appreciation
Exports constitute 65% of the company’s sales. Rupee has been depreciating since 2008 and
has reached Rs 66 / USD currently from Rs 40 / USD in 2008. This implies a depreciation of
65% over the period. In our opinion, the company has benefitted from this scenario as the
average realization of the company has either been increasing or stable, irrespective of
cotton prices. Significant rupee appreciation could have an adverse impact on the average
realization.
Depreciating Rupee Volatile cotton prices Increasing average realization of yarn
Source: Bloomberg, IndiaNivesh Research Source: Bloomberg, IndiaNivesh Research Source: Company, IndiaNivesh Research
High debt
NSL, operating in capital intensive spinning industry, has been exposed to high debt.
However, post exit from CDR, the company has been conscious of reducing the debt levels.
We expect the debt to equity of the company to reduce to 1.5x in FY18E from 2.3x in FY15,
post completion of capacity expansion. Taking into consideration other spinning companies,
the debt of the company would still remain high as other companies have consciously
reworked their strategies to reduce debt. High debt could be one of the major risks in event
of demand slowdown.
Initiating Coverage (contd...)
Nitin Spinners Ltd. (contd...) December 14, 2015 | 11
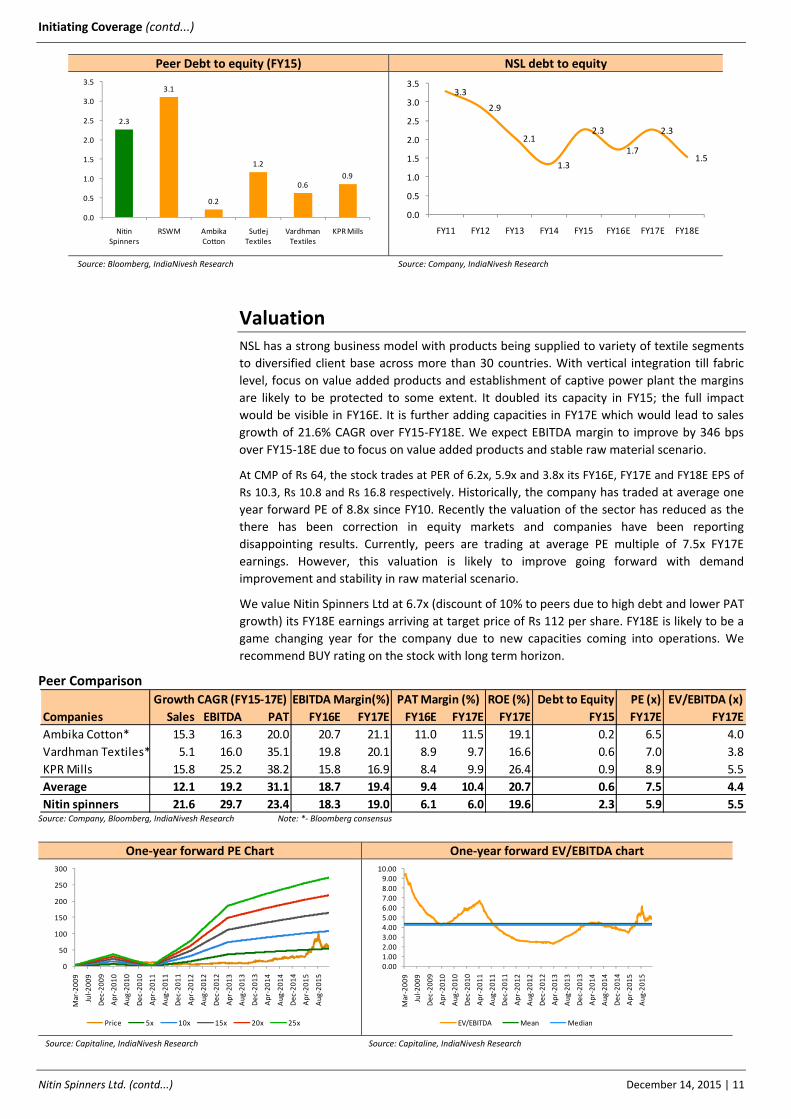
2.3
3.1
0.2
1.2
0.60.9
0.0
0.5
1.0
1.5
2.0
2.5
3.0
3.5
Nitin Spinners
RSWM Ambika Cotton
Sutlej Textiles
Vardhman Textiles
KPR Mills
3.3
2.9
2.1
1.3
2.3
1.7
2.3
1.5
0.0
0.5
1.0
1.5
2.0
2.5
3.0
3.5
FY11 FY12 FY13 FY14 FY15 FY16E FY17E FY18E
Peer Debt to equity (FY15) NSL debt to equity
Source: Bloomberg, IndiaNivesh Research Source: Company, IndiaNivesh Research
Valuation NSL has a strong business model with products being supplied to variety of textile segments
to diversified client base across more than 30 countries. With vertical integration till fabric
level, focus on value added products and establishment of captive power plant the margins
are likely to be protected to some extent. It doubled its capacity in FY15; the full impact
would be visible in FY16E. It is further adding capacities in FY17E which would lead to sales
growth of 21.6% CAGR over FY15‐FY18E. We expect EBITDA margin to improve by 346 bps
over FY15‐18E due to focus on value added products and stable raw material scenario.
At CMP of Rs 64, the stock trades at PER of 6.2x, 5.9x and 3.8x its FY16E, FY17E and FY18E EPS of
Rs 10.3, Rs 10.8 and Rs 16.8 respectively. Historically, the company has traded at average one
year forward PE of 8.8x since FY10. Recently the valuation of the sector has reduced as the
there has been correction in equity markets and companies have been reporting
disappointing results. Currently, peers are trading at average PE multiple of 7.5x FY17E
earnings. However, this valuation is likely to improve going forward with demand
improvement and stability in raw material scenario.
We value Nitin Spinners Ltd at 6.7x (discount of 10% to peers due to high debt and lower PAT
growth) its FY18E earnings arriving at target price of Rs 112 per share. FY18E is likely to be a
game changing year for the company due to new capacities coming into operations. We
recommend BUY rating on the stock with long term horizon.
Peer Comparison
Source: Company, Bloomberg, IndiaNivesh Research Note: *‐ Bloomberg consensus
One‐year forward PE Chart One‐year forward EV/EBITDA chart
Source: Capitaline, IndiaNivesh Research Source: Capitaline, IndiaNivesh Research
ROE (%) Debt to Equity PE (x) EV/EBITDA (x)
Companies Sales EBITDA PAT FY16E FY17E FY16E FY17E FY17E FY15 FY17E FY17E
Ambika Cotton* 15.3 16.3 20.0 20.7 21.1 11.0 11.5 19.1 0.2 6.5 4.0
Vardhman Textiles* 5.1 16.0 35.1 19.8 20.1 8.9 9.7 16.6 0.6 7.0 3.8
KPR Mills 15.8 25.2 38.2 15.8 16.9 8.4 9.9 26.4 0.9 8.9 5.5
Average 12.1 19.2 31.1 18.7 19.4 9.4 10.4 20.7 0.6 7.5 4.4
Nitin spinners 21.6 29.7 23.4 18.3 19.0 6.1 6.0 19.6 2.3 5.9 5.5
Growth CAGR (FY15‐17E) EBITDA Margin(%) PAT Margin (%)
0
50
100
150
200
250
300
Mar‐2009
Jul‐2009
Dec‐2009
Apr‐2010
Aug‐2010
Dec‐2010
Apr‐2011
Aug‐2011
Dec‐2011
Apr‐2012
Aug‐2012
Dec‐2012
Apr‐2013
Aug‐2013
Dec‐2013
Apr‐2014
Aug‐2014
Dec‐2014
Apr‐2015
Aug‐2015
Price 5x 10x 15x 20x 25x
0.001.002.003.004.005.006.007.008.009.00
10.00
Mar‐2009
Jul‐2009
Dec‐2009
Apr‐2010
Aug‐2010
Dec‐2010
Apr‐2011
Aug‐2011
Dec‐2011
Apr‐2012
Aug‐2012
Dec‐2012
Apr‐2013
Aug‐2013
Dec‐2013
Apr‐2014
Aug‐2014
Dec‐2014
Apr‐2015
Aug‐2015
EV/EBITDA Mean Median

Initiating Coverage (contd...)
Nitin Spinners Ltd. (contd...) December 14, 2015 | 12
Denim, 10%
Knitwear , 55%Terry
Towels, 5%
Woven Fabrics, 20%
Home Furnishing, 10%
82.5 85.7 86.6 82.874.8 76.9 75.9 80.1
14.5 10.3 9.9 14.219.1 20.0 21.1 16.7
3.0 4.0 3.5 3.0 4.2 3.1 3.0 3.2
0%
10%
20%
30%
40%
50%
60%
70%
80%
90%
100%
FY11 FY12 FY13 FY14 FY15 FY16E FY17E FY18E
Yarns Fabrics Others
Company Background Nitin Spinners Ltd, incorporated in 1993, is engaged in the production of cotton yarns and
knitted fabrics. Cotton yarns manufactured by the company are used in diversified segment
including knitted fabrics, woven fabrics, industrial fabrics, denims, furnishings, terry towels
and carpets among others. Knitted fabrics are used in apparel industry. Headquartered in
Bhilwara (Rajasthan), the company’s manufacturing capacity of yarn is 37800 tons per
annum (150,000 spindles) and that of fabrics is 8600 tons per annum (49 circular knitting
machines). With 65% of its sales accruing from exports, the company is exporting products to
more than 40 countries including European, US and Asia‐Pacific countries. The company is an
approved vendor for HNM, C&A and IKEA stores.
Client profile of NSL Revenue Mix
Source: Company, IndiaNivesh Research
Source: Company, IndiaNivesh Research
Initiating Coverage (contd...)
Nitin Spinners Ltd. (contd...) December 14, 2015 | 13
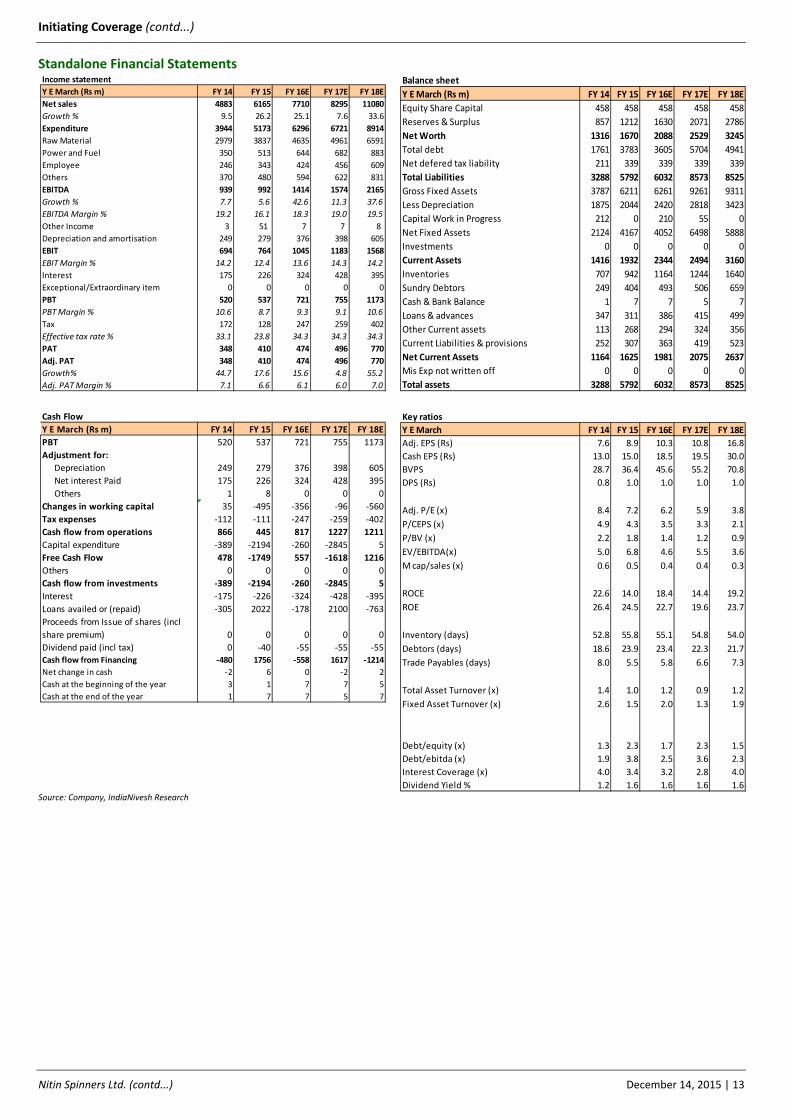
Standalone Financial Statements
Source: Company, IndiaNivesh Research
Income statement
Y E March (Rs m) FY 14 FY 15 FY 16E FY 17E FY 18E
Net sales 4883 6165 7710 8295 11080
Growth % 9.5 26.2 25.1 7.6 33.6
Expenditure 3944 5173 6296 6721 8914
Raw Material 2979 3837 4635 4961 6591
Power and Fuel 350 513 644 682 883
Employee 246 343 424 456 609
Others 370 480 594 622 831
EBITDA 939 992 1414 1574 2165
Growth % 7.7 5.6 42.6 11.3 37.6
EBITDA Margin % 19.2 16.1 18.3 19.0 19.5
Other Income 3 51 7 7 8
Depreciation and amortisation 249 279 376 398 605
EBIT 694 764 1045 1183 1568
EBIT Margin % 14.2 12.4 13.6 14.3 14.2
Interest 175 226 324 428 395
Exceptional/Extraordinary item 0 0 0 0 0
PBT 520 537 721 755 1173
PBT Margin % 10.6 8.7 9.3 9.1 10.6
Tax 172 128 247 259 402
Effective tax rate % 33.1 23.8 34.3 34.3 34.3
PAT 348 410 474 496 770
Adj. PAT 348 410 474 496 770
Growth% 44.7 17.6 15.6 4.8 55.2
Adj. PAT Margin % 7.1 6.6 6.1 6.0 7.0
Balance sheet
Y E March (Rs m) FY 14 FY 15 FY 16E FY 17E FY 18E
Equity Share Capital 458 458 458 458 458
Reserves & Surplus 857 1212 1630 2071 2786
Net Worth 1316 1670 2088 2529 3245
Total debt 1761 3783 3605 5704 4941
Net defered tax liability 211 339 339 339 339
Total Liabilities 3288 5792 6032 8573 8525
Gross Fixed Assets 3787 6211 6261 9261 9311
Less Depreciation 1875 2044 2420 2818 3423
Capital Work in Progress 212 0 210 55 0
Net Fixed Assets 2124 4167 4052 6498 5888
Investments 0 0 0 0 0
Current Assets 1416 1932 2344 2494 3160
Inventories 707 942 1164 1244 1640
Sundry Debtors 249 404 493 506 659
Cash & Bank Balance 1 7 7 5 7
Loans & advances 347 311 386 415 499
Other Current assets 113 268 294 324 356
Current Liabilities & provisions 252 307 363 419 523
Net Current Assets 1164 1625 1981 2075 2637
Mis Exp not written off 0 0 0 0 0
Total assets 3288 5792 6032 8573 8525
Cash Flow
Y E March (Rs m) FY 14 FY 15 FY 16E FY 17E FY 18E
PBT 520 537 721 755 1173
Adjustment for:
Depreciation 249 279 376 398 605
Net interest Paid 175 226 324 428 395
Others 1 8 0 0 0
Changes in working capital 35 ‐495 ‐356 ‐96 ‐560
Tax expenses ‐112 ‐111 ‐247 ‐259 ‐402
Cash flow from operations 866 445 817 1227 1211
Capital expenditure ‐389 ‐2194 ‐260 ‐2845 5
Free Cash Flow 478 ‐1749 557 ‐1618 1216
Others 0 0 0 0 0
Cash flow from investments ‐389 ‐2194 ‐260 ‐2845 5
Interest ‐175 ‐226 ‐324 ‐428 ‐395
Loans availed or (repaid) ‐305 2022 ‐178 2100 ‐763
Proceeds from Issue of shares (incl
share premium) 0 0 0 0 0
Dividend paid (incl tax) 0 ‐40 ‐55 ‐55 ‐55
Cash flow from Financing ‐480 1756 ‐558 1617 ‐1214
Net change in cash ‐2 6 0 ‐2 2
Cash at the beginning of the year 3 1 7 7 5
Cash at the end of the year 1 7 7 5 7
Key ratios
Y E March FY 14 FY 15 FY 16E FY 17E FY 18E
Adj. EPS (Rs) 7.6 8.9 10.3 10.8 16.8
Cash EPS (Rs) 13.0 15.0 18.5 19.5 30.0
BVPS 28.7 36.4 45.6 55.2 70.8
DPS (Rs) 0.8 1.0 1.0 1.0 1.0
Adj. P/E (x) 8.4 7.2 6.2 5.9 3.8
P/CEPS (x) 4.9 4.3 3.5 3.3 2.1
P/BV (x) 2.2 1.8 1.4 1.2 0.9
EV/EBITDA(x) 5.0 6.8 4.6 5.5 3.6
M cap/sales (x) 0.6 0.5 0.4 0.4 0.3
ROCE 22.6 14.0 18.4 14.4 19.2
ROE 26.4 24.5 22.7 19.6 23.7
Inventory (days) 52.8 55.8 55.1 54.8 54.0
Debtors (days) 18.6 23.9 23.4 22.3 21.7
Trade Payables (days) 8.0 5.5 5.8 6.6 7.3
Total Asset Turnover (x) 1.4 1.0 1.2 0.9 1.2
Fixed Asset Turnover (x) 2.6 1.5 2.0 1.3 1.9
Debt/equity (x) 1.3 2.3 1.7 2.3 1.5
Debt/ebitda (x) 1.9 3.8 2.5 3.6 2.3
Interest Coverage (x) 4.0 3.4 3.2 2.8 4.0
Dividend Yield % 1.2 1.6 1.6 1.6 1.6

Initiating Coverage
Nitin Spinners Ltd. December 14, 2015 | 14
Disclaimer: This report has been prepared by IndiaNivesh Securities Limited (“INSL”) and published in accordance with the provisions of Regulation 18 of the Securities and Exchange Board of India (Research Analysts) Regulations, 2014, for use by the recipient as information only and is not for circulation or public distribution. INSL includes subsidiaries, group and associate companies, promoters, directors, employees and affiliates. This report is not to be altered, transmitted, reproduced, copied, redistributed, uploaded, published or made available to others, in any form, in whole or in part, for any purpose without prior written permission from INSL. The projections and the forecasts described in this report are based upon a number of estimates and assumptions and are inherently subject to significant uncertainties and contingencies. Projections and forecasts are necessarily speculative in nature, and it can be expected that one or more of the estimates on which the projections are forecasts were based will not materialize or will vary significantly from actual results and such variations will likely increase over the period of time. All the projections and forecasts described in this report have been prepared solely by authors of this report independently. None of the forecasts were prepared with a view towards compliance with published guidelines or generally accepted accounting principles.
This report should not be construed as an offer to sell or the solicitation of an offer to buy, purchase or subscribe to any securities, and neither this report nor anything contained therein shall form the basis of or be relied upon in connection with any contract or commitment whatsoever. It does not constitute a personal recommendation or take into account the particular investment objective, financial situation or needs of individual clients. The research analysts of INSL have adhered to the code of conduct under Regulation 24 (2) of the Securities and Exchange Board of India (Research Analysts) Regulations, 2014. The recipients of this report must make their own investment decisions, based on their own investment objectives, financial situation or needs and other factors. The recipients should consider and independently evaluate whether it is suitable for its/ his/ her/their particular circumstances and if necessary, seek professional / financial advice as there is substantial risk of loss. INSL does not take any responsibility thereof. Any such recipient shall be responsible for conducting his/her/its/their own investigation and analysis of the information contained or referred to in this report and of evaluating the merits and risks involved in securities forming the subject matter of this report. The price and value of the investment referred to in this report and income from them may go up as well as down, and investors may realize profit/loss on their investments. Past performance is not a guide for future performance. Actual results may differ materially from those set forth in the projection.
Except for the historical information contained herein, statements in this report, which contain words such as ‘will’, ‘would’, etc., and similar expressions or variations of such words may constitute ‘forward‐looking statements’. These forward‐looking statements involve a number of risks, uncertainties and other factors that could cause actual results to differ materially from those suggested by the forward‐looking statements. Forward‐looking statements are not predictions and may be subject to change without notice. INSL undertakes no obligation to update forward‐looking statements to reflect events or circumstances after the date thereof. INSL accepts no liabilities for any loss or damage of any kind arising out of use of this report.
This report has been prepared by INSL based upon the information available in the public domain and other public sources believed to be reliable. Though utmost care has been taken to ensure its accuracy and completeness, no representation or warranty, express or implied is made by INSL that such information is accurate or complete and/or is independently verified. The contents of this report represent the assumptions and projections of INSL and INSL does not guarantee the accuracy or reliability of any projection, assurances or advice made herein. Nothing in this report constitutes investment, legal, accounting and/or tax advice or a representation that any investment or strategy is suitable or appropriate to recipients’ specific circumstances. This report is based / focused on fundamentals of the Company and forward‐looking statements as such, may not match with a report on a company’s technical analysis report. This report may not be followed by any specific event update/ follow‐up.
Following table contains the disclosure of interest in order to adhere to utmost transparency in the matter;
Disclosure of Interest Statement
1 Details of business activity of IndiaNivesh Securities Limited (INSL) INSL is a Stock Broker registered with BSE, NSE and MCX ‐ SX in all the major segments viz. Cash, F & O and CDS segments. INSL is also a Depository Participant and registered with both Depository viz. CDSL and NSDL. Further, INSL is a Registered Portfolio Manager and is registered with SEBI.
2 Details of Disciplinary History of INSL No disciplinary action is / was running / initiated against INSL
3 Research analyst or INSL or its relatives'/associates' financial interest in the subject company and nature of such financial interest
No (except to the extent of shares held by Research analyst or INSL or its relatives'/associates')
4 Whether Research analyst or INSL or its relatives'/associates' is holding the securities of the subject company
No
5 Research analyst or INSL or its relatives'/associates' actual/beneficial ownership of 1% or more in securities of the subject company, at the end of the month immediately preceding the date of publication of the document.
No
6 Research analyst or INSL or its relatives'/associates' any other material conflict of interest at the time of publication of the document
No
7 Has research analyst or INSL or its associates received any compensation from the subject company in the past 12 months
No
8 Has research analyst or INSL or its associates managed or co‐managed public offering of securities for the subject company in the past 12 months
No
9 Has research analyst or INSL or its associates received any compensation for investment banking or merchant banking or brokerage services from the subject company in the past 12 months
No
10 Has research analyst or INSL or its associates received any compensation for products or services other than investment banking or merchant banking or brokerage services from the subject company in the past 12 months
No
11 Has research analyst or INSL or its associates received any compensation or other benefits from the subject company or third party in connection with the document.
No
12 Has research analyst served as an officer, director or employee of the subject company No
13 Has research analyst or INSL engaged in market making activity for the subject company No
14 Other disclosures No
INSL, its affiliates, directors, its proprietary trading and investment businesses may, from time to time, make investment decisions that are inconsistent with or contradictory to the recommendations expressed herein. The views contained in this document are those of the analyst, and the company may or may not subscribe to all the views expressed within. This information is subject to change, as per applicable law, without any prior notice. INSL reserves the right to make modifications and alternations to this statement, as may be required, from time to time.
Definitions of ratings
BUY. We expect this stock to deliver more than 15% returns over the next 12 months.
HOLD. We expect this stock to deliver ‐15% to +15% returns over the next 12 months.
SELL. We expect this stock to deliver <‐15% returns over the next 12 months.
Our target prices are on a 12‐month horizon basis.
Other definitions
NR = Not Rated. The investment rating and target price, if any, have been arrived at due to certain circumstances not in control of INSL
CS = Coverage Suspended. INSL has suspended coverage of this company.
UR=Under Review. Such e invest review happens when any developments have already occurred or likely to occur in target company & INSL analyst is waiting for some more information to draw conclusion on rating/target.
NA = Not Available or Not Applicable. The information is not available for display or is not applicable.
NM = Not Meaningful. The information is not meaningful and is therefore excluded.
Research Analyst has not served as an officer, director or employee of Subject Company
One year Price history of the daily closing price of the securities covered in this note is available at www.nseindia.com and www.economictimes.indiatimes.com/markets/stocks/stock‐quotes. (Choose name of company in the list browse companies and select 1 year in icon YTD in the price chart)
IndiaNivesh Securities Limited
Research Analyst SEBI Registration No. INH000000511
601 & 602, Sukh Sagar, N. S. Patkar Marg, Girgaum Chowpatty, Mumbai 400 007.
Tel: (022) 66188800 / Fax: (022) 66188899 e‐mail: [email protected] | Website: www.indianivesh.in