nitin spinners ltd initiating coverage - rakesh...
TRANSCRIPT
Awanish Chandra e-mail: [email protected] +91 22 22721083
Nitin Spinners Ltd
Initiating Coverage
Nitin Spinners Ltd
Initiating Coverage
Nitin Spinners Ltd
Initiating Coverage
Nitin Spinners Ltd
Initiating Coverage

Initiating Coverage || Textile
June 13, 2016
2
Contents
Nitin Spinners Limited: Spinning Profits ................................................................................................................... 3
Nitin Spinners – Key Milestones ............................................................................................................................... 4
Business Segments .................................................................................................................................................... 5
Product Overview ....................................................................................................................................................... 5
NSL Strengths ............................................................................................................................................................ 6
Growth Drivers ........................................................................................................................................................... 9
Richer Product Mix will Help Margin Improvement Going Forward ....................................................................... 11
For Nitin - It’s Not Just About TUFs and Incentives ................................................................................................. 11
Successful Exit from CDR Reaffirms Management's Credibility ............................................................................. 12
Senior Management with Rich Experience ............................................................................................................. 12
Outlook ..................................................................................................................................................................... 13
Valuation ................................................................................................................................................................... 13
Peer Comparison – Financial Parameters ............................................................................................................... 14
Peer Comparison – Overall ....................................................................................................................................... 15
Financial Statement (Consolidated) ....................................................................................................................... 16
Indian Cotton Textile Industry Overview ................................................................................................................ 18

Initiating Coverage || Textile
June 13, 2016
3
Nitin Spinners Limited
Spinning Profits
Buy TP: Rs. 155
CMP: Rs. 64.5Potential Upside: 140%
Awanish Chandra+91 22 22721083e-mail: [email protected]
Stock Data
CMP 64.5
Mcap (Rs Mn) 2,958.6
Avg Vol (6M) ’000 185.7
FV 10.0
Beta 1.3
52 week H/L 107.3 / 48.9
Bloomberg/ Reuters NSPL IN / NISP.BO
Group B / S&P BSE SmallCap
Year FY14 FY15 FY16
Promoter 63.74 64.01 64.21
Public 35.40 35.9 35.65
FII -- -- 0.13
DII 0.86 0.09 0.01
ABS% 3M 6M 1Yr
Nitin 13.7 7.9 10.7
Sensex 7.9 6.9 1.1
Nitin Spinners Ltd. (NSL), is a Rajasthan based manufacturer of 100% cotton yarn and knitted
fabrics. The company was incorporated in 1992 and commenced production in 1993 with a
small open-end facility and since then it has become one of the leading cotton yarn
producers in India. Nitin has an installed capacity of 150,096 spindles, 2,936 rotors and 49
knitting machines, which can produce 37,800 tonnes of cotton yarn and 8,600 tonnes of
knitted fabric per annum. The company’s sales, EBITDA and adjusted PAT have grown at a
CAGR of 13.3%, 12.6% and 16.4% respectively during FY11-FY16. During FY16, the company’s
total revenues stood at Rs 7,669 Mn (Cotton yarn – 77%, knitting – 19%, other sources such
as trading, waste and job works – 4%). Nitin generated 69% of its revenues from exports
and enjoys presence in more than 40 countries across the globe. Domestic revenues
contributed 31% and NSL has marquee clients like Arvind, Siyaram, Raymond, D'décor,
Donear, etc.
Investment Rationale:
• Pedigreed, Prudent and Visionary Promoters – NSL is promoted by Mr. R. L. Nolkha
who has spent around 25 years in the Industry before setting up NSL. Over the last 25
years, the Nolkha family has grown the business very efficiently and have successfully
navigated the challenges and threats. NSL’s expansions have been prudently planned
in order to keep gearing in check and the management has consciously capped the
interest cost to sales at 5%. The management’s long term vision is to reach half a
million spindles of yarn capacity. As a part of forward integration, the company also
plans to enter fabric processing and value added products which will boost
profitability.
• Healthy returns – The company has been successful in maintaining best among the
industry operating metrices resulting in a healthy RoAE (FY16 – 23.7%, FY15 – 27.4%)
and RoACE (FY16 – 17.7%, FY15 – 16.7%) consistently during past couple of years. We
believe that NSL will further enhance return ratios on account of richer product mix.
• Well timed capacity expansion – NSL timed its capacity expansion very well by
doubling capacity in 2014 to 150,096 spindles which helped it capture the textile up
cycle. The company’s yarn utilization level has already reached 100% and NSL is adding
another ~73,000 spindles by March 2017. These expansions would give a big boost to
earnings.
• Attractive valuations – NSL is trading at 4.4x FY18E earnings which is very cheap
considering the many merits and strengths. We initiate coverage with a buy rating
and a TP of Rs 155.
Key Risks:
• Commodity risk – The company is a 100% cotton yarn manufacturing company and
cotton is its major raw material (60% of sales). Significant change in cotton prices
may affect margins.
Source: Company, EISEC Research
Year Revenue (Rs Mn) EBIDTA margin (%) PAT (Rs Mn) EPS PE PBV EV/EBIDTA ROCE % ROE %
FY14 4,883 19.2% 348 7.6 8.4 2.2 6.9 22.5% 29.9%
FY15 6,165 16.1% 410 8.9 7.2 1.8 6.5 16.7% 27.4%
FY16 7,669 17.9% 442 9.6 6.6 1.4 4.7 17.7% 23.7%
FY17E 7,926 17.5% 516 11.3 5.7 1.2 4.7 14.1% 22.6%
FY18E 10,477 18.9% 674 14.7 4.4 1.0 3.3 17.3% 24.1%

Initiating Coverage || Textile
June 13, 2016
4
Nitin Spinners – Key Milestones
The company is based out of Hamirgarh, a taluka in Bhilwara district of Rajasthan. The company
was registered as a 100% Export Oriented Unit (EOU) earlier. However, with the withdrawal of
several incentive schemes for EOUs, the company converted itself to a DTA (Domestic Tariff Area)
unit. Currently, the company operates from a single location on ~70 acres of land.
• 1992 – Incorporated as a private limited company on 15th October, 1992.
• 1993 – Commenced operations with 384 rotors i.e. open end spinning.
• 1994 – Became a public limited company.
• 1995 – Entered automated open end spinning and completed first expansion adding 216
rotors. Total capacity increased to 600 rotors.
• 1997 – Completed second expansion adding 480 rotors. Total capacity increased to 1,080
rotors.
• 1998 – Completed third expansion adding 384 rotors. Total capacity increased to 1,464 rotors.
• 1999 – Achieved 100% EOU Status. Government recognized export house.
• 2002 – Completed fourth expansion. Enters into ring spinning and undertakes forward
integration into knitted fabrics. Total installed capacity – 14,112 spindles, 1,464 rotors and 7
knitting machines.
• 2004 – Completed fifth expansion. Added 13,104 spindles and 6 knitting machines. Total
installed capacity – 27,216 spindles, 1,464 rotors and 13 knitting machines.
• 2005 – Completed sixth expansion. Adds 408 rotors spindles and 2 knitting machines. Total
installed capacity – 27,216 spindles, 1,872 rotors and 15 knitting machines.
• 2006 – Raised Rs 490 Mn via IPO. Gets listed on BSE and NSE.
• 2007 – Completed seventh expansion. Adds 50,400 spindles and 12 knitting machines. Total
capacity – 77,616 spindles, 1,896 rotors and 27 knitting machines.
• 2008 – Completed eight expansion. Adds 2,000 rotors. Total installed capacity – 77,616
spindles, 3,896 rotors and 27 knitting machines. Completed installation of 10.5 MW coal
fired power plant for captive consumption.
• 2009 – Company entered the Corporate Debt Restructuring (CDR) mechanism.
• 2013 – Company exits the Corporate Debt Restructuring (CDR) mechanism.
• 2015 – Completed ninth expansion. Adds 72,480 spindles and 18 knitting machines. Total
installed capacity – 150,096 spindles, 2,936 rotors and 49 knitting machines.
• 2016 – Announced tenth expansion. To add 72,960 spindles by FY17.
Spinning Facility Floor
Knitting Facility Floor

Initiating Coverage || Textile
June 13, 2016
5
Business Segments
The company’s business is spilt into 2 segments – yarn and knitted fabrics.
• Yarn – The company started as a 100% coarse cotton yarn producer and subsequently
ventured into ring spinning by installing spindles to produce combed and carded cotton
yarns. At present the company has a total installed capacity of 150,096 spindles and 2,936
rotors, which can produce 37,800 tonnes per annum. Yarn business accounts for 77% of
NSL's Sales.
• Knitted fabrics – As part of its forward integration programme, the company diversified
into knitted fabrics. At present, the company has an installed capacity of 49 knitting machines
producing 8,600 tonnes of fabrics per annum and accounts for 19% of NSL’s Sales.
Revenues (Rs Mn)
Source: Company, EISEC Research
Product Overview
Yarn offerings Fabric offerings
Open end yarns from Ne 5/1 to Ne 24/1 Single jersey
Multifold open end yarn Pique structures
Ring spun combed yarn from Ne 12/1 to Ne 50/1 Interlock structures
Multifold ring spun yarn Rib structures
‘S’ and ‘Z’ twist yarn Three thread fleece
Dyeable cheese cones Stretch fabrics
100% organic cotton yarns and blends
Compact yarn
Fancy slub yarn
BCI and TBC cotton yarn
Contamination free yarn from Australian and US cotton
Core spun yarn
Siro yarns
Yarn
Knitted Fabric
82% 83% 82% 80% 75% 77% 75% 78%
14% 10% 10% 14% 19% 19% 19% 15%
4% 7% 8% 6% 6% 4% 6% 7%
0%
25%
50%
75%
100%
FY11 FY12 FY13 FY14 FY15 FY16 FY17E FY18E
Yarn Knitted facbric Others
4,109 4,283 4,461 4,883 6,165 7,669 7,926 10,477
Note: Others represents revenue from Trading, Waste and Job works.

Initiating Coverage || Textile
June 13, 2016
6
NSL Strengths – 1 -> Power
• Spinning is a power intensive business and consumes ~3.3 to 3.9 unit of electricity for each
kg of yarn produced while fabric consumes another 0.3 to 0.5 unit of electricity per kg.
• The company operates in Rajasthan, which is self sufficient in power.
• The company has a captive 10.5 MW coal fired power plant, which is sufficient to meet half
of its current power requirements.
• With the introduction of Energy Exchanges, the company has been able to meet its power
requirements at much cheaper rates as compared to producing power from its captive coal
power plant. Hence, the reliance on power from captive has reduced.
NSL Strengths – 2 -> Proximity to Textile Hub
• NSL’s plant is located ~16 kms away from Bhilwara District in Rajasthan, which is one of the
textile hubs of the country. This proximity ensures ample availability of skilled and unskilled
manpower as well as timely availability of cotton.
• The company procures ~60% of its cotton from surrounding areas like Bhilwara, Bijaynagar,
Asind within Rajasthan itself. Of the balance, ~30% is procured from Gujarat, Maharashtra,
Madhya Pradesh and other states while ~10% is imported from the US, Greece, Australia and
other countries.
Source: Company, EISEC ResearchNote: FO Stands for Furnace Oil
• With declining thermal coal prices, NSL has the option of increasing the share of captive
power if that becomes cost effective.
• In order to further diversify its energy sourcing, the company has installed solar panels
(based on OPEX model) on the roof tops of factory shed which can generate 300kw of
power. The capacity will further be increased to add another 2,000 KW and reach a total
capacity of 2,300 KW.
• NSL’s diversified sourcing of power is a key strength as power is a crucial input for the
spinning business.
Power Cost/unit (Rs) Purchase vs Captive
6.0
4.6 4.25.0
4.3
5.1 5.4 5.0 5.2
7.7
10.511.3
0
3
6
9
12
FY11 FY12 FY13 FY14 FY15
Purchased Coal (Captive) FO (Captive)
5%
47%
66%81%
100% 95%
53%
34%19%
0%
25%
50%
75%
100%
FY11 FY12 FY13 FY14 FY15
Purchased Captive

Initiating Coverage || Textile
June 13, 2016
7
NSL Strengths – 3 -> Diverse Customer Base• Exports contribute 69% of the company’s topline. The company has presences in more than
40 countries across the globe including the European Union, North America, Latin America,
Middle East, China and other Far East Asian countries with no particular economic bloc
accounting for more than 25% of its revenue.
• Domestic revenues contribute 31% and its clientele include marquee names like Arvind,
Siyaram, Raymond, D'décor, Donear, etc. In the long run, the company plans to reduce its
exposure to the international markets to ~50% to have an equally balanced revenue profile.
Domestic vs Export
Source: Company, EISEC Research
NSL Strengths – 4 -> Well Positioned to Increase Cotton Spread• NSL is putting a conscious effort to position itself as a premium yarn manufacturer in order
to move up the value chain.
• NSL’s capacity expansion will increase the share of finer yarns to ~27% from existing ~12%.
This will generate higher spread for NSL as finer yarns generate ~30% higher spread as
compared to regular compact and coarse yarns.
• Better product mix coupled with efficient cotton procurement will lead to higher spreads
going forward.
• The ability and experience to sell its products in local as well as global markets gives NSL
enough cushion to handle demand supply mismatches and economic volatility.
• The company is effectively using its diversified customer base to market its fabric which
will help grow the knitting business.
Major Export Destinations
25.0%
20.0%
15.0%
10.0%
8.0%
6.0%
16.0%
EU China/HK
Bangladesh Sri Lanka
Africa North America
Others
Source: Company, EISEC Research
Average spreads earned (Rs/Kg)
70.4% 70.5% 76.4%68.0% 63.6% 69.0%
29.6% 29.5% 23.6%32.0% 36.4% 31.0%
0%
25%
50%
75%
100%
2011 2012 2013 2014 2015 2016
Export Domestic
61.9
51.9
75.4 78.4
68.3 69.5 69.075.0
-
20
40
60
80
FY11 FY12 FY13 FY14 FY15 FY16 FY17E FY18E
Sudden jump was dueto high China exports
Initiating Coverage || Textile
June 13, 2016
8
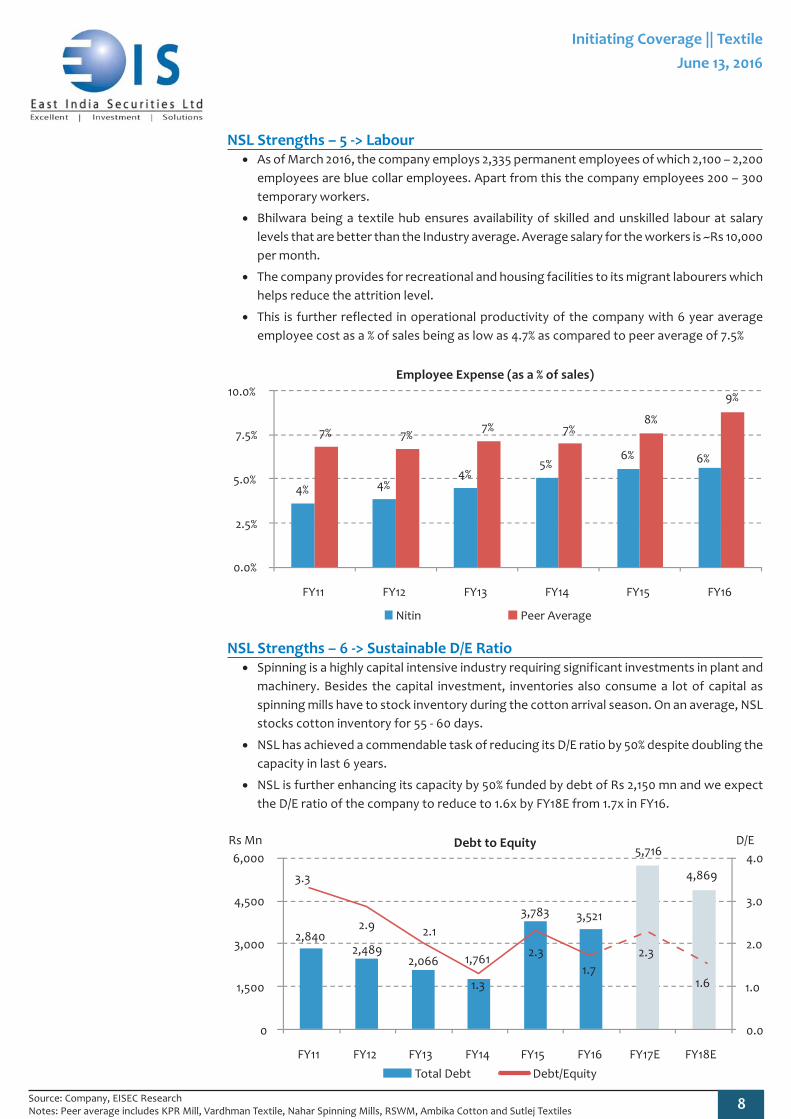
NSL Strengths – 5 -> Labour• As of March 2016, the company employs 2,335 permanent employees of which 2,100 – 2,200
employees are blue collar employees. Apart from this the company employees 200 – 300
temporary workers.
• Bhilwara being a textile hub ensures availability of skilled and unskilled labour at salary
levels that are better than the Industry average. Average salary for the workers is ~Rs 10,000
per month.
• The company provides for recreational and housing facilities to its migrant labourers which
helps reduce the attrition level.
• This is further reflected in operational productivity of the company with 6 year average
employee cost as a % of sales being as low as 4.7% as compared to peer average of 7.5%
Employee Expense (as a % of sales)
Source: Company, EISEC ResearchNotes: Peer average includes KPR Mill, Vardhman Textile, Nahar Spinning Mills, RSWM, Ambika Cotton and Sutlej Textiles
4% 4%4%
5%6% 6%
7% 7%7% 7%
8%
9%
0.0%
2.5%
5.0%
7.5%
10.0%
FY11 FY12 FY13 FY14 FY15 FY16
Nitin Peer Average
2,8402,489
2,066 1,761
3,783
5,716
3,521
4,8693.3
2.9
1.3
2.3
1.7
2.1
2.3
1.6
0.0
1.0
2.0
3.0
4.0
0
1,500
3,000
4,500
6,000
FY11 FY12 FY13 FY14 FY15 FY16 FY17E FY18E
D/ERs Mn
Total Debt Debt/Equity
NSL Strengths – 6 -> Sustainable D/E Ratio• Spinning is a highly capital intensive industry requiring significant investments in plant and
machinery. Besides the capital investment, inventories also consume a lot of capital as
spinning mills have to stock inventory during the cotton arrival season. On an average, NSL
stocks cotton inventory for 55 - 60 days.
• NSL has achieved a commendable task of reducing its D/E ratio by 50% despite doubling the
capacity in last 6 years.
• NSL is further enhancing its capacity by 50% funded by debt of Rs 2,150 mn and we expect
the D/E ratio of the company to reduce to 1.6x by FY18E from 1.7x in FY16.
Debt to Equity

Initiating Coverage || Textile
June 13, 2016
9
Growth Driver 1 – Capacity Expansion
• The company has been expanding its capacity on a regular basis. In 2014, the company
doubled its capacity from 77,616 spindles to 150,096 spindles with a capex of Rs 2,810 mn.
The company also increased its knitting capacity by increasing the number of knitting
machines to 49 from 31.
• The company is undertaking Rs 2,900 mn capex to add another 73,000 spindles and reach a
total capacity of 223,096 spindles. The project is expected to come on stream by March
2017.
• Capacity utilisation of the spinning business has always been above the optimum level of
90% and provides further headroom for growth. The company aspires to reach capacity of
half a million spindles.
Spindles
Yarn Capacity Knitting Capacity
77,616
150,096
223,096
0
60,000
120,000
180,000
240,000
FY11 FY12 FY13 FY14 FY15 FY16 FY17E FY18E
No of Spindles
3,900
8,600
0
2,500
5,000
7,500
10,000
FY11 FY12 FY13 FY14 FY15 FY16 FY17E FY18E
Tons per annum
Yarn Capacity Utilisation Knitting Capacity Utilisation
95.2%90.6% 93.5% 94.0%
76.7%
100.5% 98.4% 96.6%
0%
30%
60%
90%
120%
FY11 FY12 FY13 FY14 FY15 FY16 FY17E FY18E
70.5%
45.4%49.6%
69.4%59.7%
75.6%80.0% 80.0%
0%
25%
50%
75%
100%
FY11 FY12 FY13 FY14 FY15 FY16 FY17E FY18E
• Drop in 2015 utilisation levels in FY15 is due to expansion in the yarn as well as the knitting
segment which came on-stream in 4QFY15.
• In FY17 and FY18 also we are projecting a slight dip in the overall utilisation levels due to
addition in capacity.
• In the knitting segment, we expect the company to move towards optimum utilisation of
80% by FY17.
Source: Company, EISEC Research
Initiating Coverage || Textile
June 13, 2016
10
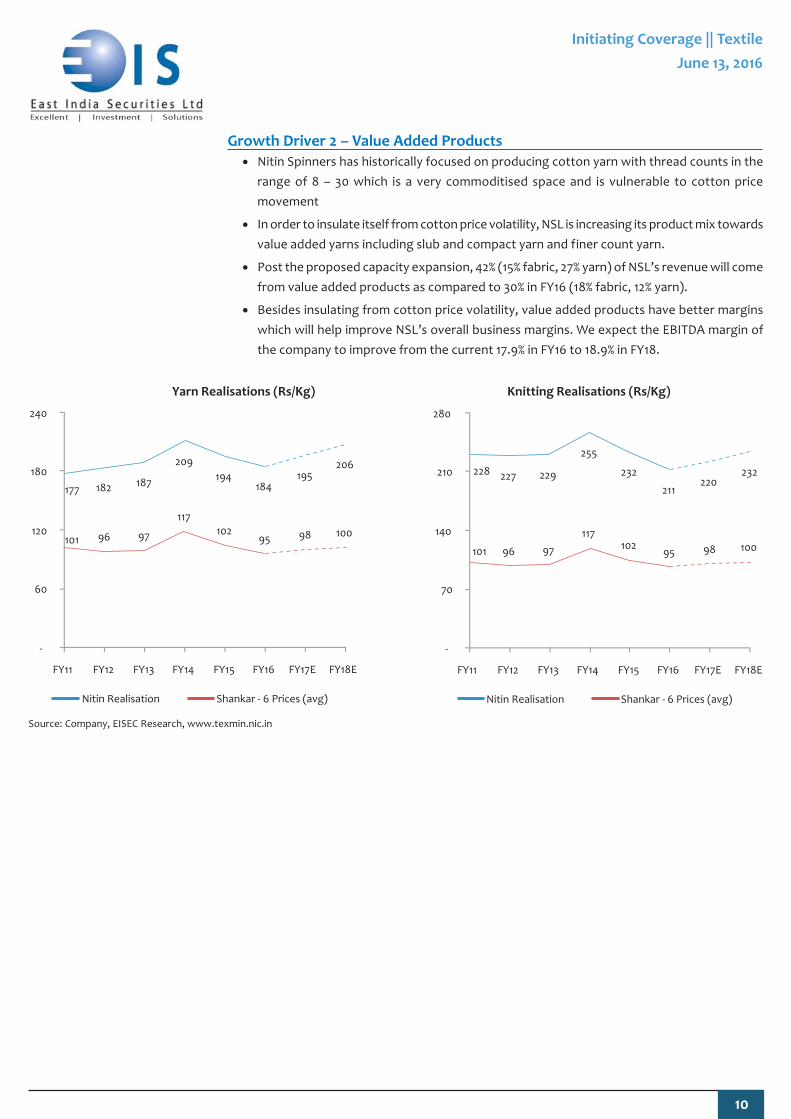
Growth Driver 2 – Value Added Products
• Nitin Spinners has historically focused on producing cotton yarn with thread counts in the
range of 8 – 30 which is a very commoditised space and is vulnerable to cotton price
movement
• In order to insulate itself from cotton price volatility, NSL is increasing its product mix towards
value added yarns including slub and compact yarn and finer count yarn.
• Post the proposed capacity expansion, 42% (15% fabric, 27% yarn) of NSL’s revenue will come
from value added products as compared to 30% in FY16 (18% fabric, 12% yarn).
• Besides insulating from cotton price volatility, value added products have better margins
which will help improve NSL’s overall business margins. We expect the EBITDA margin of
the company to improve from the current 17.9% in FY16 to 18.9% in FY18.
Yarn Realisations (Rs/Kg) Knitting Realisations (Rs/Kg)
Source: Company, EISEC Research, www.texmin.nic.in
177 182 187
209
194184
195206
101 96 97
117102
95 98 100
-
60
120
180
240
FY11 FY12 FY13 FY14 FY15 FY16 FY17E FY18E
Nitin Realisation Shankar - 6 Prices (avg)
228 227 229
255
232
211220
232
101 96 97
117102
95 98 100
-
70
140
210
280
FY11 FY12 FY13 FY14 FY15 FY16 FY17E FY18E
Nitin Realisation Shankar - 6 Prices (avg)

Initiating Coverage || Textile
June 13, 2016
11
Richer Product Mix will Help Margin Improvement Going Forward
• With the capacity expansion which was completed in FY15 and the upcoming capacity
expansion which is expected be to on-stream by March 2017, NSL is consciously shifting its
positioning from a commodity player to speciality player by tilting the product mix towards
value added yarns.
• We expect this is going to improve the EBITDA margin of the company from the current
17.9% in FY16 to 18.9% in FY18.
Operating cost heads (as a % of sales)
For Nitin - It’s Not Just About TUFs and Incentives
• Many textile units exist and survive merely due to the incentives offered by central and
state governments and are quite vulnerable to change in the said government policies.
• While Nitin also avails benefit of TUF, Rajasthan Investment Promotion Scheme (RIPS), the
management is fully geared to survive and thrive in a subsidy less scenario.
• The management of the company adheres to a very strict policy of capping their interest
cost to 5% of sales. So instead of depending on subsidised credit, NSL wants to cap its
dependence on debt itself.
• NSL management is clear that its expansion plans will not be based on the incentives made
available by the government but its interest capping policy.
• Excluding incentives, the company would still be able to manage a healthy RoAE of 18.2%
and RoACE of 15.4% over the next 2 years on average.
Interest cost as a % of sales
Source: Company, EISEC Research
61% 69%59% 61% 62% 60% 61% 59%
4%4%
4% 5% 6% 6% 6% 6%9%
9%9% 7% 8% 8% 9% 9%
8%7%
8% 8% 8% 8% 8% 8%
18%11%
20% 19% 16% 18% 17% 19%
0%
25%
50%
75%
100%
FY11 FY12 FY13 FY14 FY15 FY16 FY17E FY18E
Raw Material Cost Power, Fuel & Water charges Employee Benefits Expenses
Other ExpensesEBITDA Margin
Source: Company, EISEC Research
5.1% 4.9%
6.1%
3.6% 3.7%4.3%
3.8% 3.7%
0%
2%
4%
6%
8%
FY11 FY12 FY13 FY14 FY15 FY16 FY17E FY18E
Initiating Coverage || Textile
June 13, 2016
12
Successful Exit from CDR Reaffirms Management's Credibility
• The Company went through Corporate Debt Restructuring (CDR) mechanism in March 2009
due to forex losses and adverse business scenario in 2007-08.
• The company is one of the very few companies to have successfully exited the CDR
mechanism. The CDR exit process was completed in July 2012 by paying the recompense
amount of Rs 165.4 Mn.
• This turnaround was achieved in a short period of three and half years and is one of the
shortest turnaround in the history of CDR mechanism.
Senior Management with Rich Experience
• Mr. R. L. Nolkha, Chairman and Managing Director: Sh. R. L. Nolkha aged 69 years is one of
the key promoters of the Company. He is the Director of the Company since its incorporation
and is a member of all three pioneer institutions i.e. Institute of Chartered Accountants
(ICAI), Institute of Company Secretary of India (ICSI) and Institute of Cost Accountants of
India. He has vast experience of more than four decades in the Textile Industry. He was
earlier associated with Surya Roshni Ltd., RSWM Ltd. and BSL Ltd. at senior positions. He
was the Managing Director of BSL Ltd. for eight years before joining Nitin Spinners Ltd. as
a Whole-Time Director in the year 1997. He is a member of various Chamber/Organizations
relating to trade and industry and presently he is the Chairman of Rajasthan Textile Mills
Association. He was the Chairman of North India Textile Research Association (NITRA) and
Mewar Chamber of Commerce and Industries. He received the prestigious Udyog Patra in
2003.
• Mr. Dinesh Nolkha, Managing Director: Mr. Dinesh Nolkha, aged 44 years is a Chartered
Accountant and Cost and Works Accountant by qualification. He is the elder son of Mr. R. L.
Nolkha and is currently the Managing Director of the Company and on the Board since the
inception. He has been involved in setting-up all the projects of the Company and managing
day-to-day operations. He is also the Vice President of Mewar Chamber of Commerce and
Industry.
• Mr. Nitin Nolkha, Executive Director: Mr. Nitin Nolkha, aged 39 years is a Bachelor of
Commerce and Master of Business Administration (MBA). He has more than seventeen
years of experience in the textile industry. His functional experience covers Plant Operations,
Procurement/Sourcing, Administration and Management.
• Mr. P. Maheshwari, Vice President (Finance) and CFO: Mr. Maheshwari, aged 54 is a Bachelor
of Commerce (Honours) and a Chartered Accountant. He has more than 3 decades of
experience in the textile industry. He is associated with Nitin Spinners Ltd. from 2006 and is
currently the Vice President (Finance) and CFO. Before joining Nitin Spinners, he was the
Vice President (Finance) at BSL Ltd., a LNJ group company, where he served for 20 years.
Average vintage of top 10 professional managers within the company is 15 years.

Initiating Coverage || Textile
June 13, 2016
13
Outlook
• Nitin Spinners is a very well run and managed company with the promoter family fully
involved in the business with complete focus and commitment.
• The promoters have built the business from scratch with extreme prudence and vision which
is amply reflected in the fact that:
They have been constantly increasing the capacity without increasing the leverage
All the expansions have been well timed and the product mix is gradually moving up
the value chain
NSL has best in the Industry operational and financial ratios and has been growing
at better than Industry average
NSL’s business being exposed to commodity as well as currency volatility, the
promoters have put in robust risk management policies particularly after learning
from the past experience with currency losses in 2007-08
• Going by their past track record, NSL is all poised to grow its yarn capacity to 500,000
spindles providing an excellent opportunity for equity investors to participate in NSL’s
growth story.
Valuation
• Based on FY16 reported earnings, NSL trades at:
P/E multiple – 6.7x
P/B – 1.4x
Price to Sales – 0.39x
• Based on our projected numbers for FY18, NSL trades at:
P/E Multiple – 4.4x
P/B – 1.0x
Price to Sales – 0.28x
• The company has consistently made a healthy RoAE and RoACE in the past 4 years. For
FY16, its RoAE stood at 23.7% while RoACE stood at 17.7%.
• We expect the company’s sales and PAT to increase at a CAGR of 16.9% and 23.5% respectively
during FY16-FY18E with improvement in return ratios.
• NSL’s strong fundamentals and robust growth prospects coupled with margin expansion
gives us confidence that NSL will see a very strong earnings growth which could be coupled
with an expansion in the PE ratio. We initiate coverage with a buy rating and a price target
of Rs 155 (10.5x FY18E EPS) implying an upside of 140% from CMP.
1 year forward PE band chart
11.0x
9.0x
7.0x
5.0x
3.0x
0
20
40
60
80
100
120
140
Apr -10 Dec -10 Aug -11 Apr -12 Dec -12 Sep -13 May -14 Jan -15 Sep -15 May -16
NSL Share price (Rs)

Initiating Coverage || Textile
June 13, 2016
14
Peer Comparison – Financial Parameters
Strong operational efficiency
• The company’s EBITDA has grown from Rs 758.1 Mn in 2011 to Rs 1,370.4 Mn in 2016 implying
a health CAGR of 12.6% as compared to a peer average of 4.5%.
• With increasing revenue share of value added products coupled with other factors such as
lower employee expenses and other manufacturing costs have helped the company to
achieve higher EBITDA margins than its peers.
EBITDA Margins
18%
11%
20% 19%
16%18%
22%
11%
18% 18%
15%16%
0%
6%
12%
18%
24%
FY11 FY12 FY13 FY14 FY15 FY16
Nitin Peer Average
Healthy return ratios – RoE
• Improving profit margins and better asset turnover ratio
have helped the company to achieve and sustain an RoE
level above its peer.
RoE
Healthy return ratios – RoCE
• The company has been consciously reducing its debt levels
and its D/E has reduced from 3.3x in FY11 to 1.7x in FY16.
• This has helped the company to maximise its RoCE and
outperform its peers.
RoCE
25%
0%
25%
30%27%
24%
32%
2%
18%
24%
16%17%
0%
9%
18%
27%
36%
FY11 FY12 FY13 FY14 FY15 FY16
Nitin Peer Average
14%
6%
20%22%
17%18%
16%
5%
14%
17%
13%15%
0%
6%
12%
18%
24%
FY11 FY12 FY13 FY14 FY15 FY16
Nitin Peer Average
Source: Company, EISEC ResearchNotes: Peer average includes KPR Mill, Vardhman Textile, Nahar Spinning Mills, RSWM, Ambika Cotton and Sutlej Textiles

Initiating Coverage || Textile
June 13, 2016
15
All figures in Rs. Mn
Peer Comparison – Overall
• Of the total revenue for Nitin Spinners, yarn business contributes ~77%, knitting contributes
~19% while 4% comes from other sources such as trading, job works, etc.
• There is no like to like comparable peer since business contribution from each line of business
is different for each peer so we have compared Nitin Spinners against a set of textile
companies which are well recognised as strong and well managed companies.
Source: ACE Equity, EISEC Research
• Nitin Spinners EBIDTA margin is 190 bps higher than the average of the above peers. This
signifies good operational efficiency.
• Nitin Spinners D/E is on a higher end and hence its PAT margins are lower by 60 bps as
compared to the average of the above peers.
• Nitin Spinners is able to deploy its capital efficiently and generate higher returns for its
equity holders as it has the best capital efficiency ratios amongst the above peers.
• RoCE is better by 280 bps as compared to the average.
• RoE is higher by 670 as compared to the average.
• Despite the superior margins and return ratios, NSL is trading at 32.5% cheaper P/E multiple
as compared to the average of above peers.
Companies Latest Mcap Net Sales EBITDA Margin (%) PAT Margin (%) ROCE(%) ROE(%) D/E P/BV TTM P/E
Vardhman Textiles 54,203 66,369 21.1% 8.7% 16.6% 16.0% 0.6 1.4 9.4
KPR Mill 35,277 25,004 18.8% 8.4% 17.3% 20.6% 0.7 3.2 16.8
Sutlej Textiles and Industries 9,088 22,267 12.6% 6.4% 15.6% 23.2% 1.0 1.3 6.3
RSWM 8,866 29,547 13.9% 3.6% 15.9% 21.9% 2.0 1.8 8.4
Ambika Cotton Mills 4,816 4,923 18.8% 9.0% 17.4% 14.0% 0.1 1.4 10.8
Nahar Spinning Mills 3,888 20,336 11.0% 2.5% 6.9% 6.4% 1.1 0.5 7.8
Average 16.0% 6.4% 14.9% 17.0% 0.9 1.6 9.9
Median 16.3% 7.4% 16.2% 18.3% 0.9 1.4 8.9
Nitin Spinners 2,959 7,669 17.9% 5.8% 17.7% 23.7% 1.7 1.4 6.7

Initiating Coverage || Textile
June 13, 2016
16
Financial Statement (Consolidated)
Source: Company, EISEC Research
Source: Company, EISEC Research
Balance sheet, Rs Mn FY11 FY12 FY13 FY14 FY15 FY16 FY17E FY18E
Share capital 458 458 458 458 458 458 458 458
Reserves & surplus 405 408 550 857 1,212 1,598 2,045 2,636
Total net worth 864 867 1,008 1,316 1,670 2,056 2,503 3,094
Minority - - - - - - - -
Total debt 2,840 2,489 2,066 1,761 3,783 3,521 5,716 4,869
Deferred tax liabilities - - 66 211 339 433 433 433
Other non-current liabilities 8 11 15 24 43 53 53 53
Other current liabilities 99 106 302 229 264 287 241 266
Total liabilities and equity 3,811 3,473 3,457 3,540 6,099 6,350 8,947 8,715
Gross block 3,726 3,754 3,772 3,787 6,208 6,257 8,892 8,932
Net fixed assets 2,493 2,281 2,130 1,912 4,164 3,818 6,056 5,534
Investments - - - - - - - -
Other non-current assets 24 84 65 367 276 481 469 458
Total current assets 1,294 1,108 1,262 1,261 1,659 2,052 2,300 2,611
Total assets 3,811 3,473 3,457 3,540 6,099 6,350 8,947 8,715
Income statement, Rs Mn FY11 FY12 FY13 FY14 FY15 FY16 FY17E FY18E
Total revenues 4,109 4,283 4,461 4,883 6,165 7,669 7,926 10,477
% growth NA 4.2% 4.1% 9.5% 26.2% 24.4% 3.4% 32.2%
Operating expenses (3,351) (3,833) (3,588) (3,944) (5,173) (6,298) (6,540) (8,499)
EBITDA 758 450 872 939 992 1,370 1,387 1,979
Depreciation (240) (240) (245) (249) (279) (396) (416) (582)
EBIT 518 211 627 691 712 975 971 1,397
Interest (210) (209) (273) (175) (226) (330) (300) (391)
Other income 2 1 3 3 51 7 5 5
Exceptional items (213) - (147) - - - - -
PBT 97 3 210 520 537 652 676 1,010
Tax (29) 0 (68) (172) (128) (210) (160) (337)
PAT 67 3 141 348 410 442 516 674
Adjusted PAT 207 3 238 348 410 442 516 674
Reported EPS 1.5 0.1 3.1 7.6 8.9 9.6 11.3 14.7
% growth NA -95.5% 4,564.2% 146.0% 17.8% 7.8% 16.8% 30.6%

Initiating Coverage || Textile
June 13, 2016
17
Source: Company, EISEC Research
Source: Company, EISEC Research
Source: Company, EISEC Research
Cash flow, Rs Mn FY11 FY12 FY13 FY14 FY15 FY16E FY17E FY18E
PBT 97 3 357 520 537 652 676 1,010
Adjustments 665 449 525 424 514 726 716 973
Chg. W.C. (307) 190 45 35 (495) (302) (294) (287)
OCF 454 642 889 866 445 1,000 937 1,360
Capex (8) (28) (117) (35) (2610) (49) (2635) (40)
Investment - - - - - - - -
CFI 2 -83 -44 -389 -2,194 -360 -2,764 -40
Net debt (246) (351) (423) (305) 2022 (262) 2195 (847)
Net equity - - - - - - - -
Dividend payout - - - - (34) (46) (57) (69)
CFF (456) (560) (843) (480) 1756 (641) 1826 (1320)
Increase/(Decrease) in cash (0) (1) 2 (2) 6 (1) (1) -
Opening cash 1.5 1.4 0.8 2.8 0.6 6.8 5.7 5
Closing cash 1.4 0.8 2.8 0.6 6.8 5.7 5 5
Ratio analysis (%) FY11 FY12 FY13 FY14 FY15 FY16 FY17E FY18E
EBIDTA margin 18.4% 10.5% 19.6% 19.2% 16.1% 17.9% 17.5% 18.9%
PAT margin 5.0% 0.1% 5.3% 7.1% 6.6% 5.8% 6.5% 6.4%
RoAE 24.9% 0.4% 25.4% 29.9% 27.4% 23.7% 22.6% 24.1%
RoACE 13.7% 6.0% 19.5% 22.5% 16.7% 17.7% 14.1% 17.3%
Receivables (days) 31 16 23 19 27 21 22 22
Inventory (days) 89 78 81 69 75 73 75 75
Payable (days) 4 4 5 10 8 8 8 8
Debt to equity 3.3 2.9 2.1 1.3 2.3 1.7 2.3 1.6
Valuation parameters FY11 FY12 FY13 FY14 FY15 FY16 FY17E FY18E
EPS (Rs) 1.5 0.1 3.1 7.6 8.9 9.6 11.3 14.7
P/E (x) 43.5 967.8 20.7 8.4 7.2 6.6 5.7 4.4
EV/ EBIDTA (x) 8.5 14.3 7.4 6.9 6.5 4.7 4.7 3.3
PBV (x) 3.4 3.4 2.9 2.2 1.8 1.4 1.2 1.0

Initiating Coverage || Textile
June 13, 2016
18
Yarn production
• Production of total yarn grew from 5.71 MnT in FY10 to 6.83 MnT in FY16, implying a CAGR of
3.0%.
• Cotton yarn accounts for the largest share in total yarn production. Cotton yarn’s production
CAGR during the same period has grown at 5.0% as compared to other spun yarn at 5.4%
while man-made fibre has experienced de-growth of 4.4%. Also, cotton yarn’s share in total
yarn production has been increasing constantly from ~54% in FY10 to ~61% in FY16.
Yarn production (Mn T)
Indian Cotton Textile Industry Overview
Cotton Scenario in India
• Cotton is the most important raw material required for the production of textile products
like yarn, fabric and garments. Cotton costs accounts for almost 55 - 60% the company's
total revenue.
• Cotton is a seasonal commodity and procuring it at the right time and price is crucial for a
spinning company as this directly impacts the operating margins.
• Cotton arrival in India starts from the month of October. About 75% of the total crop arrives
in the market during 5 months of November to March. This makes it necessary for spinning
mills to buy and stock cotton during the peak arrival season or face price fluctuation and
quality inconsistency later on.
• Shankar 6 is the most widely used cotton in India, well known for its quality worldwide and
is largely produced in Gujarat.
• Production of raw cotton grew from 30.5 Mn bales in Cotton year (CY)10 to 35.2 mn bales in
CY16 which implies a CAGR growth of CAGR of 2.4%.
• During CY16, of the overall amount of raw cotton produced in the country, domestic
consumption was 31 Mn bales while 7 Mn bales were exported.
Cotton Production (Mn Bales)
Source: Company, EISEC Research
54% 56% 54% 57% 59% 60% 61%
19% 20% 21% 21% 21% 21% 22%
27% 25% 25% 22% 20% 19% 17%
0%
25%
50%
75%
100%
FY10 FY11 FY12 FY13 FY14 FY15 FY16
Cotton Yarn Other Spun Yarn Man-made filament yarn
5.71 6.26 5.84 6.24 6.60 6.74 6.83
30.533.9
36.7 37.039.8
38.035.2
-
10
20
30
40
CY10 CY11 CY12 CY13 CY14 CY15 CY16

Initiating Coverage || Textile
June 13, 2016
19
Indian Cotton Textile Industry Overview (cont’d)
Fabric production
• Production of total fabric grew from 60,333 mn sq. mtrs. in FY10 to 65,860 mn sq. mtrs. in
FY16, implying a CAGR of 1.5%.
• Cotton fabric accounts for the largest share in total fabric production. Cotton fabric’s
production CAGR during the same period has grown at 4.9% as compared to blended fabric
at 5.6% while man-made fibre has experienced de-growth of 6.1% and Khadi, wool and silk
has grown by 2.5%. Also, cotton fabric’s share in total fabric production has been increasing
constantly from ~48% in FY10 to ~58% in FY16.
Production of fabric (Mn. Sq. Mtrs.)
Cotton Yarn Exports
• Total Cotton yarn exports have increased from US$ 2,700 mn in FY11 to US$ 3,305 mn in FY
16 (11 month data, April 2015 to February 2016) which implies a CAGR of ~6%.
• Major export destinations include China, Bangladesh, Egypt, Vietnam, South Korea and
others.
Cotton Yarn Exports (US$ Mn)
Source: Company, EISEC Research, www.texmin.nic.inNote: *FY16 data for April 2015 to February 2016
48% 51% 51% 54% 56% 57% 58%
13% 13% 14% 15% 16% 16% 16%
38% 35% 34% 30% 27% 26% 24%
0%
25%
50%
75%
100%
FY10 FY11 FY12 FY13 FY14 FY15 FY16
Cotton Blended Man -Made Fibre Khadi, Wool, Silk
60,333 62,559 60,453 62,792 63,500 65,276 65,860
2,700 2,996
3,548
4,584
3,5903,305
0
1,500
3,000
4,500
6,000
FY11 FY12 FY13 FY14 FY15 FY16*

Initiating Coverage || Textile
June 13, 2016
20
Indian Cotton Textile Industry Overview (cont’d)
Helping hand from the government
Technology Upgradation Fund Scheme (TUFS)
• TUFS was commissioned in 1999 with the objective of modernizing and upgrading the textiles
industry by offering entrepreneurs credit at reduced rates. The scheme was initially approved
from Apr 1999 to Mar 2004, however, it was modified, restructured and rolled over a number
of times.
• Currently, the scheme is known as Amended Technology Upgradation Fund Scheme (ATUFS)
and is valid from Jan 2016 to Mar 2022.
Garmenting, Technical Textiles – 15% Capital Investment Subsidy (CIS), upto Rs. 30
crore
Weaving for brand new Shuttle-less looms, Processing, Jute, Silk and Handloom –
15% Capital Investment Subsidy (CIS), upto Rs. 20 crore
Composite unit /Multiple Segments (more than 50% of the eligible project cost) –
15% Capital Investment Subsidy (CIS), upto Rs. 30 crore
Composite unit /Multiple Segments (Less than 50% of the eligible project cost) – 10%
Capital Investment Subsidy (CIS), upto Rs. 20 crore
• ATUFS benefit is available for the benchmarked machinery under the scheme covering the
following activities:-
Weaving, Weaving Preparatory and knitting
Processing of fibres, yarns, fabrics, garments and made-ups
Technical textiles
Garment/made-up manufacturing
Handloom Sector
Silk Sector
Jute Sector
• Apart from TUFS which is provided by the Government of India, Governments of several
states such as Rajasthan, Gujarat, Maharashtra, Andhra Pradesh, Telangana, Karnataka
and Madhya Pradesh also offer different kinds of incentives like interest subvention, capital
subsidy, tax concession, power assistance etc.
Initiating Coverage || Textile
June 13, 2016
21
Corporate Office : 701, 7th Floor, Ruby Crescent Business Boulevard, Ashok Nagar, Kandivali (East), Mumbai - 400 101. Tel: +91 22 2272 1083Head Office : DA-14, Salt Lake City, Sector-I, Kolkata-700064 Tel: +91 33 40205901
Web: www.eisec.com
Disclosure & DisclaimerEast Indian Securities Ltd (hereinafter referred as 'EISEC') is a financial services firm. The Author does not hold any share in the company/iesdiscussed in this document. EISEC and its associated companies may hold shares in the company/ies discussed in this document.
This document is confidential and is supplied to you for information purposes only. It should not (directly or indirectly) be reproduced, furtherdistributed to any person or published, in whole or in part, for any purpose whatsoever, without the consent of EISEC.
This document is not directed to, or intended for display, downloading, printing, reproducing or for distribution to or use by, any person or entity,who is a citizen or resident or located in any locality, state, country or other jurisdiction, where such distribution, publication, reproduction,availability or use would be contrary to law or regulation or what would subject EISEC to any registration or licensing requirement within suchjurisdiction. If this document is sent or has reached any individual in such country, especially, USA, the same may be ignored.
This document does not constitute a personal recommendation or take into account the particular investment objectives, financial situations, orneeds of individual investors. Our investment recommendations are general in nature and available electronically/in printed form to our clients.Before acting on any advice or recommendation in this document, investors should consider whether it is suitable for their particular circum-stances and, if necessary, seek professional advice. The price and value of the investments referred to in this material and the income from themmay go down as well as up, and investors may realize losses on any investments. Past performance is not a guide for future performance, futurereturns are not guaranteed and a loss of original capital may occur. Information herein is believed to be reliable but EISEC do not warrant itscompleteness or accuracy. The views/opinions expressed are our current opinions as of the date appearing in the material and may be subject tochange from time to time without notice. This document should not be construed as an offer to sell or solicitation of an offer to buy any securityin any jurisdiction. EISEC and its affiliates, its directors, analyst and employees will not be responsible for any loss or liability incurred to any personas a consequence of his or any other person on his behalf taking any investment decisions based on this document.
Stock rating (1 year target scale)
<0% - Sell
0-10% - Reduce
10-30% - Accumulate
>30% - Buy