edelweiss presentation template - rakesh...
TRANSCRIPT

Mid-Cap Marvels
Edelweiss – Ideas create, values protect
January 2016
INDEX
2
I Our Core Investment Philosophy (1 of 2)
II Our Core Investment Philosophy (2 of 2)
III Our preferred stocks with philosophy
IV Mid Cap Marvels Stocks

Our Core Investment Philosophy (1 of 2)
3
Opportunity size
How big the sector can grow (3x, 4x, 5x)
Moat around the business
Differentiated business Model
Sustainable competitive advantage
High barriers to entry
Corporate Governance
Management back ground
Accounting policies
Corporate policies
Business with Related Parties
Strong Management Credentials
Professional management
2nd level of management
One person dependency
Track record of past decisions
Comments v/s deliverable
Investment
Philosophy
Our Core Investment Philosophy (2 of 2)
4
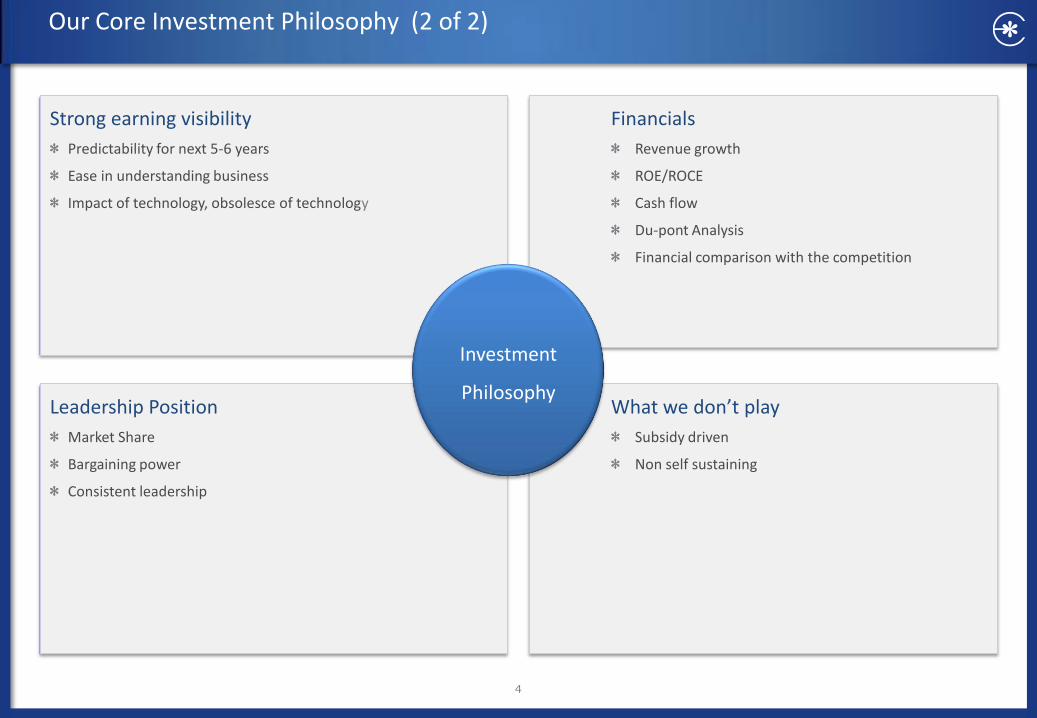
Strong earning visibility
Predictability for next 5-6 years
Ease in understanding business
Impact of technology, obsolesce of technology
Leadership Position
Market Share
Bargaining power
Consistent leadership
Financials
Revenue growth
ROE/ROCE
Cash flow
Du-pont Analysis
Financial comparison with the competition
What we don’t play
Subsidy driven
Non self sustaining
Investment
Philosophy

Our preferred stocks with philosophy
5
Consistency Sustainable Pedigree Profitable
Key Investment Philosophy 5 year revenue growth
>10-15%
Earning Visibility (Sustainable growth in
revenues) Corporate Governance Profitable Growth
NIIT Ltd Cholamandalam Finance Jamna Auto Ltd. Pokarna Ltd. Natco Pharma Indo Count Industries Ltd Siyaram Silk Mills Ltd.

Our Preferred Stocks
6
Ch
ola
man
dal
am
Consistency
Sustainable
Profitable
Pedigree
The company’s net interest income has grown 33% CAGR over last 5 years, with stable margins.
Cholamandalam is leading financer in vehicle segment with 9.8% and 11.8% share in CV and LCV financing business. The company is adding new lines of business like tractor and SME financing
The company has not only shown consistency in profitability. With the revival in Commercial vehicle segment and interest rate peaking out, the profitability is sustainable.
The company is promoted by Murugappa group, a leading business house in India
Ind
o C
ou
nt
Ind
ust
ries
Ltd
Consistency
Sustainable
Profitable
Pedigree
Indo Count Industries Ltd. (ICIL) is a leading manufacturer and exporter of Home Textiles. It is Third largest exporter of bed linen from India, 14th largest Home Textiles supplier to the USA and fourth-largest Bed Sheet exporter to the USA
ICIL exports bed linen on a made-to-order basis, resulting in effective management of the company’s inventory. Currently, ICIL products make up 20% of the top global retailers’ bed linen requirement, making the company a key supplier for top global retailers.
The change in product mix towards high value items supported by a product mix shift towards Home Textiles and a declining contribution of the Consumer Durables segment to Nil by FY17E will lead to improvement in margins.
Our Preferred Stocks
7
Jam
na
Au
to
Consistency
Sustainable
Profitable
Pedigree
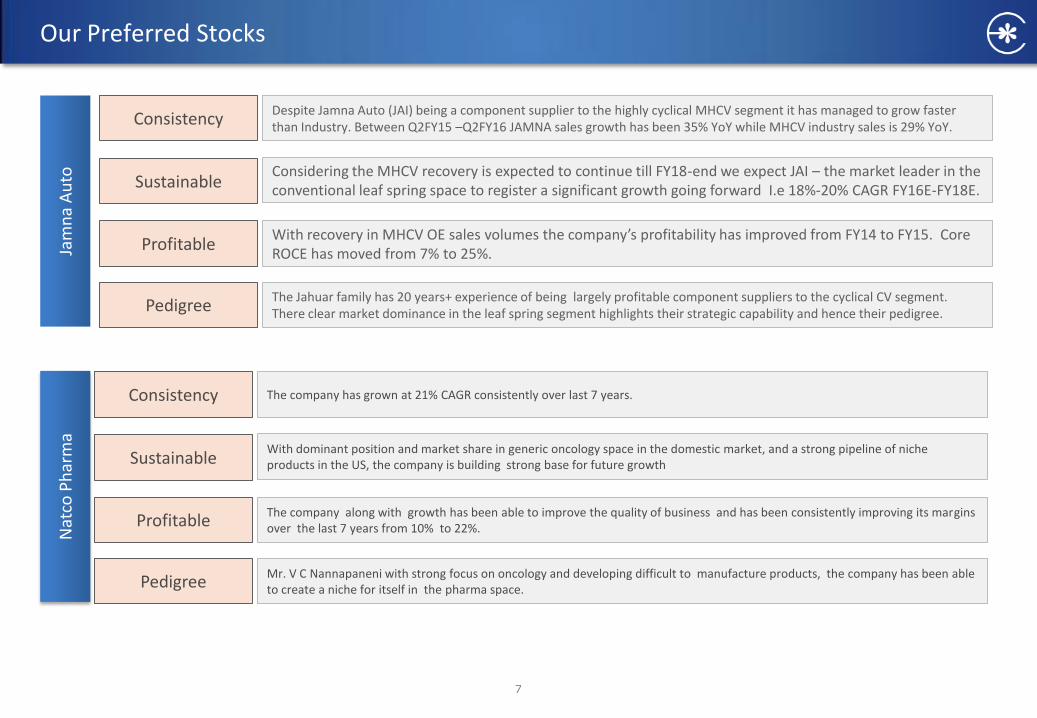
Despite Jamna Auto (JAI) being a component supplier to the highly cyclical MHCV segment it has managed to grow faster than Industry. Between Q2FY15 –Q2FY16 JAMNA sales growth has been 35% YoY while MHCV industry sales is 29% YoY.
Considering the MHCV recovery is expected to continue till FY18-end we expect JAI – the market leader in the conventional leaf spring space to register a significant growth going forward I.e 18%-20% CAGR FY16E-FY18E.
With recovery in MHCV OE sales volumes the company’s profitability has improved from FY14 to FY15. Core ROCE has moved from 7% to 25%.
The Jahuar family has 20 years+ experience of being largely profitable component suppliers to the cyclical CV segment. There clear market dominance in the leaf spring segment highlights their strategic capability and hence their pedigree.
Nat
co P
har
ma
Consistency
Sustainable
Profitable
Pedigree
The company has grown at 21% CAGR consistently over last 7 years.
With dominant position and market share in generic oncology space in the domestic market, and a strong pipeline of niche products in the US, the company is building strong base for future growth
The company along with growth has been able to improve the quality of business and has been consistently improving its margins over the last 7 years from 10% to 22%.
Mr. V C Nannapaneni with strong focus on oncology and developing difficult to manufacture products, the company has been able to create a niche for itself in the pharma space.
Our Preferred Stocks
8
Poka
rna
Ltd
Consistency
Sustainable
Profitable
Pedigree
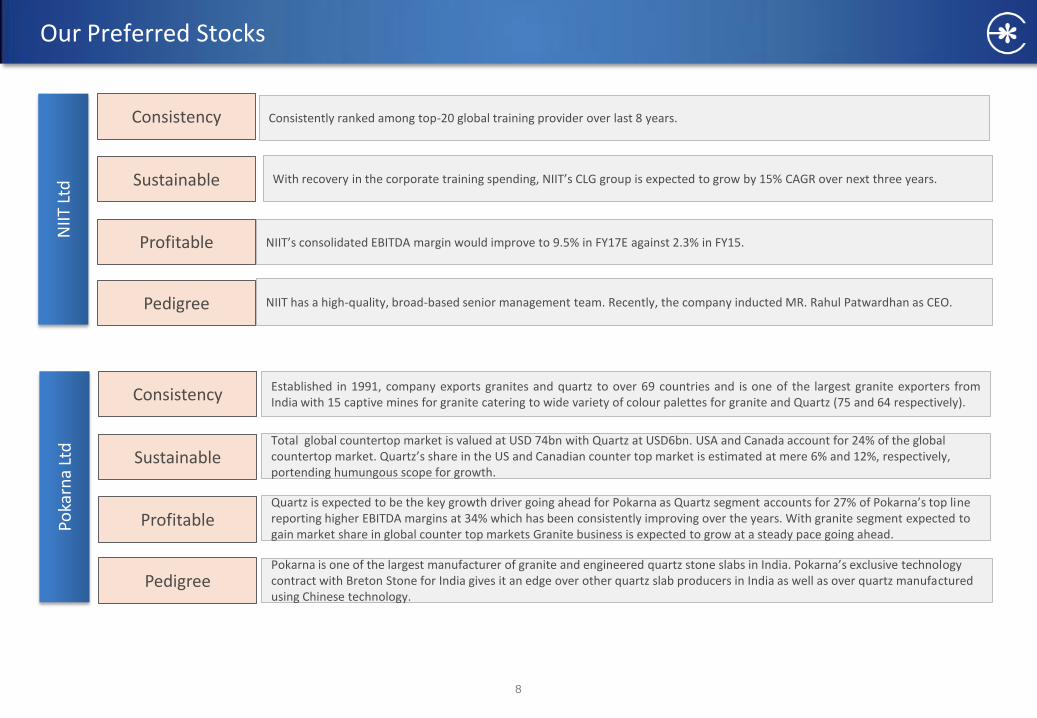
Established in 1991, company exports granites and quartz to over 69 countries and is one of the largest granite exporters from India with 15 captive mines for granite catering to wide variety of colour palettes for granite and Quartz (75 and 64 respectively). Total global countertop market is valued at USD 74bn with Quartz at USD6bn. USA and Canada account for 24% of the global countertop market. Quartz’s share in the US and Canadian counter top market is estimated at mere 6% and 12%, respectively, portending humungous scope for growth. Quartz is expected to be the key growth driver going ahead for Pokarna as Quartz segment accounts for 27% of Pokarna’s top line reporting higher EBITDA margins at 34% which has been consistently improving over the years. With granite segment expected to gain market share in global counter top markets Granite business is expected to grow at a steady pace going ahead. Pokarna is one of the largest manufacturer of granite and engineered quartz stone slabs in India. Pokarna’s exclusive technology contract with Breton Stone for India gives it an edge over other quartz slab producers in India as well as over quartz manufactured using Chinese technology.
NIIT
Ltd
Consistency
Sustainable
Profitable
Pedigree
Consistently ranked among top-20 global training provider over last 8 years.
With recovery in the corporate training spending, NIIT’s CLG group is expected to grow by 15% CAGR over next three years.
NIIT’s consolidated EBITDA margin would improve to 9.5% in FY17E against 2.3% in FY15.
NIIT has a high-quality, broad-based senior management team. Recently, the company inducted MR. Rahul Patwardhan as CEO.

Our Preferred Stocks
9
Siya
ram
Consistency
Sustainable
Profitable
Pedigree
Siyaram is one of the largest and most experienced textile companies in India. The company has grown at a 17% plus CAGR from 2005.
Given the industry growth drivers such as increasing personal disposable income, higher consumer discretionary spend and favorable demographics, a 10-12% growth is sustainable.
The company has consistently maintained PAT margins in excess of 5% since 2010 as higher share of the stable readymade garments(RMG) segment, has reduced earnings volatility.
The company belongs to the Poddar group which includes Balkrishna Industries and Govind Rubber. As the current management is vastly experienced in the family business, it gives Siyaram a very strong foundation.

Edelweiss Mid-Cap Marvels
10
Note: Market CAP (Mkt CAP) and Current Market Price (CMP) were last recorded on 31st December, 2015
S. No. Stock Name CMP Mkt Cap P/E EV/EBITDA ROE (%)
(INR) (INR Crs.) FY16E FY17E FY16E FY17E FY16E FY17E
1. Cholamandalam Finance 642 9,833 18.7 15.7 NM NM 15.7 16.4
2 NIIT Ltd 99 1,581 25.3 16.9 23.0 16.0 1.0 8.0
3. Indo Count Industries Ltd 1101 3,900 15.9 11.8 9.7 7.2 50.2 43.0
4. Jamna Auto Industries Ltd. 140 940 24.0 13.6 9.9 6.6 22.0 32.0
5. Natco Pharma 579 8,977 62.8 19.5 38.2 13.9 14.5 32.2
6. Pokarna Ltd. 991 613 15.0 13.0 8.1 8.9 55.8 40.1
7. Siyaram Silk Mills Ltd. 1221 988 11.0 9.6 7.2 6.4 22.0 20.0

11
Cholamandalam Investment (CMP: INR 642; Mkt Cap: INR 9,833 crs)
Business Overview
Retail finance company, promoted by Murugappa group, with focus on vehicle finance and loan against property
Vehicle finance constitute 69% of AUM and home equity constitute 29% of AUM
Within vehicle finance, the focus is on small road transport operators
Within home equity, 89% of loan is against self occupied residential property.
Company has 534 branches (90% in Tier II, Tier III and Tier IV towns)
Opportunity Size: -
CV sales growth over last 2 years was worst in 10 years. There will be growth due to uptick in pent up demand
Company is adding new lines of business like tractor financing, rural financing, SME financing, both working capital and term loan
Year to March FY13 FY14 FY15 FY16E FY17E
Net Interest Income (INR cr) 1,107 1,459 1,704 1,904 2,229
Net Profit after tax (INR cr) 307 364 435 537 642
Adjusted BV per share 137 160 203 234 270
Dilute EPS (Rs.) 21.4 25.4 30.3 34.4 41.2
Gross NPA ratio (%) 1.0 1.9 3.1 2.5 2.1
Net NPA ratio (%) 0.2 0.7 2.0 1.3 0.9
Price/Adj. Book Value(x) 4.7 4.0 3.2 2.8 2.4
Price/Earnings (x) 30.2 25.4 21.3 18.7 15.7
60
110
160
210
260
310
Jan
-14
Feb
-14
Mar
-14
Ap
r-1
4
May
-14
Jun
-14
Jul-
14
Au
g-1
4
Sep
-14
Oct
-14
No
v-1
4
Dec
-14
Jan
-15
Feb
-15
Mar
-15
Ap
r-1
5
May
-15
Jun
-15
Jul-
15
Au
g-1
5
Sep
-15
Oct
-15
No
v-1
5
Dec
-15
Chola Sensex
Share Holding Pattern (%)
Promoter 53.15
FII 15.68
DII 24.72
Others 6.45

12
Cholamandalam Investment (CMP: INR 642; Mkt Cap: INR 9,833 crs)
Investment Hypothesis
Leading financier in vehicle segment. Adding new lines of business
like tractor, rural and SME financing, both working capital and term
loan
Constant improvement in efficiency. The operating cost as % of
assets has come down from 5.1% in FY09 to 3.5% in FY15
Currently at the bottom of NPA cycle. Asset quality is expected to
improve constantly
Risks
Commercial vehicle segment is highly correlated to GDP growth and
IIP. Slow down in GDP growth and IIP will have impact on growth
Vehicle segment constitute 69% of loan book. Negative news like
mining ban etc. will have impact on the asset quality
Peer Comparison
Vehicle Finance Loan Book Break-up
69%
29%
2%
Vehicle Finance
Home Equity
Others
HCV, 13%
LCV, 26%
Cars & MUV, 15%
3 Wheeler and SCV, 8%
Refinance, 15%
Older Vehicle, 13%
Tractor, 10%
HCV
LCV
Cars & MUV
3 Wheeler and SCV
Refinance
Older Vehicle
Tractor
Tractor
Loan Book Break-up
Diluted P/E(x) P/BV(x) Return on average
equity (%)
FY16E FY17E FY16E FY17E FY16E FY17E
Shriram Transport 14.0 11.9 2.1 1.9 13.7 14.4
Cholamandalam 16.8 14.0 2.5 2.1 15.7 16.4

13
Jamna Auto Industries Ltd. (CMP: INR 140; Mkt Cap: INR 940 crs)
Business Overview
Jamna Auto Industries Ltd. (JAI) is a market leader in the CV suspension leaf spring segment (90% of sales), including products like the conventional leaf spring and parabolic leaf spring.
JAI currently has a 64% market share in the conventional leaf springs segment and a market leader in the parabolic leaf spring segment. Being the industry leader makes JAI a key beneficiary of the ongoing domestic MHCV cycle recovery.
The company is focused on capturing the rising content-per-vehicle trend and hence it has forayed into the Air Suspension and Lift Axle segments (10% of consolidated sales) where its main client is Ashok Leyland for the heavy tonnage trucks.
Opportunity Size: -
Domestically, considering the 2.3 lakh MHCV run-rate in FY15 the overall leaf spring OEM opportunity stands between INR 1500 cr to INR 1800 cr .
Post GST implementation, aftermarket will offer an opportunity that is 4x of the OEM market opportunity.
Year to March FY13 FY14 FY15 FY16E FY17E
Net revenue 980 834 1,095 1,280 1,528
EBITDA 86 44 94 118 177
Adjusted PAT 28 2 29 46 81
Diluted EPS (Rs) 3 0.2 4 6 10
Diluted P/E (x) 43.3 759.9 37.7 24.0 13.6
EV/EBITDA (x) 19.4 96.1 12.3 9.9 6.6
ROAE(%) 17% 1% 16% 22% 32%
ROCE(%) 23% 7% 25% 32% 45%
0
50
100
150
200
250
300
350
400
450
Jan
-14
Feb
-14
Mar
-14
Ap
r-1
4
May
-14
Jun
-14
Jul-
14
Au
g-1
4
Sep
-14
Oct
-14
No
v-1
4
Dec
-14
Jan
-15
Feb
-15
Mar
-15
Ap
r-1
5
May
-15
Jun
-15
Jul-
15
Au
g-1
5
Sep
-15
Oct
-15
No
v-1
5
Dec
-15
Jamna Sensex
Share Holding Pattern (%)
Promoter 43.81
FII 0
DII 0.37
Others 55.82

14
Jamna Auto Industries Ltd. (CMP: INR 140; Mkt Cap: INR 940 crs)
Investment Hypothesis
Post a 2-year downturn, the MHCV industry in India is registering a recovery. JAI is
the largest player in the domestic leaf spring industry with 64% market share whilst
several other small companies contribute to the remaining 36% share. JAI is
expected to be a significant beneficiary of the CV cycle recovery in India.
JAI’s multiple plant location strategy in proximity to CV OEM customers has helped
the company maintain its dominance in the leaf spring industry. At present, the
company has six facilities located close to major CV manufacturing hubs in India
and this has helped JAI gain a significant share of business (SOB) with leading CV
OEMs. Apart from scale, the strategic location of its plants has helped it to manage
cost efficiently by reducing freight expenses.
Additionally, the company has forayed into the air suspension and lift axle segment
via a technology tie-up with Ridewell, USA. Implementation of GST (Goods and
Services Tax), will open up a significant aftermarket opportunity (i.e. ~4x OEM
industry) for organized suspension leaf spring manufacturers such as JAI.
Risks
End-segment concentration risk
Steel price pass-through may affect revenue growth
Peer Comparison
Diluted P/E (x) Diluted EPS ROCE (%)
FY15E FY16E FY17E FY15 FY16E FY17E FY15E FY16E FY17E
Jamna Auto 31.9 20.1 11.4 7.4 5.8 10.3 25 32 45
Suprajit Engineering
34.4 27.7 19.1 4.2 5.2 7.5 23.7 24.2 26.4
106 100 86
44
94
120
181
38 45
28
2
29
48
84
FY11 FY12 FY13 FY14 FY15 FY16E FY17E
(IN
R C
r)
EBITDA PAT
Operating Leverage to be a primary driver of profitability
35% 31%
17%
1%
16%
23%
33%
47%
34%
23%
7%
25%
34%
46%
FY11 FY12 FY13 FY14 FY15 FY16E FY17E
ROE (%) ROCE (%)
ROCE will improve significantly

15
NIIT Ltd. (CMP: INR 99; Mkt Cap: INR 1,581 crs)
Business Overview
NIIT Ltd is in the business of providing training with a whole gamut of content, delivery and educational platforms to Corporates, Individuals and Schools.
The company has 3 main business segments – Corporate Learning Group (CLG), Skills & Careers Group (SCG) and School Learning Group (SLG). The company’s learning and talent development solutions have received widespread recognition globally.
It has been ranked among the Top 20 Training Outsourcing Companies for the 8th consecutive year by Training Industry Inc.
Opportunity Size: -
Global spend on corporate training currently totals US$135bn and within that USA’s share is US$85bn.
The year 2014, saw sizeable increase in the average expenditure for training outsourcing in USA. Currently US companies on an average spend $308,833 on training outsourcing up from $140,345 in 2013. An average 8% of the total training budget was spent on outsourcing in 2014.
Year to March FY13 FY14 FY15 FY16E FY17E
Revenue( crs) 961 951 957 972 1,089
Rev. growth (%) (23.8) (1.0) 0.7 1.5 12.1
EBITDA (crs) 42 51 22 73 104
Net profit (crs) (7) (42) (87) 2 27
Shares outstanding (crs) 16.5 16.5 16.5 16.5 16.5
Diluted EPS (INR) 1.6 1.1 (8.4) 3.9 5.8
EPS growth (%) 27.4 32.6 (881.8) 146.7 49.2
Diluted P/E (x) 62.2 92.3 (11.8) 25.3 16.9
EV/ EBITDA (x) 39.8 32.8 75.0 23.02 16.07
ROCE (%) -9% -6% -26% 1% 12%
ROE (%) -5% -9% -56% 1% 8%
60
110
160
210
260
310
360
410
Jan
-14
Feb
-14
Mar
-14
Ap
r-1
4
May
-14
Jun
-14
Jul-
14
Au
g-1
4
Sep
-14
Oct
-14
No
v-1
4
Dec
-14
Jan
-15
Feb
-15
Mar
-15
Ap
r-1
5
May
-15
Jun
-15
Jul-
15
Au
g-1
5
Sep
-15
Oct
-15
No
v-1
5
Dec
-15
NIIT Sensex
Share Holding Pattern (%)
Promoter 34.19
FII 9.24
DII 13.07
Others 43.50

16
NIIT Ltd. (CMP: INR 99; Mkt Cap: INR 1,581 crs)
Investment Hypothesis
Globally corporate training and training outsourcing industry is coming back into
the growth path. NIIT’s Corporate Learning business (CLG) is well placed to gain
from the changing market dynamics. Going forward, CLG business is expected to
grow at 15% CAGR over FY15-FY18E and EBITDA margin will likely improve to 13%
in FY18E from 11.5% currently.
In the Skill & Career Group (SCG) business, NIIT took a decision to launch a
comprehensive business transformation programme to get back onto the profitable
growth path. Although, the growth of SCG will likely be anaemic in near term; we
believe that with demand pick-up, the benefit of operating leverage would kick in
and operating margin would improve significantly to 8% in FY18E.
In the School Group (SCG), NIIT has exited from the government and capex driven
private school business and focus on IP driven school business to become more
asset light and improve return ratios.
Risks
Lower pick-up in global corporate training business.
Losing market share to low cost online training companies.
Peer Comparison
Diluted P/E (x) Diluted EPS ROCE (%)
FY15E FY16E FY17E FY15 FY16E FY17E FY15E FY16E FY17E
GP Strategies 18 19 15 1.4 1.4 1.5 18% 19% 20%
56 65
80 95
112
134
FY13 FY14 FY15 FY16E FY17E FY18E
CLG business expected to grow by 15% CAGR over FY15 – 18E
SCG group operating margin to get leverage benefit
583 459 399
328 305 337 370
89 3 5
-18
9 17 30
-10%
0%
10%
20%
-200
0
200
400
600
800
FY12 FY13 FY14 FY15 FY16E FY17E FY18E
Revenue EBITDA Op.Margin
Government Business will majorly end in FY17E and complete exit by FY19E
35%
45%
55%
65%
75%
85%
95%
0
50
100
150
200
250
FY11 FY12 FY13 FY14 FY15 FY16E FY17E FY18E
Govt School Revenues Non Govt School Revenues Non Govt Revenue Share (RHS)

17
Indo Count Industries Ltd (CMP: INR 1101; Mkt Cap: INR 3,900 crs)
Business Overview
Third largest exporter of Home Textiles (bed linen); 20% market share
Exports constitute 85% of revenue (70% to US)
Marquee global clients - Walmart,, House of Fraser, JC Penney, BBB (top 2 supplier )
Opportunity Size: -
Global Home Textile Market is currently valued at USD 86bn (2015) and is expected to grow to USD 96bn by 2017.
India’s Home Textiles exports stood at USD 1.4bn in 2013 and is expected to grow to USD6.8bn by 2020 i.e. FY13-20 CAGR of 12%
India is 46.5% of the US Cotton Bed Sheets/Pillow imports (Imports USD 1.56bn)
Bed Sheet segment alone is estimated to be USD 4.5bn in the USA market
Newer segments such as Fashion Bedding, Utility Bedding and Institutional bedding together account for USD 9.5bn.
These three segments are currently dominated by China (85-90% of total USA imports in these three segments). Any shift in the market share from China to India would offer huge growth potential for Indian Home Textile players
Year to March FY13 FY14 FY15 FY16E FY17E
Revenue( crs) 1,208 1,489 1,782 2,242 2,672
Rev. growth (%) 50.0 23.2 19.6 25.8 19.2
EBITDA (crs) 96 180 314 486 632
Net profit (crs) 30 110 146 284 383
Shares outstanding (crs) 3.8 3.8 4.1 4.1 4.1
Diluted EPS (INR) 7.8 29.1 35.8 69.5 93.7
EPS growth (%) 1,377.5 274.0 23.3 93.9 34.8
Diluted P/E (x) 141.7 37.9 30.7 15.9 11.8
EV/ EBITDA (x) 47.9 25.4 15.3 9.7 7.2
ROCE (%) 14.1 24.0 37.7 52.1 49.9
ROE (%) 15.7 44.7 40.4 50.2 43.0
0
500
1000
1500
2000
2500
3000
Jan
-14
Feb
-14
Mar
-14
Ap
r-1
4
May
-14
Jun
-14
Jul-
14
Au
g-1
4
Sep
-14
Oct
-14
No
v-1
4
Dec
-14
Jan
-15
Feb
-15
Mar
-15
Ap
r-1
5
May
-15
Jun
-15
Jul-
15
Au
g-1
5
Sep
-15
Oct
-15
No
v-1
5
Dec
-15
Indo Count Sensex
Share Holding Pattern (%)
Promoter 58.95
FII 8.46
DII 1.50
Others 31.09

18
Indo Count Industries Ltd (CMP: INR 1101; Mkt Cap: INR 3,900 crs)
Investment Hypothesis
Competitve advantage over competitors due to cotton surplus status, favorable
cost dynamics, skilled labour advantage and supportive government policies &
subsidies.
Shift in Home Textiles market from China to India due to wage inflation and Yuan
appreciation in China.
Shift in Product mix towards high margin Home Textiles business (20% margins)
from low margin Spinning business (5-7% margins).
Foray into newer geographies and also newer segments with a total market size of
USD 9bn such as Fashion, Utility and Institutional Bedding
Fashion and Utility segments would utilize the same retail distribution channel as
Sheets allowing for distribution synergies.
China dominates 85-90% of these three segments. Any minor shift in market share
to boost Indo Count’s revenues.
Asset light business model leading to Superior return ratios.
Risks
Raw material volatility
Losing Suppliers
Peer Comparison
Diluted P/E (x) Diluted EPS ROCE (%)
FY15E FY16E FY17E FY15 FY16E FY17E FY15E FY16E FY17E
Indo Count Inds. 16.86 12.1 9.6 35.7 49.6 62.4 37.7 40.6 38.3
Welspun India 10.6 9.5 8.6 53.8 59.9 66.8 24.6 25.7 23.8
194 263 322 342 355 369
450
820
1042
1276
1604
1931
164
126
130
50
6.1
7.9
12.1
15.9 16.2 16.9
0.0
3.0
6.0
9.0
12.0
15.0
18.0
0
500
1,000
1,500
2,000
2,500
FY12 FY13 FY14 FY15E FY16E FY17E
(IN
R C
r)
Spinning (INR cr) Home Textiles (INR cr)
Consumer Durables (INR cr) EBITDA Margin %
Segmental Revenue: Change in Product Mix to drive Margin growth
0
20
40
60
80
100
120
140
160
India Bangladesh Indonesia Eygpt China Pakistan Turkey
India: one of the most Cost competitive country
Rawmaterial Power/fuel Wages Others
(RHS)

19
Natco Pharma Ltd (CMP: INR 579; Mkt Cap: INR 8,977 crs)
Business Overview
Focused R&D play in Oncology, CNS and other niche therapies
Identifies difficult to replicate molecules.
Has track record of winning complex patent challenges
• Nexavar (CL)/ Copaxone/Sovaldi/Tamiflu
De-risks itself from litigation expenses
30% market share in Indian generic Oncology market.
Opportunity Size: -
Current opportunity of USD 15 bn of the drugs known filed ANDA’s in the US Market
Post generization the opportunity size is around ~ USD 5 bn ( assuming 70% price erosion))
If we assume 20% market share for Natco, revenue accrual could be ~USD 1 bn.
Year to March FY13 FY14 FY15 FY16E FY17E
Net revenues 661 739 825 1,025 1,806
Rev growth (%) 27.0% 11.9% 11.7% 24.2% 76.1%
EBITDA 150 179 213 259 711
Adjusted PAT 84 103 150 158 509
Adj. EPS (INR) 4.8 5.9 8.6 9.1 29.2
EPS growth (%) 38.5% 23.0% 45.8% 5.5% 222.2%
P/E (x) 118.8 96.6 73.7 62.8 19.5
EV/EBITDA (x) 68.3 56.6 47.9 38.2 13.9
RoACE (%) 17.5% 17.9% 16.9% 17.2% 40.0%
RoAE (%) 14.1% 16.1% 18.9% 14.5% 32.2%
0
50
100
150
200
250
300
350
400
Jan
-14
Feb
-14
Mar
-14
Ap
r-1
4
May
-14
Jun
-14
Jul-
14
Au
g-1
4
Sep
-14
Oct
-14
No
v-1
4
Dec
-14
Jan
-15
Feb
-15
Mar
-15
Ap
r-1
5
May
-15
Jun
-15
Jul-
15
Au
g-1
5
Sep
-15
Oct
-15
No
v-1
5
Dec
-15
Natco Sensex
Share Holding Pattern (%)
Promoter 51.29
FII 10.85
DII 5.89
Others 31.97

20
Natco Pharma Ltd (CMP: INR 579; Mkt Cap: INR 8,977 crs)
Investment Hypothesis
Strong revenue visibility due to
● Copaxone launch on the anvil (3 Bn USD)
● Other US filings equally lucrative: (Revlimid USD 4 Bn, Tracleer USD 1.5 Bn, Tamiflu USD 600 Mn , Vidaza USD 300 Mn)
● Sovaldi (Hepatitis C) to be a game changer (100 mn patients in 91 EM)
Strong R&D focus as seen in its filings
Limited competition products would be margin accretive
Risks
Delay in approvals from USFDA
Adverse court ruling
Currency risk
Peer Comparison
Segmental Revenues
Target Price Break-up (Incl. of Launches in US & Sovaldi)
Company Name
Diluted P/E (x) Diluted EV/EBITDA
(x) ROE (%)
FY16E FY17E FY16E FY17E FY16E FY17E
Natco Pharma 61.6 40.8 35.6 25.6 17.0 19.1
Torrent Pharma 23.0 17.1 14.2 11.1 32.6 34.1
Alembic Pharma 35.8 30.3 25.2 21.1 36.8 33.2
Glenmark 22.4 17.8 14.4 12.2 24.5 24.7
37%
13% 9%
8%
3%
1%
4% 0%
10%
13%
Core Pharma
Copaxone (20 mg)
Copaxone (40 mg)
Tamiflu
Tracleer
Vidaza
Entocort
Trenda (EU)
Sovaldi (EM)
NPV
29%
11%
18%
18%
13%
7%
Domestic Business
Domestic API
International API
International Generics
Pharmacy Division
Others/Job Work

21
Pokarna Ltd (CMP: INR 991; Mkt Cap: INR 613 crs)
Business Overview
Pokarna exports granites and quartz to over 69 countries.
Pokarna’s key segments are Engineered Stone-Quartz (contributing 42% of revenues) which is the fastest growing segment and Natural Stone -Granite ( contributing 56% of revenues)
Quartz is the fastest growing segment for Pokarna with a gain in revenue contribution from high margin Quartz from 27% in FY14 to 42% in FY15.
Granite is a steady state business for the company. Pokarna is one of the largest granite exporters from India with captive quarries for granite.
Opportunity Size: -
Global counter top market is USD 81bn; with Quartz at a mere 8bn i.e.10% market share offering immense growth potential.
US/ Canada at 24% are the biggest markets for Counter top yet Quartz is grossly underpenetrated in these markets.
Quartz’s share in US and Canada counter top markets is estimated at a mere 8% and 15%, respectively, portending humungous scope for growth.
US quartz is expected to grow in volume terms by 20% CAGR over 2012-17E
Year to March FY13 FY14 FY15 FY16E FY17E
Revenue( crs) 204 231 326 429 512
Rev. growth (%) 12.6 13.3 41.5 31.4 19.5
EBITDA (crs) 36 48 82 107 128
Net profit (crs) (7) 12 28 41 47
Shares outstanding (crs) 0.6 0.6 0.6 0.6 0.6
Diluted EPS (INR) (10.7) 18.8 44.7 66.3 76.1
EPS growth (%) (78.5) (275.2) 137.6 48.2 14.8
Diluted P/E (x) (92.3) 52.6 22.2 15.0 13.0
EV/ EBITDA (x) 24.5 19.3 10.9 8.1 8.9
ROE (%) (35.3) 56.5 70.4 55.8 40.1
0
200
400
600
800
1000
1200
1400
Jan
-14
Feb
-14
Mar
-14
Ap
r-1
4
May
-14
Jun
-14
Jul-
14
Au
g-1
4
Sep
-14
Oct
-14
No
v-1
4
Dec
-14
Jan
-15
Feb
-15
Mar
-15
Ap
r-1
5
May
-15
Jun
-15
Jul-
15
Au
g-1
5
Sep
-15
Oct
-15
No
v-1
5
Dec
-15
Pokarna Sensex
Share Holding Pattern (%)
Promoter 56.67
FII 1.23
DII --
Others 42.10

22
Pokarna Ltd (CMP: INR 991; Mkt Cap: INR 613 crs)
Investment Hypothesis
Shift in consumer interest from other Counter top materials such as Laminates (market share of 16% currently) towards Quartz fueling growth.
Quartz growing faster than Counter top market: from 1999-14 quartz segmetn
grew at CAGR of 15.8% while counter top grew at CAGR of 4.4%
Shift in Pokarna’s product mix towards high margin Quartz segment from
traditional Granite segment. Quartz reported 32% EBITDA margin with 42%
contribution to Total Revenues whereas Granite reported 22% margins with 56%
contribution to Total Revenues.
BretonStone technology manufactures superior quality of Quartz product. Globally,
only 10 sizeable manufacturers produce quartz using the Breton Stone technology.
Pokarna has an exclusivity contract within India and is the sole company in India
using the Breton Stone technology to manufacture quartz slabs
Currently Pokarna has less than 5% market share in the US Quartz market.
Company is expanding its distribution reach in order to expand its presence in key
counter top regions such as North America and in Europe.
Granite business segment to continue growing at a steady pace
Risks
Currency risk due to non-hedging of currency exposure
Downturn in USA housing market
Change in consumer preference away for quartz counter tops
Peer Comparison Diluted P/E (x) Diluted EPS
FY15 FY16E FY17E FY15 FY16E FY17E
Pokarna 20.3 14.7 12.0 50.5 69.9 85.6
Ceasar Stone (USD) 24.6 17.4 14.4 2.4 3.4 4.1
Laminates, 16%
Granite, 27%
Solid Surface,
25%
Engineered
Quartz, 8%
Marble, 2% Others,
22%
Global Countertop Market Segmentation (Sales-2012)
Quartz 8%
Solid Surfac
e 25%
Granite
27%
Laminates 16%
Marble 2%
Quartz is the fastest category
Quartz is the gaining Market Share in Global Countertop Market
MA
RK
ET S
HA
RE
Development Growth Maturity Dwindling
Pokarna Segmental Revenues
Granite
56%
Quartz 42%
Appare 2%

23
Siyaram Silk Mills Ltd. (CMP: INR 1221; Mkt Cap: INR 988 crs)
Business Overview
Siyaram Silk Mills Ltd. (Siyaram) is an integrated textile manufacturer with a domestic focus which has strategically transformed itself from a textile manufacturer to a major garmenting and brand house
Revenues breakup is Fabrics - 76%, Readymade Garments - 16%, Others - 5% and Yarn - 3%
Siyaram’s biggest brands include Siyaram, J. Hampstead, Mistair and Oxemberg
It has a pan India distribution network comprising 500 agents, 1,500 dealers and 365,000 retailers and over 200 franchise stores
Opportunity Size: -
The textile market will grow to USD221bn by 2021 from USD108bn. The growth will be driven by readymade garments (RMG).
Sales of branded apparel (part of RMG) have increased at 15% CAGR over 2009-14. Going ahead, branded apparel is expected to clock 10-12% CAGR over 2014-19. Therefore, the share of branded garments is expected to catapult to 46-48% in 2019 compared to around 35% in 2014.
Year to March FY13 FY14 FY15 FY16E FY17E
Net Revenues 1,032 1,291 1,496 1,661 1,849
Rev Growth (%) 14% 25% 16% 11% 11%
EBITDA Margin 11 11 12 12 12
Adjusted PAT 55 69 79 104 119
Adj. EPS (INR) 58 78 84 111 127
EPS Growth (%) -3% 25% 15% 32% 14%
P/E (x) 20.9 15.7 14.6 11.0 9.6
P/B (x) 3.6 3.1 2.6 2.2 1.8
RoACE (%) 15 17 18 20 20
RoAE (%) 19 21 19 22 20
EV/EBITDA (x) 13 10 8.3 7.2 6.4
0
100
200
300
400
500
600
Jan
-14
Feb
-14
Mar
-14
Ap
r-1
4
May
-14
Jun
-14
Jul-
14
Au
g-1
4
Sep
-14
Oct
-14
No
v-1
4
Dec
-14
Jan
-15
Feb
-15
Mar
-15
Ap
r-1
5
May
-15
Jun
-15
Jul-
15
Au
g-1
5
Sep
-15
Oct
-15
No
v-1
5
Dec
-15
Siyaram Sensex
Share Holding Pattern (%)
Promoter 67.07
FII 0.75
DII 6.28
Others 25.90

24
Siyaram Silk Mills Ltd. (CMP: INR 1221; Mkt Cap: INR 988 crs)
Readymade garment revenues to improve to ~20% of total revenues
Investment Hypothesis
The changing product mix to premium products and increasing share of the high-margin RMG segment has helped improve EBITDA margin and ROCEs from 8% and 6% in FY09 to 11.7% and 18%, respectively in FY15.
The RMG segment’s share in revenues and EBIT will increase from 16% and 18% currently to 20% and 31% of revenues in next 3 years
Margin to stabilize at 12.2% by FY17E from the 11.7% margins currently which will help reducing earnings volatility. Any spurt in consumption will lead to volume growth, which will in turn trigger operating leverage.
The stock trades at very attractive valuations of 9x FY16E and 8x FY17E EPS of INR 105 and INR 121, respectively – much cheaper than its peers.
Risks
Fluctuation in raw material prices
Competition from the unorganized sector
Semi-Urban slowdown and limited Pricing Flexibility
Peer Comparison
Diluted P/E (x) Diluted EPS ROCE (%)
FY15 FY16E FY17E FY15 FY16E FY17E FY15 FY16E FY17E
Siyaram 12.4 9.6 7.8 76.0 98.0 121.0 18% 18% 19%
Raymond 19.9 23.0 15.0 21.0 18.0 28.0 9% 9% 12%
Arvind 20.1 19.4 15.1 15.0 16.0 20.0 12% 12% 13%
KKCL 37.4 31.2 23.6 53.0 63.0 83.0 31% 30% 28%
855
1849
90 348
2011 2017E
Total revenues (INR Cr) RMG revenues (INR Cr)
86
202
16 63
2011 2017E
Total EBIT (INR Cr) RMG EBIT (INR Cr)
Readymade garments EBIT to improve to 31% of total EBIT
4%
5%
5%
6%
6%
7%
7%
2013 2014 2015 2016E 2017E
PAT (INR Cr) PAT Margin (%)
PAT growth expected to outpace topline growth

25
Edelweiss Midcap Marvels: Performance
Edelweiss Midcap Marvels have delivered a CAGR return of 62% since inception (4 June 2014) as against CNX Midcap Index CAGR return of 16%.
Edelweiss Midcap Marvels NAV: At INR 215 vs CNX Midcap Index NAV of INR 126
90
110
130
150
170
190
210
230
250
Jun
-14
Jul-
14
Au
g-1
4
Sep
-14
Oct
-14
No
v-1
4
Dec
-14
Jan
-15
Feb
-15
Mar
-15
Ap
r-1
5
May
-15
Jun
-15
Jul-
15
Au
g-1
5
Sep
-15
Oct
-15
No
v-1
5
Dec
-15
Daily Portfolio NAV Daily Benchmark NAV

Mid-Cap Marvels Portfolio Performance
26
Midcap Marvels Portfolio Performance
Parameters 1 M 3 M 6 M 9M 12M ITD
Portfolio Returns 5.9% -1.4% 10.3% 25.3% 36.8% 62.2%
Benchmark Returns 0.3% 0.9% 0.9% 0.9% 3.1% 15.7%
Volatility 22.1% 18.2% 24.7% 24.6% 24.6% 23.1%
Benchmark Volatility 12.5% 10.5% 19.3% 19.2% 18.4% 18.2%
Sharpe Ratio 2.8 -0.8 0.5 1.0 1.2 2.3
Information Ratio 5.2 -0.7 0.8 2.1 2.1 2.8

Returns since Inception and for the month
27
5%
7%
15%
24%
79%
150%
289%
0% 100% 200% 300% 400%
NIIT Ltd
Siyaram Silk
Jamna Auto Industries Ltd.
POKARNA
Cholamandalam Finance
Indo Count
Natco Pharma Ltd
Return Since inception
3%
3%
5%
7%
12%
12%
15%
0% 5% 10% 15% 20%
NIIT Ltd
Cholamandalam Finance
POKARNA
Siyaram Silk
Indo Count
Natco Pharma Ltd
Jamna Auto Industries Ltd.
Return for the month of December

Disclaimer
28
Edelweiss Broking Limited (“EBL” or “Research Entity”) is regulated by the Securities and Exchange Board of India (“SEBI”) and is licensed to carry on the business of broking, depository services and related activities. The business of EBL and its Associates (list available on www.edelweissfin.com) are organized around five broad business groups – Credit including Housing and SME Finance, Commodities, Financial Markets, Asset Management and Life Insurance. Broking services offered by Edelweiss Broking Limited under SEBI Registration No.: INZ000005231; Name of the Compliance Officer: Mr. Dhirendra Rautela, Email ID: [email protected] Corporate Office: Edelweiss House, Off CST Road, Kalina, Mumbai - 400098; Tel. (022) 4009 4400/ 4088 5757/4088 6278 This Report has been prepared by Edelweiss Broking Limited in the capacity of a Research Analyst having SEBI Registration No.INH000000172 and distributed as per SEBI (Research Analysts) Regulations 2014. This report does not constitute an offer or solicitation for the purchase or sale of any financial instrument or as an official confirmation of any transaction. The information contained herein is from publicly available data or other sources believed to be reliable. This report is provided for assistance only and is not intended to be and must not alone be taken as the basis for an investment decision. The user assumes the entire risk of any use made of this information. Each recipient of this report should make such investigation as it deems necessary to arrive at an independent evaluation of an investment in the securities of companies referred to in this document (including the merits and risks involved), and should consult his own advisors to determine the merits and risks of such investment. The investment discussed or views expressed may not be suitable for all investors. This information is strictly confidential and is being furnished to you solely for your information. This information should not be reproduced or redistributed or passed on directly or indirectly in any form to any other person or published, copied, in whole or in part, for any purpose. This report is not directed or intended for distribution to, or use by, any person or entity who is a citizen or resident of or located in any locality, state, country or other jurisdiction, where such distribution, publication, availability or use would be contrary to law, regulation or which would subject EBL and associates / group companies to any registration or licensing requirements within such jurisdiction. The distribution of this report in certain jurisdictions may be restricted by law, and persons in whose possession this report comes, should observe, any such restrictions. The information given in this report is as of the date of this report and there can be no assurance that future results or events will be consistent with this information. This information is subject to change without any prior notice. EBL reserves the right to make modifications and alterations to this statement as may be required from time to time. EBL or any of its associates / group companies shall not be in any way responsible for any loss or damage that may arise to any person from any inadvertent error in the information contained in this report. EBL is committed to providing independent and transparent recommendation to its clients. Neither EBL nor any of its associates, group companies, directors, employees, agents or representatives shall be liable for any damages whether direct, indirect, special or consequential including loss of revenue or lost profits that may arise from or in connection with the use of the information. Our proprietary trading and investment businesses may make investment decisions that are inconsistent with the recommendations expressed herein. Past performance is not necessarily a guide to future performance .The disclosures of interest statements incorporated in this report are provided solely to enhance the transparency and should not be treated as endorsement of the views expressed in the report. The information provided in these reports remains, unless otherwise stated, the copyright of EBL. All layout, design, original artwork, concepts and other Intellectual Properties, remains the property and copyright of EBL and may not be used in any form or for any purpose whatsoever by any party without the express written permission of the copyright holders. EBL shall not be liable for any delay or any other interruption which may occur in presenting the data due to any reason including network (Internet) reasons or snags in the system, break down of the system or any other equipment, server breakdown, maintenance shutdown, breakdown of communication services or inability of the EBL to present the data. In no event shall EBL be liable for any damages, including without limitation direct or indirect, special, incidental, or consequential damages, losses or expenses arising in connection with the data presented by the EBL through this report. We offer our research services to clients as well as our prospects. Though this report is disseminated to all the customers simultaneously, not all customers may receive this report at the same time. We will not treat recipients as customers by virtue of their receiving this report. EBL and its associates, officer, directors, and employees, research analyst (including relatives) worldwide may: (a) from time to time, have long or short positions in, and buy or sell the securities thereof, of company(ies), mentioned herein or (b) be engaged in any other transaction involving such securities and earn brokerage or other compensation or act as a market maker in the financial instruments of the subject company/company(ies) discussed herein or act as advisor or lender/borrower to such company(ies) or have other potential/material conflict of interest with respect to any recommendation and related information and opinions at the time of publication of research report or at the time of public appearance. EBL may have proprietary long/short position in the above mentioned scrip(s) and therefore should be considered as interested. The views provided herein are general in nature and do not consider risk appetite or investment objective of any particular investor; readers are requested to take independent professional advice before investing. This should not be construed as invitation or solicitation to do business with EBL. EBL or its associates may have received compensation from the subject company in the past 12 months. EBL or its associates may have managed or co-managed public offering of securities for the subject company in the past 12 months. EBL or its associates may have received compensation for investment banking or merchant banking or brokerage services from the subject company in the past 12 months. EBL or its associates may have received any compensation for products or services other than investment banking or merchant banking or brokerage services from the subject company in the past 12 months. EBL or its associates have not received any compensation or other benefits from the Subject Company or third party in connection with the research report. Research analyst or his/her relative or EBL’s associates may have financial interest in the subject company. EBL, its associates, research analyst and his/her relative may have other potential/material conflict of interest with respect to any recommendation and related information and opinions at the time of publication of research report or at the time of public appearance. Research analyst has served as an officer, director or employee of subject Company: No EBL has financial interest in the subject companies: No EBL’s Associates may have actual / beneficial ownership of 1% or more securities of the subject company at the end of the month immediately preceding the date of publication of research report. Research analyst or his/her relative has actual/beneficial ownership of 1% or more securities of the subject company at the end of the month immediately preceding the date of publication of research report: No EBL has actual/beneficial ownership of 1% or more securities of the subject company at the end of the month immediately preceding the date of publication of research report: No Subject company may have been client during twelve months preceding the date of distribution of the research report. There were no instances of non-compliance by EBL on any matter related to the capital markets, resulting in significant and material disciplinary action during the last three years. A graph of daily closing prices of the securities is also available at www.nseindia.com Analyst Certification: The analyst for this report certifies that all of the views expressed in this report accurately reflect his or her personal views about the subject company or companies and its or their securities, and no part of his or her compensation was, is or will be, directly or indirectly related to specific recommendations or views expressed in this report. Additional Disclaimer for U.S. Persons. Edelweiss is not a registered broker – dealer under the U.S. Securities Exchange Act of 1934, as amended (the“1934 act”) and under applicable state laws in the United States. In addition Edelweiss is not a registered investment adviser under the U.S. Investment Advisers Act of 1940, as amended (the "Advisers Act" and together with the 1934 Act, the "Acts), and under applicable state laws in the United States. Accordingly, in the absence of specific exemption under the Acts, any brokerage and investment services provided by Edelweiss, including the products and services described herein are not available to or intended for U.S. persons. This report does not constitute an offer or invitation to purchase or subscribe for any securities or solicitation of any investments or investment services and/or shall not be considered as an advertisement tool. "U.S. Persons" are generally defined as a natural person, residing in the United States or any entity organized or incorporated under the laws of the United States. US Citizens living abroad may also be deemed "US Persons" under certain rules. Transactions in securities discussed in this research report should be effected through Edelweiss Financial Services Inc. Additional Disclaimer for U.K. Persons. The contents of this research report have not been approved by an authorised person within the meaning of the Financial Services and Markets Act 2000 ("FSMA"). In the United Kingdom, this research report is being distributed only to and is directed only at (a) persons who have professional experience in matters relating to investments falling within Article 19(5) of the FSMA (Financial Promotion) Order 2005 (the “Order”); (b) persons falling within Article 49(2)(a) to (d) of the Order (including high net worth companies and unincorporated associations); and (c) any other persons to whom it may otherwise lawfully be communicated (all such persons together being referred to as “relevant persons”). This research report must not be acted on or relied on by persons who are not relevant persons. Any investment or investment activity to which this research report relates is available only to relevant persons and will be engaged in only with relevant persons. Any person who is not a relevant person should not act or rely on this research report or any of its contents. This research report must not be distributed, published, reproduced or disclosed (in whole or in part) by recipients to any other person. Additional Disclaimer for Canadian Persons Edelweiss is not a registered adviser or dealer under applicable Canadian securities laws nor has it obtained an exemption from the adviser and/or dealer registration requirements under such law. Accordingly, any brokerage and investment services provided by Edelweiss, including the products and services described herein, are not available to or intended for Canadian persons. This research report and its respective contents do not constitute an offer or invitation to purchase or subscribe for any securities or solicitation of any investments or investment services.