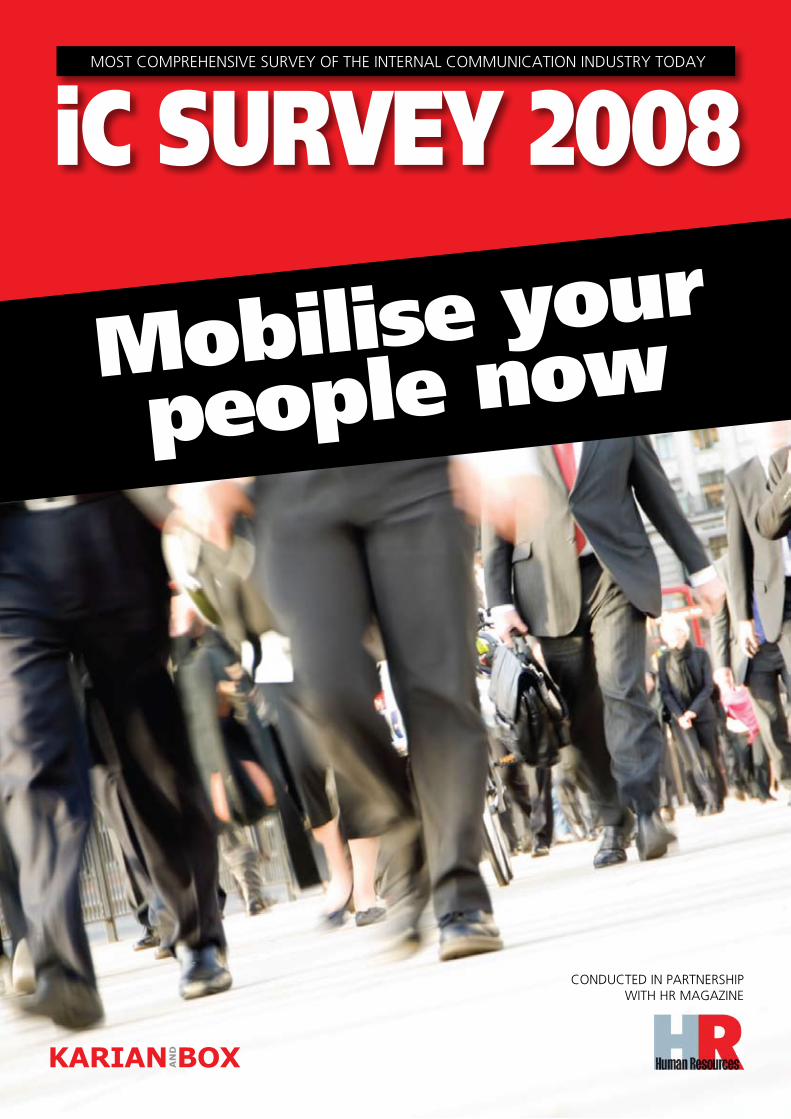
ic survey 2008
DESCRIPTION
The most comprehensive survey of the internal communication industry todayTRANSCRIPT
KARIAN ANDBOX
most comprehensive survey of the internal communication industry today
ic survey 2008
conducted in partnershipwith hr magazine
Mobilise your
people now
2
Section 1
page section
03 insight06 ic Bites – summary08 survey respondents and demography15 communication resources20 roles and responsibilities24 communicating strategy27 planning your communication30 measuring the impact of communication35 leadership and communication37 communication channels
contents
Karian and Box conducted an online survey of HR and communication professionals across the UK. 546 HR and communications professionals participated in the research by completing the ic survey 2008. a further 12 Directors of HR, Directors of Corporate Communication, and Directors or Heads of Internal Communication were interviewed by telephone and face-to-face to obtain deeper insight into the quantitative results.
report author: ghassan Karianresearch analysis by: martha philipsreport design by: steve raw
Introduction | contents
iC Survey 2008 | Karian and Box
3
Section 1
Insight
two years ago, when the benchmark ic survey study was conducted, the world and the uK were still enjoying the afterglow of one of the longest periods of economic growth in the last 100 years. the internal communications profession had seen its own boom – in the numbers of roles being created, in the increasing seniority of internal communications roles and in the size of budgets. internal communications was the ‘in-thing’. this is something that organisations, flush with money, could afford to spend money on to help them keep their people informed and engaged.
fast forward to the credit crunch, organisational cost-cutting, a housing market in freefall, the spectre of higher unemployment on the horizon, public sector spending in retrenchment; this is the environment facing communicators today.
what does the current economic climate hold for the future of a profession that has grown significantly in the last few years? having historically been seen as a ‘soft’ need (perceived as less critical than managing an organisation’s external reputation), will an economic downturn see internal communicators face job losses and budget cuts? as organisations feel a recession bite and government revenues fall, will the importance of communicating with and engaging their people be downgraded?
the simple answer is both yes and no.
Ghassan Karianfounder of Karian and Box
the benchmark study into the internal communications industry was conducted in
2006 and provided invaluable insight into the issues facing organisations attempting
to engage their workforces

4
Yes: Professional retrenchment organisations are cost cutting, making budget reductions and reorganising their structures with cost in mind. internal communications has not been immune, with many teams in the last 12 months facing ‘shaving’ or ‘culling’ to achieve savings.
this has seen many large public and private sector organisations shed tens if not hundreds of communicators. some organisations are making long-term spending decisions with minimal cuts, partly because they can afford to and partly because they are enlightened. others are having to make harder cuts in order to survive or because they still believe that internal communications is a nice-to-have that can be axed in times of financial difficulty and invested in when it can be afforded.
however, raw cost cutting has not been the only driver for these changes. organisations are seeking more value for money for how they manage employee communications and engagement. they are increasingly seeking out individuals and input that are more closely aligned to helping achieve their immediate business priorities. nice-to-haves are out; a zealous focus on business priorities is definitely in.
talk to executive search professionals such as Quentin cowdry at libero consulting and they will tell you that many organisations are still looking for individuals with the seniority, experience, strategic capabilities and creativity to help them re-shape and deliver their internal communications. senior appointments, as director or head of internal communications, are still taking place. financial packages may not be growing as fast as they were two years ago, but it is now not uncommon to find such roles commanding salaries of six-figure sums.
this focus on senior and strategic insight is complemented by the shedding of more junior and middle-ranking roles. this could be seen as a positive development as the profession matures. in some cases, the argument that organisations need more senior strategic support and fewer tactical ‘post-office clerks’ who package and send out messages has, to some extent, been won.
organisational leaders have bought into this message and have recruited more senior strategic advisors to help the process of culling junior and perceivably lower-value-adding roles. the concern is whether this will deplete the pipeline of middle-ranking internal communications professionals who are learning the trade today and will be the seniors of the future.
one interesting by-product of the re-structuring of internal communications teams across both the public and private sectors is the expansion in the freelance and interim contract market. organisations are shedding roles and individuals are making lifestyle choices. this means many internal communications professionals, rather than seeking full-time employment, are opting to go it alone – offering their services as freelancers or interim contractors. this market has ballooned in the last 5 years, and expanded particularly rapidly in the last two years.
one of the drivers for this expansion is the amount of change organisations are facing, with short-to-medium-term change programmes that require specialist skills to help keep people engaged throughout a programme’s lifetime. however it is also driven by the dual consideration of cost. the simple fact is that contractors and freelancers are, in the long term, cheaper. it is also easier and less costly to hire and fire people on short-term contracts.
Introduction | insightSection 1
iC Survey 2008 | Karian and Box
5
Section 1
‘Jdi’: a communications approach for turbulent times 1 Understanding – use creative thinking and an understanding of the psychological drivers of employees to drive engagement and mobilisation. Knowing how to shape an article or manoeuvre your way around the organisation’s internal politics is
not good enough anymore. having a deep insight into what makes employees tick is vital if the right
internal communications strategy and activity is to be put in place.
organisational and individual psychology – how organisations and people think and behave – in times of stress is something internal communicators need to acquaint themselves with. a recent publication which gives good insight into techniques hr and communications managers can use is richard dool’s ‘enervating change – the impact of change initiatives on employee job satisfaction’.
2 Storytelling – shape your organisational narrative so it acts as a foundation for all everyday communications. the organisation’s story distils it’s challenges, vision, strategic priorities and related activity into simple, clear and compelling language. when the organisation shuts a factory, expands into a market, or reorganises part of a service, the narrative acts as the backdrop that provides employees context and justification for a specific action or change.
3 Campaigning – focus communications on two to three core themes, at the heart of your narrative, and build campaign activity around these themes across the year. an organisation can harness all its communications and all internal media onto these core themes. its communications planning process should be geared towards the day-to-day and medium-term delivery of activity that supports the core themes. this helps focus employee minds on the things that really matter rather than the thousands of extraneous messages they hear on a daily basis.
4 Leading – organisational leaders should be leading from the front of the building and not from behind their desks – visible, pro-active listening and acting on what they hear. in difficult times, people want to be led. they want reassurance; they want to be listened to; they want to believe. while market and external forces will still shape a predominant portion of the organisation’s performance, what leaders say and do can play a critical role in determining whether employees keep doing what is needed to help the organisation deliver that year’s targets.
5 Monitoring – tracking and measurement of employee understanding, support and action on a regular basis is fundamental. organisations cannot just test the mood-music of employee satisfaction / engagement once a year or less. regular monitoring of the employee ‘pulse’ (in direct relation to the organisation’s current priorities) is important if organisations are going to shape and re-shape their management activity, messages and internal media to ensure employees are thinking, saying and doing the right things.
Put simply, the recipe organisations need to apply to help them ride out market turbulence is clear:cut out the waste and do more for less; measure today, tomorrow and the day after what your people are thinking, saying and doing (don’t wait till next year); create and tell a compelling story all day, everyday; plan your storytelling into campaign-based activity, pursuing two to three key themes across the next year. do and say less, but do it much better.
No: Professional opportunitywhile the profession is facing the challenge of a tough economic environment, it concurrently faces a significant opportunity.
organisations still need professional insight, advice and action to help them mobilise their people at times of change. with more change and a tougher climate, this requirement is even more acute. what organisations are looking for is an internal communications profession that is more closely attuned to the delivery of short-to-medium-term priorities. whilst not overlooking long-term visions, employer brand building and organisational culture, the focus on operational delivery is even more critical. this has required a different and more determined approach to internal communications. it is less about ‘blue skies’ communication and more about ‘Jdi’.
it is not a new approach – a handful of best-practice organisations have been applying it over the last few years. the difference is that now, in the current climate, with shrinking resources, this approach is imperative. it is what some organisations, such as Bp and Baa, are now doing as part of a strategy which focuses on what is vital to improve performance during a period of uncertainty. indeed, they recognise that keeping their people engaged is even more critical now.
What does ‘JDI’ communication look like?

6
Introduction | ic BitesSection 1
A brief, two-page summary
of the iC Survey 2008 findings.
ic Bites
when compared to the ic survey 2006 results, a greater emphasis is now on change communications as a feature of a communicator’s role, which has seen an 11% increase in responses saying change activity forms a key part of their role. this emphasis on change is unsurprising given that the biggest issues respondents say their organisations face are reducing costs (61%), employer brand and culture change (59%) and restructuring (53%). however, 57% of respondents are doubtful whether change is managed well in their organisation, and only 28% say that people in their organisations adapt well to change.
73% say their organisation has a communications plan that shows communications activity over the coming year, but 27% do not or are unsure. however, these communications plans and processes tend to be reviewed infrequently – with 62% of respondents saying their plans are reviewed half yearly or annually. despite the prevalence of change currently affecting the industry, one third of respondents (33%) say they have a communications plan that is not adaptable to different sets of organisational priorities.
Measurement is still not a fact of life when it comes to managing internal communications. Just 40% say they regularly measure the impact of communications on awareness and understanding of business priorities and this has decreased by 5% since 2006. 50% say that their organisation measures employee satisfaction and engagement every year or two. Just 25% say that employee satisfaction and engagement is definitely included in their line manager competencies, and this has seen a major decrease since 2006, from 53%. these results indicate that measurement is still patchy in application and mainly focused on set-piece employee satisfaction surveys, which do not give an accurate picture of what employees are thinking, saying and doing in relation to the organisation’s priorities. furthermore, only half (54%) of respondents say that their organisations review business decisions in light of what their employees have told them in engagement and satisfaction surveys.
7
Section 1 Survey 2008 | Karian and Box
The majority of respondents (58%) say that their leadership do not participate in involving face-to-face communications. furthermore, face-to-face leadership communications are more likely to be informal, such as walk-the-floor discussions (29%), than structured, such as focus groups (14%). there is a major reliance on line management for upwards feedback, with 59% saying this is the most used leadership channel in their organisation.
Budgets for internal communications have fallen over the past two years. for example, 24% of respondents in 2006 had communications budgets of £100,000 to £250,000, and this has decreased to 18%. similarly, the percentages of respondents whose budgets are under £100,000 has increased from 57% to 65%. a decrease in budget size is mirrored by the fact that there has been an overall reduction in internal communications team size, especially in those of over 10 people.
The demographics of the profession continue to change. more of the ic survey 2008 respondents were women (72%), and this has seen a slight increase from the 66% of two years ago. the profession is getting younger, with 39% of respondents now aged 25-30. there is evidence that recruitment practices have changed slightly with 61% now saying they completed a capability-based interview for their role compared to 50% in 2006. 35% of respondents are unconvinced that they receive the training and coaching they need to succeed in their role.
when asked who should be responsible for administering internal communications within an organisation, 54% say that a dedicated team should take the lead in internal communications, but the remainder think HR or PR should. when respondents were asked whether hr is less capable to deliver internal communications, just over half (52%) agreed.

Demography
Survey respondents | demographySection 2
8
survey respondents
Respondents by function Overview of responses by sectorfig 2.0 fig 2.1
hr
corporate communicators (with internal communication responsibility)
internal communicators
ngo sector
private sector
public sector
21%59%
49%
30%
38%
3%
this section analyses responses to the survey by function, sector, gender, age and educational background.
Profession and sectorunlike ic survey 2006, almost one third (30%) of those responding to the 2008 research are in hr roles. the remaining 70% are made up of internal communications professionals (49%) and corporate communications professionals, for whom internal communications forms part of their role (21%). in 2006, ic survey was focused predominantly on the views of communications professionals. the 2008 research has been widened to include the perspectives of those working in hr who have a direct responsibility or focus on internal communication.
the percentage of those responding to the study from the private sector is higher than in 2006 – 59% of total respondents. there was a marginally smaller response from those working in the public and ngo sectors (at 38% and 3% respectively).
fig 2.2 overleaf provides a more detailed breakdown of respondents by sector group.

iC Survey 2008 | Karian and Box Section 2
9
Overview of responses by sectorfig 2.2
Sector detailsonce again, the predominant response came from employees working in local government (18%), although more communicators working in central government participated in the 2008 research compared with ic survey 2006. a large proportion of employees working in the nhs and related health services also took part in ic survey 2008.
the largest single proportion of communicators from the private sector came, once again, from the banking and financial services sectors (8%). 6% of respondents came from the professional services sector, including many working in the legal services and accountancy sectors. a further 5% work in it/telecommunications – up from 3% in 2006.
to ensure that ic survey 2008 is of maximum value, analysis of the results throughout this report has been conducted by sector. this enables comparison between the private, public and ngo sectors. it will also ensure the data is not unrepresentative of the overall communications population.
0% 5% 10% 15% 20%
call centre industry/customer service
construction/building/support services
it/telecommunication
fmcg
leisure/travel
logistics/transport
pharmaceuticals
professional services
utilities
financial services
retail
manufacturing
ngo/research organisation
Broadcasting & media
defence industry
nhs/health services
education (university)
other public sector
national government department
local government
2%
6%
5%
3%
1%
2%
3%
6%
4%
8%
2%
5%
3%
2%
3%
9%
3%
8%
7%
18%
private sector
ngo sector
mix, public/private sector
public sector

Survey respondents | demographySection 2
10
Respondents by gender – total communications industry
Respondents by gender – HR
fig 2.3
fig 2.6
female male female male
female male female male
72%
71%
74%
28%
29%
26%
Internal communication respondents by gender
Corporate communication respondents by gender
fig 2.4
fig 2.5
68%
32%
Genderas with 2006, the survey results highlight a heavy representation of women in the communications profession. when excluding hr colleagues from the data, a more pronounced increase in the number of women working in both internal and corporate communications seems to have occurred in the last 2 years.
compared with 2006, when 66% of ic survey respondents were women, 72% of the 2008 respondents were women. this shift has been driven by more women working in both internal and corporate communications.
however, with 68% of corporate communications respondents being women, it also highlights an increase in the number of women in more senior roles, taking responsibility for both internal and external communications. this is an interesting phenomenon which could either be taken positively or negatively. it could be seen as positive that more women are taking corporate communications roles with responsibility for advising and supporting leaders and managers. however, it may be that both communications and hr are still seen by, mainly male, leaders as ‘softer’ disciplines which are more suited to women. this is a controversial issue that has been much debated in both professions. these results do not necessarily create any greater clarity in that debate. they do, however, contribute to the fact base which shows an ever higher number of women taking prominent ‘enabler’ roles within organisations.
when looking at hr professionals only, the percentage of women is comparable to colleagues in internal communications – with 71% of hr respondents and 74% of internal communicators being women.
iC Survey 2008 | Karian and Box Section 2
11
“some organisations may be
lowering the seniority of their
internal communicators”
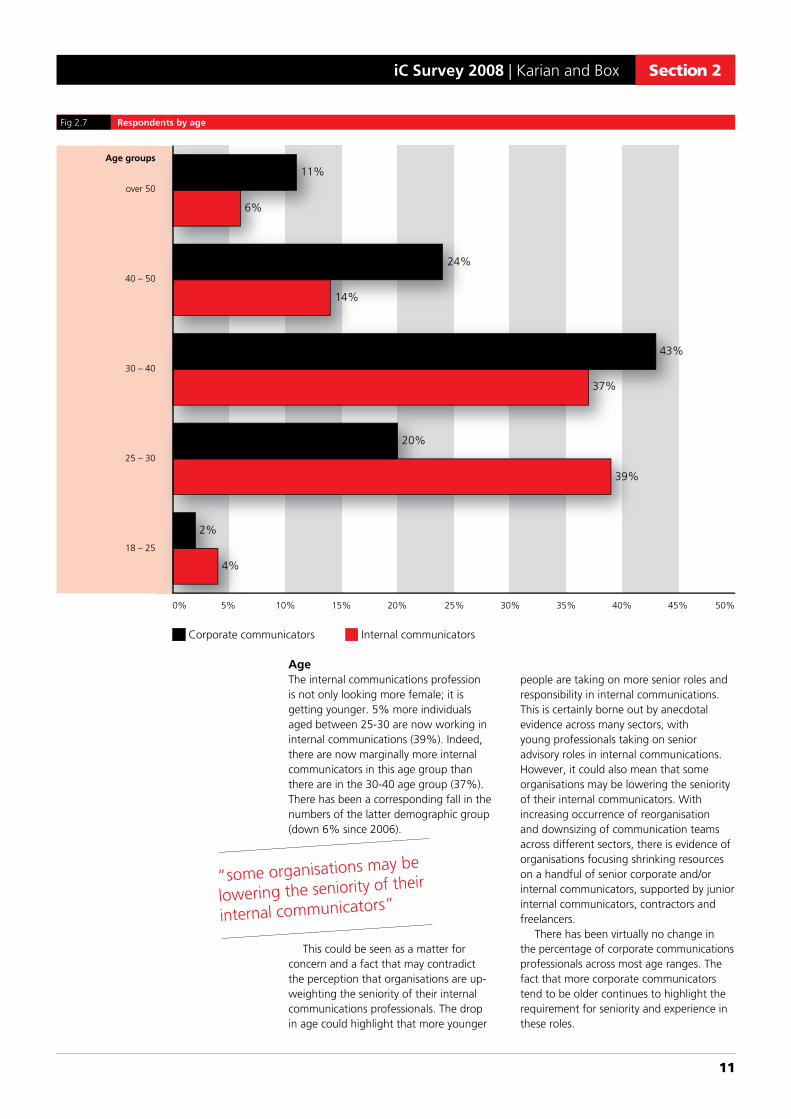
Respondents by agefig 2.7
Agethe internal communications profession is not only looking more female; it is getting younger. 5% more individuals aged between 25-30 are now working in internal communications (39%). indeed, there are now marginally more internal communicators in this age group than there are in the 30-40 age group (37%). there has been a corresponding fall in the numbers of the latter demographic group (down 6% since 2006).
this could be seen as a matter for concern and a fact that may contradict the perception that organisations are up-weighting the seniority of their internal communications professionals. the drop in age could highlight that more younger
people are taking on more senior roles and responsibility in internal communications. this is certainly borne out by anecdotal evidence across many sectors, with young professionals taking on senior advisory roles in internal communications. however, it could also mean that some organisations may be lowering the seniority of their internal communicators. with increasing occurrence of reorganisation and downsizing of communication teams across different sectors, there is evidence of organisations focusing shrinking resources on a handful of senior corporate and/or internal communicators, supported by junior internal communicators, contractors and freelancers.
there has been virtually no change in the percentage of corporate communications professionals across most age ranges. the fact that more corporate communicators tend to be older continues to highlight the requirement for seniority and experience in these roles.
0% 5% 10% 15% 20% 25% 30% 35% 40% 45% 50%
Age groups
over 50
40 – 50
30 – 40
25 – 30
18 – 25
corporate communicators internal communicators
11%
24%
14%
43%
37%
20%
39%
2%
4%
6%
Survey respondents | demographySection 2
12
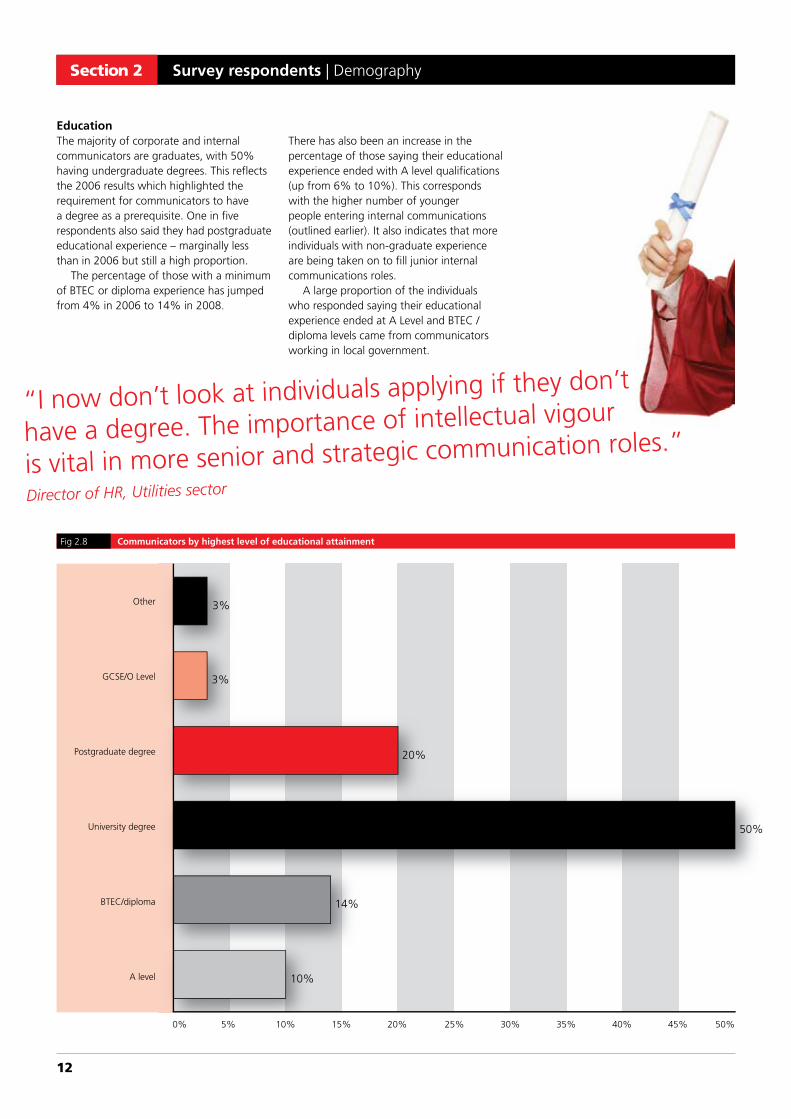
there has also been an increase in the percentage of those saying their educational experience ended with a level qualifications (up from 6% to 10%). this corresponds with the higher number of younger people entering internal communications (outlined earlier). it also indicates that more individuals with non-graduate experience are being taken on to fill junior internal communications roles.
a large proportion of the individuals who responded saying their educational experience ended at a level and Btec / diploma levels came from communicators working in local government.
Educationthe majority of corporate and internal communicators are graduates, with 50% having undergraduate degrees. this reflects the 2006 results which highlighted the requirement for communicators to have a degree as a prerequisite. one in five respondents also said they had postgraduate educational experience – marginally less than in 2006 but still a high proportion.
the percentage of those with a minimum of Btec or diploma experience has jumped from 4% in 2006 to 14% in 2008.
Communicators by highest level of educational attainmentfig 2.8
0% 5% 10% 15% 20% 25% 30% 35% 40% 45% 50%
other
gcse/o level
postgraduate degree
university degree
Btec/diploma
a level
3%
3%
20%
50%
14%
10%
“i now don’t look at individuals applying if they don’t
have a degree. the importance of intellectual vigour
is vital in more senior and strategic communication roles.”
Director of HR, Utilities sector
iC Survey 2008 | Karian and Box Section 2
13
50%
Length of time in internal communications the survey results show that internal communications roles are more established in the private sector, with 41% saying they have worked in internal communications for between 3-6 years. 22% of those in the public sector say the same; with 28% of public sector participants who say they have been in the internal communications for under one year.
this also indicates that more internal communications roles in the public sector have been introduced in the last 3 years, with internal communications moving up the agenda for many local authorities, health and police authorities. the same can be said for communicators working in ngos, where investment in internal communications is becoming more of a priority and the establishment of internal communications functions is becoming more common.
Length of time in current positionthe results of the 2008 research highlight an increase in turnover of communications roles, with more people spending less than one year and between 1-3 years in their roles. whilst 36% of communicators said in 2006 that they had spent between 1-3 years in their role, 47% said the same in 2008. similarly 31% of respondents said they had been in their role for under a year – up 5% since 2006. the big drop has been in communicators saying they have been in their role for 3-6 years, highlighting an increase in the fluidity of the communications job market.
the differences across sector show that the biggest jump in this market fluidity has been in the private sector, where over four out of five employees say they have been in their role for 3 years or less. this compares to a more stable public sector, where three in five employees say they have been in their role for 3 years or less.
these differences correspond with anecdotal feedback regarding the increasing level of restructuring in communications teams, particularly in the private sector. whilst there has been restructuring taking place in public sector teams, especially in local government, it has been at a much lower scale than in the private sector. this is a key driver for the higher level of turnover of communicators in private sector organisations.
Public Private NGO All respondents
Under one year 28% 15% 31% 12%
1 – 3 years 33% 23% 33% 25%
3 – 6 years 22% 41% 24% 34%
Over 6 years 17% 21% 12% 29 %
Length of time in internal communicationstable 2.0
“more and more people are spending less time in any one role or company. that has both an upside and a downside. it means individuals have broader experience; but it limits the depth of that experience.”Communications Director, Travel
Survey respondents | demographySection 2
14
Recruitment mechanismwhilst interviews remain a key mechanism for choosing candidates to fill communications and hr roles, there has been a significant leap in the use of capability-based interviews. 61% (table 2.1) of respondents said they had participated in a capability-based interview for their current role – compared to 50% who said the same in 2006. more organisations are using head hunters to recruit communications and hr professionals – with 20% of respondents saying they had been appointed to their current role after referral from a headhunter. this compares to 11% who said the same in 2006.
fewer respondents said they had been asked to give a presentation as part of their recruitment process – 21% in 2008 compared to 36% in 2006.
All respondents
Application form 65%
General interview 75%
Capability-based interview 61%
Psychometric testing 23%
Role-play simulation 7%
In-tray exercise / simulation 20%
Presentation 21%
Headhunter interview 20%
Application experiencetable 2.1
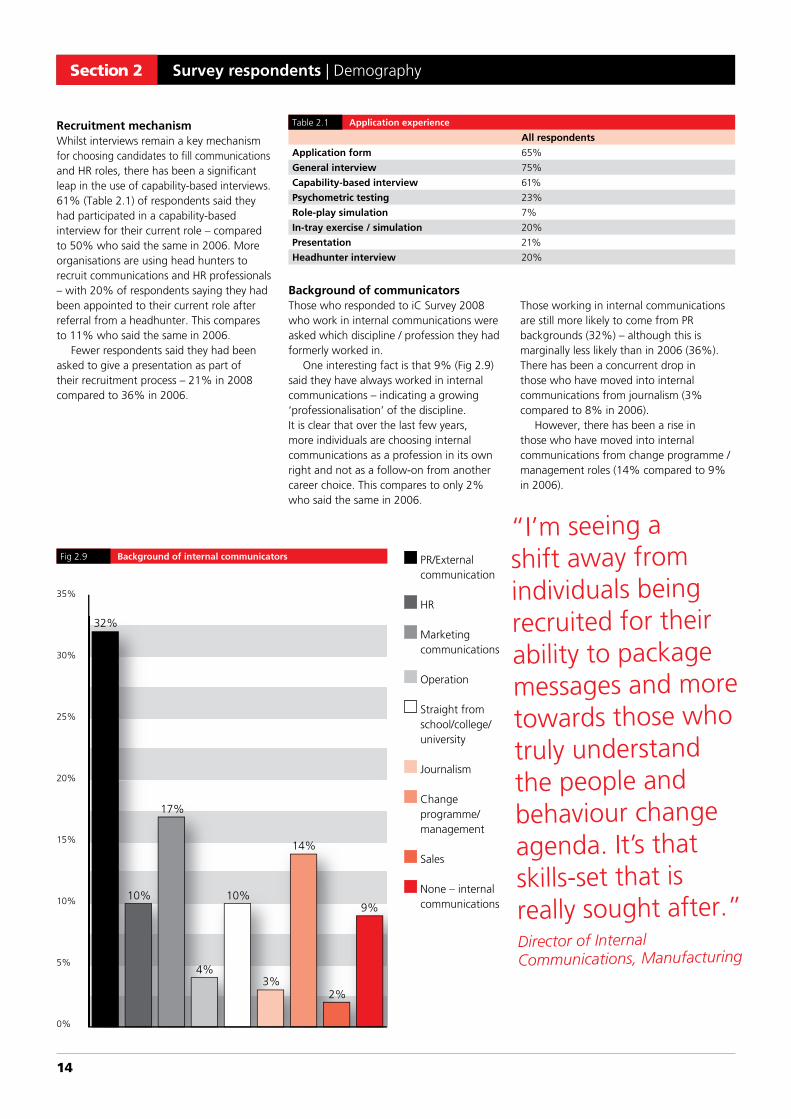
Background of internal communicatorsfig 2.9
Background of communicatorsthose who responded to ic survey 2008 who work in internal communications were asked which discipline / profession they had formerly worked in.
one interesting fact is that 9% (fig 2.9) said they have always worked in internal communications – indicating a growing ‘professionalisation’ of the discipline. it is clear that over the last few years, more individuals are choosing internal communications as a profession in its own right and not as a follow-on from another career choice. this compares to only 2% who said the same in 2006.
35%
30%
25%
20%
15%
10%
5%
0%
those working in internal communications are still more likely to come from pr backgrounds (32%) – although this is marginally less likely than in 2006 (36%). there has been a concurrent drop in those who have moved into internal communications from journalism (3% compared to 8% in 2006).
however, there has been a rise in those who have moved into internal communications from change programme / management roles (14% compared to 9% in 2006).
“i’m seeing a shift away from individuals being recruited for their ability to package messages and more towards those who truly understand the people and behaviour change agenda. it’s that skills-set that is really sought after.”Director of Internal Communications, Manufacturing
32%
10%
17%
4%
10%
3%
14%
2%
9%
pr/external communication
hr
marketing communications
operation
straight from school/college/university
Journalism
change programme/ management
sales
none – internal communications

iC Survey 2008 | Karian and Box
15
Section 3
Team, budget size
and position in the organisation
communication resources
Where does internal communications sit?fig 3.0
0% 5% 10% 15% 20% 25% 30% 35% 40% 45% 50%
hr
corporate communications
marketing communications
operations
other
total private public
22%
20%
28%
44%
32%
18%
10%
25%
13%
19%
10%
3%
4%
5%
respondents were asked in which area of their organisation internal communication is situated. 44% overall said that internal communications is situated in the ‘corporate communications’ function, though this was higher for private sector organisations (47%).
22% of the audience said that their communications department is situated in hr and another 18% said it is situated in marketing communications. some further differences exist between public
and private sector organisations, for example 19% of private organisations manage communications within one of their operational units (compared to 13% overall), and 25% of public sector organisations administer internal communications via the marketing communications function (compared to 18% overall).
47%
16
if respondents had indicated that hr or corporate communications functions currently take the lead on internal communications, they were asked whether they think internal communications ranks high up enough in the hr or corporate communication function’s list of priorities. only 20% of total respondents indicated that they think internal communications is a high enough priority for either hr and pr. this compares with 48% who said that it does not.
Communication resources | team, budget size and position in the organisationSection 3
Who should take the lead in Internal Communications?
fig 3.1
21%54%
7%
18%
Is internal communications high enough up the HR or PR priority list? table 3.0
HR PR Total
Yes 33% 18% 20%
No 43% 52% 48%
Don’t know 24% 30% 32%
dedicated ic unit
pr
hr
other
33% of the audience who said internal communications is managed by hr feel it is a high enough priority for hr. this compares to the 18% of respondents who said it is a high enough priority for corporate communications. this indicates that hr is perceived to be more likely than pr to manage internal communications as a priority.
the audience were invited to comment on which function within an organisation they think, ideally, should take the lead on internal communications. the majority (54%) of respondents said that an independent and dedicated internal communications function and head should take the lead in internal communications. this may be because respondents are aware of the specialised nature of internal communications, the different skill-sets required, and how as a function it can be overlooked and regarded just as an arm of a larger hr, marketing or corporate communications function.
however, one in five (21%) of the audience said that pr should take the lead in internal communications, and 18% said that hr should. these respondents might have insight into the benefits of organising internal communications in this way, perhaps from their own experiences working as communicators within pr or hr functions. it may be that, in their opinion, internal communications managed within a pr function ensures better alignment of internal and external messages, or internal communications administered within a hr function better ensures the delivery of the wider employee engagement agenda.
“hr provides a valuable insight into how communications can best be used to elicit behaviour change and performance. however, many hr professionals don’t have the right skills set to devise communications that ensure messages cut through to the target audiences.”Director of Corporate Affairs, Financial Services
iC Survey 2008 | Karian and Box
17
Section 3
Do you feel that HR is less equipped than PR to deliver effective employee communication?
Can HR impede the delivery of effective internal communications?
fig 3.2 fig 3.3
yes no don’t know
52%48%
38%
30%
10% 22%
the survey asked respondents whether they feel hr is well equipped to deliver effective internal communications (fig 3.2). 52% of respondents said that they think it is, though this means that almost half remain unconvinced.
respondents were also asked whether they feel hr can actually impede the delivery of effective internal communications (fig 3.3). a mixed response surfaced, with 48% saying that this is the case, but 52% disagreeing or being unsure.
it seems questionable whether an hr function with the right individuals in the right roles would be unable to deliver
effective internal communications. opinion on this question may be divided according to the organisational structures respondents currently work within. it may be that those who already sit within hr as communicators (22% of respondents) are more confident about the ability of hr to deliver and have direct experience of an hr function that delivers communications effectively.
it could be that respondents genuinely think that hr professionals are less equipped to perform communications, and the task of delivering effective internal communications should be given to a dedicated team with a different and more
refined skills-set. the focus on employee engagement, behaviour change and the alignment between communications and organisational change can sometimes be alien to communicators who come from a pr background and do not understand the language of employee engagement and involvement. they are more comfortable with the world of defining, packaging and sending messages for organisational leaders. this relates to the professional backgrounds and outlook of many communicators who, thereby, do not see themselves fitting comfortably within an hr function.
“whether internal communications sits in hr or corporate communications matters very little. the key is the relationships people
have. if internal communications sits in hr, then those individuals have to have a very strong working relationship with comms colleagues; and
vice-versa.”HR Director, NHS

18
Communication resources | team, budget size and position in the organisationSection 3
25%
20%
15%
10%
5%
0%
50%
40%
30%
20%
10%
0%under£20,000
£20,000-£50,000
£50,000-£100,000
£100,000-£250,000
£250,000-£500,000
over£500,000
1 to 3 3 to 10 10 to 20 over 20
Internal communication budget spend Internal communication team sizefig 3.4 fig 3.5
Internal communication budget spend by sector Internal communication team size by sectortable 3.1 table 3.2
Public Private Total
Under £20,000 30% 20% 24%
£20,000 - £50,000 20% 15% 17%
£50,000 - £100,000 16% 25% 24%
£100,000 - £250,000 18% 23% 18%
£250,000 - £500,000 3% 7% 7%
over £500,000 3% 11% 10%
Public Private Total
1 to 3 51% 35% 44%
3 to 10 30% 21% 25%
10 to 20 12% 25% 16%
over 20 7% 19% 15%
Internal communication budget spendthe audience indicated that the majority of their internal communications budgets are under £100,000, with 24% under £20,000, 17% between £20,000 and £50,000, and 24% between £50,000 and £100,000. the ic survey 2008 results indicate that budgets for internal communications have actually decreased slightly over the past two years. for example, 24% of respondents in 2006 had communications budgets of £100,000 to £250,000, and this has decreased to 18%. the percentage of respondents whose budgets are under £100,000 has increased from 57% to 65%.
there are some clear differences between private and public sector communications budgets. for example, 11% of private sector organisations have communications budgets of over £500,000, compared to just 3% of public sector organisations. similarly, 30% of public sector organisation communications budgets are under £20,000 compared to 20% of private sector.
it appears that areas of the private sector are scaling back their communications spending; for example, 35% of respondents now say that their communications budget is under £50,000, compared to 23% in 2006. 24% of private sector respondents in 2006 said that their communications budget was over £250,000, and this figure has dropped to 18%. however, public sector communications budgets seem similar to 2006.
Internal communication team size35% of private sector organisations have communications teams of no more than 3 people, and this is also true of 51% of public sector organisations – 44% of total organisations. our survey results suggest that since 2006, there has been an overall reduction in the number of communications teams of over 10 people, a drop from 38% to 31%. it is still evident and, to some extent, expected that communicators in the private sector have access to larger resources; currently 44% of private organisations have communications teams of over 10 people, compared to 19% of public sector organisations.
internal communications team size by the size of the organisation indicate that, the larger the size of the organisation, the larger the communications team is likely to be. however, it is interesting to note that almost a third (30%) of organisations over 30,000 strong have internal communications teams of three individuals or less. this may be due to the assimilation of internal communications roles into larger departments such as marketing communications and corporate communications/pr in larger organisations, or a system of more localised communications executives and one central small communications team.
24%
44%
25%
16% 15%
17%
24%
18%
7%
10%
iC Survey 2008 | Karian and Box
19
Section 3
organisation size (by employee numbers) 1-3 staff 3-10 staff 10-20 staff over 20 staff
Under 250 93% 7% 0% 3%
250 – 1,000 77% 12% 6% 5%
1,000 – 5,000 72% 23% 5% 0%
5,000 – 15,000 50% 31% 11% 8%
15,000 – 30,000 33% 10% 19% 38%
30,000 – 50,000 10% 18% 33% 39%
over 50,000 20% 16% 15% 49%
Internal communication team size by size of organisation
Internal communication budget (excluding staff budget)
table 3.3
table 3.4
some degree of downscaling since 2006 is evident. for example, 49% of organisations with over 50,000 people now have teams of over 20, compared to 55% in 2006. similarly, 39% of organisations with 30,000 – 50,000 people now have teams of over 20 compared with 50% in 2006. similarly the number of small organisations (under 250) who have teams of 1-3 people has increased from 88% to 93%.
the overall picture is that the larger the organisation, the bigger the communications budget is likely to be. however, there is some evidence that budgets have been reduced since 2006. for example, in 2006 almost half (45%) of respondents from organisations of over 50,000 said that their communications budgets were over £500,000, but current figures indicate that organisations of that size are now likely to spend under £500,000 per year. now the percentage of organisations over 50,000 people who have a communications budget of under £100,000 is 17% compared with 12% in 2006.
similarly, the number of smaller organisations of under 250 people saying that their communications budget is less than £20,000 has risen from 66% to 78%.
organisation size Under £20,000
£20,000 – £50,000
£50,000 – £100,000
£100,000 – £250,000
£250,000 – £500,000
Over £500,000
Under 250 78% 11% 13% 0% 0% 0%
250 – 1,000 69% 17% 12% 2% 0% 0%
1,000 – 5,000 29% 24% 22% 15% 10% 0%
5,000 – 15,000 23% 13% 22% 19% 16% 7%
15,000 – 30,000 20% 13% 14% 26% 10% 17%
30,000 – 50,000 18% 15% 23% 22% 20% 2%
over 50,000 8% 3% 6% 38% 19% 26%
20
Roles and responsibilities
roles Section 4
0% 10% 20% 30% 40% 50% 60% 70% 80% 90% 100%
never hardly ever sometimes regularly very regularly
communications operational priority
communicating about competitive / commercial
environment
reinforce brand values
organisational change communications
communicating hr related issues
communicating organisational strategy
and goals
communicating vision and direction
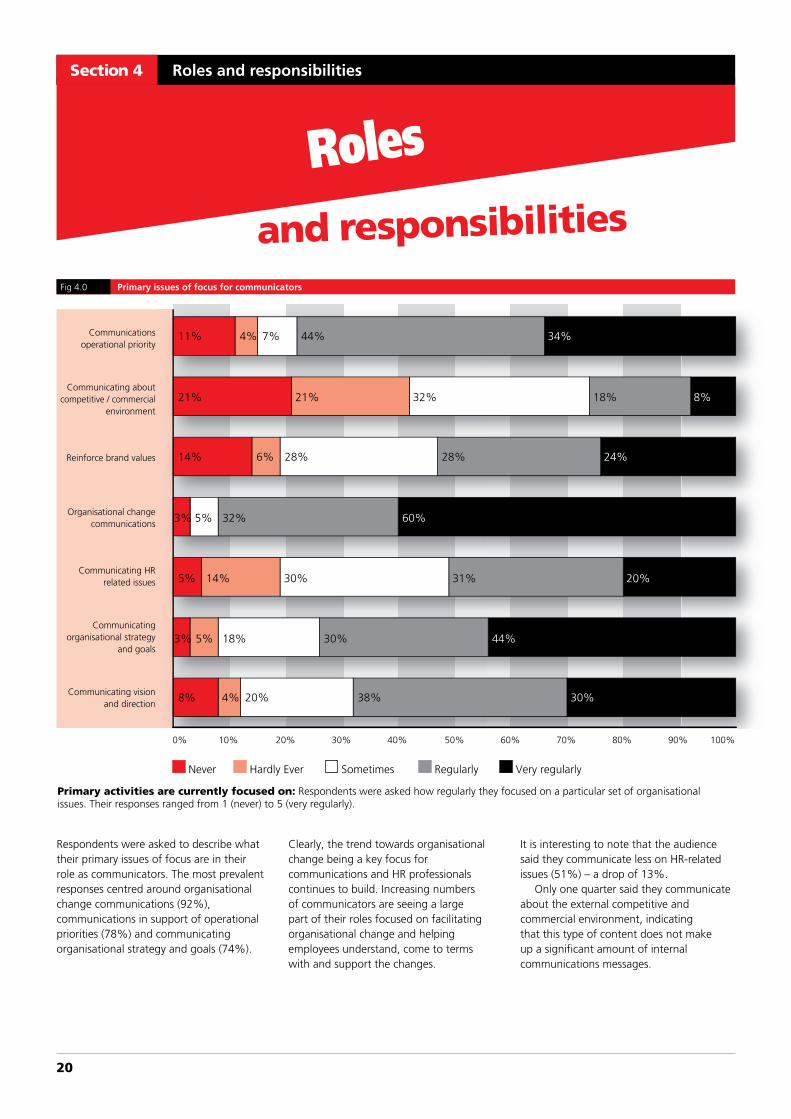
Primary issues of focus for communicatorsfig 4.0
Primary activities are currently focused on: respondents were asked how regularly they focused on a particular set of organisational issues. their responses ranged from 1 (never) to 5 (very regularly).
11%
21% 21% 32% 18% 8%
14% 6% 28% 28% 24%
3% 5% 32% 60%
5% 14% 30% 31% 20%
3% 5% 18% 30% 44%
8% 4% 20% 38% 30%
4% 7% 44% 34%
respondents were asked to describe what their primary issues of focus are in their role as communicators. the most prevalent responses centred around organisational change communications (92%), communications in support of operational priorities (78%) and communicating organisational strategy and goals (74%).
clearly, the trend towards organisational change being a key focus for communications and hr professionals continues to build. increasing numbers of communicators are seeing a large part of their roles focused on facilitating organisational change and helping employees understand, come to terms with and support the changes.
it is interesting to note that the audience said they communicate less on hr-related issues (51%) – a drop of 13%.
only one quarter said they communicate about the external competitive and commercial environment, indicating that this type of content does not make up a significant amount of internal communications messages.
and responsibilities
iC Survey 2008 | Karian and Box
21
and responsibilities
Section 4
0% 10% 20% 30% 40% 50% 60% 70% 80% 90% 100%
no responsibility not much responsibilty some responsibility high responsibility very high responsibilty
strategy development
advising internal clients on internal
communication
advising clients on employee involvement /
engagement activity
campaign development and management
communication planning
measurement and evaluation
managing channels
campaign execution
external supplier management
copywriting
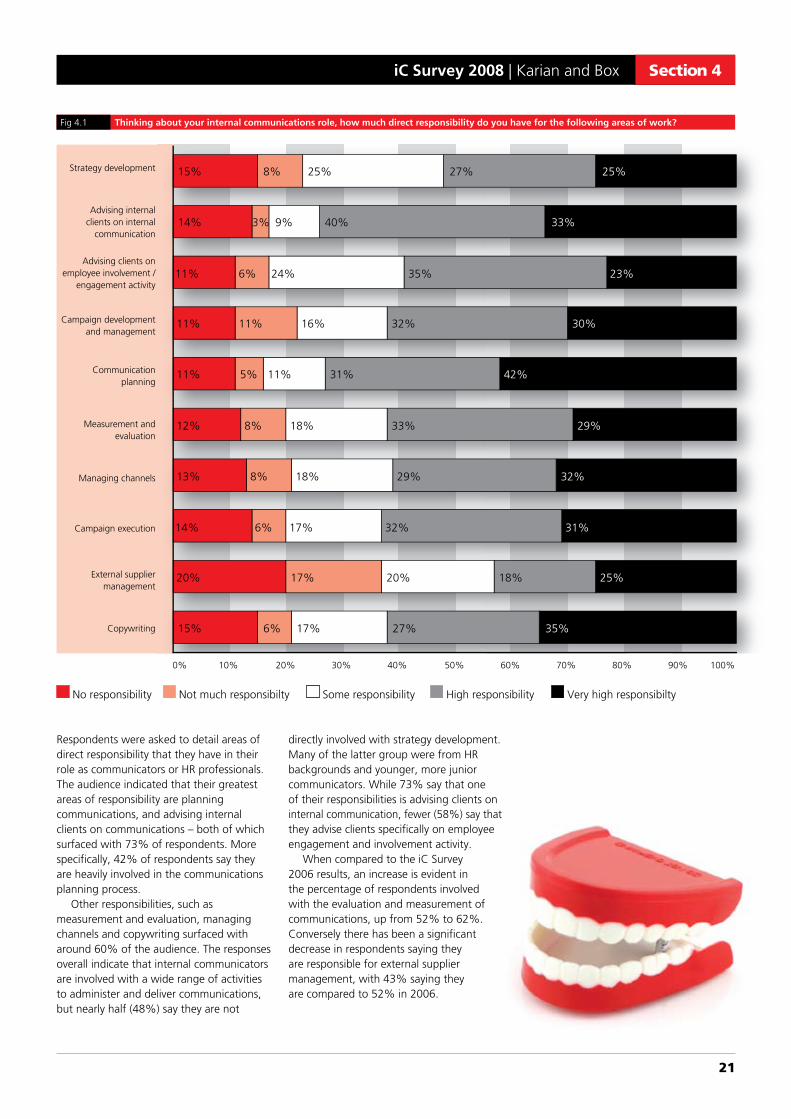
Thinking about your internal communications role, how much direct responsibility do you have for the following areas of work?fig 4.1
15%
14%
11%
11%
11%
12%
13%
14%
20%
15%
8%
3%
6%
11%
5%
8%
8%
6%
17%
6%
25%
9%
24%
16%
11%
18%
18%
17%
20%
17%
27%
40%
35%
32%
31%
33%
29%
32%
18%
27%
25%
33%
23%
30%
42%
29%
32%
31%
25%
35%
respondents were asked to detail areas of direct responsibility that they have in their role as communicators or hr professionals. the audience indicated that their greatest areas of responsibility are planning communications, and advising internal clients on communications – both of which surfaced with 73% of respondents. more specifically, 42% of respondents say they are heavily involved in the communications planning process.
other responsibilities, such as measurement and evaluation, managing channels and copywriting surfaced with around 60% of the audience. the responses overall indicate that internal communicators are involved with a wide range of activities to administer and deliver communications, but nearly half (48%) say they are not
directly involved with strategy development. many of the latter group were from hr backgrounds and younger, more junior communicators. while 73% say that one of their responsibilities is advising clients on internal communication, fewer (58%) say that they advise clients specifically on employee engagement and involvement activity.
when compared to the ic survey 2006 results, an increase is evident in the percentage of respondents involved with the evaluation and measurement of communications, up from 52% to 62%. conversely there has been a significant decrease in respondents saying they are responsible for external supplier management, with 43% saying they are compared to 52% in 2006.
22
Roles and responsibilitiesSection 4
0% 10% 20% 30% 40% 50% 60% 70% 80% 90% 100%
strongly disagree disagree neither agree nor disagree agree strongly agree
i am satisfied with the role i am in
i feel valued as a member of my team
i receive the training and coaching i need to
improve in my role
i am trusted and empowered to do my
job by my line manager
i am able to influence my internal clients
i believe i am adding value to the business
i believe in the vision and values of my
organisation
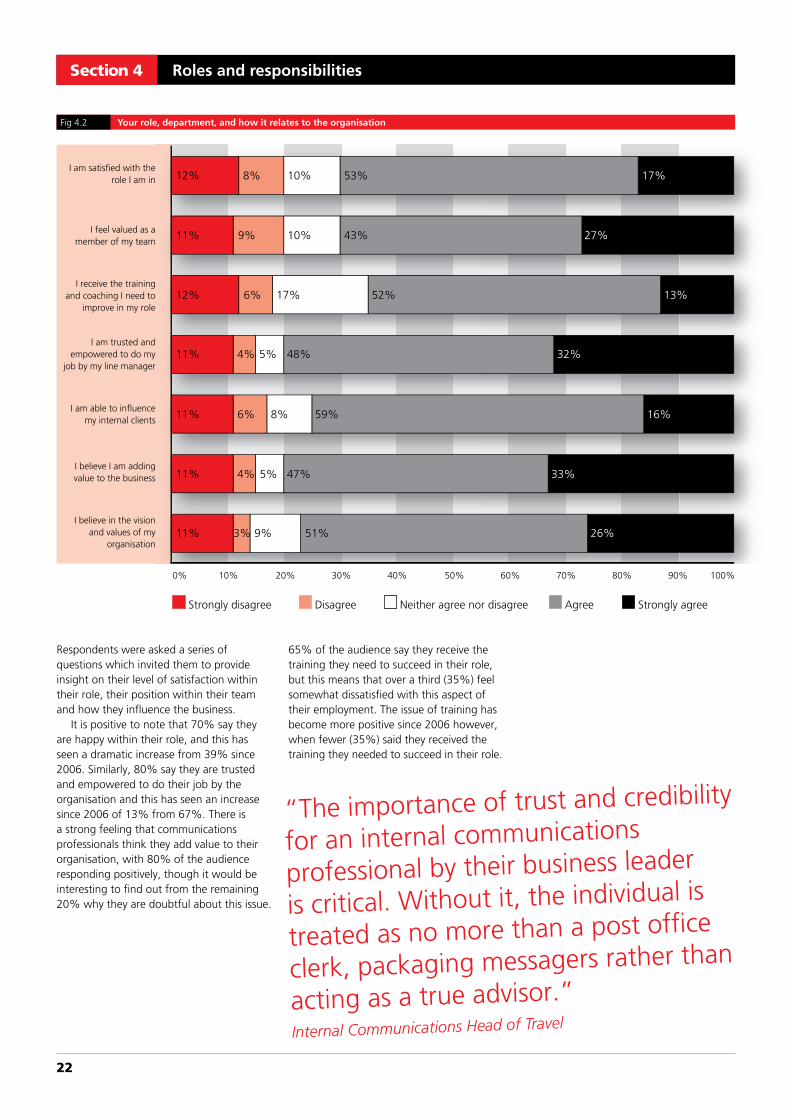
Your role, department, and how it relates to the organisationfig 4.2
12%
11%
12%
11%
11%
11%
11%
8%
9%
6%
4%
6%
4%
3%
10%
10%
17%
5%
8%
5%
9%
53%
43%
52%
48%
59%
47%
51%
17%
27%
13%
32%
16%
33%
26%
respondents were asked a series of questions which invited them to provide insight on their level of satisfaction within their role, their position within their team and how they influence the business.
it is positive to note that 70% say they are happy within their role, and this has seen a dramatic increase from 39% since 2006. similarly, 80% say they are trusted and empowered to do their job by the organisation and this has seen an increase since 2006 of 13% from 67%. there is a strong feeling that communications professionals think they add value to their organisation, with 80% of the audience responding positively, though it would be interesting to find out from the remaining 20% why they are doubtful about this issue.
65% of the audience say they receive the training they need to succeed in their role, but this means that over a third (35%) feel somewhat dissatisfied with this aspect of their employment. the issue of training has become more positive since 2006 however, when fewer (35%) said they received the training they needed to succeed in their role.
“the importance of trust and credibility
for an internal communications
professional by their business leader
is critical. without it, the individual is
treated as no more than a post office
clerk, packaging messagers rather than
acting as a true advisor.”Internal Communications Head of Travel

iC Survey 2008 | Karian and Box
23
Section 4
respondents were asked a number of questions around the relationship between their organisation’s communications function and the organisation’s leadership. it is positive that 75% of the audience said that they feel trusted and empowered to do their role by their organisation’s leadership. the majority (62%) also say that internal communications are valued by their organisation’s leadership.
when asked whether internal communications is actively involved with shaping and planning the organisation’s key messages, 62% responded positively, though it is of some concern that 38% say that they are not, as communicators, involved in deciding the organisation’s messages.
answers to other questions suggest that some distance exists between communications functions and organisational leadership in the way communications are planned and managed. for example, 52% either disagree or are unsure whether their leadership get involved in shaping communications strategy, and 50% disagree or are unsure whether their leadership provide input into communications planning and messages. 47% are unconvinced that their organisation’s leadership understand what effective internal communications looks like and can achieve.
the overall picture is that while this audience feels valued in their role, the level of interaction and understanding between communicators and leadership teams may not be enough to ensure that both are on the same page when it comes to aligning business priorities with the right messages.
0% 10% 20% 30% 40% 50% 60% 70% 80% 90% 100%
strongly disagree disagree neither agree nor disagree agree strongly agree
internal communication is valued by my
organisation’s leadership
the internal communications team
is actively involved in shaping and planning the organisation’s key
messages
my organisation’s leadership gets
involved in shaping our communications strategy
my organisation’s leadership gets
involved in shaping our communications
planning and messages
i am trusted and empowered to do my
job by my organisation’s leadership
my organisation’s leadership understands what effective internal communications looks
like and can achieve
Internal communications and your organisation’s leadershipfig 4.3
11%
11%
11%
11%
11%
11%
10%
15%
17%
12%
4%
15%
17%
12%
24%
27%
10%
21%
45%
45%
35%
39%
55%
38%
17%
17%
13%
11%
20%
15%

24
Communicating | organisational strategySection 5
Organisational strategy
communicating
0% 10% 20% 30% 40% 50% 60% 70% 80% 90% 100%
strongly disagree disagree neither agree nor disagree agree strongly agree
change and uncertainty are big factors
we manage change communications well in
my organisation
we engage and involve people in change in my
organisation
people adapt well to change in my
organisation
Change within my organisation fig 5.0
11%
13%
12%
12%
7%
13%
18%
24%
9%
31%
24%
36%
44%
37%
37%
1%
29%
6%
9%
27%
respondents were asked a series of questions about the impact of change in their organisation. for 73% of the audience, change and uncertainty are big factors in their organisation, reflecting the rapidly changing external and internal environments communicators have to respond to. the response to this question is very similar to the ic survey 2006 result (70%), indicating that change is still firmly high on the agenda for both public and private sector audiences.
43% of respondents say that change is managed well in their organisation, an increase from 29% in 2006. however, this means that 57% are still doubtful whether
prevalent change is managed well overall in their organisation. similarly, 54% of respondents either disagree or are unsure whether people in their organisations get involved with the process of change.
as a result, it is perhaps unsurprising that just 28% say that people in their organisations adapt well to change, given that the majority of the audience say that change is not managed well and people are not involved with the process. a high number (36%) are unsure whether people in their organisations adapt well to change. this may be because they have no definite way of knowing (with an informal or
formally designed system of measurement) what the impact of change communications have on their organisation’s audience.
“change is still
firmly high on the
agenda for both
public and private
sector audiences”

iC Survey 2008 | Karian and Box
25
Section 5Section 5
70%
60%
50%
40%
30%
20%
10%
0%
What are the key issues for your organisation now and in the near future?
fig 5.1
introducing new technology
market/industry changes affecting your organisation
focus on reducing costs
growing your organisation’s revenue/sales
geographical expansion
mergers/acquisitions
employer brand and culture change
organisational restructuring
other
32%
40%
61%
36%
19%
15%
59%
53%
13%
when asked which issues their organisation face, in terms of change, now and in the near future, 61% said that a focus on reducing costs will feature highly. cost was a pre-occupation evident in the ic survey 2006 – particularly in private sector organisations. this focus has become more prevalent and is likely to rise in importance given the current market and business climates. 53% of the audience also said they face issues to do with organisational restructuring, 19% on geographical expansion and a further 15% on mergers and acquisitions.
whilst 59% of respondents said employer brand and culture change are high on the agenda, this has seen a significant decrease from 77% in 2006. it is also comparable with the answer given earlier (fig 4.0), where 52% of respondents said they are working on activity related to reinforcing brand values.
the shift away from culture-focused communications suggests that communicators are more focused on delivering informational communications which centre around an organisation’s immediate and changing priorities and are spending less time shaping longer-term cultural change.

26
Communicating | organisational strategySection 5
Is your organisational strategy in a story or narrative form that acts as a basis for your internal communications messaging?
fig 5.2
yes
no
not sure
61%
33%
6%
respondents were asked whether their organisational strategy is in a narrative or story form that act as a basis for their internal communications messaging.
the audience responded negatively, with 61% saying that they have no story or narrative in place, and a further 6% saying they are unsure. the results are similar to ic survey 2006, where 52% previously said that they did not organise their communications around a strategic narrative or story, and a further 30% were unsure.
it is surprising that many organisations do not still use a central narrative or story to help communicate their strategic priorities, particularly given the type of issues – restructuring, cost control, expansion, and mergers and acquisitions – they face. it is suggestive of a more adhoc and reactive approach to managing internal communications messages. a central narrative would help to organise the key messages in a simple, compelling way which can be applied across all communications.
“having a story at the
heart of communications
has helped us keep our
messages consistent. it
has also given me and
my team a clear roadmap
for what we should be
communicating to specific
audience groups.”
Head of Communications, Utilities

iC Survey 2008 | Karian and Box
27
Section 6
Planning
Does your organisation have a plan which shows communications activity over the coming year?
fig 6.0
yes
no
not sure
23%
73%
4%
Does your organisation’s communications plan integrate communications activity from other parts of the organisation?
How often are your plans reviewed?
fig 6.1 fig 6.2
yes
no
not sure
annually
half yearly
Quarterly
other
31%23%62%
37%
7%15%
25%
73% say that their organisation has a communications plan which shows communications activity over the coming year, with a quarter (27%) saying they do not or are unsure. this is broadly similar to the ic survey 2006 results, where 78% said they had a communications plan for the year, though this was higher for private sector organisations.
however, when asked whether their organisation’s strategic communications plan integrates communications activity from other parts of the organisation, only 62% were confident that it does. this indicates that although the majority of the audience work with a yearly communications plan, it does not necessarily align with or incorporate all communications activity happening across the organisation.
when it comes to the regularity of reviewing organisational communications plans, 37% say that they are reviewed annually, and a further 25% say they are reviewed half yearly. of the 15% of ‘other’ responses, many of these indicated that plans are reviewed ‘as and when’ or on an ad hoc basis. this approach to infrequent plan evaluation shows little change since 2006. the ic survey 2006 results reflected that most organisations, particularly in the public sector, tend to review their communication plans and processes annually (38% of total responses), or half yearly (27%). in 2006, only 6% of respondents said that their organisation reviews their communications plans on an ad hoc, as required, or continual basis.
your communication
“the communications planning process, aligned with the business planning process, is one of the most critical drivers for whether your communications activity is successful.”Head of Communications, Local Authority

28
Section 6 Planning your communication
80%
70%
60%
50%
40%
30%
20%
10%
0%
Who has access to your organisation’s communication plan?fig 6.3 central communications team
the board or leadership team
senior managers in the organisation
change initiative/programme managers
local communications or hr teams
members of the communications team that are of managerial/directorial level
other stake holders
74% 75%
67%
41%
48%
44%
34%
respondents were asked who in their organisation has access to their organisation’s communication plan. as might be expected, 74% say that their central communications team have access (which is similar to the percentage of those who say their organisation has a communications plan), 75% say that their organisation’s leadership team have access, and 67% say that senior managers have access to it. as such, it is evident that a significant minority of key stakeholders, such as senior management and leadership are not accessing their organisation’s central communications plan.
only 41% of the audience say that their communications plan is available to change initiative and programme managers, and under half (48%) say that it is available to local communications or hr teams. it is likely therefore that central communications plans are not shared with all of those who may be involved in managing key communications activity, shaping messages and instigating change.
it is not apparent from these results whether central communications plans are shared with all members of communications teams, such as those occupying more junior positions.
“who has access to your plans is an indication
of whether your organisation’s communicators are
integrated. without input and access from colleagues
across the business, a great central plan becomes
meaningless if everyone else is up to their own thing.”
Head of Internal Communications, FMCG

iC Survey 2008 | Karian and Box
29
Section 6
0% 10% 20% 30% 40% 50% 60% 70% 80% 90% 100%
strongly disagree disagree neither agree nor disagree agree strongly agree
we have a communications plan
that is adaptable to changing organisational
priorities
we have a communications plan
that details target audiences, timing and
channels
our communications plans are focused on the organisation’s key goals
for the coming year
Communications planning focus and adaptabilityfig 6.4
13%
12%
12%
8%
11%
4%
12%
13%
12%
51%
41%
45%
16%
23%
27%
the ic survey 2008 results show that whilst 71% of the audience say that their communications plans focus on their organisation’s key goals for the coming year, slightly fewer (67%) say that their communications plans are adaptable to changing organisational priorities. this means that about one third (33%) of the audience are working on communications plans that are focused on a current set of priorities, but may not be adaptable enough to respond to imminent organisational change or a different set of priorities. however, the number of respondents saying that their communications plans focus on their organisation’s key goals has risen by 27% from 44% in 2006. this indicates that long-term planning proccess have become more prevalent in organisations over the past couple of years.
Just 64% of respondents say that they have a communications plan which details target audiences, timing and channels.

30
Measuring impact of communication
MeasuringSection 7
0% 10% 20% 30% 40% 50% 60% 70% 80% 90% 100%
strongly disagree disagree neither agree nor disagree agree strongly agree
we regularly measure the impact of
communications
we only measure employee satisfaction/
engagement every year or two
my organisation includes employee satisfaction/
engagement in line manager competencies
Frequency of communications measurementfig 7.0
9%
16%
15%
35%
23%
42%
16%
11%
18%
31%
43%
20%
9%
7%
5%
the audience was asked about the frequency of measurement of communications impact in their organisations. 40% said that they ‘regularly’ measure the impact of communications on awareness and understanding of business priorities (down 5% since 2006). however, 50% say that employee satisfaction and engagement is measured every year or two.
only 25% of the audience say that employee satisfaction and engagement is definitely included in their line manager
competencies. interestingly, this has seen a major decrease from the ic survey 2006, where 53% of respondents said that employee engagement objectives were included in line manager objectives.
these results indicate that measurement is still not a fact of life when it comes to managing internal communications. it is still patchy in its application and focused predominantly on annual or biennial set-piece engagement surveys – which do not give a regular picture of what employees are
thinking, saying and doing in relation to the organisation’s priorities.
the fact that 38% of communicators say (earlier in this report) that they are not significantly involved in activity around communications measurement compounds this lack of focus on measurement.
impact of communication
iC Survey 2008 | Karian and Box
31
Section 7
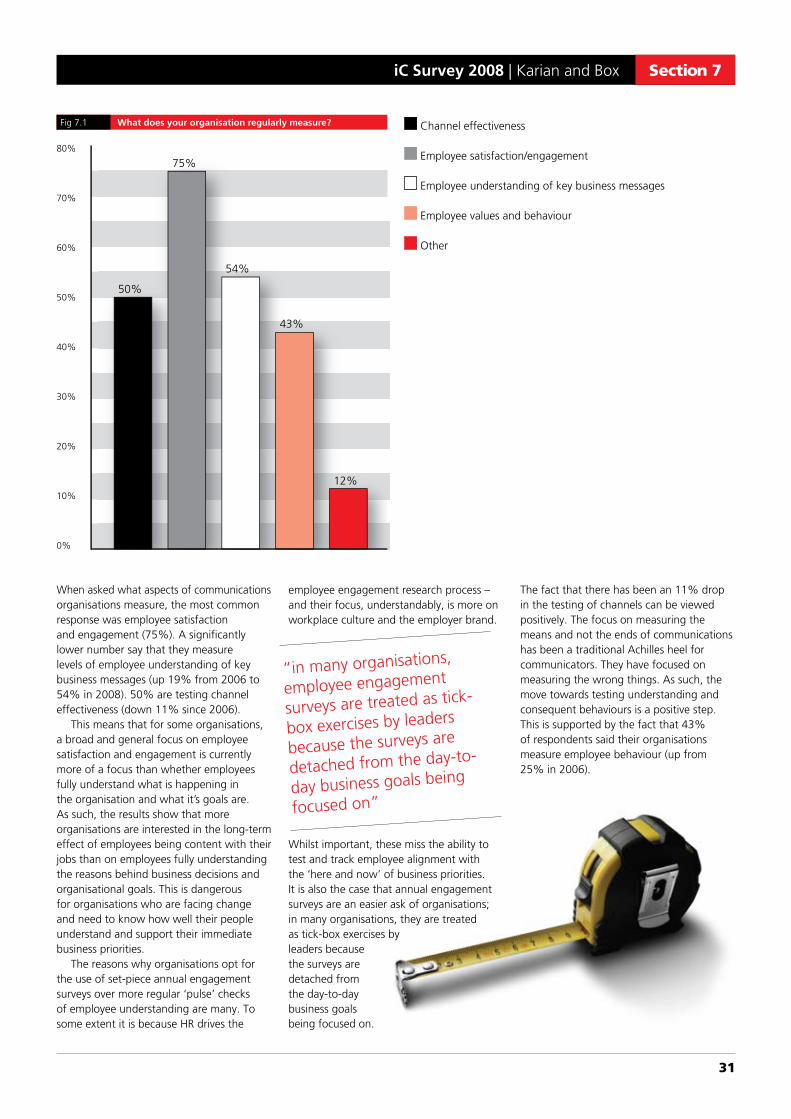
when asked what aspects of communications organisations measure, the most common response was employee satisfaction and engagement (75%). a significantly lower number say that they measure levels of employee understanding of key business messages (up 19% from 2006 to 54% in 2008). 50% are testing channel effectiveness (down 11% since 2006).
this means that for some organisations, a broad and general focus on employee satisfaction and engagement is currently more of a focus than whether employees fully understand what is happening in the organisation and what it’s goals are. as such, the results show that more organisations are interested in the long-term effect of employees being content with their jobs than on employees fully understanding the reasons behind business decisions and organisational goals. this is dangerous for organisations who are facing change and need to know how well their people understand and support their immediate business priorities.
the reasons why organisations opt for the use of set-piece annual engagement surveys over more regular ‘pulse’ checks of employee understanding are many. to some extent it is because hr drives the
employee engagement research process – and their focus, understandably, is more on workplace culture and the employer brand.
whilst important, these miss the ability to test and track employee alignment with the ‘here and now’ of business priorities. it is also the case that annual engagement surveys are an easier ask of organisations; in many organisations, they are treated as tick-box exercises by leaders because the surveys are detached from the day-to-day business goals being focused on.
the fact that there has been an 11% drop in the testing of channels can be viewed positively. the focus on measuring the means and not the ends of communications has been a traditional achilles heel for communicators. they have focused on measuring the wrong things. as such, the move towards testing understanding and consequent behaviours is a positive step. this is supported by the fact that 43% of respondents said their organisations measure employee behaviour (up from 25% in 2006).
80%
70%
60%
50%
40%
30%
20%
10%
0%
What does your organisation regularly measure?fig 7.1 channel effectiveness
employee satisfaction/engagement
employee understanding of key business messages
employee values and behaviour
other
50%
75%
54%
43%
12%
“in many organisations,
employee engagement
surveys are treated as tick-
box exercises by leaders
because the surveys are
detached from the day-to-
day business goals being
focused on”
32
Measuring impact of communicationSection 7
50%
45%
40%
35%
30%
25%
20%
15%
10%
5%
0%
50%
45%
40%
35%
30%
25%
20%
15%
10%
5%
0%
How often do you conduct all employee satisfaction/engagement surveys?
How often do you conduct employee ‘pulse’ surveys of understanding and opinion?
fig 7.2
fig 7.3
Quarterly
half yearly
annually
once every two years
never
other
Quarterly
half yearly
annually
once every two years
never
other
8%
20%
8%
14%
43%
8%
30%
0%
5%
46%
3%
9%
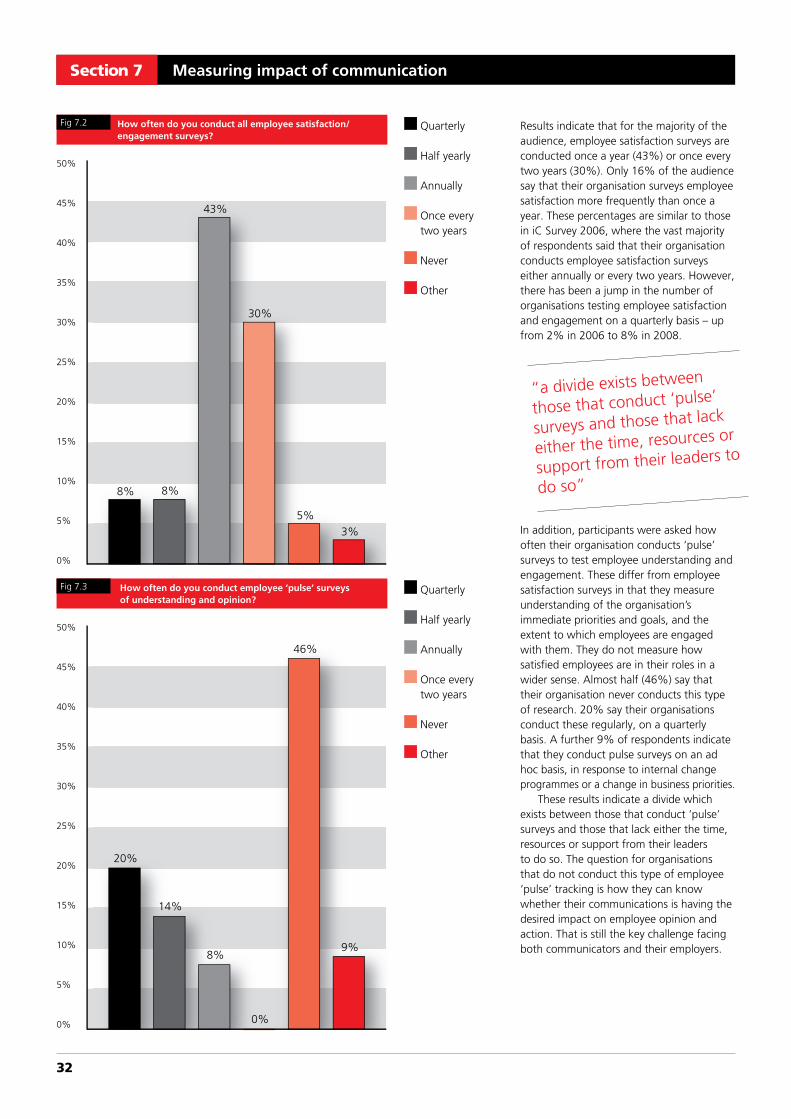
results indicate that for the majority of the audience, employee satisfaction surveys are conducted once a year (43%) or once every two years (30%). only 16% of the audience say that their organisation surveys employee satisfaction more frequently than once a year. these percentages are similar to those in ic survey 2006, where the vast majority of respondents said that their organisation conducts employee satisfaction surveys either annually or every two years. however, there has been a jump in the number of organisations testing employee satisfaction and engagement on a quarterly basis – up from 2% in 2006 to 8% in 2008.
in addition, participants were asked how often their organisation conducts ‘pulse’ surveys to test employee understanding and engagement. these differ from employee satisfaction surveys in that they measure understanding of the organisation’s immediate priorities and goals, and the extent to which employees are engaged with them. they do not measure how satisfied employees are in their roles in a wider sense. almost half (46%) say that their organisation never conducts this type of research. 20% say their organisations conduct these regularly, on a quarterly basis. a further 9% of respondents indicate that they conduct pulse surveys on an ad hoc basis, in response to internal change programmes or a change in business priorities.
these results indicate a divide which exists between those that conduct ‘pulse’ surveys and those that lack either the time, resources or support from their leaders to do so. the question for organisations that do not conduct this type of employee ‘pulse’ tracking is how they can know whether their communications is having the desired impact on employee opinion and action. that is still the key challenge facing both communicators and their employers.
“a divide exists between
those that conduct ‘pulse’
surveys and those that lack
either the time, resources or
support from their leaders to
do so”

iC Survey 2008 | Karian and Box
33
Section 7
0% 10% 20% 30% 40% 50% 60% 70% 80% 90% 100%
strongly disagree disagree neither agree nor disagree agree strongly agree
after each employee engagement survey
is conducted, our organisation’s leadership review business decisions in light of survey results
after each employee engagement survey is
conducted, line managers are tasked with taking action to deal with employees’
concerns and improve employee engagement
we feed back the information gained from employee surveys quickly
and effectively to our senior leaders
we feed back the information gained from employee surveys quickly
and effectively to our employees
we conduct action-planning at all levels of the organisation
following employee satisfaction/engagement
surveys
How results of employee engagement surveys are usedfig 7.4
14%
12%
13%
12%
14%
8%
19%
8%
13%
22%
24%
20%
15%
22%
19%
42%
34%
45%
35%
35%
12%
15%
19%
18%
11%
64% of the audience said that they feed back the information gained from employee engagement surveys quickly and effectively to their senior leaders, and 54% say that, their senior leaders review business decisions in light of the results. therefore, for the
majority of respondents, senior leaders play an active role in their organisation’s employee survey process. however, it is somewhat worrying that 36% do not
feedback the results quickly or effectively to their leaders and, more worrying, that 46% do not review business decisions as a result of what their employees have told them. this fact is one that goes some way to explaining why many employees, when asked, do not view the process of surveying as a genuine listening one. anecdotal evidence highlights the view amongst many employees who see employee engagement surveys as tick-box exercises by leaders. organisations are supposed to listen to their people and hence they run surveys. do the leaders do anything with the results? ic survey 2008 highlights the sad fact that only half say they do.
in addition, respondents indicated that some organisations are less diligent about feeding back the information gained from employee engagement surveys to the employees. only 53% said their organisations did this quickly and effectively.
this can be because organisations overlook the requirement to feedback what employees said, which is a critical part of the listening process. others may be reticent or embarrassed by feeding back what could be negative results from their surveys. many organisations will often provide anodyne summaries of their engagement results to employees which gloss over the more negative feedback.“some organisations are
less diligent about feeding
back the information gained
from employee engagement
surveys back to the
employees”
34
Measuring impact of communicationSection 7
80%
70%
60%
50%
40%
30%
20%
10%
0%
When running employee surveys, which of the following methods have you used in the past 12 months?
fig 7.5 online surveys
paper surveys
telephone surveys
face-to-face/focus groups
other
80%
43%
14%
58%
40%
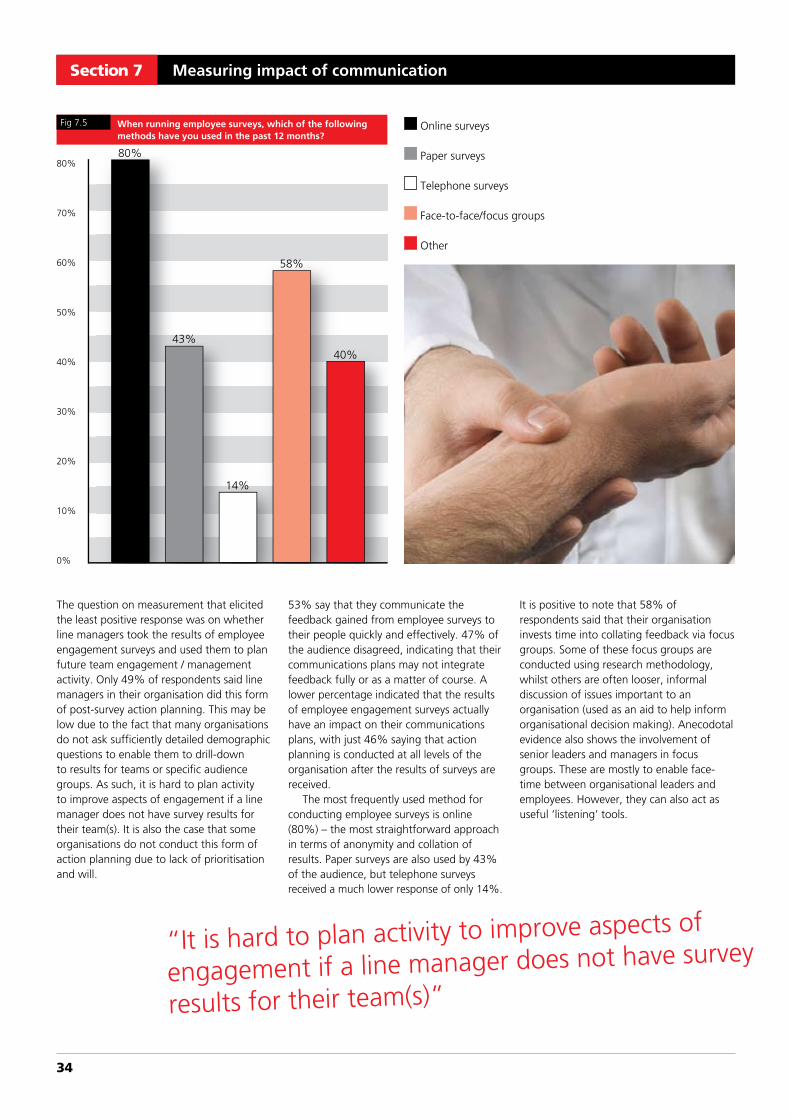
the question on measurement that elicited the least positive response was on whether line managers took the results of employee engagement surveys and used them to plan future team engagement / management activity. only 49% of respondents said line managers in their organisation did this form of post-survey action planning. this may be low due to the fact that many organisations do not ask sufficiently detailed demographic questions to enable them to drill-down to results for teams or specific audience groups. as such, it is hard to plan activity to improve aspects of engagement if a line manager does not have survey results for their team(s). it is also the case that some organisations do not conduct this form of action planning due to lack of prioritisation and will.
53% say that they communicate the feedback gained from employee surveys to their people quickly and effectively. 47% of the audience disagreed, indicating that their communications plans may not integrate feedback fully or as a matter of course. a lower percentage indicated that the results of employee engagement surveys actually have an impact on their communications plans, with just 46% saying that action planning is conducted at all levels of the organisation after the results of surveys are received.
the most frequently used method for conducting employee surveys is online (80%) – the most straightforward approach in terms of anonymity and collation of results. paper surveys are also used by 43% of the audience, but telephone surveys received a much lower response of only 14%.
it is positive to note that 58% of respondents said that their organisation invests time into collating feedback via focus groups. some of these focus groups are conducted using research methodology, whilst others are often looser, informal discussion of issues important to an organisation (used as an aid to help inform organisational decision making). anecodotal evidence also shows the involvement of senior leaders and managers in focus groups. these are mostly to enable face-time between organisational leaders and employees. however, they can also act as useful ‘listening’ tools.
“it is hard to plan activity to improve aspects of
engagement if a line manager does not have survey
results for their team(s)”

iC Survey 2008 | Karian and Box
35
“it is hard to plan activity to improve aspects of
engagement if a line manager does not have survey
results for their team(s)”
Section 8
Leadership and communication
Does your organisation have a channel for employees to give the top team direct feedback?
fig 8.0
yes no don’t know
68%
27%
5%
the audience was asked whether a channel exists for employees to give the top team direct feedback. 68% of respondents said that this is the case in their organisation. when compared to the ic survey 2006 results, the picture is very similar with only a slight increase evident. in 2006, 63% overall said that such a channel existed, though this was slightly higher for private sectors organisations (67%) and slightly lower for public and ngo organisations (58% and 56% respectively).
45% of the audience say that their leadership are involved in one-way mass briefings, such as large conferences, and this number is unchanged since 2006. a similar number (42%) say their leaders are involved in two way communications, and this is also similar to the 2006 results (46%).
furthermore, face-to-face leadership communications are more likely to be informal than structured, with 29% saying that their leaders participate in uncontrolled face-to-face interaction, compared with 14% that say it is controlled and structured.
0% 10% 20% 30% 40% 50% 60% 70% 80% 90% 100%
never hardly ever sometimes regularly very regularly
one way: eg. large conferences,
mass briefings
two way: eg. small group
discussions
controlled: eg. focus groups
uncontrolled: eg. ‘walk-the-shop-floor’
discussions
online/media based briefings/discussions
themed, informal group discussions such as
‘Brown Bag’ lunches
15%
20%
14%
14%
35%
35%
10%
29%
14%
25%
14%
23%
30%
37%
30%
32%
28%
21%
39%
13%
32%
23%
18%
18%
6%
1%
10%
6%
5%
3%
What kind of face-to-face communications are your organisation’s leadership regularly involved in?fig 8.1

36
Leadership and communicationSection 8
60%
50%
40%
30%
20%
10%
0%
What kind of channel do you use to enable direct feedback between employees and the organisation’s leadership?
fig 8.2 personal email address of organisations leadership members
dedicated/generic email address
dedicated hotline open Q&a sessions
feedback via line managers
other
43%
29%
59%
12%
41%
respondents were asked to detail the types of channels available to employees to communicate with the organisation’s leadership. responses indicate that in most organisations, more than one means of communication with leadership is available for employees.
the channel which surfaced most frequently is upwards feedback via line management (59%). this is, of course, a less formal mechanism which relies on the commitment of both employees and layers of line management to make it happen. there is a strong chance that this indirect and less formal channels are not the best means of feeding back messages to the relevant leaders all of the time.
email communication is also a common channel for contact with senior leaders – 43% say that the personal email address of their organisation’s leadership can be used for feedback, and 29% say that email is sent to a generic and dedicated mailbox for their senior leaders.
of the other responses received, 21% included suggestion boxes, feedback via the staff magazine, online message boards, and even a handful of chief executive blogs. these responses indicate that some organisations are seeking new and innovative ways to facilitate interaction between their employees and leadership.
44% of other responces indicated that their organisations provide face-to-face opportunities for employees to give feedback direct to leaders – for example, in the form of focus groups, town hall meetings, and open Q&a sessions.25% of the audience said that their senior leaders communicate with employees on a monthly basis, 18% on a quarterly basis, and 16% half yearly. overall, 67% of the audience indicated that they interact with their leadership once a month or less. this is a more positive picture to the 2006 results. however, where 89% of respondents said that they interact with their leadership face-to-face once a month or less. 22% of the audience now say that they interact with their leadership face-to-face more than once a month, compared with 11% in 2006.
25%
20%
15%
10%
5%
0%
How often does your organisation’s leadership actively communicate face to face with employees across your organisation?
fig 8.3 more than once a week
weekly
fortnightly
monthly
Quarterly
half yearly
less than once every 6 months
annually
don’t know
other 10%
7%
5%
25%
18%
16%
3%
5%
7%
1%
“less formal channels are not
the best means of feeding
back messages to the relevant
leaders all of the time”
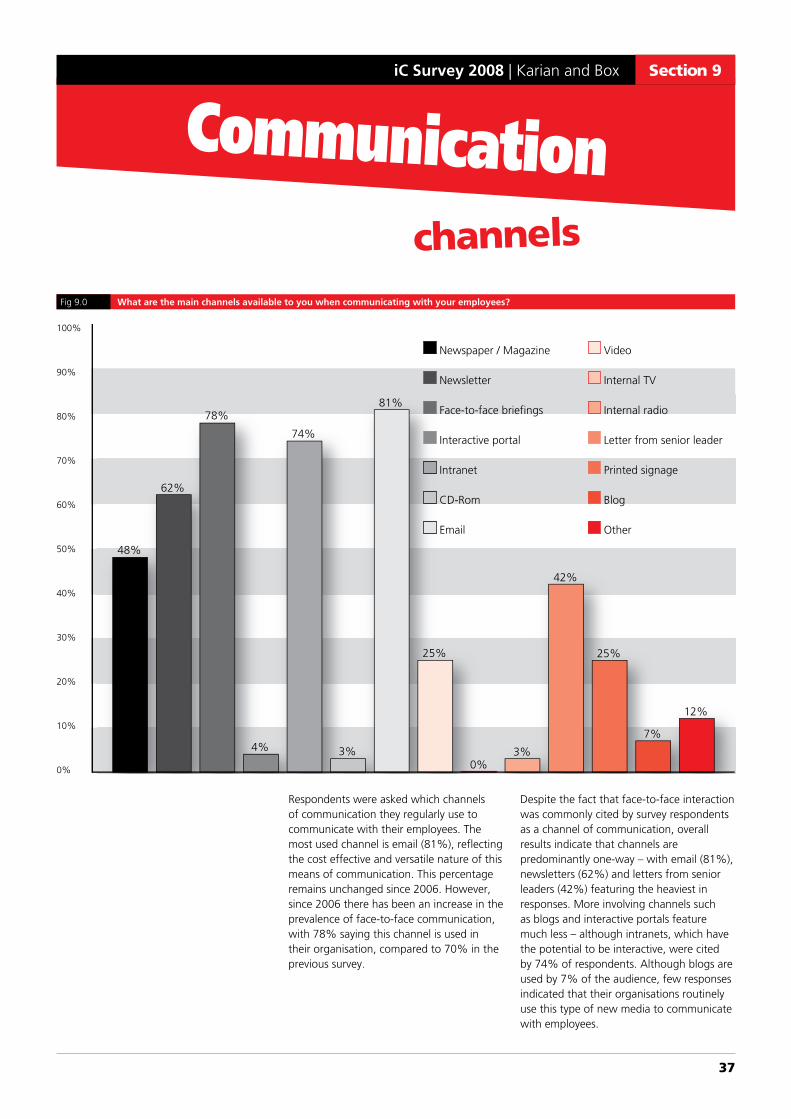
iC Survey 2008 | Karian and Box
37
Section 9
channels
communication
What are the main channels available to you when communicating with your employees?fig 9.0
100%
90%
80%
70%
60%
50%
40%
30%
20%
10%
0%
48%
62%
78%
74%
81%
4% 3%
25%
0%3%
42%
25%
7%
12%
newspaper / magazine
newsletter
face-to-face briefings
interactive portal
intranet
cd-rom
video
internal tv
internal radio
letter from senior leader
printed signage
Blog
other
respondents were asked which channels of communication they regularly use to communicate with their employees. the most used channel is email (81%), reflecting the cost effective and versatile nature of this means of communication. this percentage remains unchanged since 2006. however, since 2006 there has been an increase in the prevalence of face-to-face communication, with 78% saying this channel is used in their organisation, compared to 70% in the previous survey.
despite the fact that face-to-face interaction was commonly cited by survey respondents as a channel of communication, overall results indicate that channels are predominantly one-way – with email (81%), newsletters (62%) and letters from senior leaders (42%) featuring the heaviest in responses. more involving channels such as blogs and interactive portals feature much less – although intranets, which have the potential to be interactive, were cited by 74% of respondents. although blogs are used by 7% of the audience, few responses indicated that their organisations routinely use this type of new media to communicate with employees.

38
Communication channelsSection 9
Do you have a process for communications team briefings?
Are these team briefings mandatory?
fig 9.1 fig 9.2
yes no not sure yes no not sure
71%
40%25%
46%
4%14%
the majority (71%) say that their organisation has a process for team briefings in place, though this displays an interesting decrease from 81% in 2006. this may reflect the fact that team briefings, are in reality quite difficult to make happen. it may also be that organisations have replaced these with other means of communication between colleagues, such as emails or conference calls. it is interesting to note that team briefings seemingly happen less frequently yet face-to-face communication is more common as a channel of communication. it may be that although face-to-face communication is preferred as a channel of communication between colleagues, it tends to take place as informal catch-ups or quick individual briefings as opposed to organised and formally scheduled team meetings.
although 71% of respondents said that there is a team briefing process in place in their organisation, only 40% of respondents said they have one that is mandatory. with the majority (60%) of respondents saying that employees in their organisation are not obliged to attend team briefings, it is perhaps unsurprising that there has been a decrease in respondents saying that their organisation has team briefing processes. it also casts doubt on the efficacy of line management communication and messages cascading down from leaders if team briefing processes are not adhered to strictly.
when asked what topics are covered during team meetings, most responses centred around issues currently impacting the organisation and those of priority from a business perspective. 67% said organisational news and information were covered, whilst 54% said organisational strategy and goals were discussed – this has increased significantly from 40% since 2006.
there is slightly less of an emphasis on team targets and progress which has fallen from 53% in 2006 to 48%. similarly, team recognition and reward was cited by only 22% of the audience in this survey, compared with 30% in 2006. only one third (33%) say that team briefings are used to train the team and give people direction, and only 30% say that team briefings are used to share best practice. it appears that team briefing time is now slightly more likely to be spent discussing business-critical
issues and priorities than focusing on building the team and the needs of
its members. this is unsurprising at a time when many
organisations are having to give a more determined focus to business-critical issues affecting the organisation and its employees.
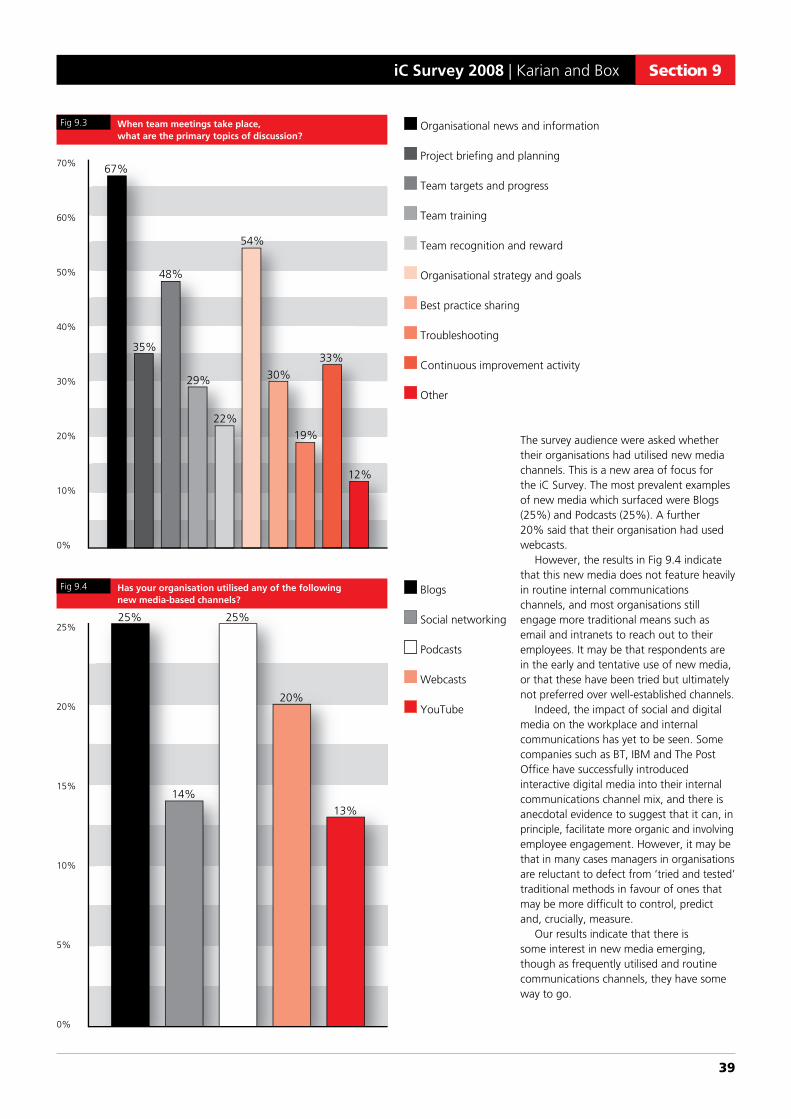
iC Survey 2008 | Karian and Box
39
Section 9
70%
60%
50%
40%
30%
20%
10%
0%
When team meetings take place, what are the primary topics of discussion?
fig 9.3 organisational news and information
project briefing and planning
team targets and progress
team training
team recognition and reward
organisational strategy and goals
Best practice sharing
troubleshooting
continuous improvement activity
other
67%
35%
48%
29%
22%
54%
30%
19%
33%
12%
25%
20%
15%
10%
5%
0%
Has your organisation utilised any of the following new media-based channels?
fig 9.4 Blogs
social networking
podcasts
webcasts
youtube
25%
14%
25%
20%
13%
the survey audience were asked whether their organisations had utilised new media channels. this is a new area of focus for the ic survey. the most prevalent examples of new media which surfaced were Blogs (25%) and podcasts (25%). a further 20% said that their organisation had used webcasts.
however, the results in fig 9.4 indicate that this new media does not feature heavily in routine internal communications channels, and most organisations still engage more traditional means such as email and intranets to reach out to their employees. it may be that respondents are in the early and tentative use of new media, or that these have been tried but ultimately not preferred over well-established channels.
indeed, the impact of social and digital media on the workplace and internal communications has yet to be seen. some companies such as Bt, iBm and the post office have successfully introduced interactive digital media into their internal communications channel mix, and there is anecdotal evidence to suggest that it can, in principle, facilitate more organic and involving employee engagement. however, it may be that in many cases managers in organisations are reluctant to defect from ‘tried and tested’ traditional methods in favour of ones that may be more difficult to control, predict and, crucially, measure.
our results indicate that there is some interest in new media emerging, though as frequently utilised and routine communications channels, they have some way to go.

We specialise in providing and implementing practical employee engagement solutions.
we’re especially good at helping organisations: develop the right employee communications and engagement strategy; Build campaigns to mobilise their people behind change and business priorities measure and track what employees are thinking, saying and doing.
iC Survey 2008 from Karian and Box
contact detailsonline: www.karianandbox.comemail: [email protected]: 01904 654454fax: 020 7138 2694mail: Karian and Box, 158 west offices,
station rise, york yo1 6ga
KARIAN ANDBOX