icc e - international coffee...
TRANSCRIPT

International Coffee Council 111th Session 9 – 12 September 2013 Belo Horizonte, Brazil
Coffee in China
Background
In accordance with the objectives of the International Coffee Agreement 2007, the
International Coffee Organization is required to facilitate the expansion and transparency of
international trade in all types and forms of coffee and to provide Members with studies
and technical reports on coffee matters. On the basis of these provisions, the Programme of
Activities of the Organization for coffee year 2012/13 (document ICC‐109‐12) provides for
the preparation of a study on coffee in China. This document contains a report on the coffee
industry in China, covering production, exports, imports and consumption as well as future
prospects.
Action
The Council is requested to take note of this document.
ICC 111‐8 15 August 2013
Original: French
E

COFFEE IN CHINA INTRODUCTION
1. The world economy has undergone profound changes spearheaded by the rapid
emergence of new economic powers in the developing world, particularly China, which has
now overtaken Japan as the world’s second largest economy. Like Japan, China has for many
centuries been a traditional tea‐drinking country. In Japan, the coffee industry witnessed
spectacular development as the country underwent rapid economic growth. In a country
where coffee drinking had been almost negligible, imports of green coffee grew
dramatically, increasing from around 667 bags in 1950 to an average of 643,470 bags in the
course of the 1960s and to 1.9 million bags in the 1970s. Japan now imports an average of
7.1 million bags per year, and has become the world’s fourth largest coffee consumer after
the USA, Brazil and Germany. Given this precedent, the current economic development of
China raises questions as to how this will affect the coffee industry, particularly in terms of
prospects for national consumption. This study covers the following points:
I. Coffee production in China
II. Volume, structure and origins of coffee imports by China
III. Exports of coffee by China
IV. Prospects for coffee consumption in China
I. COFFEE PRODUCTION IN CHINA
2. In around 1887 coffee growing was introduced into China’s Yunnan province by a
French missionary. Exploitation was very limited, however, until the 1960s when the
Government created an Arabica coffee plantation on 4,000 hectares of land in the region.
Until the end of the 1970s, less than 7% of the land reserved to coffee growing was
effectively farmed. It was only towards the end of the 1980s that a joint programme of the
Chinese Government and the United Nations Development Programme (UNDP) really drove
the development of coffee production. Large companies like Nestlé subsequently
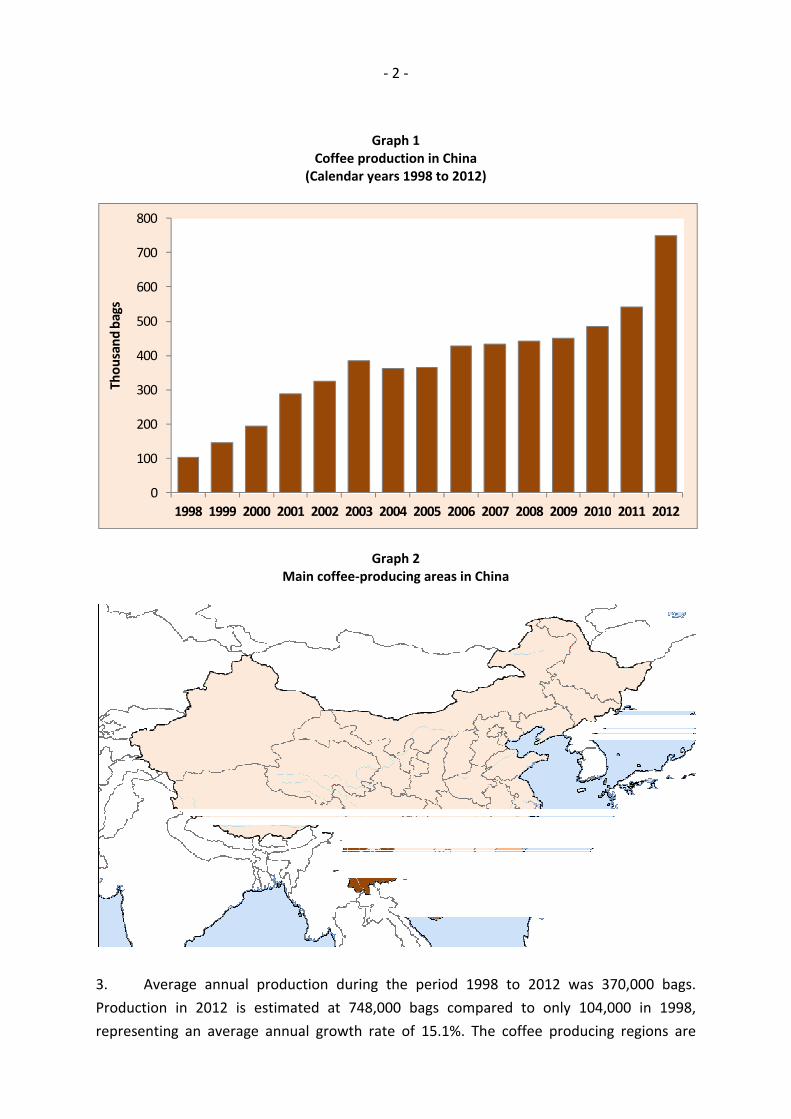
encouraged commercial coffee growing, mainly in Yunnan. Graphs 1 and 2 show coffee
production in China since 1998 and the main coffee‐producing areas.1
1 Production data for China is based on figures from the FAO Statistics Division and original research.
‐ 2 ‐
Graph 1 Coffee production in China
(Calendar years 1998 to 2012)
Graph 2 Main coffee‐producing areas in China
3. Average annual production during the period 1998 to 2012 was 370,000 bags.
Production in 2012 is estimated at 748,000 bags compared to only 104,000 in 1998,
representing an average annual growth rate of 15.1%. The coffee producing regions are
0
100
200
300
400
500
600
700
800
1998 1999 2000 2001 2002 2003 2004 2005 2006 2007 2008 2009 2010 2011 2012
Thousand bags

‐ 3 ‐
Yunnan, Hainan and Fujian. Yunnan province, which is situated in southwest China,
produces Arabicas, mainly the Catimor variety, and is the country’s main coffee‐producing
region accounting for over 95% of national production. The producing areas in Yunnan are
Kunming, Simao, Ruili and Baoshan. Yunnan province has an area of 394,000 km2 and a
population of 46 million inhabitants. The island of Hainan, situated in south China, and
Fujian province in the south‐east both produce Robustas, but on a much smaller scale since
the two provinces account for less than 5% of national production. All these regions benefit
from good organisation and efficient management on the part of the government and the
large multinational companies that are continuing to invest in increased production.
II. VOLUME, STRUCTURE AND ORIGINS OF COFFEE IMPORTS BY CHINA
4. The volume of China’s coffee production has historically been so minor that it is
considered to be an importing country. Imports were practically non‐existent until the late
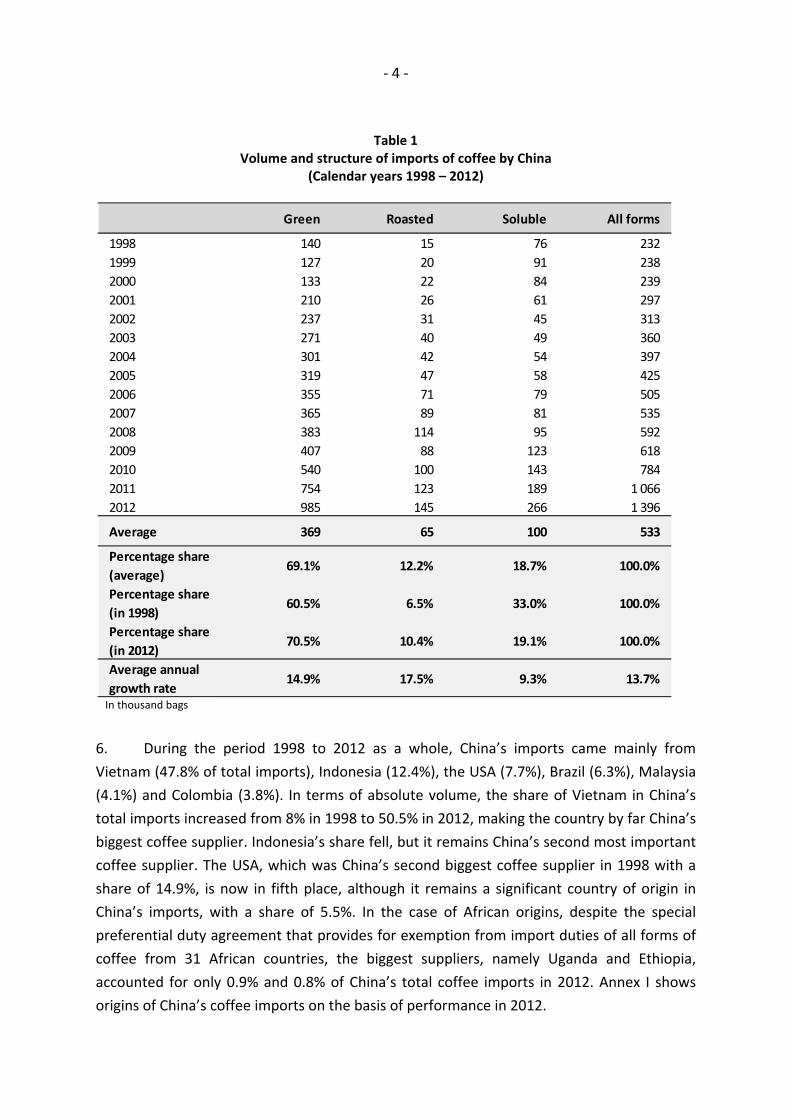
1980s2. During the period 1998 to 2012 annual imports averaged a volume of 533,000
(Table 1). There has been a substantial increase in imports, which were up from
232,000 bags in 1998 to 1.1 million bags in 2011 and 1.4 million bags in 2012. The annual
growth rate for imports of all forms of coffee during the period as a whole was 13.7%.
5. Imports were mainly in the form of green coffee, which averaged an annual volume
of 369,000 bags during the period, representing 69.1% of total imports. Imports of green
coffee subsequently increased, with a volume of 985,000 bags in 2012 as against
140,000 bags in 1998. Their share in China’s total coffee imports increased from 60.5% in
1998 to 70.5% in 2012. The average annual growth rate of green coffee imports was 15%.
During the period as a whole, the average volume of roasted coffee imports was
65,000 bags, representing 12.2% of total imports, a significant increase in relation to the
1998 share of 6.5%. In the case of soluble coffee, annual imports averaged 100,000 bags
during the period under consideration, accounting for 18.7% of the country’s total coffee
imports. The share of soluble coffee imports fell during the period, accounting for only
19.1% in 2012 compared to 33% in 1998. This fall in the soluble coffee share in China’s
imports could be linked to the development of the local processing industry with
investments by companies like Nestlé helping to meet national demand for this form of
coffee.
2 It should be noted that since China is not yet a Member of the International Coffee Organization, it is difficult to collect statistics on the country’s domestic coffee sector, although reliable data is available for imports and exports. The data available to the Organization come from various sources and, in order to achieve some consistency in the data, the analysis covers the period 1998‐ 2012, since earlier information is less reliable.
‐ 4 ‐
Table 1 Volume and structure of imports of coffee by China
(Calendar years 1998 – 2012)
In thousand bags
6. During the period 1998 to 2012 as a whole, China’s imports came mainly from
Vietnam (47.8% of total imports), Indonesia (12.4%), the USA (7.7%), Brazil (6.3%), Malaysia
(4.1%) and Colombia (3.8%). In terms of absolute volume, the share of Vietnam in China’s
total imports increased from 8% in 1998 to 50.5% in 2012, making the country by far China’s
biggest coffee supplier. Indonesia’s share fell, but it remains China’s second most important
coffee supplier. The USA, which was China’s second biggest coffee supplier in 1998 with a
share of 14.9%, is now in fifth place, although it remains a significant country of origin in
China’s imports, with a share of 5.5%. In the case of African origins, despite the special
preferential duty agreement that provides for exemption from import duties of all forms of
coffee from 31 African countries, the biggest suppliers, namely Uganda and Ethiopia,
accounted for only 0.9% and 0.8% of China’s total coffee imports in 2012. Annex I shows
origins of China’s coffee imports on the basis of performance in 2012.
Green Roasted Soluble All forms
1998 140 15 76 232
1999 127 20 91 238
2000 133 22 84 239
2001 210 26 61 297
2002 237 31 45 313
2003 271 40 49 360
2004 301 42 54 397
2005 319 47 58 425
2006 355 71 79 505
2007 365 89 81 535
2008 383 114 95 592
2009 407 88 123 618
2010 540 100 143 784
2011 754 123 189 1 066
2012 985 145 266 1 396
Average 369 65 100 533
Percentage share
(average)69.1% 12.2% 18.7% 100.0%
Percentage share
(in 1998)60.5% 6.5% 33.0% 100.0%
Percentage share
(in 2012)70.5% 10.4% 19.1% 100.0%
Average annual
growth rate14.9% 17.5% 9.3% 13.7%

‐ 5 ‐
III. EXPORTS OF COFFEE BY CHINA
III.1 Volume and structure of exports
7. Total exports by China averaged 369,000 bags a year between 1998 and 2012. In
absolute terms the volume of exports increased sharply from 137,000 bags in 1998 to
1.1 million bags in 2012 (Graph 3). A breakdown by form of coffee shows that exports of
green coffee increased from 33,000 bags in 1998 to 985,000 bags in 2012. The share of
green coffee in total exports increased from 23.9% in 1998 to 91.8% in 2012. Exports of
roasted coffee averaged 11,000 bags a year, representing 2.8% of total exports of all forms
of coffee. The share of roasted coffee fell to 3.6% in 2012 as against 8.9% in 1998. During
the period studied, exports of soluble coffee averaged 38,000 bags a year, representing
10.2% of China’s total coffee exports. The share of soluble coffee in China’s exports fell from
67.2% in 1998 to 4.6% in 2012 (Table 2).
Graph 3 Total exports of coffee by China (Calendar years 1998 to 2012)
0
200
400
600
800
1 000
1 200
1998 1999 2000 2001 2002 2003 2004 2005 2006 2007 2008 2009 2010 2011 2012
Thousand bags

‐ 6 ‐
Table 2 Exports of green, roasted and soluble coffee by China
In thousand bags
8. The growth rate of exports of all forms of coffee by China was 15.8% during the
period 1998 to 2012. The growth rates of exports of green and roasted coffee were 27.5%
and 8.6%, respectively. Exports of soluble coffee declined over the period, recording a
negative average growth rate of ‐4.3%.
III.2 Destinations of exports by China
9. Over 97% of China’s exports of coffee were destined to 20 countries. The table in
Annex II shows the main destinations. On the basis of export performance from 1998 to
2012, Germany, Japan, the USA, Belgium and Saudi Arabia are among the main destinations
for China’s exports of all forms of coffee (Graph 4).
Graph 4 Main destinations for exports of all forms of coffee by China
(Average for 1998 – 2012)
10. The main destinations for China’s exports of green coffee are shown in Graph 5.
Germany was by far the most important destination during the period studied, with an
annual average of 135,000 bags, or 42.1% of total exports. The other major destinations
were Japan (13.1%), Belgium (9.3%), the USA (7.6%) and Saudi Arabia (4.5%).
1998 2012 Average 1998 2012 Average
Green 33 985 321 23.9% 91.8% 86.9% 27.5%
Roasted 12 38 11 8.9% 3.6% 2.8% 8.6%
Soluble 92 50 38 67.2% 4.6% 10.2% ‐4.3%
All forms 137 1 073 369 100.0% 100.0% 100.0% 15.8%
Absolute levels Percentage shares Average annual
growth rate
37%
Germany
12%
Japan
9%
USA
8%
Belgium
4%
Saudi Arabia

‐ 7 ‐
Graph 5 Main destinations for exports of green coffee by China
(Average for 1998 – 2012)
11. Exports of roasted coffee were destined mainly to the Philippines (30.3%), South
Korea (18.9%), Japan (7.9%), Malaysia (7.3%) and the USA (6.2%), as shown in Graph 6.
Graph 6 Main destinations of exports of roasted coffee by China
(Average for 1998 – 2012)
12 Finally, the main destinations for China’s exports of soluble coffee were the USA
(26.6%), Taiwan (18.5%), the Netherlands (5.7%), South Korea (5.6%) and Australia (4.3%).
The United Kingdom, which accounted for 66.1% of China’s exports of soluble coffee in
1998, received only 0.9% in 2012. The United States accounted for only 3.9% of China’s
exports of soluble coffee in 2012 compared to 22.3% in 1998. Graph 7 shows the main
destinations for soluble coffee exports by China.
Graph 7 Main destinations of exports of soluble coffee by China
(Average for 1998 – 2012)
13. Overall, it should be noted that China imported an average of 533,000 bags of all forms
of coffee during the period 1998 to 2012. During the same period it exported an annual
average of 369,000 bags, representing 69.3% of total imports. In absolute terms, it exported
42%
Germany
13%
Japan
9%
Belgium
8%
USA
4%
Saudi Arabia
30%
Philippines
19%
Korea, Rep. of
8%
Japan
7%
Malaysia
6%
USA
27%
USA
19%
Taiwan
6%
Netherlands
6%
Korea, Rep. of
4%
Australia

‐ 8 ‐
1.07 million bags in 2012 compared to imports of 1.4 million bags, or 76.9% of total imports
(Graph 8). Its average annual production was 248,000 bags between 1998 and 2012. Its total
production in 2012 is estimated at 748,000 bags compared to 104,000 bags in 1998.
Graph 8 Imports and exports of all forms of coffee by China
(Calendar years 1998 and 2012)
IV. PROSPECTS FOR COFFEE CONSUMPTION IN CHINA 14. Estimates of coffee consumption in China are hampered by the lack of reliable
statistics, particularly data on production and stocks. Nevertheless, the available
information summarized in Annex III makes it possible to estimate consumption and
production. 15. On the basis of the available information, average annual consumption in China
during the period 1998 to 2012 is estimated at 543,000 bags. In the course of the last
15 years, consumption increased from 199,000 bags in 1998 to around 1.1 million bags in
2012. The average annual growth rate between 1998 and 2012 was 12.8%. Other reliable
sources, particularly the market study carried out by Euromonitor International for the
period 2006 to 2011 showed that China’s total consumption was around 1.6 million bags in
2011 compared to 1 million bags in 2006, representing an average annual growth rate of
9.5% 3. Graph 9 shows coffee consumption in China.
3 The estimates made by Euromonitor International, a private company specializing in market studies, for the period 2006 to 2011 indicate a consumption figure of 1.6 million bags (Green Bean Equivalent) of all forms of coffee in China during calendar year 2011 compared to 1.5 million bags in 2010.
232
1 396
137
1 073
0
200
400
600
800
1 000
1 200
1 400
1 600
1998 2012
Thousand bags
Imports
Exports

‐ 9 ‐
Graph 9 Total coffee consumption in China (Calendar years 1998 to 2012)
16. With a total population estimated at 1.3 billion inhabitants, average per capita
consumption is only 25 grams. In absolute terms average per capita consumption increased
from 9.6 grams in 1998 to 47.6 grams in 2012, an average annual growth rate of 12.1%. The
data published by Euromonitor International indicate an average per capita consumption of
23.7 grams.
17. If the average annual growth rate of 12.8% is maintained, consumption in China will
reach 2.8 million bags by 2020. The Chinese market seems, therefore, to be a particularly
promising market for the coffee trade, as is the case for many other agricultural products. In
absolute terms, consumption is still relatively weak and future growth will depend largely on
the flourishing Chinese economy. Moreover, coffee bars are frequented mainly by a
relatively small group of the urban middle class. In these circumstances, an increase in per
capita consumption is strongly dependent on socio‐economic factors. Annex IV gives a
summary of the main socio‐economic indicators that could contribute to an increase in
coffee consumption.
1) Economic environment
18. A little over 30 years ago, China was among the world’s poorest countries, with 80%
of its population living on US$1 a day. Only a third of the adult population could read and
write. However, a vast programme of economic, social and agricultural reforms launched in
0
200
400
600
800
1 000
1 200
1998 1999 2000 2001 2002 2003 2004 2005 2006 2007 2008 2009 2010 2011 2012
Thousand bags
‐ 10 ‐
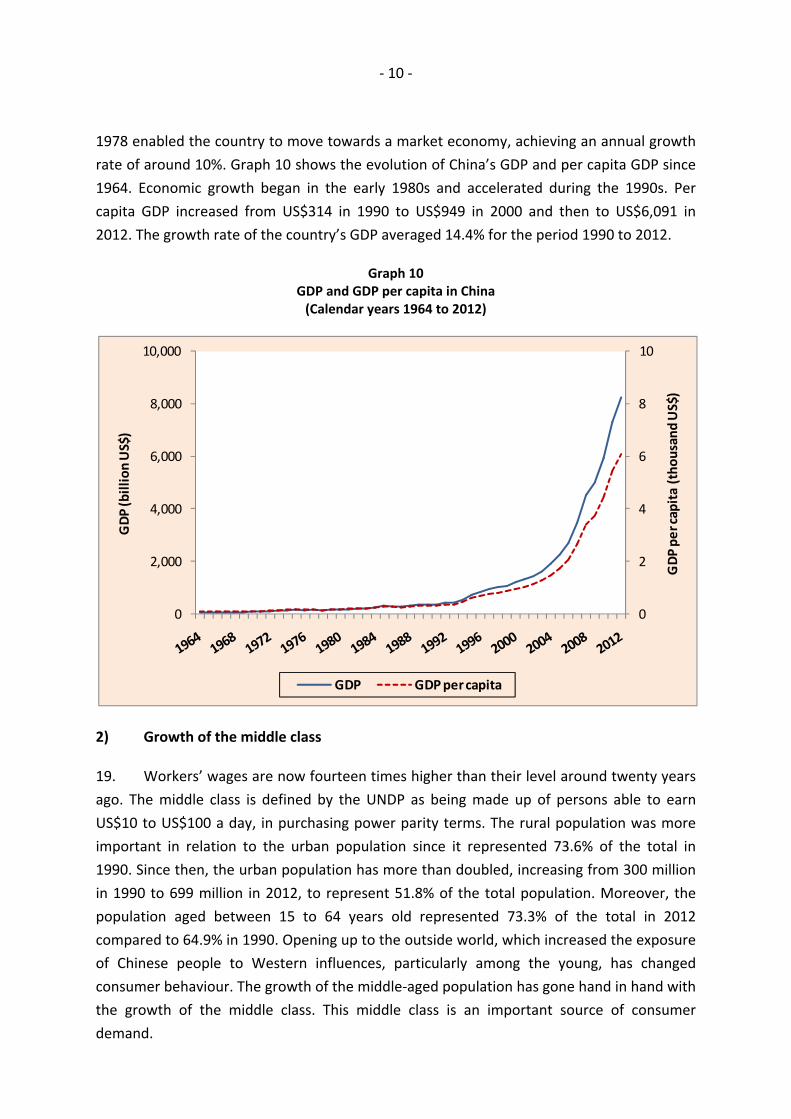
1978 enabled the country to move towards a market economy, achieving an annual growth
rate of around 10%. Graph 10 shows the evolution of China’s GDP and per capita GDP since
1964. Economic growth began in the early 1980s and accelerated during the 1990s. Per
capita GDP increased from US$314 in 1990 to US$949 in 2000 and then to US$6,091 in
2012. The growth rate of the country’s GDP averaged 14.4% for the period 1990 to 2012.
Graph 10
GDP and GDP per capita in China (Calendar years 1964 to 2012)
2) Growth of the middle class
19. Workers’ wages are now fourteen times higher than their level around twenty years
ago. The middle class is defined by the UNDP as being made up of persons able to earn
US$10 to US$100 a day, in purchasing power parity terms. The rural population was more
important in relation to the urban population since it represented 73.6% of the total in
1990. Since then, the urban population has more than doubled, increasing from 300 million
in 1990 to 699 million in 2012, to represent 51.8% of the total population. Moreover, the
population aged between 15 to 64 years old represented 73.3% of the total in 2012
compared to 64.9% in 1990. Opening up to the outside world, which increased the exposure
of Chinese people to Western influences, particularly among the young, has changed
consumer behaviour. The growth of the middle‐aged population has gone hand in hand with
the growth of the middle class. This middle class is an important source of consumer
demand.
0
2
4
6
8
10
0
2,000
4,000
6,000
8,000
10,000
GDP per capita (thousand US$)
GDP (billion US$)
GDP GDP per capita

‐ 11 ‐
3) Competition between companies in the coffee industry
20. The proliferation of sales outlets for coffee companies on every street corner in
China’s big cities indicates the existence of a potential for coffee consumption in China.
Coffee companies continually carry out promotion activities targeted mainly at the young,
who are more receptive to change and to Western lifestyles.
Conclusion
21. Coffee consumption in China is still something of a puzzle. The figures given above
indicate that, despite its strong potential, we should observe some degree of caution in
relation to prospects for coffee consumption in China. The absolute level of coffee
consumption remains relatively low. Even if conditions for reaching the consumption level
of 2.8 million bags by 2020 indicated above are met, per capita consumption would only be
around 125 grams. Moreover, China is still a traditionally tea‐drinking country.
22. However, it is instructive to note that Japan was also a minor market for coffee in
the late 1960s, when its annual consumption was roughly the same level as China’s is now.
Coffee consumption in Japan then accelerated to exceed 7 million bags since 2004. Given
China’s vast population and strong economic growth in recent years, there is certainly
potential for it to do the same.
23. Furthermore, the economic and commercial opening up of investment
opportunities, particularly in the coffee roasting industry, could help to change consumer
habits, creating a vast potential market for coffee consumption. In this regard, it is worth
noting the development of soluble coffee, which is currently supporting a strong growth in
the country’s coffee consumption.

ANNEX I
ORIGIN OF IMPORTS OF ALL FORMS OF COFFEE BY CHINA
1998 1999 2000 2001 2002 2003 2004 2005 2006 2007 2008 2009 2010 2011 2012 Average% share
(average)
% share
(1998)
% share
(2012)
Vietnam 19 53 76 137 167 187 197 180 263 269 275 299 412 583 705 255 47.8% 8.0% 50.5%
Indonesia 58 30 28 33 28 37 53 88 45 56 63 69 71 113 220 66 12.4% 25.0% 15.8%
Malaysia 2 3 3 3 4 8 7 9 11 19 24 31 52 70 85 22 4.1% 0.7% 6.1%
Brazil 12 12 8 16 22 30 35 39 23 31 39 51 50 56 78 33 6.3% 5.0% 5.6%
USA 35 53 42 34 17 22 18 23 41 53 66 40 41 52 77 41 7.7% 14.9% 5.5%
Colombia 24 18 10 11 11 14 17 22 28 21 23 15 20 23 32 19 3.6% 10.3% 2.3%
Italy 1 1 2 2 3 3 4 5 7 10 10 12 17 18 23 8 1.5% 0.4% 1.7%
Japan 7 5 8 6 7 5 8 8 8 9 9 10 13 13 21 9 1.7% 2.9% 1.5%
Korea, Rep. of 11 3 4 6 6 6 7 5 5 5 8 9 8 12 19 8 1.4% 4.7% 1.4%
Australia 5 2 2 2 4 2 2 3 3 6 5 5 6 11 13 5 0.9% 2.0% 0.9%
United Kingdom 0 5 3 2 1 1 1 2 1 1 2 2 3 5 12 3 0.5% 0.2% 0.9%
Uganda 0 0 0 0 1 1 4 2 6 3 6 3 15 13 12 4 0.8% 0.0% 0.9%
Ethiopia 0 0 0 0 1 1 1 3 4 4 6 5 5 7 12 3 0.6% 0.0% 0.8%
Singapore 10 8 7 7 15 8 8 6 16 10 12 7 9 9 11 10 1.8% 4.2% 0.8%
Germany 6 6 7 8 6 8 5 3 3 5 6 7 6 7 11 6 1.2% 2.7% 0.8%
Guatemala 1 2 2 2 2 3 3 2 2 2 2 2 4 8 10 3 0.6% 0.3% 0.7%
Taiwan 8 6 5 5 6 8 7 6 7 7 6 12 13 12 10 8 1.5% 3.3% 0.7%
India 4 1 0 0 0 0 2 1 13 6 7 16 10 11 6 5 1.0% 1.7% 0.5%
Netherlands 3 3 5 5 4 2 2 2 2 1 4 3 5 5 6 3 0.6% 1.3% 0.4%
Switzerland 7 4 1 1 1 1 0 2 2 3 2 3 5 6 6 3 0.5% 2.8% 0.4%
Honduras 1 1 2 4 2 3 4 3 1 1 1 2 4 5 4 2 0.5% 0.3% 0.3%
Papua New Guinea 1 3 2 2 1 3 2 3 1 2 1 0 0 1 3 2 0.3% 0.4% 0.2%
Costa Rica 0 1 1 0 0 0 0 0 0 0 2 1 1 1 3 1 0.1% 0.1% 0.2%
Thailand 12 2 1 0 0 0 1 2 3 2 1 2 2 2 2 2 0.4% 5.0% 0.1%
Mexico 2 1 1 1 0 0 1 0 0 0 0 1 0 0 1 1 0.1% 0.8% 0.1%
Philippines 4 7 12 4 0 2 0 0 0 0 1 0 0 0 0 2 0.4% 1.6% 0.0%
Lao (PDR) 0 0 0 1 0 0 0 0 0 0 0 0 0 2 0 0 0.0% 0.0% 0.0%
Total 232 238 239 297 313 360 397 425 505 535 592 618 784 1 066 1 396 533 100.0% 100.0% 100.0%

ANNEX II
MAIN DESTINATIONS FOR COFFEE EXPORTS BY CHINA
All forms 1998 2012 Average% share
(1998)
% share
(2012)
% share
(average)
Germany 16 457 136 11.3% 42.6% 36.8%
Japan 9 31 43 6.4% 2.9% 11.6%
USA 23 82 35 16.6% 7.6% 9.5%
Belgium 0 57 30 0.0% 5.4% 8.1%
Saudi Arabia 0 31 14 0.0% 2.9% 3.9%
Malaysia 1 110 12 1.0% 10.3% 3.3%
France 0 55 10 0.0% 5.2% 2.8%
Spain 0 53 6 0.0% 4.9% 1.7%
Switzerland 0 32 4 0.2% 3.0% 1.2%
Philippines 0 26 4 0.3% 2.5% 1.0%
Total 137 1 073 369 100.0% 100.0% 100.0%
Green coffee 1998 2012 Average% share
(1998)
% share
(2012)
% share
(average)
Germany 11 457 135 33.9% 46.4% 42.1%
Japan 6 27 42 18.7% 2.7% 13.1%
Belgium 0 57 30 0.0% 5.8% 9.3%
USA 2 79 24 6.4% 8.0% 7.6%
Saudi Arabia 0 31 14 0.0% 3.1% 4.5%
Malaysia 0 106 11 0.0% 10.7% 3.4%
France 0 55 10 0.0% 5.6% 3.2%
Spain 0 53 6 0.0% 5.4% 2.0%
Switzerland 0 32 4 0.9% 3.3% 1.4%
United Kingdom 0 18 2 0.0% 1.8% 0.5%
Total 33 985 321 100.0% 100.0% 100.0%
Roasted coffee 1998 2012 Average% share
(1998)
% share
(2012)
% share
(average)
Philippines 0 25 3 0.5% 65.8% 30.3%
Korea, Rep. of 0 0 2 0.0% 1.0% 18.9%
Japan 3 4 1 21.5% 10.2% 7.9%
Malaysia 1 3 1 11.3% 7.6% 7.3%
USA 0 1 1 1.4% 2.9% 6.2%
United Kingdom 2 2 1 15.7% 4.4% 5.8%
Taiwan 1 2 0 8.2% 4.4% 4.1%
Canada 0 0 0 1.0% 0.6% 2.1%
Mexico 0 0 0 0.0% 0.9% 0.3%
Latvia 0 0 0 0.0% 0.8% 0.2%
Total 12 38 11 100.0% 100.0% 100.0%
Soluble coffee 1998 2012 Average% share
(1998)
% share
(2012)
% share
(average)
USA 20 2 10 22.3% 3.9% 26.6%
Taiwan 0 15 7 0.1% 29.5% 18.5%
Netherlands 0 3 2 0.0% 5.9% 5.7%
Korea, Rep. of 1 7 2 0.8% 13.2% 5.6%
Australia 1 2 2 0.8% 4.3% 4.3%
Vietnam 0 3 1 0.0% 6.1% 3.0%
Singapore 1 3 1 1.2% 6.8% 2.1%
Malaysia 0 2 0 0.0% 3.8% 1.3%
Mongolia 0 2 0 0.0% 3.7% 0.4%
United Arab Emirates 0 2 0 0.0% 4.4% 0.4%
Total 92 50 38 100.0% 100.0% 100.0%
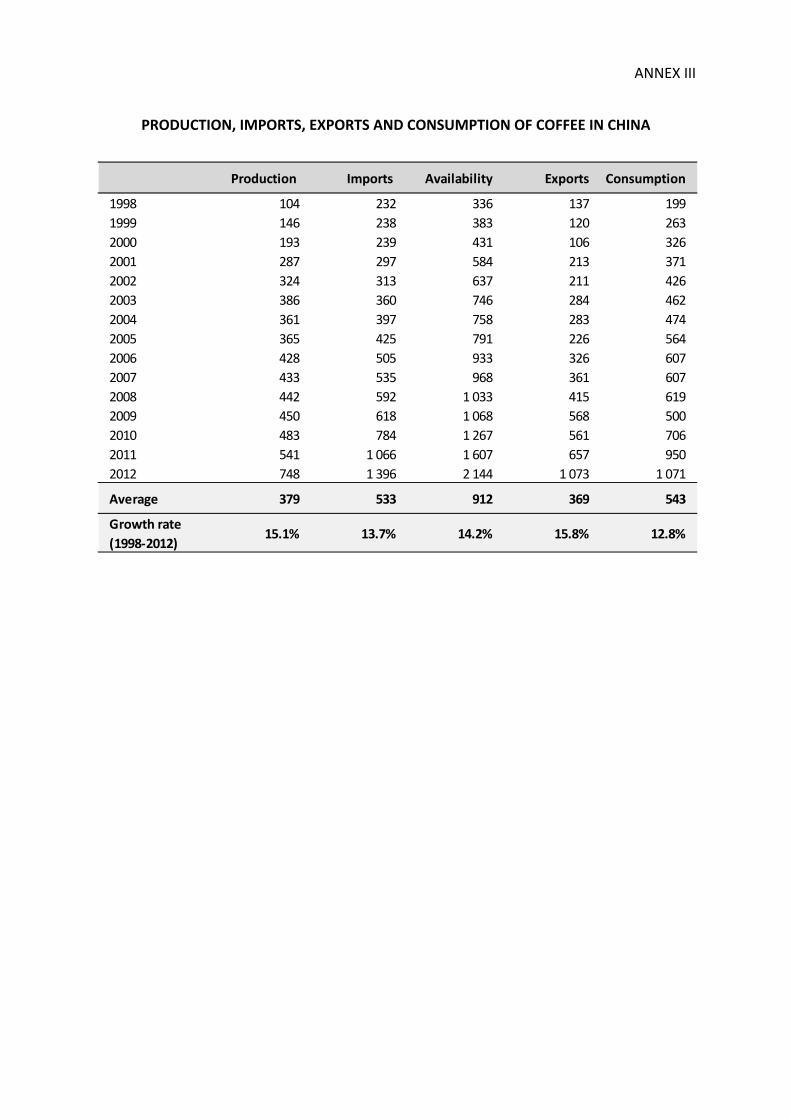
ANNEX III
PRODUCTION, IMPORTS, EXPORTS AND CONSUMPTION OF COFFEE IN CHINA
Production Imports Availability Exports Consumption
1998 104 232 336 137 199
1999 146 238 383 120 263
2000 193 239 431 106 326
2001 287 297 584 213 371
2002 324 313 637 211 426
2003 386 360 746 284 462
2004 361 397 758 283 474
2005 365 425 791 226 564
2006 428 505 933 326 607
2007 433 535 968 361 607
2008 442 592 1 033 415 619
2009 450 618 1 068 568 500
2010 483 784 1 267 561 706
2011 541 1 066 1 607 657 950
2012 748 1 396 2 144 1 073 1 071
Average 379 533 912 369 543
Growth rate
(1998‐2012)15.1% 13.7% 14.2% 15.8% 12.8%

ANNEX IV
MAIN SOCIO‐ECONOMIC INDICATORS FOR CHINA
Source: World Bank
1990 1991 1992 1993 1994 1995 1996 1997 1998 1999 2000 2001 2002 2003 2004 2005 2006 2007 2008 2009 2010 2011 2012
Population
Total population
(mil l ion)
1 135 1 151 1 165 1 178 1 192 1 205 1 218 1 230 1 242 1 253 1 263 1 272 1 280 1 288 1 296 1 304 1 311 1 318 1 325 1 331 1 338 1 344 1 351
Population aged 15‐64 (%) 64.9% 65.0% 65.0% 65.1% 65.1% 65.3% 65.5% 65.9% 66.3% 66.9% 67.5% 68.3% 69.2% 70.2% 71.1% 71.8% 72.4% 72.9% 73.2% 73.4% 73.5% 73.5% 73.3%
Urban population
(mil l ion)
300 315 329 344 358 373 389 405 421 437 453 473 493 514 534 554 575 596 617 637 658 679 699
Rural population
(mil l ion)
835 836 836 835 834 832 829 825 821 816 810 799 787 775 762 749 736 722 708 694 679 665 651
Unemployment rate (%) 2.5% 2.3% 2.3% 2.6% 2.8% 2.9% 3.0% 3.1% 3.1% 3.1% 3.1% 3.6% 4.0% 4.3% 4.2% 4.2% 4.1% 4.0% 4.1% 4.1%
National income
GDP (US$ bill ion) 357 379 423 441 559 728 856 953 1 019 1 083 1 198 1 325 1 454 1 641 1 932 2 257 2 713 3 494 4 522 4 991 5 931 7 322 8 227
GDP growth (%) 3.8% 9.2% 14.2% 14.0% 13.1% 10.9% 10.0% 9.3% 7.8% 7.6% 8.4% 8.3% 9.1% 10.0% 10.1% 11.3% 12.7% 14.2% 9.6% 9.2% 10.4% 9.3% 7.8%
GDP per capita (US$) 314 330 363 374 469 604 703 774 821 865 949 1 042 1 135 1 274 1 490 1 731 2 069 2 651 3 414 3 749 4 433 5 447 6 091
Foreign exchange reserves
(US$ bil l ion)
30 44 21 22 53 75 107 143 149 158 168 216 291 408 614 822 1 068 1 530 1 949 2 416 2 866 3 203 3 331
Inflation (%) 3.1% 3.5% 6.3% 14.6% 24.2% 16.9% 8.3% 2.8% ‐0.8% ‐1.4% 0.3% 0.7% ‐0.8% 1.2% 3.9% 1.8% 1.5% 4.8% 5.9% ‐0.7% 3.3% 5.4% 2.7%
Official exchange rate
(US$/CNY)
4.8 5.3 5.5 5.8 8.6 8.4 8.3 8.3 8.3 8.3 8.3 8.3 8.3 8.3 8.3 8.2 8.0 7.6 6.9 6.8 6.8 6.5 6.3