ice chrisman cunningham improving polarimetric … · 6 improving and exploiting polarimetric...
TRANSCRIPT

6 Improving and Exploiting Polarimetric Weather Radar Data – Plans and Status
Richard L. Ice and J. G. Cunningham
U.S. Air Force, Air Weather Agency, Operating Location K, Norman, Oklahoma J. N. Chrisman
WSR-88D Radar Operations Center, Norman, Oklahoma
1. INTRODUCTION This paper will present recent and planned improvements to the Weather Surveillance Radar 1988 Doppler (WSR-88D), addressing near term operational improvements as well as future signal processing enhancements. It describes practical ideas, many proven very recently, that have potential for enhancing the foundational data from the WSR-88D Doppler Weather Radar. It is forward looking, and intended to aid program stakeholders as they sustain and improve operations for this critical national weather asset. It follows the spirit of earlier visionary work that has made the radar a success (Elvander, 2001). This potential technology survey and operational status update will first review a range of possible technologies and will then present the status of the near term software updates that the WSR-88D Radar Operations Center (ROC) has been developing. For most of the twenty plus years of the WSR-88D’s lifecycle, the ROC, formerly Operational Support Facility (OSF), has conducted data quality improvement projects. This program, conducted under a Data Quality Memorandum of Understanding (DQ MOU) in partnership with the National Severe Storms Laboratory (NSSL), the University of Oklahoma, and the National Center for Atmospheric Research (NCAR), has resulted in several major signal processing improvements to the radar (Saxion, 2011). Notable among these improvements are mitigation of the classic Range Velocity Ambiguity problem and automatic identification and removal of clutter. Another improvement in quality of the radar moments has been achieved with the deployment of a hybrid spectrum width estimator, (Meymaris, 2009).
* Corresponding Author Address: Richard L. Ice, US Air Force., WSR-88D Radar Operations Center, 1313 Halley Circle. Norman, OK, 73069 e-mail: [email protected] The views expressed are those of the authors and do not necessarily represent those of the United States Air Force.
The program also established a significant infrastructure for capturing, processing, and archiving the digital output of the radar receiver through time series recording. This capability has been the key to the rapidly increasing pace of signal processing improvements, and also formed the basis of all engineering evaluations aimed at ensuring new signal processing features meet or exceed system requirements. The infrastructure resulting from the data quality program was instrumental in the evaluation and resulting approval of the recently completed polarimetric upgrade. There have been many surveys regarding the future of weather radar that addressed signal processing improvements (Fabry, 2003, Keeler, 1990, National Academy of Sciences, 2004, Snow, 2003, Zrnic, 2003). Engineers at the ROC routinely review published research and maintain contact with experts in the field in order to plan future upgrades and ensure modifications can support continued growth in capability. This paper presents a brief overview of some possibilities in the next section. The paper then focuses on four areas that are of interest because of their potential impact or their state of development, making implementation practical. The last sections of the paper present the status of recent and near term software deployments. 2. POTENTIAL TECHNOLOGIES The range of possible improvements is quite expansive. They range from methods to enhance system sensitivity (Ice, 2011, Melnikov, 2011) to advanced spectral reconstruction using multiple radar waveforms on separate scans (Warde, 2012). Melnikov demonstrated that some usable weak signals can be recovered by simply lowering the signal to noise threshold and then removing the resultant non-meteorological data with an improved speckle detector. The use of coherency estimates as a means for adaptively setting the signal to noise threshold has also been demonstrated (Ivic, 2009).
Warde proposes a technique that combines the spectra from the surveillance and Doppler scans to reconstruct an ideal, unambiguous range-Doppler spectrum that can be then used to estimate velocity and spectrum width. Even more sophisticated spectral decomposition and analysis techniques are likely possible with advances in signal processing hardware and software. Perhaps analysis methods, used in other disciplines, such as empirical mode decomposition with Hilbert transforms will also prove useful (Huang, 1998). Wind turbines for generating electricity in the United States, while beneficial for the most part, negatively impact weather radar operations. The moving blades represent very large targets that feature motion-induced Doppler shifts. This results in signal spectra that are very much like weather returns and thus are difficult for the clutter filters to remove. Research continues into means of identifying and removing this clutter, and new techniques will likely be developed and implemented (Hood, 2010). More advanced techniques may not prove practical or possible unless they are part of a planned service life extension program involving hardware upgrades. One example is pulse compression which could enable use of solid state transmitters. Until recently pulse compression was not a mainstay of meteorological radar, due mostly to the high range side lobes resulting from the compression filtering process. This has largely been overcome with advanced signal processing and special pulse coding schemes. Some researchers are beginning to focus on practical implementation of pulse compression and even developing algorithms based on simulated pulse compression data (Alberts, 2011). The authors identified four enhancements that are important in the near term, or are sufficiently mature to merit serious consideration for operational development. These are: (1) Polarimetric Data Quality Improvements, (2) On-Line Determination of the System Noise Level, (3) Clutter Environment Analysis using Adaptive Processing, and (4) Oversampling and Adaptive Psuedowhitening. 3. POLARIMETRIC DATA QUALITY IMPROVEMENTS The NEXRAD program, through the National Weather Service Office of Science and Technology has completed deployment of a polarimetric upgrade to the WSR-88D. Working with the prime contractor, L3/Stratis, and the
technical subcontractor, Baron Services, the team has successfully implemented a basic polarimetric capability The upgrade provides three basic dual polarization variables. These are Differential Reflectivity (ZDR), Correlation Coefficient (RHO), and Differential Phase (PHI). The upgrade also features a modified version of the Gaussian Model Adaptive Processing (GMAP) clutter filter based on the one previously used in the fielded systems. The filter has been modified in order to preserve the differential information between the horizontal and vertical channel data, but is at this point a fairly simple approach and is not optimal. While the upgrade performs well, and supports all system level requirements, it is not optimized given that the polarimetric research was conducted on non-operational systems. The research community was able to explore the performance of dual polarization using custom scanning strategies and radar waveforms. The operational version deployed is constrained by the realities of current waveforms and scanning strategies, and in many cases is hampered by a limited number of samples for obtaining the estimates. There are three main areas for potential improvement. These are: clutter filtering, calibration, and moment estimation. Prior to the start of the upgrade design, there was scant research available on the topic of clutter filtering for dual polarization variables. What research was done focused mainly on the impacts of clutter on the estimates (Friedrich, 2009). Some of the basic research is quite recent (Hubbert, 2009a, 2009b, 2011). The ROC was asked to provide a recommendation for filtering that the contractors could implement. After consultation with NSSL, the government engineers recommended the simple approach that is currently implemented. This design merely uses the number of clutter coefficients removed by GMAP from the horizontal channel to establish the number of coefficients to be removed from the vertical channel. Then the usual spectral reconstruction feature of GMAP is disabled. This simple approach attempts to preserve the spectral component relationship between the two channels. However, it is limited in performance, especially if the clutter has polarimetric characteristics and does not exhibit expected behavior. Figure 1 shows how the ZDR of clutter can bias the weather ZDR estimate for various levels of the clutter to signal ratio (Scott Ellis, NCAR). Improved techniques for recognizing clutter contamination using dual polarization variables are possible, and even being implemented in near term software releases. The ROC has deployed a new version of the Clutter Mitigation

Decision (CMD) algorithm that incorporates the new polarimetric data. This upgrade is based on research at NCAR. Figure 2 depicts an example of the characteristic differences between weather and clutter. This figure shows the standard deviation of ZDR for both weather and clutter signals. Also shown is a fuzzy logic membership function that is a component of a clutter identification algorithm (Scott Ellis, NCAR). ROC engineers are currently evaluating the performance of the baseline dual pol version of CMD from the recent tornado events in Oklahoma and will propose improvements as appropriate. The program should continue to follow developments in clutter filtering for dual polarization and the ROC should evaluate all new techniques, implementing them as appropriate. The most challenging technical issue with an operational dual polarization system is calibration. In particular, the major calibration problem is determining the radar system’s contribution to the estimated value of ZDR. This “System Differential Reflectivity” is a component of the measured ZDR and serves to mask the true ZDR of the radar return signal. System ZDR comes from imbalances between the radar hardware channels, and has components related to imperfectly divided transmitter power, mismatched transmission lines such as waveguides, errors in the antenna, and differences in the gains between the two receiver channels. Calibration consists of accurately determining the System ZDR contributions of all these components. The Dual Pol prime contractors implemented a sophisticated set of engineering type measurements aimed at determining the System ZDR to the desired uncertainty of 0.1 dB. It is no small challenge to meet this goal using microwave metrology methods, but experimental measurements and mathematical analysis indicates this can be achieved with the developed method. The government team has been engaged in various efforts to independently verify this performance, focusing on external measurements using precipitation, ground clutter, and solar scans. Indications are that the use of precipitation will require long term data collection and analysis and that it is not possible to assess the calibration state of a given radar using only one, or a few, rain events. The ROC team has developed methods for observing and analyzing the calibration performance of the various radars within the network. This is an integrated approach, which captures relevant performance data reported for each volume scan and also analyzes the level 2 data containing the radar variable estimates. The radar variable analysis is capable of utilizing
returns from precipitation as well as Bragg scatter (Cunningham, 2013, Hoban, 2014). Engineers and meteorologists at the ROC can view the calibration state by analyzing the returns from appropriate regions of precipitation and Bragg scatter, inferring the bias effects of the radar hardware. In conjunction with the external measurements, the team can compare these real time results with reported calibration parameters such as transmitter power balance and receiver gain differentials. The daily serendipitous sun spikes are also be analyzed for differential reflectivity (Holleman, 2010) and this yields an estimate of the bias component due to the receive path. All of these internally reported and externally derived parameters are routinely collected and are available for analysis in support of field operations. Section 10 of this paper presents additional details about the ROC’s calibration monitoring program. Engineers at NCAR developed a method based on cross polarization power measurements, from either precipitation or clutter, coupled with solar scans (Hubbert 2003 and 2007). The engineering team at the ROC and NCAR are implementing this method as a means of verifying system performance and potentially as a field capable calibration method. Figure 3 is an example of the use of solar scans to monitor system performance (Mike Dixon, NCAR). Depicted are scans of the sun’s disk showing noise power received in both the horizontal and vertical channel. Figure 4 is a plot of the difference in the noise power from each channel and shows that the difference in the horizontal and vertical channel power is quite uniform over the inner circle which represents the one degree main beam of the antenna (Mike Dixon, NCAR). The small difference shown (about 0.3 dB in this case) represents the mismatch between the channels in receive mode, and includes the antenna, receiver paths, and receiver gains. This data, combined with the two way data from using the transmitter and scanning ground clutter, can be used to yield an independent method of measuring System Differential Reflectivity. The ROC is currently developing and testing this method (Ice, 2013). One of the realities of implementing new science into existing systems is that there are limitations on system operations. There are mechanical operating limits on the antenna positioning hardware for example. A major limitation is the requirement for timely radar volume updates. These limitations are usually not present in a research environment where the goal is to find out what is possible from the basic science. The dual polarization project is no different in this regard. System managers have to adopt the science derived signal processing to the realities

of the field. A prime example is the limited number of pulse samples available for obtaining the estimates. In the case of Volume Coverage Pattern (VCP) 12, only 15 samples are available on the Surveillance Scan from which the three polarimetric variables are estimated. This is an area ripe for investigation. 4. ON-LINE DETERMINATION OF THE SYSTEM NOISE LEVEL One very critical measurement is the overall system noise level. Because estimates are derived from noise adjusted power measurements, errors in system noise estimation can seriously degrade the quality of the dual polarization variables, especially ZDR and RHO in low signal to noise conditions. The current baseline method consists of simply taking many power samples with the antenna at a high elevation angle at the end of each volume scan. This single measurement is adjusted for elevation, but is not azimuth dependent, and is applied to the next volume scan. The evaluation teams have noted errors in this method that affect data quality. NSSL scientists have developed a new method for estimating noise that uses data from each azimuth for every elevation and derives the noise from the actual position from which the radar data is obtained (Ivic, 2013, 2011). The image in Figure 5 shows a reflectivity scan and depicts the difference in the data obtained from both methods (Igor Ivic, NSSL). Bins marked in white are weak returns that were added by use of the new radial noise estimation method. The ROC has implemented this new noise estimation method in software Build 14.0 and has been evaluating the performance. Section 7.3.1 presents some of the results of this testing. 5. CLUTTER ENVIRONMENT ANALYSIS USING ADAPTIVE PROCESSING One very promising new method for managing clutter contamination is currently implemented on the National Weather Radar Testbed (Warde, 2009b). The Clutter Environment ANalysis using Adaptive Processing (CLEAN-AP) was developed at the University of Oklahoma, Cooperative Institute for Mesoscale Meteorological Studies, National Severe Storms Laboratory, and has been shown to meet basic WSR-88D requirements. The NEXRAD Technical Advisory Committee (TAC) has recommended that the ROC perform an engineering evaluation of CLEAN-AP for possible implementation in a future software release.
Figure 6 shows the performance of CLEAN-AP on the National Weather Radar Testbed as it removes anomalously propagated clutter. The small inset shows the same data case from the Oklahoma City NEXRAD for comparison (Dave Warde, NSSL). Figure 7 depicts all three base radar moments for a mesocyclone case with CLEAN-AP on and off. Note that while CLEAN-AP removes the ground clutter, the data in the mesocyclone region is unaffected. The ROC team plans to implement an engineering version of CLEAN-AP for the WSR-88D, perhaps as soon as software Build 15. 6. OVERSAMPLING AND ADAPTIVE PSUEDOWHITENING The final technique featured here is oversampling and whitening, a method that has been known for some time, but had undergone several evolutions aimed at making it practical to implement (Curtis 2011a, 2011b, Torres, 2009, Yu, 2006). This method takes multiple samples in the receiver within the pulse duration time. The technical details of this method are not addressed here, but it is essentially a method for transforming highly correlated samples into a set of samples that are less correlated and thus more independent. The decorrelation process is the key, but can be computationally complex. The Adaptive Psuedowhitening algorithm overcomes prior limitations, making it a practical candidate for implementation. The net result will be increased accuracy of estimates within the same, or even faster, update time constraints. This method is directly applicable for improving the quality of the polarimetric variables. Figure 8, from Curtis, 2011b, shows reflectivity and velocity data processed by the current matched filtering method compared to two versions of oversampling. In the top panels, the baseline method, 16 samples were used for reflectivity and 64 were used for velocity. In the bottom panels, only 12 samples were used for reflectivity and 26 were used for velocity. This sample clearly shows the rapid update advantages of oversampling. ROC engineers have calculated that with oversampling rapid update VCPs could be used that would take advantage of the fastest rotation speeds the pedestal can reliably support while improving data quality. When combined with other optimization methods such as Automated Volume Scan Evaluation and Termination (AVSET), volume update times approaching 2 minutes may be possible. 7. Recent and Scheduled Improvements

The ROC develops and distributes triagency-approved “major” software releases on an annual cycle, while “minor” releases, primarily for software security updates, occur more frequently. Configuration Change Requests that define the contents of each software build are available at: http://www.roc.noaa.gov/WSR88D/BuildInfo/SWBuildsList.aspx 7.1 Software Build 13 Build 13 was installed on all dual polarized WSR-88Ds, except redundant-channel sites during the summer of 2012. This software upgrade provided forecasters new tools to improve their forecast and severe warning operations. Build 13 re-introduced the Clutter Mitigation Decision (CMD) (Ice et al. 2009) and Automated Volume Scan Evaluation and Termination (AVSET) (Chrisman, 2009) algorithms. The major radar science upgrade in this build was the deployment of the Enhanced Velocity Azimuth Display (VAD) Wind Profile (EVWP) function (Chrisman and Smith, 2009). The EVWP function consistently provides ~50% more wind estimates than the legacy VWP algorithm. These additional wind estimates improve the overall operational usability of the VWP product. A comparison of the legacy and Enhanced VWP products based on the same data set is in Figure. 9. 7.2 Software Build 13.1 Build 13.1 is the latest software release. Deployment began in mid-January 2013. It re-introduces CMD and AVSET to sites modified to Dual Polarization status, including redundant-channel NWS and FAA WSR-88Ds. The major science upgrades in this build are the implementation of an improved spectrum width estimator and a new, improved velocity dealiasing algorithm. The dealiasing algorithm, called the 2-Dimensional Velocity Dealiasing Algorithm (2-D VDEAL) (Zittel and Zhongqi, 2012) is the first change to the WSR-88D velocity dealiasing algorithm. The 2-D VDEAL will be available for all volume coverage patterns (VCPs) except VCP121, or when the velocity increment is 1 m/s. It will also not be available with sector PRF selections. Note, this algorithm is only applied to Doppler products and not the Level 2 Doppler estimates. Examples of the improved velocity dealiasing capability are shown in Figures 10, 11, and 12. Examples of 2-D VDEAL dealiasing performance in VCP31 are available in (Witt et al. 2009) 7.3 Software Build 14
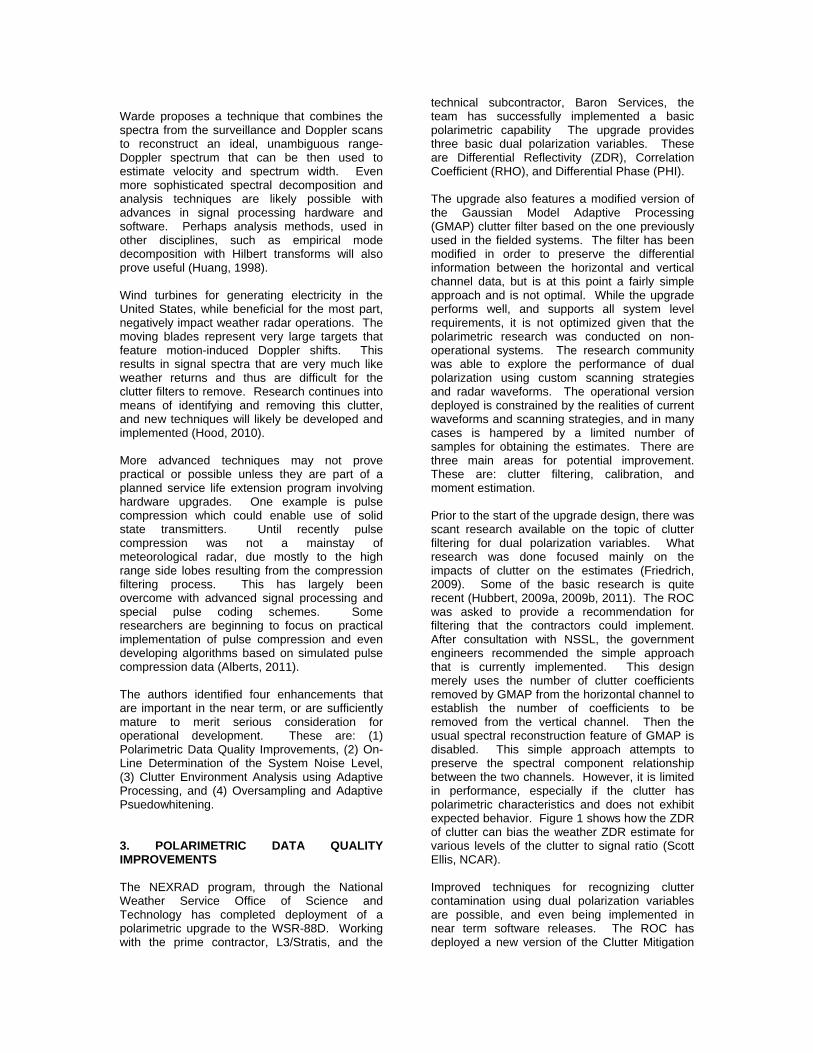
The next major software release, Build 14, is scheduled for Beta Testing at five sites in February 2014 and deployment to the network beginning in April 2014. In addition to three major operational changes, there are important changes to the data format of the Level 2 and Level 3 data streams. Sensitivity and data quality are enhanced with coherency based signal to noise threshold adjustments (Ivic, 2009). Also, the 2-D VDEAL algorithm will be established as the default operational mode. Data users should monitor the ROC web site, referenced in Section 7.3.2 below, for up to date information on capabilities and schedules. Summaries of the three major operational changes in Build 14 follow: 7.3.1 Supplemental Adaptive Intra-Volume Low-Level Scan (SAILS) One of the most field-requested capabilities has been for more frequent low-elevation angle scans. In an effort to meet this need, a new dynamic scanning method, the Supplemental Adaptive Intra-Volume Low-Level Scan (SAILS), will be introduced in Build 14. SAILS inserts one supplemental “Split Cut” scan, normally 0.5°, into existing severe weather VCPs 12 and 212. This additional Split Cut scan is inserted into the “middle” of the volume scan to evenly space the time intervals between low-elevation angle scan updates. The “middle” of the volume scan is adaptive and is determined on a volume scan-to-volume scan basis based on the current termination angle. Execution of SAILS, like the recently-reintroduced AVSET function, will be operator controlled. Although SAILS was designed to work with AVSET, they are independent functions and may be active at the same time or executed separately. A drawing of how the antenna will operate with SAILS invoked is in Figure 13. 7.3.2 Storm-Based Auto PRF and SZ-2 PRF Selection The legacy Auto Pulse Repetition Frequency (PRF) algorithm selects the Doppler PRF that results in the least amount of range-folded (purple) data for the area within 230 km of the radar. The new Storm-Based Auto PRF Function selects the PRF that provides the smallest area of obscured data over the storm or storms of interest. (Note: Depending on the selected option, the storm of interest is either designated manually or selected automatically based on the storm attributes.) The result of this function is a dynamic PRF selection that tracks up to three
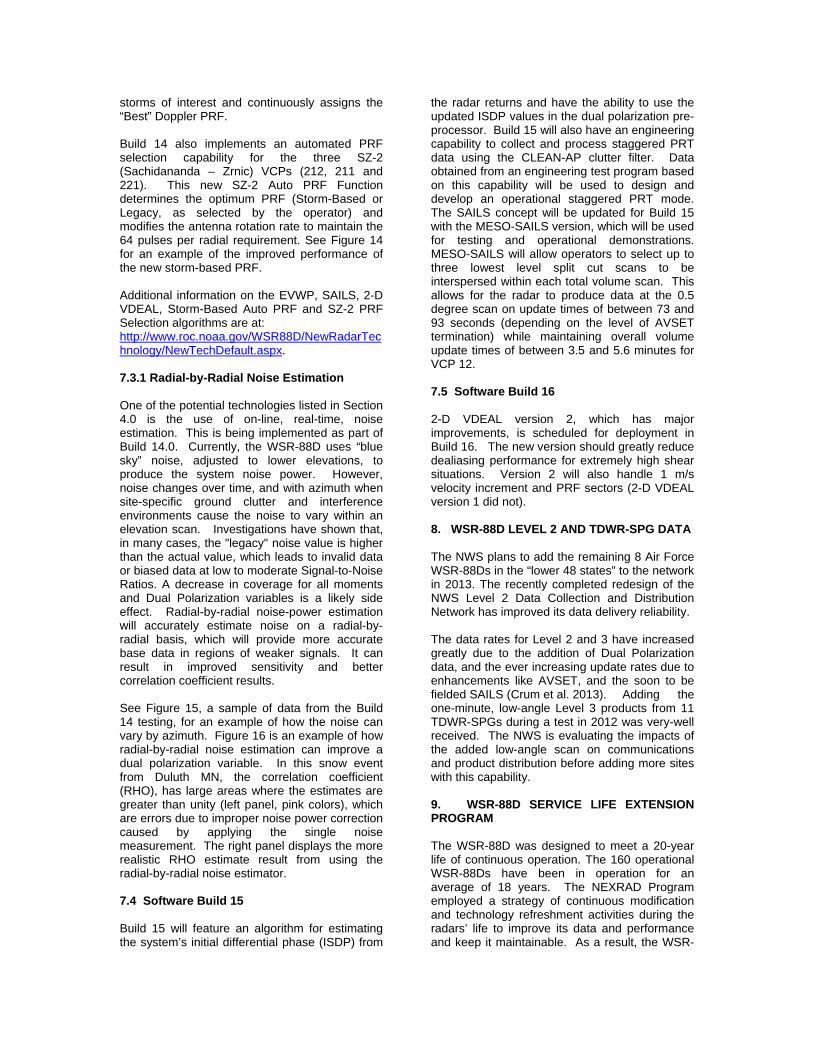
storms of interest and continuously assigns the “Best” Doppler PRF. Build 14 also implements an automated PRF selection capability for the three SZ-2 (Sachidananda – Zrnic) VCPs (212, 211 and 221). This new SZ-2 Auto PRF Function determines the optimum PRF (Storm-Based or Legacy, as selected by the operator) and modifies the antenna rotation rate to maintain the 64 pulses per radial requirement. See Figure 14 for an example of the improved performance of the new storm-based PRF. Additional information on the EVWP, SAILS, 2-D VDEAL, Storm-Based Auto PRF and SZ-2 PRF Selection algorithms are at: http://www.roc.noaa.gov/WSR88D/NewRadarTechnology/NewTechDefault.aspx. 7.3.1 Radial-by-Radial Noise Estimation One of the potential technologies listed in Section 4.0 is the use of on-line, real-time, noise estimation. This is being implemented as part of Build 14.0. Currently, the WSR-88D uses “blue sky” noise, adjusted to lower elevations, to produce the system noise power. However, noise changes over time, and with azimuth when site-specific ground clutter and interference environments cause the noise to vary within an elevation scan. Investigations have shown that, in many cases, the "legacy" noise value is higher than the actual value, which leads to invalid data or biased data at low to moderate Signal-to-Noise Ratios. A decrease in coverage for all moments and Dual Polarization variables is a likely side effect. Radial-by-radial noise-power estimation will accurately estimate noise on a radial-by-radial basis, which will provide more accurate base data in regions of weaker signals. It can result in improved sensitivity and better correlation coefficient results. See Figure 15, a sample of data from the Build 14 testing, for an example of how the noise can vary by azimuth. Figure 16 is an example of how radial-by-radial noise estimation can improve a dual polarization variable. In this snow event from Duluth MN, the correlation coefficient (RHO), has large areas where the estimates are greater than unity (left panel, pink colors), which are errors due to improper noise power correction caused by applying the single noise measurement. The right panel displays the more realistic RHO estimate result from using the radial-by-radial noise estimator. 7.4 Software Build 15 Build 15 will feature an algorithm for estimating the system’s initial differential phase (ISDP) from
the radar returns and have the ability to use the updated ISDP values in the dual polarization pre-processor. Build 15 will also have an engineering capability to collect and process staggered PRT data using the CLEAN-AP clutter filter. Data obtained from an engineering test program based on this capability will be used to design and develop an operational staggered PRT mode. The SAILS concept will be updated for Build 15 with the MESO-SAILS version, which will be used for testing and operational demonstrations. MESO-SAILS will allow operators to select up to three lowest level split cut scans to be interspersed within each total volume scan. This allows for the radar to produce data at the 0.5 degree scan on update times of between 73 and 93 seconds (depending on the level of AVSET termination) while maintaining overall volume update times of between 3.5 and 5.6 minutes for VCP 12. 7.5 Software Build 16 2-D VDEAL version 2, which has major improvements, is scheduled for deployment in Build 16. The new version should greatly reduce dealiasing performance for extremely high shear situations. Version 2 will also handle 1 m/s velocity increment and PRF sectors (2-D VDEAL version 1 did not). 8. WSR-88D LEVEL 2 AND TDWR-SPG DATA The NWS plans to add the remaining 8 Air Force WSR-88Ds in the “lower 48 states” to the network in 2013. The recently completed redesign of the NWS Level 2 Data Collection and Distribution Network has improved its data delivery reliability. The data rates for Level 2 and 3 have increased greatly due to the addition of Dual Polarization data, and the ever increasing update rates due to enhancements like AVSET, and the soon to be fielded SAILS (Crum et al. 2013). Adding the one-minute, low-angle Level 3 products from 11 TDWR-SPGs during a test in 2012 was very-well received. The NWS is evaluating the impacts of the added low-angle scan on communications and product distribution before adding more sites with this capability. 9. WSR-88D SERVICE LIFE EXTENSION PROGRAM The WSR-88D was designed to meet a 20-year life of continuous operation. The 160 operational WSR-88Ds have been in operation for an average of 18 years. The NEXRAD Program employed a strategy of continuous modification and technology refreshment activities during the radars’ life to improve its data and performance and keep it maintainable. As a result, the WSR-

88D continues to be upgradable, reliable, and maintainable through at least 2020, significantly exceeding the original design life of the system. While no replacement for the WSR-88D has been determined, research is underway to explore the benefits and capabilities of Phased Array Radar Technology and other alternatives. However, any replacement option will not be operational until the middle of the next decade or perhaps later. To meet the likely scenario that the WSR-88D fleet will be needed well beyond 2020, the NEXRAD agencies are planning a major WSR-88D Service Life Extension Program (SLEP). The SLEP will ensure the WSR-88D continues to meet its mission requirements through 2030, or until replacement technology is operational. The SLEP will focus on the following major components:
A technology refresh of the receiver/signal processor and the computers in the Radar Data Acquisition unit. This must be completed by 2018 because current processor components are either obsolete or projected to be obsolete from an Original Equipment Manufacturer support perspective.
Refurbish the transmitters, Refurbish the pedestals; and, Refurbish the three equipment
shelters at each operational site. 10. Monitoring ZDR Calibration The complexity of establishing and maintaining the calibration state of an operation radar network has driven managers of larger networks to establish remote and routine monitoring capability (Figueras I Ventura et. al., 2012, Frech, 2013). These monitoring programs involve collecting and analyzing all data relevant to determining the calibration state of individual radars. The ROC is in the process of developing and implementing such a program. The ROC acquires current values of all radar status and health parameters for each volume scan along with the level 2 data radar estimate data. The level 2 data is analyzed for regions of appropriate level precipitation and the mean ZDR value is compared to an expected value. For example, in light precipitation with sufficiently high levels of signal to noise ratio and dBz values of between 20 and 22 dBz, the ZDR should be about 0.2 dB (Segond et.al., 2007). Estimates of ZDR different from this expected value indicate a calibration error. Working with NSSL, the ROC
implemented a program to analyze the level 2 data using ranges of reflectivity from 20 to 30 dBz, with expected values of ZDR from 0.23 to 0.55 dB. The data is further selected from returns with signal to noise ratios of at least 20 dB and correlation coefficients of at least 0.98. Figure 17 shows a national map of the WSR-88D sites with the precipitation estimated ZDR biases indicated. Sites with estimated biases under 0.1 dB are depicted in green, sites with biases of between 0.1 and 0.2 are in yellow, and sites exceeding an estimated bias of greater than 0.2 are in red. Figures 18 and 19 show time series values for the estimated biases for two sites, one exhibiting a positive ZDR bias and one with a negative ZDR bias. Similarly, the mean ZDR returned from the Bragg scatter should be zero, and thus appropriately collected and filtered Bragg scatter data can be used to assess the calibration state of the radar (Cunningham, 2013, Hoban, 2014). Bias estimates based on Bragg scatter are also presented in Figures 18 and 19. Because the microwave radiation from the sun is un-polarized, the morning and evening sun strobes can also be used since the mean value of ZDR from this signal should be zero (Holleman, 2010). Any departure of the ZDR estimate from zero indicates a bias occurring in the receive path, including the antenna and the receiver channels. Figure 20 shows results of analyzing sun spikes for two sites. The plots show the estimated bias values and the relative position in azimuth and elevation of the sun spike when compared to the expected location of the sun. Some variance in the position is expected due to the nature of the analysis and the limitations on precision and stability of the antenna pedestal hardware. However, plots that do not appear symmetric about the center point can indicate an antenna pointing error. 11. THE FUTURE The future for the WSR-88D and the United States meteorological radar program is bright with no technological barriers in view. The evolution of fast computing coupled with major advances in analysis and software development has made once impossible tasks almost routine. The improvements possible to the critical foundational radar data will be only limited by available resources. The National Center for Atmospheric Research is implementing a sophisticated local radar research network in the front range of Colorado in partnership with Colorado State University. They are relocating the base of the S-Pol radar in

order to enhance performance and better position it for multiple radar experiments with CSU CHILL and the regional WSR-88D units in Denver and Cheyenne. The NCAR team is well positioned to provide significant improvements to the signal processing of polarimetric variables. They have devoted considerable effort to characterizing the effects of antenna errors, scattering, electromagnetic propagation, and clutter contamination on dual polarization variable quality (Hubbert, 2011). The National Severe Storms Laboratory and the University of Oklahoma continue their work on the National Weather Radar Testbed phased array system. This latter project has yielded many of the signal processing improvements described herein and will continue to provide valuable support to the NEXRAD program (Torres, 2011). Their science and engineering team continues to work on near term enhanced range velocity ambiguity mitigation improvements such as Staggered PRT. There are pending updates to this signal processing method that can be incorporated in the near term as the Radar Operations Center implements Staggered PRT as part of already planned deployments. The performance in range overlaid situations can be improved and a method is identified (Warde, 2009a). Research at the University of Oklahoma and the National Severe Storms Laboratory has also identified new radar moment estimators using multiple lag processing (Lei, 2009). This paper is not intended to prescribe specific programs or a list of techniques to implement for future signal processing. Rather it is intended as a resource for those charged with guiding the program through the next decade or so as the radar ages and undergoes a planned service life extension. The author’s hope is that this will stimulate bold thinking in this regard and the goal is to ensure the radar evolves with the demand for increasing services in a time of shrinking resources. There is no technical barrier preventing the radar from serving the public for the next twenty years in the same excellent manner as it has over the past twenty. Promising research continues at an accelerated pace. The WSR-88D Radar Operations Center team members plan to continue to work with their partners to fast track research breakthroughs into operational successes using a proven research to operations model. (Saxion, 2011). ACKNOWLEDGEMENTS The authors wish to express appreciation to the following individuals who willingly contributed key material for this work. These valued colleagues are: Dr. Sebastian Torres, Dr. Igor Ivic, and Mr.
David Warde of the University of Oklahoma, Cooperative Institute for Mesoscale Meteorological Studies, National Severe Storms Laboratory, and Dr. John Hubbert, Dr. Greg Meymaris, Dr. Mike Dixon, and Dr. Scott Ellis of the National Center for Atmospheric Research. REFERENCES Alberts, T. A., P. B. Chilson, B. L. Cheong, R. D.
Palmer, 2011, Evaluation of Weather Radar with Pulse Compression: Performance of a Fuzzy Logic Tornado Detection Algorithm, Journal of Atmospheric and Oceanic Technology, 28, 390 – 400.
Chrisman, J. N., 2009: Automated Volume Scan
Evaluation and Termination (AVSET); A Simple Technique to Achieve Faster Volume Scan Updates. 34th Conf. on Radar Meteorology.
Chrisman, J. N. and S. D. Smith, 2009:
Enhanced Velocity Azimuth Display Wind Profile (EVWP) Function for the WSR-88D. 34th Conf. on Radar Meteorology,
Crum, T. et al, 2013: 2013 Update on Access to
Real-Time and Archive NOAA Weather Radar Data: 2013. 29th Conf. on Environmental Information Processing Technologies.
Curtis, C. D. and S. M. Torres, 2013,
Measurement of the Range Correlation for Range Oversampling Processing, Journal of Atmospheric and Oceanic Technology, 30, 2885 – 2895.
Cunningham, J. G., W. D. Zittel, R. R. Lee, R. L.
Ice and N. P. Hoban, 2013. Methods for Identifying Systematic Differential Reflectivity (Zdr) Biases on the Operational WSR-88D Network, 36th Conf. on Radar Meteorology.
Curtis, C. D. and S. M. Torres, 2011 (a), Efficient
Range Oversampling Processing on the National Weather Radar Testbed, 27th Conference on Interactive Information Processing Systems for Meteorology, Oceanography, and Hydrology, Seattle, WA.
Curtis, C. D., and S. M. Torres, 2011 (b):
Adaptive range oversampling to achieve faster scanning on the National Weather Radar Testbed phased array radar, Journal of Atmospheric and Oceanic Technology, 28, 1581 - 1597
Elvander, R. C., S. M. Holt, B. Bumgarner, R. Ice,
2001, Weather Surveillance Radar – 1988 Doppler (WSR-88D) Open Radar Data

Acquisition (ORDA) Enhancements, 17th Conference on Interactive Information Processing Systems for Meteorology, Oceanography, and Hydrology.
Fabry, F., and R. J. Keeler, 2003, Innovative
Signal Utilization and Processing, Chapter 8 in Radar and Atmospheric Science: A Collection of Essays in Honor of David Atlas, American Meteorological Society Monograph
Figueras I Ventura, J, A. Boumahmoud. B.
Fradon, P. Dupuy and P. Tabary, 2012, Long-term Monitoring of French Polarimetric Radar Data Quality and Evaluation of Several Polarimetric Quantitative Precipitation Estimators in Ideal Conditions for Operational Implementation at C-band, Q. J. R. Meteorol. Soc., 138, 2210 – 2228.
Frech, M., 2013, Monitoring the Data Quality of
the New Polarimetric Weather Radar Network of the German Meteorological Service, 36th Conf. on Radar Meteorology.
Friedrich, K and U. Germann, 2009, Influence of
Ground Clutter Contamination on Polarimetric Radar Parameters, Journal of Atmospheric and Oceanic Technology, 26, 251 – 269.
Hoban, N. P., J. G. Cunningham, and W. D.
Zittel, 2014: Using Bragg Scatter to Estimate Systematic Differential Reflectivity Biases on Operational WSR-88Ds. 30th Conference on Environmental Information Processing Technologies.
Holleman, I., A. Huuskonen, R. Gill, and P.
Tabary, 2010: Operational monitoring of radar differential reflectivity using the sun. J. Atmos Ocean Tech, 27, 881-887.
Hood, K. T., S. M. Torres, R. D. Palmer, 2010,
Automatic Detection of Wind Turbine Clutter for Weather Radars, Journal of Atmospheric and Oceanic Technology, 27, 1868 – 1880.
Huang, N. E. et al, 1998, The Empirical Mode
Decomposition and the Hilbert Spectrum for Nonlinear and Non-stationary Time Series Analysis, Proc. Royal Society of London 454, 903 – 995.
Hubbert, J. C., G, Meymaris, M. Dixon, S. Ellis,
2011, Modeling and Experimental Observations of Weather Radar Ground Clutter, 27th Conference on Interactive Information Processing Systems for Meteorology, Oceanography, and Hydrology, Seattle, WA.
Hubbert, J. C., M. Dixon, S. M. Ellis and G. Meymaris, 2009a, Weather radar ground clutter. Part 1: identification, modeling, and simulation. J. Atmos. Oceanic Technol., 26, 1165-1180.
Hubbert, J. C., M. Dixon, S. M. Ellis and G.
Meymaris, 2009b, Weather radar ground clutter. Part 2: Real-time identification and filtering,. J. Atmos. Oceanic Technol., 26, 1181-1197.
Hubbert, J. C., V. N. Bringi, and D. Brunkow,
2003, Studies of the Polarimetric Covariance Matrix. Part I: Calibration Methodology, J. Atmos. Oceanic Technol., 20, 696 - 706.
Hubbert, J. C., F. Pratte, M. Dixon, R. Rilling, and
S. Ellis, 2007, Calibration of ZDR for NEXRAD, 23rd International Conference on Interactive Information Processing Systems for Meteorology, Oceanography, and Hydrology.
Ice, R. L. et al, 2009: Automatic Clutter Mitigation
in the WSR-88D - Design, Evaluation, and Implementation. 34th Conf. on Radar Meteorology.
Ice, R. L., D. S. Saxion, O. E. Boydstun, W. D.
Zittel, R. W. Hall, G. S., Cate, R. D. Rhoton, R. W. Macemon, B. Walker, 2011, Sensitivity of Operational Weather Radars, 27th Conference on Interactive Information Processing Systems for Meteorology, Oceanography, and Hydrology, Seattle, WA.
Ice, R. L., A. K. Heck and J. G. Cunningham,
2013, Polarimetric Weather Radar Calibration – Engineering Challenges, 36th Conf. on Radar Meteorology.
Istok M. et al, 2009: WSR-88D Dual Polarization
Initial Operational Capabilities. 25th Conf. on Interactive Information and Processing Systems.
Ivic, I. R., D. S. Zrnic, T. Yu, 2009, The Use of
Coherency to Improve Signal Detection in Dual-Polarization Weather Radars, Journal of Atmospheric and Oceanic Technology, 26, 2474 – 2487.
Ivic, I. R., C. Curtis and S. M. Torres, 2013, Radial Based Noise Power Estimation for Weather Radars, Journal of Atmospheric and Oceanic Technology, 30, 2737 – 2753.
Ivic, I. R. and S. M. Torres, 2011, Online
Determination of Noise Level In Weather Radars, 27th Conference on Interactive Information Processing Systems for

Meteorology, Oceanography, and Hydrology, Seattle, WA.
Keeler, R. J., and R. E. Passarelli, 1990, Signal
Processing for Atmospheric Radars, Chapter 20a in Radar in Meteorology, David Atlas Ed., American Meteorological Society.
Langlieb, N. and W. Tribout, 2010. Application of
a 2-Dimensional Velocity Dealiasing Algorithm in the WSR-88D Network. A Senior Capstone Project at the University of Oklahoma.
Lei, L., G. Zhang, R. D. Palmer, B. L. Cheong, M.
Xue, and Q. Cao, 2009, A Multi-lag Correlation estimator for Polarimetric Radar Variables in the Presence of Noise, 34th Conference on Radar Meteorology, Williamsburg, VA.
Melnikov, V. M. and P. T. Schlatter, 2011,
Enhancing Sensitivity on the Polarimetric WSR-88D, 27th Conference on Interactive Information Processing Systems for Meteorology, Oceanography, and Hydrology, Seattle, WA.
Meymaris, G., J. K. Williams, and J. C. Hubbert,
2009, An Improved Hybrid Spectrum Width Estimator, 34th Conference on Radar Meteorology, Williamsburg, VA.
National Academy of Sciences, National
Research Council, 2004, Weather Radar Technology Beyond NEXRAD, National Academy Press, Washington, DC. Web link: http://books.nap.edu/openbook.php?record_id=10394&page=R1
Saxion, D. S. and R. Ice, 2011, Enhancing the
Foundational Data from the WSR-88D: Part I, A History of Success, 34th Conference on Radar Meteorology, Pittsburgh, PA.
Saxion, D. S., D. Zittel, O. Boydstun, R. Rhoton,
R. Ice, J. Krause, S. Torres, D. Warde, 2009, New Science for the WSR-88D: Staggered PRT Implementation on the Vaisala/Sigmet RVP8, 34th Conference on Radar Meteorology, Williamsburg, VA.
Segond, M. L., P. Tabary and L. P. du Chatelet,
2007, Quantitative Precipitation Estimations from Operational Polarimetric Radars for Hydrological Applications, 33rd Conference on Radar Meteorology, Cairns, AU.
Snow, J. T. and R. B. Scott, 2003, Strategic
Directions for WSR-88D Doppler Weather Surveillance Radar in the Period 2007 –
2025, 31st Conference on Radar Meteorology, Seattle WA.
Torres, S. M., 2009, Processing of Oversampled
Signals in Range on Polarimetric Weather Radars with Mismatched Channels, Journal of Atmospheric and Oceanic Technology, 26, 1289 – 1301.
Torres, S. M., R. Adams, C. Curtis, E. Forren, I.
Ivic, D. Priegnitz, J. Thompson, D. Warde, 2011, Software and Signal Processing Upgrades for the National Weather Radar Testbed Phased Array Radar, 27th Conference on Interactive Information Processing Systems for Meteorology, Oceanography, and Hydrology, Seattle, WA.
Yu, T., G. Zhang, A. B. Chalamalasetti, R. J.
Doviak, D. Zrnic, 2006, Resolution Enhancement Technique Using Range Oversampling, Journal of Atmospheric and Oceanic Technology, 23, 228 – 240.
Warde, D. A., and S. M. Torres, 2009a, Range
Overlaid Staggered PRT, 25th International Conference on Interactive Information Processing Systems for Meteorology, Oceanography, and Hydrology.
Warde, D. A., and S. M. Torres, 2009b,
Automatic Detection and Removal of Ground Clutter Contamination on Weather Radars, 34th Conference on Radar Meteorology, Williamsburg, VA.
Warde, D. A., 2012, Range and velocity
ambiguity mitigation using spectral reconstruction for Doppler weather radars, 28th International Conference on Interactive Information Processing Systems for Meteorology, Oceanography, and Hydrology.
Warde, D. A. and S. Torres, 2014, The
Autocorrelation Spectral Density for Doppler-Weather-Radar Signal Analysis, IEEE Trans. On Geoscience and Remote Sensing, 52, No. 1, 508 - 518.
Witt, A. and Coauthors, 2009. Performance of a
New Velocity Dealiasing Algorithm for the WSR-88D. 34th Conf. on Radar Meteorology.
WSR-88D Radar Operations Center web site:
http://www.roc.noaa.gov/radar. Zittel, W.D., Zhongqi, J., 2012: Comparison of a
2-D Velocity Dealiasing Algorithm to the Legacy WSR-88D Velocity Dealiasing Algorithm During Hurricane Irene. 30th Conf. on Hurricanes and Tropical Meteorology.

Zrnic, WePeMe
D. S. and A.eather Surve
erspective, 31eteorology, Sea
. Zahrai, 2003illance Radar
1st Conferencattle WA.
Figu
3, Evolution ofrs – NSSL’sce on Radar
Table
re 1 – Effect o
f s r
es and Figures
of Clutter on Z
s
ZDR Estimatess

Figure 2 – SD ZDR Histograms of W
Figure 3 – H
Weather and Cl
H and V Solar
utter and Mem
r Scans
mbership Funcction

Figure
Figure 5 –
e 4 Difference
Baseline Meth
in H and V So
hod vs. On-lin
olar Scan Pow
ne estimate for
wer
r noise

Figu
Figure 6 – C
re 7 – CLEAN-
CLEAN-AP Au
-AP Operating
utomatically R
g on the Natio
Removing AP
onal Weather R
Clutter
Radar Testbed
d

Figure 8 – Comparison of Matched Filtering and Two Oversampling and Whitening Methods

Figureproduon Mamore wind p
FigureNY WSdeg azright. Note tVDA, Zhong
e 9 - A compaucts using the ay 11, 2010. Taccurate obseproduct.
e 10 - Using thSR-88D (KOKXzimuthal resoIrene’s circula
the large yellobut the absengqi, 2012)
rison of legacsame Level 2he EVWP provervations. Th
he same LevelX) at 07:21 UTlution velocityation center is
ow wedge of innce of imprope
cy VWP (left) a2 data set fromvides an averais improves th
l 2 data set of TC and 0.5o eley product is os 150 nm soutncorrectly deaerly dealiased
and Enhancedm the Oklahomage of approxhe operationa
Hurricane Ireevation, a comn the left, the th-southwest oaliased velocit
velocities the
Velocity Windma City, OK WSximately 50% ml usability of t
ne on Augustmparison of th
2-D VDEAL dof radar. Ranties to the nore 2-D VDEAL p
d Profile (EVWSR-88D (KTLXmore wind obsthe WSR-88D
t 28, 2012 fromhe Legacy VDAealiased prodge rings are erth-northwest produces. (Zi
WP) (right) X) at 00:40 UTservations anenvironmenta
m the Upton, A dealiased ½duct is on the every 50 nm. for the legacyttel and
C d
al
½
y

Figurethund07:54 areas gust f(Lang
Figurelarge TX WSimagethrougdealianorth
e 11 - Similar derstorm outflo
UTC. The legaof Legacy VD
front in the cirlieb and Tribo
e 12 - Similar area of improSR-88D (KAMAe, the Legacy Vgh south, to w
asing algorithmeast of Amari
to Figure 10, ow boundary acy VDA (left)
DA improperly rcled area (leftout, 2010)
to Figures 10perly dealiaseA) on August VDA has impr
west. The 2-D ms handled thillo in about th
a comparisonfrom the Okla and 2-D VDEAdealiased vel
t image). The
and 11, but thed data in a sto23, 2011 at 22
roperly dealiasVDEAL correc
he motion of thhe same mann
n of the velocitahoma City, OAL (right) prolocities south 2-D VDEAL p
his time with aorm-free envir
2:07 UTC and 0sed the velocicted the problhe traffic on thner.
ty dealiasing aOK WSR-88D (
ducts are dispof the radar aroduct has on
an example ofronment. The0.5o elevationity data for ~1lem (right) imahe two major r
algorithms aloKTLX) on Junplayed. Noticalong the leadnly a very sma
f how 2-D VDEe data are from in VCP212. I50 deg from tage. Notice throadways eas
ong a ne 20, 2007 at e the two ing edge of th
all error.
EAL corrects am the Amarillon the left he east, he two st and east
he
a o,
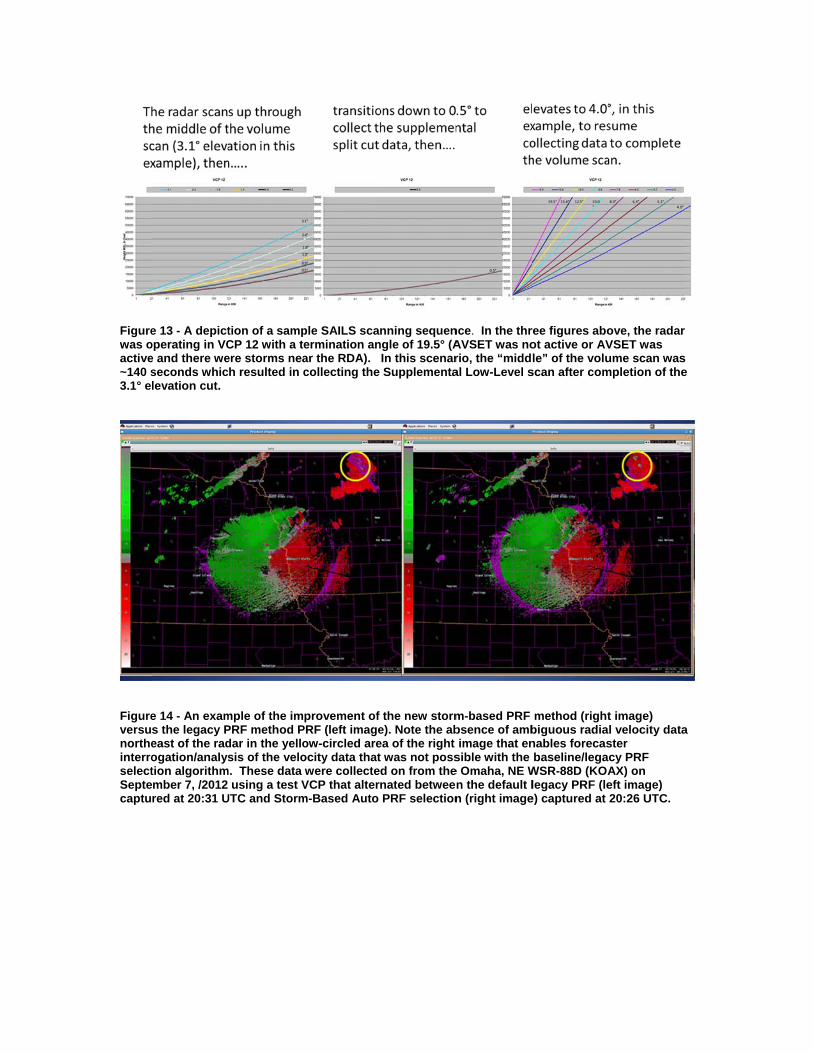
Figurewas oactive~140 s3.1° el
FigureversusnortheinterroselectSeptecaptu
e 13 - A depictoperating in VCe and there weseconds whiclevation cut.
e 14 - An exams the legacy Peast of the radogation/analystion algorithmmber 7, /2012 red at 20:31 U
tion of a sampCP 12 with a teere storms neah resulted in c
mple of the imPRF method Pdar in the yellosis of the velo
m. These data using a test V
UTC and Storm
ple SAILS scaermination anar the RDA). collecting the
provement of PRF (left imageow-circled areocity data thatwere collecte
VCP that alterm-Based Auto
nning sequenngle of 19.5° (AIn this scenarSupplementa
the new storme). Note the abea of the right t was not possd on from thenated betweenPRF selection
nce. In the thrAVSET was norio, the “middal Low-Level s
m-based PRF bsence of ambimage that en
sible with the e Omaha, NE Wn the default ln (right image
ree figures aboot active or AVle” of the volu
scan after com
method (rightbiguous radianables forecasbaseline/lega
WSR-88D (KOAlegacy PRF (le
e) captured at
ove, the radarVSET was ume scan wasmpletion of the
t image) l velocity dataster cy PRF AX) on eft image) 20:26 UTC.
r
s e
a

Figureoutpudifferediffere
Figureestimacolorsnoise
e 15 – The topt and the defa
ence can be nence between
e 16 – Comparates (right pans in the left papower adjust
p two panels sault noise meaearly 2 dB depthe H and V c
rison of correnel) versus de
anel representment.
how the differasurement takpending on thchannel noise
lation coefficiefault noise m RHO values o
rence betweenken once everyhe particular a.
ent (RHO) for easurement (lof greater than
n the radial-byy volume scan
azimuth. The b
r a snow eventleft panel). Thn one, which a
y-radial noise n at one azimubottom panel
t with radial-bhe predominaare in error du
estimator uth. The shows the
by-radial noisent light pink ue to imprope
e
r

Figure
Figure
e 17 – Precipit
e 18 – Time Se
tation Estimat
eries of Precip
ted ZDR Bias b
pitation and B
by Site, throug
ragg Estimate
gh June 2013
ed Bias, KICT,
.
, Positive Bias
s Indicated

Figure
Figure
e 19 – Time Se
e 20 – ZDR Bia
eries of Precip
as Estimated f
pitation and B
from Sun Spik
ragg Estimate
kes for Two Si
ed ZDR Bias, K
ites
KTLX, Negativve Bias