ice-front change and iceberg behaviour along dates and 1912-96 · ice-front change and iceberg...
TRANSCRIPT
AnnaLs ofGLacioLogy 27 1998 © International Glaciological Society
Ice-front change and iceberg behaviour along Dates and George V Coasts, Antarctica, 1912-96
MASSIMO FREZZOTTI,I ALESSANDRO CIMBELLI, I JANE G. FERRIGN02
IENEA-AMB, Gr Gasaccia, Po. Box 2400, 1-00100 Rome AD, Italy 2 United States GeoLogicaL Survey, 955 NationaL Genter, Reston, VA 22092, US.A.
A B STRACT. Ice-front change may well be a sensitive indicator of regional clim ate change. We have studied the western Oates Coast from Cape Kinsey (158°50' E, 69° 19' S) to Cape Hudson (153 °45' E, 68°20' S) a nd the entire George V Coas t, from Cape Hudson to Point Alden (142°02' E, 66°48' S). The glaciers here drain part of the Dome Charli e a nd Talos Dome a reas (640000 km 2
) . A compa ri son between va rious documents, da ted several years apart, has allowed an estimate of the surficial ice discharge, the ice-front fluctuation and the iceberg-calving flux during the la t 50 fea rs. The ice-front discharge of the studied coast has been esti mated at about 90 + 12 km a- I in 1989- 91, 8.5 km 3 a 1 for wes tern Oates Coast and 82 km 3 a 1 for George V-Coas t. From 1962- 63 to 1973- 74 the floating glaciers underwent a net reduction that continued from 1973- 74 to 1989- 91. On the other hand, from 1989- 91 to 1996 the area ofO oating glaciers increased. Ninnis Glacier Tongue and the western part of Cook Ice Shelf underwent a significant retreat after 1980 and 1947, respectively. Satellite-image analysis oflarge icebergs has provided information about ice- ocean interaction and the existence of an "iceberg trap" along George V Coast. A first estimate of the mass balance of the drainage basin of Mertz and Ninnis Glaciers shows a value close to zero or slightly negative.
INTRODUCTION
The effects of global climate change may prove to be more pronounced in Antarctica than at mid-l atitudes ("Veller, 1993). Floating glaciers (ice shelves, ice tongues and glacier tongues) a re sensitive to atmospheric warming, as shown by the break-up of ice shelves a round the Antarctic Peninsula (Doake and Vaughan, 1991; Skvarca, 1994; Vaughan and Doake, 1996; Rott and others, 1996). Vaughan and Doake (1996) and Frezzotti (1997) pointed out tha t the extent of fl oating glaciers may well be a sensitive indicator of regional climate change. Much uncertainty about iceberg-calving processes makes it difficult to determine the present icesheet mass bala nce Oacobs and others, 1992).
The O ates Coast is located between Cape ''''illiams (164°09' E, 70°30' S) and Cape Hudson (153°45' E, 68°20' S) and the George V Coast between Cape Hudson and Point Alden (142°02 ' E, 66°48' S). In a previous paper, Frezzotti (1997) studied the eastern part ofOates Coast between Cape William and Cape Kinsey (158°50' E, 69° 19' S); in this paper, the western part of O ates Coast, between Cape Kinsey and Cape Hudson, and the entire George V Coast have been studied. The study area is approximately 1400 km long. The ice shelves and glacier tongues here are fed by glaciers draining part of the Dome Charli e and Talos Dome areas (640000 km 2
). Bentley and Giovinetto (1991) pointed out tha t no mass-balance assessments of the East Antarcti c ice sheet section that drains along O ates and George V Coasts have been made. Here we present a description of coastline change since 1912 and, as a step towards reducing the uncertainties about mass balance, we have attempted to evaluate the average a rea of iceberg calving each year (iceberg-calv-
ing flu x) and the volume of ice di scharged at the ice front (icefront di scharge volume) in 1989- 91. Satellite-image analysis of la rge icebergs can provide useful information about iceberg behav iour, ocean currents and ice- ocean interaction. A fi rs t estimate of the mass balance of the drainage basin of Mertz and Ninnis Glaciers has been made.
MATERIALS, METHODS AND DATA
P reviou s work
Various authors (e.g. Ferrigno and Gould, 1987; Ferrigno and others, 1993; Lucchitta and others, 1993; Skvarca, 1994; Frezzotti and Mabin, 1994; Vaughan and Doake, 1996; Frezzotti , 1997) have shown that reliabl e records of ice-front changes and the velocity offloating glaciers can be obtained by analysis and comparison of different sources (historical maps a nd records, aerial photographs, satellite images ) documenting conditions over several years.
The eastern par t of O ates Coast was discovered during the 1910- 13 Scott expedition. Maps draw n then do not allow accurate identification or mapping of floating glaciers. George V Coast was explored and mapped by members of the Australasian Antarctic Expedi tion (19 11 - 14) under Sir Douglas Mawson (Mawson, 1914). However, the available materi al provides only a general outline of the Mertz and Ninnis Glacier Tongues observed at those times. Aeri al photographs of O ates and GeOl-ge V Coasts were taken by the U. S. Navy and Austra li an National Anta rctic Research Expedi tion (ANARE) using the trimetrogon aerial camera system (TMA) between 1947 and 1962. These photographs were used by the Austra li an Division of National Mapping
643
Freaotti and others: Icefront change and iceberg behaviour, Oates and George V Coasts
Table 1. Areas qf floating glaciers, western Oates Coast, 1947- 96, shadow ice-thickness data average (IT) and surficial ice discharge at icefront (SID )
No. Floating glaciers Long. Lat. IT SID Floating ice area 1947" 1962' 1973' 1980f 1989g 1996J
1959 h 1963d I991 h
E S m km 2 a- I km 2 km 2 km 2 km 2 ') km- km 2
I glaciers 158°30' 69°20' 0.6±0.2 21.5' 22.3 21.3 24.9g 26.4 2 glacier 158°06' 69°12' 0.2±0.1 9.5" 8.3 9.2 8 7.7 3 Matusevich GlacierTongue 15TI6' 69°07' 270 10.0±0.3 353" 373' 400 479 267g 315.8 4 glacier tongue 156°53' 69°09' 295 0.5±0.2 42' 48 39 40.5g 39.3 5 ice shelf 156° 15' 69°03 ' 365 11.4± l.l 466' 591 510" 530 6 glacier 155°271 68°57' 410 0.5 ± 0.2 42d 47.5 44" 54 7 Slava lee Shelf 154°51' 68°43' 400 3.0 ± 0.6 190" 307d 280 336k 351
vVestern Oates Coast Total 26.2± 3 1261 1397 1230 1324
For locations see Figure I. Areas of floating glaciers were calculated using various dated ice-from positions but the same grounding line. a, b, c, Australian sketch map (I: I 000000); d, Argon photo; e, Landsat I MSS; f, Landsat 3 RBV; g, h, Landsat 4--5 TM;j, ERS I SAR; k, hypothesized.
to compile 1: 1000000 scale sketch maps of the area. The Soviet Antarctic Expedition mapped the ice-front position of Mertz and Ninnis Glacier Tongues during February 1958 (Bardin, 1964; Koblents, 1965) using aerial photographs; moreover Koblents (1965) reponed the ice-front position mapped by an aerial survey of the French Antarctic Expedition ofMertz GlacierTongue in 1952. During the U.S. Deep Freeze 79 expedition, a new map of the Mertz and Ninnis G lacier Tongues was drawn using ship's radar (Anderson and others, 1979). Wendler and others (1996) usedJapane e SARJERS-l satellite images, acquired in 1993 and 1994, to study Mertz and Ninnis GlacierTongues.
Methodology
In this study, we have integrated the previous data with satellite images and photos acquired by Argon (1963), Landsat 1
MSS (1973- 74), Landsat TM 4 and 5 (1989- 91), ERS 1- 2 SAR (1996) of the entire Oates and George V Coasts, a Landsat 3 RBV image (1980) for a part ofOates Coast and a Soyuz Kosmos KATE 200 image (1984) for the western part of George V Coast. Digital data were used when available but were not available [or Argon, Soyuz Kosmos KATE 200, Landsat 3 RBVand some Landsat I MSS images, therefore the photographic products were scanned from 50 pm to 200 pm to obtain a digital dataset.
Satellite-image maps with a spatial resolution of 30 m pixel- I were created using Landsat TM images. Images were georeferenced by means of geographical coord inates of satellite-image corners. Georeferencing was carried out by rectifying the images in a Polar Stereographic projection, using a linear conversion matrix. Using these georeferenced TM satell ite images as a reference, other
Table 2. Areas qf floating glaciers, George V Coast, 1912- 96, shadow ice-thickness data average ( IT) and surficial ice discharge at ice front (SID )
No. Floating glaciers Long. Lat. IT SID Floating ice area 1912 a 1.963' 1973 d 1.98~ 1.98.9g 1.9.96' 1.947b 1974 ' 1.9.9/"
E S m km2a I km 2 km 2 km2 km2 km 2 km 2
8 Cook Ice Shel f 151 °53' 68°30' E 375 70.0±4.2 3840b 3960 2577d 2885g 3200 W 585
9 ice shelf 1500 16' 68°25' 170 20.5 ± l.0 157 133d 117g 131 10 glacier 149°31' 68°21' 165 2.1 ±0.4 162 177d 129g 144 11 glacier 149° 13' 68°24' 170 0.6±0.2 29.5 23.8d 23.3g 21.3h
12 Ninnis GlacierTongue 14T27' 68° 15' E 375 90.0± 7.5 2970 3400· 2138 2166" 2510 GT420 W220
13 glacier 146°36' 67°56' 1.1 ±0.2 105 102" 100 105h 1051. 14 glacier 146° 17' 67°42' 300 1.6±0.2 159 144e 149 143.5h 142 IS glacier 145°35' 67°33' 245 2.4±0.4 163 147.si 147.5 158.5& 175 16 Mertz GlacierTongue 144°58' 67 °22' 255; 45.0± 1.4 4950" 4100 4550d 4730 4940& 5250
George V Coast Total 233.0 ± 15.5 11805 11254 10667 11678
For locations sec Fig ures 2 and 3. Areas ofnoaling glaciers were calculaled using various dated ice-front posilions bUl the same grounding line. Data sources used: a, Mawson (1914); b, Austra lian sketch map (I: I 000000); c, Argon phOlO; d, e, Landsal I MSS; f, Soyuz Kosmos Kate; g, h, Landsat 4--5 TM; i, Wendler and others (1996); j, hypothes ized; k, ERS 1- 2 SAR;G1~ glacier tongue; E, eastern part; W, western part.
644
Fre;::;::otti and others: Icejront change and iceberg behaviour, Gates and George V Coasts
satellite images and photos (Argon, Landsat I MSS, Landsat 3 RBY, Soyuz Kosmos KATE 200 and ERS 1- 2 SAR) were rectified by identifying about 10- 15 tiepoints for each image pair and using a linear conversion matrix giving an rms error ranging from 1- 3 pixels.
The available maps have considerable and largely unknown inaccuracies. These have been corrected where possible through reference to the satellite-derived data and only the data that are in agreement with satellite-image data and glaciological features (ice flow, ice velocity, ice-front change etc.) have been used. The satellite images and maps of floating glaciers were analysed, compared and organized into a geographic information system (GIS) using ERDAS and ARCINFO software (Tables I and 2). The geographical positions of glacial features (ice fronts, snowdrifts, sastrugi, drift plumes, crevasses, etc.) in different years made it possible to determine the surface velocities and positional variations of the ice fronts.
Landsat TM satellite images were acquired (21 Feb 1989, 17 Feb 1991,3 Mar 1989 and 15 Mar 1991) with low Sun-elevation angles (respectively 20°, 20°, 18 0 and 13° above the horizon). By measuring the length of the shadows, we used the known Sun elevation to calculate the freeboard of icebergs and glacier tongues (Swithinbank, 1988). Applying the freeboard-thickness relationships of Shabtaie and Bentley (1982) and of Keys and Fowler (1989), developed for the Ross Ice Shelf and the icebergs grounded along the Victoria Land coast, we computed ice-front and iceberg thickness at 241 points to evaluate the iceberg-discharge volume, assuming a density of 1027.5 kg m -3 for sea water and 865 kg m - 3 for floating ice. We estimated an error of 1 pixel (28.5 m) in the determination of shadow length and therefore an error in the determination of ice thickness between 42 m (W ) and 65 m (20 0
) .
As a step towards reducing the uncertainties about the iceberg-calving rates, we attempted to evaluate the average area of iceberg calving each year (surficial flux ) and, where ice thicknesses are available, the volume of ice discharged at the ice front during 1989-91. The surficial iceberg-calving flux was assessed on the basis of the annual surficial ice-front discharge of each floating glacier and the change in area of glacier tongues and ice shelves during the study period (surficial iceberg-calving flux = surficial ice-front discharge -change in floating glacier area a- I). The surficial ice discharge was estimated at the floating ice front on the basis of the average velocity and of the width measured using satellite images. Frezzotti and others (1998) have evaluated the errors in measured average velocity through comparison of GPS data and satellite-image tracking data and have determined an error of satellite-tracking ice-velocity measurement of ± 15- 70ma- l
. We used the ice velocity at the ice front because of the longitudinal and transversal strain rate present in the floating part mainly where the tongue emerges from the fjord.
Ice-thicknesses ofNinnis and Mertz Glaciers have been obtained from airborne radio-echo sounding (RES) surveys by the Scott Polar Research Institute, the U.S. National Science Foundation and the Technical University of Denmark (Steed and Drewry, 1982; Drewry and Jordan, 1983). Inertial navigation systems were used for navigation; this technique presents errors which increase as navigation proceeds. Integration of data about ice thickness (airborne RES survey) and ice velocity (satellite-image tracking) presented many difficulties due mainly to lack of ground-
control points for satellite-image rectification and navigational inconsistencies in the RES data. Therefore ice discharge at the grounding line, calculated on the basis of these data, is only a general estimate.
The drainage area of the Mertz and Ninnis Glacier basin has been calculated using a digital elevation model (DEM) derived by ERS 1 radar altimeter data (Brisset and Remy, 1996).
156'E Australian map 1962 - - and Argon 1963
Landsat 1973 - - Landsal 1980 - Landsall989·91
o I
ERS 1996
Grounded ice sheet
km 40
Borornskiy r Cape Launtzen j I
.<', /l Bay ({\~
(i) . - .~ ® ~'~~69'S
"c ~~ 2 ~~ , i .-~
Cape Kinse\
1$4' 5 t56"£ '58' E u-________________ ~ ________________ ~ _____ M·~S
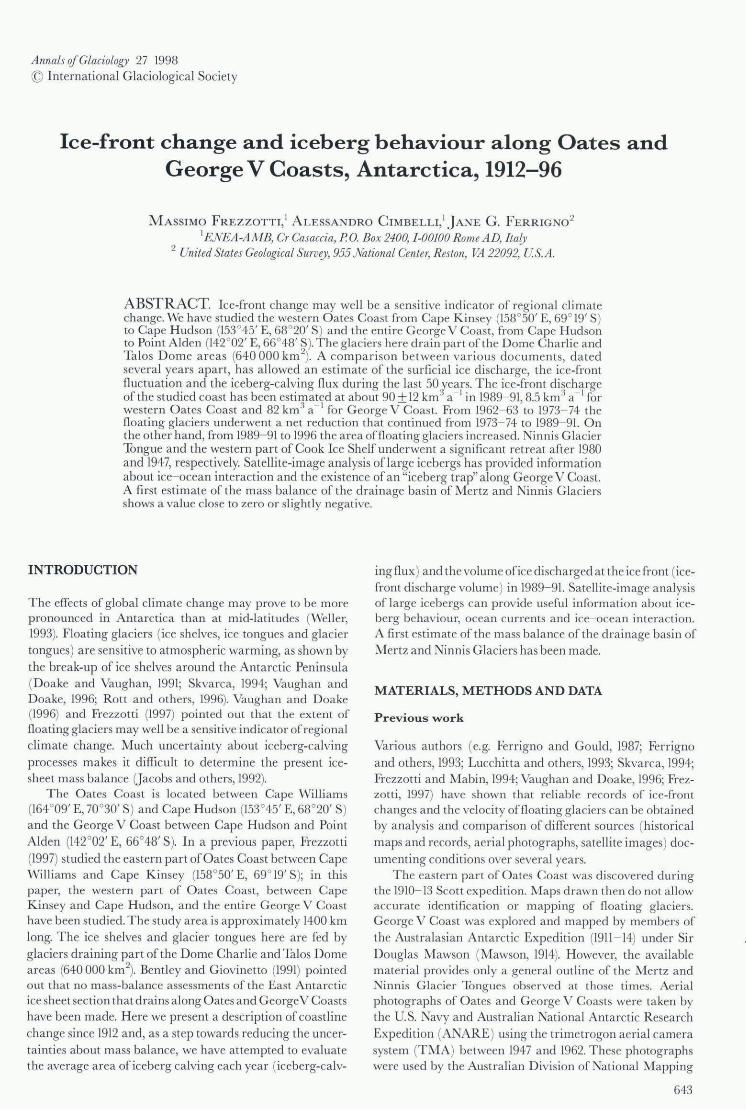
Fig. 1. Variations in the ice front, western Gates Coast. Numbers are used to identifj unnamedfeatures.
DISCUSSION
Oates Coast
The part ofOates Coast studied extends from Cape Kinsey to Cape Hudson (Fig. I). The glaciers flowing in the central part, from Cape Kinsey to Buromskiy Cape (155°27' E, 68 0 57' S), drain the northwestern slope ofTalos Dome, the extreme northeastern sector of the East Antarctic ice sheet. In the western coastal stretch, between Slava Ice Shelf and Cape Hudson, are the glaciers that drain the coastal areas of the Mawson Peninsula. The glaciers in these two sections of coast together drain an area of about 75000 km 2
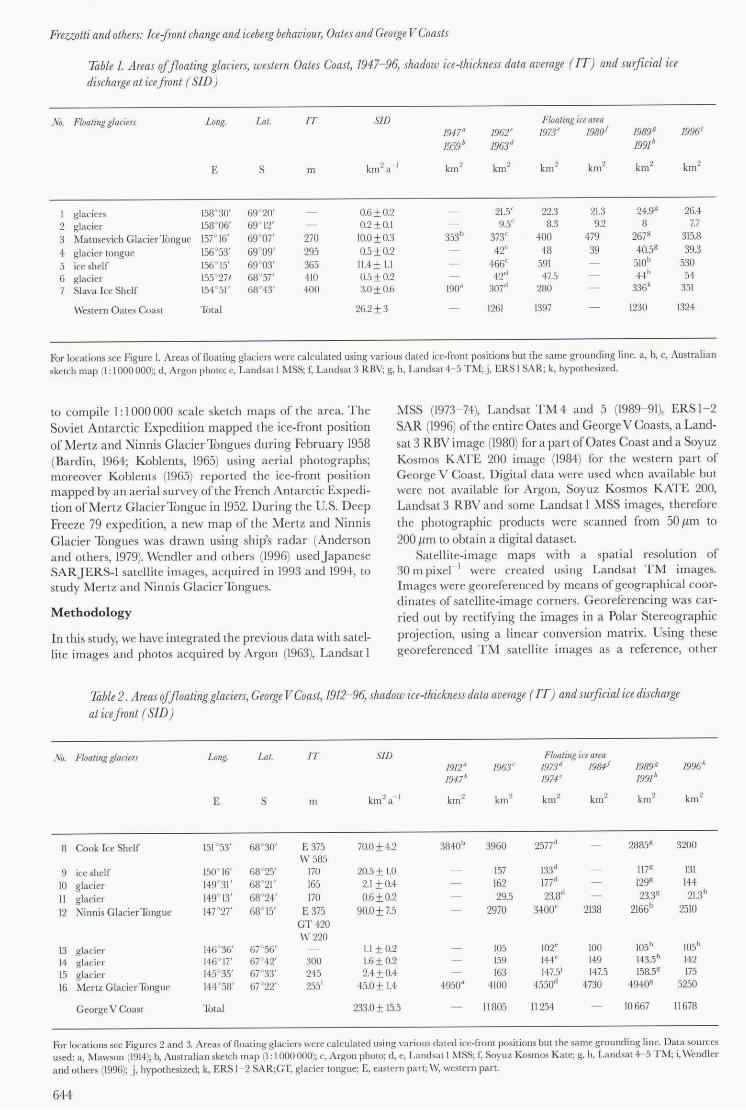
. The area of the floating glaciers in 1996 was 1334 km 2 (Table I), The main glaciers here are Matusevich Glacier and those glaciers that feed the ice shelf (No. 5) flowing into Lauritzen Bay (Fig. I). The surficial ice discharge of the floating glaciers that terminate at this part of the coast can be estimated at around 26 ± 3 km 2 a- I, about 82% of which is from Matusevich Glacier (10 ± 0.3 km 2 a I) and ice shelf No. 5 (11.4 ± 1.1 km 2 a- I). Using the surficial ice discharge and the ice thickness derived from the shadow satellite-image technique for each glacier, we estimated for 1989- 91 an ice-front discharge volume of about 8.5 ± 1.8 km2 a- I for western Oates Coast. Between 1962- 63 and 1973, an increase of about 136 km 2 of the area of floating glaciers occurred, with an average value of iceberg calving of 12 km 2 a- I However, during the period from 1973 to 1989- 91 there was a reduction in the area offloating glaciers of about 167 km 2 with an average iceberg-calving value of 36 km 2 a- I. Between 1989- 91 and 1996 we evaluated an increase of about 104 km 2 with an average iceberg-calving value of 12 km 2 a- I. The major calving events for Matusevich Glacier Tongue occurred in 1947
645
Freaotti and others: lcefront change and iceberg behaviour, Gates and George V Coasts
500~----------~--~~~~--=-~--------------' Matuaevlch Glacier Tongue 50 glacier tongue No 4
j\, 48 .,.,
I \ I \
I \ 48 I
\ I
\ 400
/ , '1: /
, ...
/ .. I
~ 44 I
\ I
\/ I /
\ 42 \ ,/" \
40 , , , ,
300
. .....
2oo+---~--~--------~------_r--------r_------~ 38 1950 1960 1970 1980 1990 2000 1960 1970 1990 1990 2000
Ve.r Ve.r
6OOr-------------------------------------, Ice shelf No 5
5000 Cook Ice SheH /1 ,
/ I , / , / 1 , 4000 -------/' ,
11 , , 11 , - 11
.. T , , 13000
~E , ? '----, ~ / 1 , / c
' 0'" 1 2000
550
500
1000 - ... _-- ..... -
------w 480+-----~--~----~----.-----~---,----~----~ O+-------~------~------~------._--~--~--~
1960 1970 1980 Ye.r
1990 2000 1945 1955 1965 Y •• r 1975 1985 1995
4ooo~------------------------------------------, Nlnnls Glacier 5500~------------------------------------------~
3000 ,
\ \ , ,
, \
,
Mertz Glacier Tongue
" /
/ T / ''v--_ .... , J 4500
\~GT 1000
646
.... ---_ .... _-~ ____ .. __ -:::. _I::; __ ... __ W
- - .... - -e
o+-------~--------~------_r--------r_------~ 3500 +---~----~--------r_--~----r_--~----r_--~ 1950 1960 1970 1980 1990 2000 1910 1930 1950 1970 1990
Ve.r. V •• r.
Fig. 2. Changes in the area if selected floating glaciers with time. Dotted line, uncertain variation; dashed line, variation with iceberg calving; solid line, increase in area without important iceberg calving. The floating part if Ninnis Glacier (T) was divided into three parts due to its considerable size, complexity, and history: the western part (W),jrom Cape Webb to Cape Pollock; the central part (GT),Jrom Cape Pollock to Cape Spencer; and the eastern part,Jrom Cape Spencer to Organ Pipe Cliff ( E). Cook Ice Shelf (T) was divide in two parts (eastern, E; western, W) due to different icefront histories. Location if glaciers in Figures 1, 3 and 4.
Freaotti and others: Icefront change and iceberg behaviour, Gates and George V Coasts
and between 1980 and 1989 and for ice shelf No. 5 between 1973 and 1991 (Table 1 and Fig. 2).
George V Coast
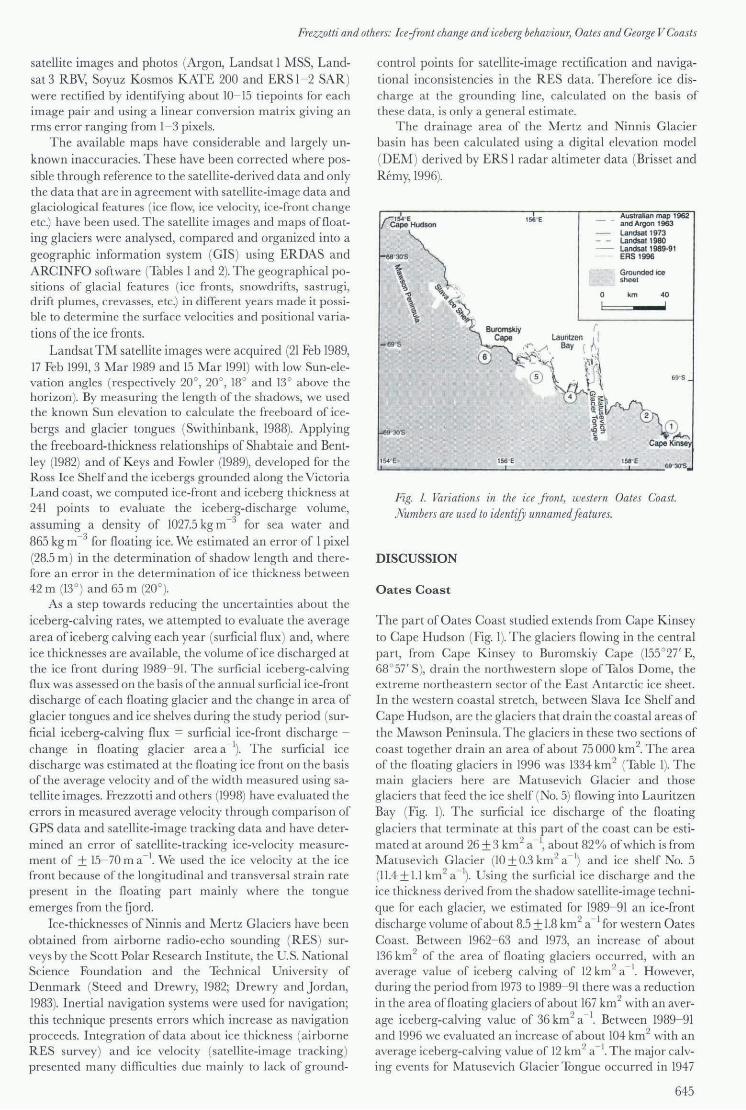
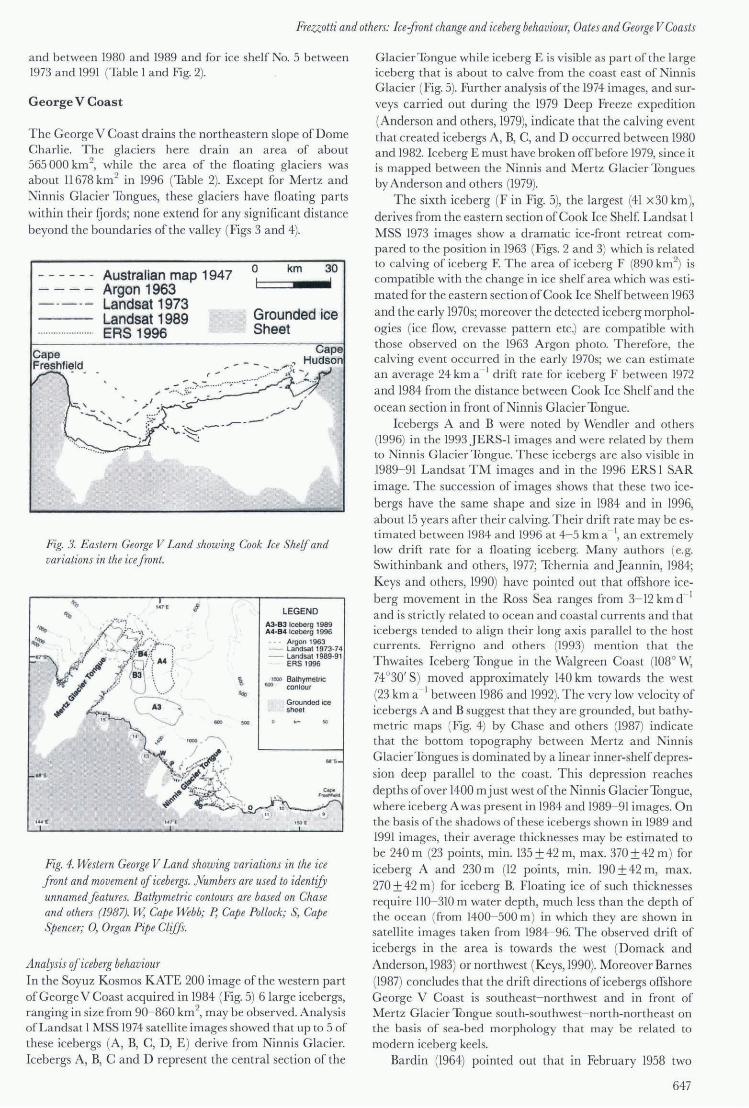
The George V Coast drains the northeastern slope of Dome Charlie. The glaciers here drain an area of about 565 000 km 2, while the area of the floating glaciers was about 11678 km2 in 1996 (Table 2). Except for Mertz and Ninnis Glacier Tongues, these glaciers have floating parts within their fjords; none extend for any significant distance beyond the boundaries of the valley (Figs 3 and 4).
Cape Freshfield
Australian map 1947 Argon 1963 Landsat1973 Landsat 1989 ERS 1996
o I
km 30
Grounded ice Sheet
Fig. 3. Eastern George V Land showing Cook Ice Shelf and variations in the ice front.
LEGEND
A3·B3 Iceberg 1989 A4·B4 Iceberg 1996 - - - Argon 1963 - Landsa11973·74 - Landsa11989·91
ERS 1996
''''' Balhymelric 000 contour
Grounded ice sheet
MS
..
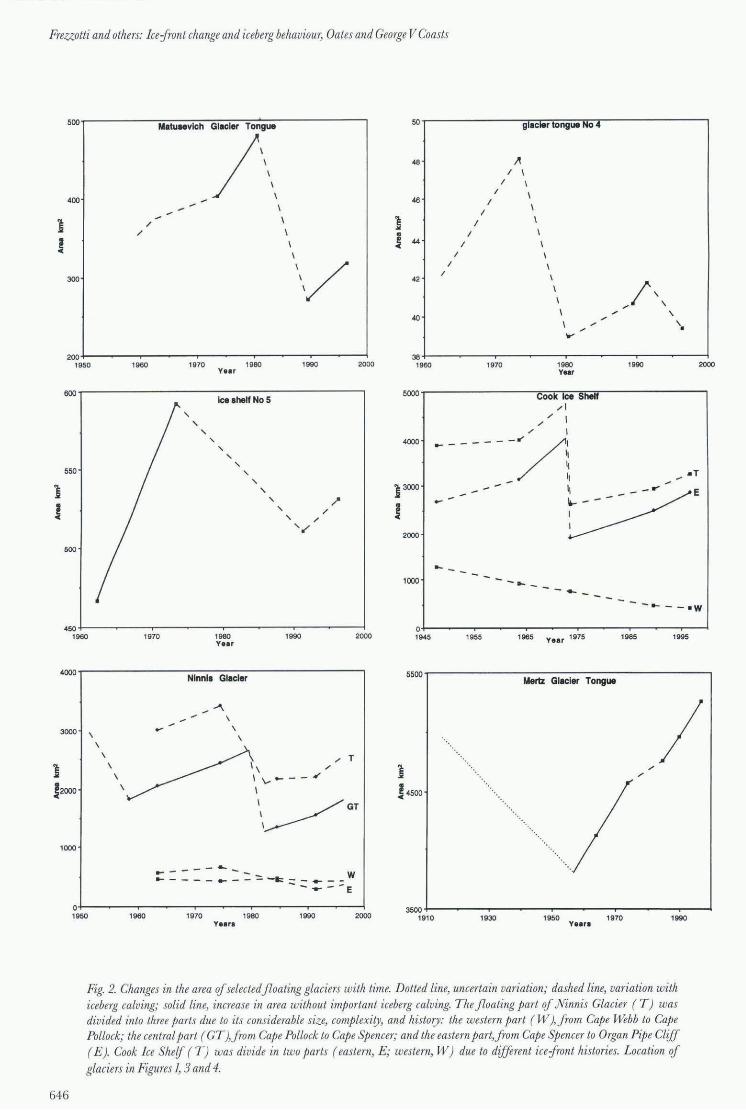
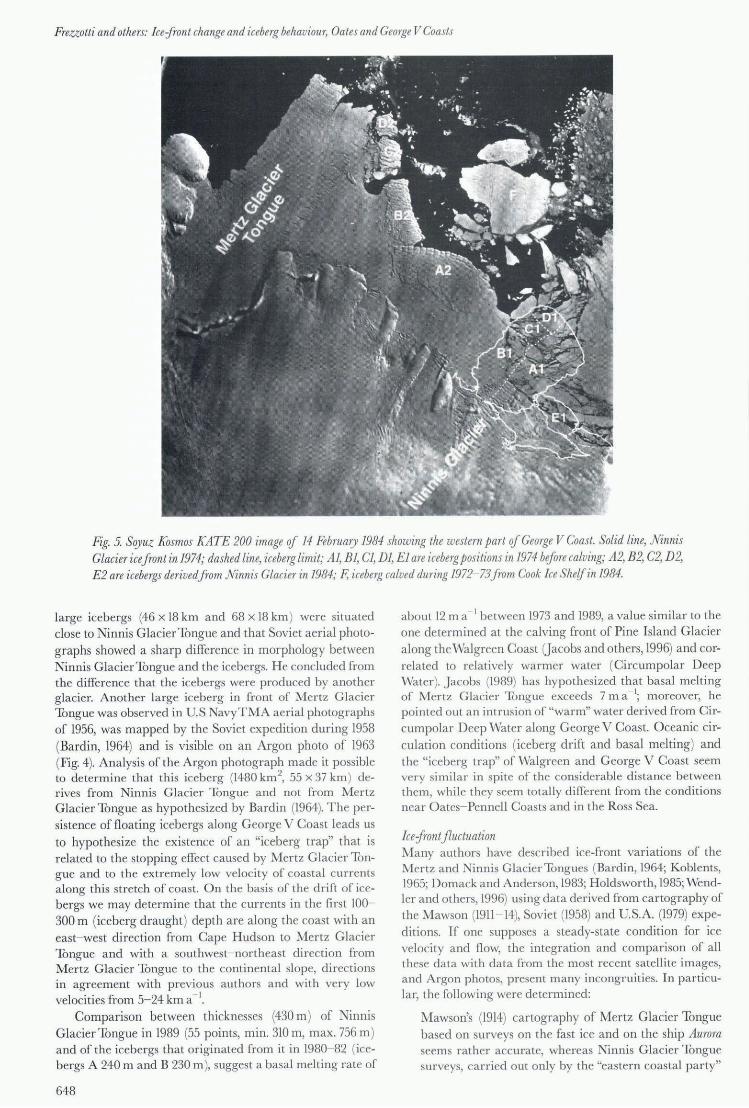
Fig. 4. Western George V Land showing variations in the ice front and movement of icebergs. Numbers are used to identify unnamedfeatures. Bathymetric contours are based on Chase and others (1987). W, Cape Webb; P, Cape Pollock; S, Cape Spencer; 0, Organ Pipe Clifft.
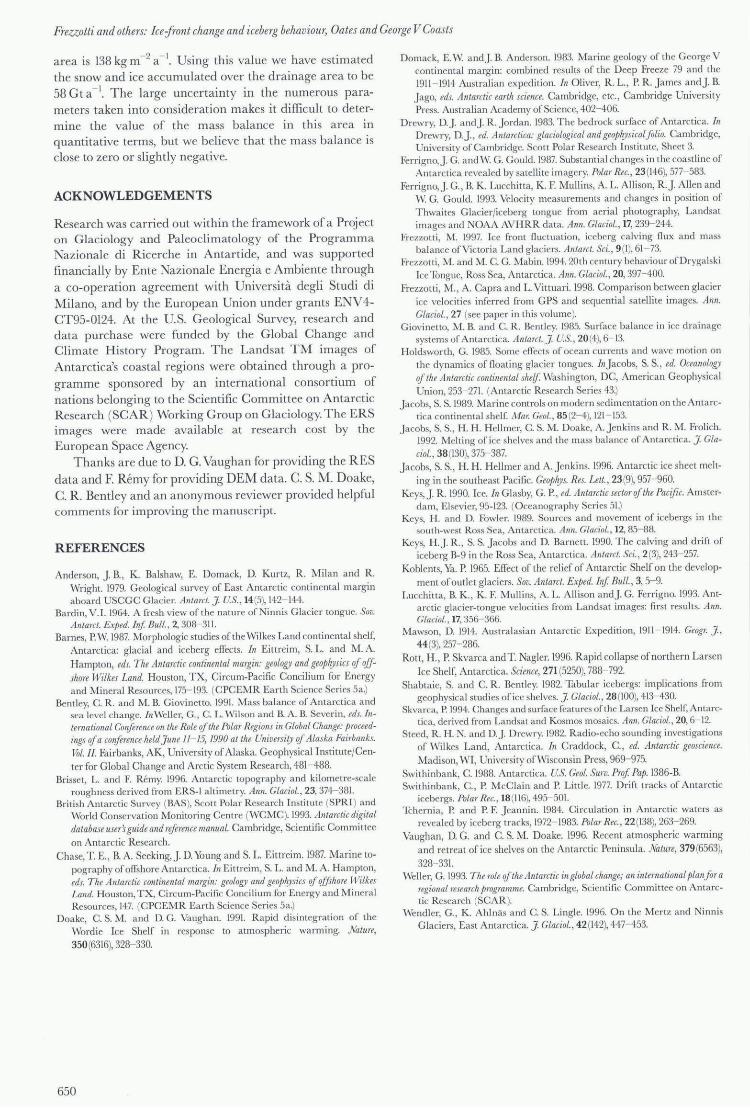
Anarysis of iceberg behaviour In the Soyuz Kosmos KATE 200 image of the western part of George V Coast acquired in 1984 (Fig. 5) 6 large icebergs, ranging in size from 90- 860 km 2
, may be observed. Analysis of Lands at 1 MSS 1974 satellite images showed that up to 5 of these icebergs (A, B, C, D, E ) derive from Ninnis Glacier. Icebergs A, B, C and D represent the central section of the
Glacier Tongue whi le iceberg E is visible as part of the large iceberg that is about to calve from the coast east of Ninnis Glacier (Fig. 5). :Further analysis of the 1974 images, and surveys carried out during the 1979 Deep Freeze expedition
(Anderson and others, 1979), indicate that the calving event that created icebergs A, B, C, and D occurred between 1980 and 1982. Iceberg E must have broken off before 1979, since it is mapped between the Ninnis and Mertz Glacier Tongues by Anderson and others (1979).
The sixth iceberg (F in Fig. 5), the largest (41 x30 km), derives from the eastern section of Cook Ice Shelf. Landsat I MSS 1973 images show a dramatic ice-front retreat compared to the position in 1963 (Figs. 2 and 3) which is related to calving of iceberg F. The area of iceberg F (890 km2
) is compatible with the change in ice shelf area which was estimated for the eastern section of Cook Ice Shelf between 1963 and the early 1970s; moreover the detected iceberg morphologies (ice flow, crevasse pattern etc.) are compatible with those observed on the 1963 Argon photo. Therefore, the calving event occurred in the early 1970s; we can estimate an average 24 km a- I drift rate for iceberg F between 1972 and 1984 from the distance between Cook Ice Shelf and the ocean section in front ofNinnis Glacier Tongue.
Icebergs A and B were noted by Wendler and others (1996) in the 1993 JERS-l images and were related by them to Ninnis Glacier Tongue. These icebergs are also visible in 1989- 91 Landsat TM images and in the 1996 ERS I SAR image. The succession of images shows that these two icebergs have the same shape and size in 1984 and in 1996, about 15 years after their calving. Their drift rate may be estimated between 1984 and 1996 at 4- 5 km a - " an extremely low drift rate for a floating iceberg. Many authors (e.g. Swithinbank and others, 1977; Tchernia andJeannin, 1984; Keys and others, 1990) have pointed out that offshore iceberg movement in the Ross Sea ranges from 3- 12 km d- I
and is strictly related to ocean and coastal currents and that icebergs tended to align their long axis parallel to the host currents. Ferrigno and others (1993) mention that the Thwaites Iceberg Tongue in the Walgreen Coast (108 0 W, 74 0 30' S) moved approximately 140 km towards the west (23 km a- I between 1986 and 1992). The very low velocity of icebergs A and B suggest that they are grounded, but bathymetric maps (Fig. 4) by Chase and others (1987) indicate that the bottom topography between Mertz and Ninnis GlacierTongues is dominated by a linear inner-shelf depression deep parallel to the coast. This depression reaches depths of over 1400 mjust west of the Ninnis Glacier Tongue, where iceberg A was present in 1984 and 1989- 91 images. On the basis of the shadows of these icebergs shown in 1989 and 1991 images, their average thicknesses may be estimated to be 240 m (23 points, min. 135 ± 42 m, max. 370 ± 42 m ) for iceberg A and 230 m (12 points, min. 190 ± 42 m, max. 270 ± 42 m ) for iceberg B. Floating ice of such thicknesses require 110- 310 m water depth, much less than the depth of the ocean (from 1400- 500 m ) in which they are shown in satellite images taken from 1984- 96. The observed drift of icebergs in the area is towards the west (Domack and Anderson, 1983) or northwest (Keys, 1990). Moreover Barnes (1987) concludes that the drift directions of icebergs offshore George V Coast is southeast-northwest and in front of Mertz Glacier Tongue south-southwest- north-northeast on the basis of sea-bed morphology that may be related to modern iceberg keels.
Bardin (1964) pointed out that in February 1958 two
647
Freaotti and others: Icefront change and iceberg behaviour, Gates and George V Coasts
Fig. 5. Sqyuz Kosmos KATE 200 image of 14 February 1984 showing the western part of Ge01ge V Coast. Solid line, Ninnis Glacier icefront in 1974; dashed line, iceberg limit; AI, B1, Cl, D1, El are iceberg positions in 1974 before calving; A2, B2, C2, D2, E2 are icebergs derivedfrom Ninnis Glacier in 1984; F, iceberg calved during 1972- 73 from Cook Ice Shelf in 1984.
la rge icebergs (46 x 18 km and 68 x 18 km ) were situated close to Ninnis GlacierTongue and that Soviet aerial photographs showed a sharp difference in morphology between Ninnis Glacier Tongue and the icebergs. He concluded from the difference that the icebergs were produced by another glacier. Another large iceberg in front of lVlertz Glacier Tongue was observed in U.S NavyTMA aerial photographs of 1956, was mapped by the Soviet expedition during 1958 (Bardin, 1964) and is visible on an Argon photo of 1963 (Fig. 4). Analysis of the Argon photograph made it possible to determine that this iceberg (1480 km 2
, 55 x 37 km ) derives from Ninnis Glacier Tongue and not from Mertz Glacier Tongue as hypothesized by Bardin (1964). The persistence of fl oating icebergs along George V Coast leads us to hypothesize the existence of an "iceberg trap" that is related to the stopping effect caused by Mertz Glacier Tongue and to the extremely low velocity of coastal currents along this stretch of coast. On the basis of the drift of icebergs we may determine that the currents in the first 100-300 m (iceberg d raught) depth are along the coast with an east-west direction from Cape Hudson to Mertz Glacier Tongue and with a southwest- northeast direction from Mertz Glacier Tongue to the continental slope, directions in agreement with previous authors and with very low velocities from 5- 24 km a - I.
Comparison between thicknesses (430 m) of Ninnis Glacier Tongue in 1989 (55 points, min. 310 m, max. 756 m) and of the icebergs that originated from it in 1980- 82 (icebergs A 240 m and B 230 m), suggest a basal melting rate of
648
about 12 m a 1 between 1973 and 1989, a value similar to the one determined at the calving front of Pine Island Glacier along the Walgreen Coast Uacobs and others, 1996) and correlated to relatively warmer water (Circumpolar Deep Water). Jacobs (1989) has hypothesized that basal melting of Mertz Glacier Tongue exceeds 7 m a I; moreover, he pointed out an intrusion of "warm" water derived from Circum polar Deep Water along George V Coast. Oceanic ci rculation conditions (iceberg drift and basal melting) and the "iceberg trap" of Walgreen and George V Coast seem very similar in spite of the considerable distance between them, while they seem totally different from the conditions near Oates- Pennell Coasts and in the Ross Sea.
Icejront fluctuation Many authors have described ice-front vanatlOns of the Mertz and Ninnis GlacierTongues (Bardin, 1964; Koblents, 1965; Domack and Anderson, 1983; Holdsworth, 1985; Wendler and others, 1996) using data derived from cartography of the Mawson (1911 - 14), Soviet (1958) and U.S.A. (1979) expeditions. If one supposes a steady-state condition for ice velocity and flow, the integration and comparison of al l these data with data from the most recent satellite images, and Argon photos, present many incongruities. In particular, the following were determined:
Mawson's (1914) cartography of Mertz Glacier Tongue based on surveys on the fast ice and on the ship Aurora seems rather accurate, whereas Ninnis Glacier Tongue surveys, carried out only by the "eastern coastal party"

Freaotti and others: Icefront change and iceberg behavioul; Gates and George V Coasts
present many uncertainties, as already pointed out by Holdsworth (1985) and Bardin (1964). The extremely irregular ice front of Ninnis Glacier Tongue in 1912, as mapped by Mawson, would seem to indicate the possibility that it represents the ice front of the Glacier Tongue plus one or more icebergs in contact with the main G lacier Tongue.
Koblents' (1965) report on the 1952 ice-front morphology of Mertz Glacier Tongue, determined by French survey. The ice-front shape is anomalous with respect to the
glacier-tongue history during this century determined from other sources and these data contradict those reported by the same authors for the year 1958.
Analysis of the Argon photo of 1963 showed that the 1962 ice-front position of Mertz GlacierTongue, as mapped in the Australian I: I 000 000 scale sketch maps, represents
the ice front of the glacier tongue plus the iceberg observed from U.S. NavyTMA air photo in contact with the main glacier tongue since 1956.
Wendler and others (1996) report an area of8100 km 2 for Mertz Glacier Tongue in 1993. Since the glacier-tongue
width is about 38- 40 km, a length of 200- 210 km would
be necessary to yield an area of8100 km 2; such a length is
not compatible (Table 2) with the length determined by 1989 Landsat TM (100 km) and 1996 ERS 1 satellite images (108 km) or with theJERS 1 image reported by the same authors. Wendler and others (1996) further hypothesize a grounding line at the coastline, while on
the basis of the satellite images it may be located about 50 km within the fjord-like valley. The same groundingline location, 50 km within the fjord-like valley, is hypothesized by BAS and others (1993).
Wendler and others (1996) have observed an extraordin
ary retreat of Ninnis Glacier Tongue since 1912; the authors pointed out that the reduction to about onethird of the 1913 size occurred during the earlier part of this century. Our studies suggest that the retreat has been more pronounced from the 1980s forward , since we believe that the Ninnis Glacier Tongue extension during 1913 was similar to the one in 1973 and that the remaining mapped area was icebergs.
Iceberg -calvingflux We estimate a surficial ice discharge of the floating glaciers that terminate at this part of coast of around 233 ± 16 km 2 a- I (Table 2), of which 88% comes from Mertz Glacier Tongue (45 ± 1.4 km 2 a- I), Ninnis Glacier Tongue (90 ± 7.5 km 2 a- I) and the Cook Ice Shelf (70 ± 4.2 km2 a - I). Using the surficial-ice discharge and the ice thickness derived from the shadow satellite-image technique (Table 2), we have estimated the ice-front discharge volume of George V Coast to be about 82 ±ll km 3 a- I in 1989- 91. During the period between 1963 and 1973- 74 a decrease of about 550 km 2 of the area of floating glaciers occurred with an average value of iceberg calving of about 292 km2 a- I. The area of floating glaciers
continued to decrease during the period from 1973- 74 to 1989- 91 with a reduction in area of about 587 km 2 and an annual value of iceberg calving of368km2 a I. In contrast, during the period from 1989- 91 to 1996, there was an increase in the area of floating glaciers of about 1011 km 2
with an average value of iceberg calving of70 km2 a I.
Calving events - past and future The major calving event for Cook Ice Shelf (about 1200 km 2
)
occurred before 1973 in the eastern part. Subsequently, the satellite images have shown constant growth of the eastern part of the ice shelf, with no substantial iceberg calving (Figs 2 and 3). On the other hand, in the western part we have observed a continuous and significant retreat since 1947, with a total ice-front retreat greater than 30 km (Fig. 2). The major calving events for Ninnis Glacier Tongue occurred during the early 1950s with iceberg calving> 1480 km 2
, and between 1980 and 1982 with the calving of icebergs A, B, C and D (about 1450 km2); subsequently the satellite images have revealed a general growth. A 1996 ERS satellite image shows that a calving event of about 700 km2 will occur in the near future from the glacier tongue. This calving event will cause the projecting glacier tongue to break off and the ice front to retreat within the fjord-like valley.
We have reconstructed the evolution of Mertz Glacier Tongue during most of the 20th century (Figs 2 and 4). The glacier tongue was about 150 km long (from the grounding line) in 1912. During 1958, the length of the glacier tongue was about 113 km. Subsequently, satellite images have evi
denced a constant growth of the glacier tongue, with no sub
stantial iceberg calving, reaching a length of 155 km in February 1996, an average advance of I km a 1. On the basis of this reconstruction we may hypothesize at least one or two important calving events between 1912 and 1956, with an estimated ice loss> 3000 km2
Significant retreat Most of the 110ating glaciers have shown cyclic behaviour without a strong trend. Exceptions to this general style are the western parts of Cook Ice Shelf and Ninnis Glacier Tongue, which have undergone a significant retreat at least
since 1947 and 1980, respectively. These floating glaciers are
characterized by numerous linear snow-filled depressions and rifts that extend across the 110ating glacier a few kilometres downstream of the grounding line. These are interpreted as the surface expression or bottom crevasses. The depressions become accentuated from the generation point to the ice front and are the preferential line of major rift formation and subsequently of calving. Increased melting along bottom crevasses might reduce the strength of the floating glacier and cause an increased calving flux. Comparison of ice thicknesses (min. 855 m, max. 1243 m ) collected using RES in 1974- 75 (Steed and Drewry, 1982) with
thicknesses (min. 310 m, max. 750 m) estimated from shadows on the 1989 satellite image seems to indicate a sharp thinning of the ice in the floating section of Ninnis Glacier. The constant reduction in the areas of these two floating glaciers in the last 20 years and possible thinning may be linked to an increase in the melting rate because of changes in ice- ocean interaction, as noted for the floating glaciers of the Cape Adare area (Frezzotti, 1997).
Nfass balance By combining RES ice-thickness and ice-velocity values close to the grounding line, it has been possible to estimate the ice-discharge values at about 62 Gt a 1 for Mertz and Ninnis Glaciers. Using a DEM constructed from radar altimeter data (Brisset and Remy, 1996), we have estimated the size of the drainage basin of these two glaciers to be 420000 km 2
. According to Giovinetto and Bentley (1985), the surface net accumulation value on grounded ice in this
649
Freaotti and others: Ice front change and iceberg behaviour, Gates and George V Coasts
area is 138 kg m 2 a- I. Using this value we have estimated the snow and ice accumulated over the drainage area to be 58 Gt a- I. The large uncertainty in the numerous parameters taken into consideration makes it difficult to determine the value of the mass balance in this a rea in quantitative terms, but we believe that the mass balance is close to zero or slightly negative.
ACKNOWLEDGEMENTS
Research was carried out within the framework of a Proj ect on Glaciology and Paleoclimatology of the Programma Nazionale di Ricerche in Antartide, and was supported fi nancially by Ente Nazionale Energia e Ambiente through a co-operation agreement with Universita degli Studi di Milano, and by the European Union under grants ENV 4-CT95-0l24. At the U.S. Geological Survey, research and data purchase were funded by the Global Change and Climate History Program. The Landsat TM images of Antarctica's coastal regions were obtained through a programme sponsored by an international consortium of nations belonging to the Scientific Committee on Anta rctic Research (SCAR) Working Group on Glaciology. The ERS images were made available at research cost by the European Space Agency.
Thanks are due to D. G. Vaughan for providing the RES data and F. Remy for providing DEM data. C. S. M . Doake, C. R. Bentley a nd an anonymous reviewer provided helpful comments [or improving the manuscript.
REFERENCES
Anderson, J. B., K. Balshaw, E. Domack, D. Kurtz, R. Milan a nd R. Wright. 1979. Geological survey o[ East Antarctic continental ma rgin aboard USCGC Glacier. Antarc/. ] Us. , 14(5), 142- 144.
Bardin, V.!. 1964. A fresh view of the nature ofNinnis Glacier tongue. Sov. Antarct. EX/Jed. " if. Bull. , 2, 308- 311.
Bam es, P. W. 1987. Morphologic studies of the Wilkes Land continental shel f, Antarctica: glacial and iceberg effects. [n Eiltreim, S. L. and M. A. Hampton, eds. The Antarctic continental margin: geology and geophysics if qffshore Wilkes Land. Houston, T X, Circum-Pacific Concilium [or Energy and Mineral Resources, 175- 193. (CPCEMR Ea rlh Science Seri es 5a.)
Bentley, C. R. and M. B. Giovinello. 1991. Mass bal ance of Anta rctica and sea level change. In Weller, G. , C. L. Wi1son and B. A. B. Severin, eds. International Co'!!eren.ce on the Role if the Polar Regions in Global Change: /}roceedings if a conference held J une 11- /5, 1990 at the Universi!J if Alaska Fairbanks. Vol. 11. Fairbanks, AK, University of Alaska. Geophysical Insti tute/Center for Global Change and Arctic System Research, 481- 488.
Brisse t, L. and F. Remy. 1996. An ta rctic topography and kilometre-scale roughness derived from ERS-I altimetry. Ann. Glacial. , 23, 374-381.
British Antarctic Survey (BAS), Scatt Polar Research Insti tute (SPR I) and World Conservation Moni toring Centre (WCMC). 1993. Antarctic digital database user'sguide and riference manual. Cambridge, Scientific Commi ttee on Antarctic Research.
Chase, T. E., B. A. Seeking, J. D. Young and S. L. Eitlreim. 1987. Marine topography of offshore Anta rcti ca. In Eittreim, S. L. and M. A. Hampton, eds. The Antarctic continental margin: geology and geophysics if qffthore Wilkes Land. Houston, TX, Circum-Pacific Concilium for Energy and Mineral Resources, 147. (CPCEMR Earth Science Series 5a.)
Doa ke, G S. M. and D G. Vaughan. 1991. Rapid disintegration of the Wordie Ice Shelf in response to atmospheric warming. Nature, 350(6316), 328- 330.
650
Domack, E. W. and]. B. Anderson. 1983. Marine geology of the George V continenta l margin: combined results o[ the Deep Freeze 79 and the 1911 - 1914 Austra lian expedition. In Oliver, R. L. , P. R. J ames a nd]. B.
J ago, eds. Antarctic earth science. Ca mbridge, etc., Cambridge University Press. Austra li an Academy of Scicnce, 402- 406.
Drewry, D]. and]. R. Jordan. 1983. T he bedrock surface of Antarctica. III Drewry, D.]. , ed. Antarctica: glaciological and geopl!Jsicalfolio. Cambridge, Unive rsity of Cambridge. Scat t Polar Research Institute, Sheet 3.
Ferrigno,]. G. and W. G. Gould. 1987. Substa nti al changes in the coastline of Anta rctica revealed by satellite imagery. Polar Rec. , 23(146),577- 583.
Ferrigno,J. G. , B. K. Lucchitta, K. F. Mullins, A. L. AlIison, R.J. Alien and W. G. Gould. 1993. Velocity measurements a nd changes in position of T hwaites Glacier/iceberg tongue fi'om aerial photography, Landsat images and NOAA AVHRR data. Ann. Glaciol. , 17, 239- 244.
Frezzotti, M. 1997. lee front fluctuation, iceberg ca lving nux and mass balance of Victoria La nd glaciers. Antarct. Sei. , 9(1), 61- 73.
Frezzotti, M. and M. G G. Mabin. 1994. 20 th century behaviour of Dry ga l ski lee Tongue, Ross Sea, Antarctica. Anll . Glacial., 20, 397- 400.
Frezzotti, M., A. Capra and L. Vi ttuari . 1998. Comparison between glac ier ice velocities inferred from GPS and sequential satellite images. Ann. Glaciol. , 27 (see paper in this volume).
Giovinetto, M. B. and C. R. Bent ley. 1985. Surface balance in ice drainage systems of Anta rctica. Antarct. ] Us. , 20 (4), 6- 13.
Holdsworth, G. 1985. Some effects of ocean currents and wave motion on the dynamics of noating glacier to ngues. InJacobs, S. S. , ed. Oceanology if the An/arctic continental shelj. Washington, DC, American Geophysical Union, 253- 271. (Anta rctic Research Series 43.)
J acobs, S. S. 1989. Marine cont ro ls on modern sedimentation on the Antarctica cont inental shelf. Mar. Geol., 85(2- 4), 121- 153.
j acobs, S. S. , H. H. Hellmer, G S. M. Doake, A.jenk ins and R. :vi. Frolich. 1992. Melting of ice shelves and the mass balance of Anta rctica. ] Glacial., 38(130), 375- 387.
J acobs, S. S. , H. H. Hell mer and A. J enkins. 1996. Antarctic ice sheet melting in the southeast Pacific. Geophys. Res. Lelt., 23 (9), 957- 960.
Keys, ]. R. 1990. lee. In Glasby, G. P., ed. Antarctic sector if the Pacific. Amsterdam, Elsevier, 95-1 23. (Oceanography Series 51.)
Keys, H . and D Fowler. 1989. Sources a nd movement of icebergs in the south-west Ross Sea, An ta rctica. Ann. Glaciol., 12, 85- 88.
Keys, H.]. R., S. S. j acobs and D Bam ett. 1990. T he ca lving and drift of iceberg B-9 in the Rass Sea, Antarctica. Antarc/. Sci., 2(3), 243- 257.
Koblents, Ya. P. 1965. Effect of the rel ief of Antarctic Shelf on the development o[ outlet glaciers. Sou. Antarct. Exped. In! Bull. , 3, 5-9.
Lucchitta, B. K. , K. F. Mu ll ins, A. L. AlIison and]. G. Ferrigno. 1993. Antarctic glacier-tongue velocities from Landsat images: first results. Ann. GlacioL., 17, 356- 366.
Mawson, D 1914. Australasian Antarctic Expedi tion, 1911 - 1914. Geogr. J , 44(3),257- 286.
Rott, H ., P. Skvarca and T. Nagler. 1996. Rapid collapse of northern Larsen Ice Shelf, Antarctica. Science, 271 (5250), 788- 792.
Shabta ie, S. a nd G R. Bentley. 1982. Tabular icebergs: implications [rom geophysica l studies of ice shelves. ] Glaciol., 28 (100), 413- 430.
Skva rca, P 1994. Changes and surface features of the Larsen Ice Shelf, Antarctica, derived from Landsat and Kosmos mosaics. Ann. Glaciol., 20, 6- 12.
Steed, R. H. N. and D]. Drewry. 1982. Radio-echo sounding investigations of Wilkes Land, Antarctica. In Craddock, G, ed. Antarctic geoscience. Madison, WI, University of Wisconsin Press, 969- 975.
Swithinbank, C. 1988. Antarctica. u.s. Geol. Sum Prrif. Pap. 1386-B. Swithinbank, G , P M cClain and P Littl e. 1977. Drift tracks of An ta rctic
icebergs. PoLar Rec., 18 (116), 495-501. Tchemia, P and P. F. J eann in. 1984. Circulation in Anta rctic waters as
revea led by iceberg tracks, 1972- 1983. Polar Rec., 22 (138), 263- 269. Vaughan, D. G. and C. S. M. Doake. 1996. Recent atmospheric warming
a nd retreat of ice shelves on the An ta rctic Peninsula. Nature, 379 (6563), 328- 331.
Well er, G. 1993. The role if the Antarctic in global change; an international plan for a regional research programme. Cambridge, Scientific Committee on Antarctic Research (SCAR).
Wend ler, G., K. Ahlnas and G S. Lingle. 1996. On the Mertz and Ninnis Glaciers, East Antarctica.] Glacial., 42 (142), 447- 453.