ice salary survey 2013 uk report
TRANSCRIPT

8/10/2019 ICE Salary Survey 2013 UK Report
http://slidepdf.com/reader/full/ice-salary-survey-2013-uk-report 1/59
S a l a r y S u r v e y 2 0 1 3
r e p o r t
I n s t i t u t i o n o f C i v i l E
n g i n e e r s
Salary Survey 2013UK Report

8/10/2019 ICE Salary Survey 2013 UK Report
http://slidepdf.com/reader/full/ice-salary-survey-2013-uk-report 2/59
2 Salary Survey 2013 UK report Institution of Civil Engineers
ContentsGlossary of terms .................................................................................................................. 3
Introduction ........................................................................................................................... 4
Methodology ......................................................................................................................... 6
UK findings: highlights ........................................................................................................... 8
UK respondents: sample characteristics ............................................................................. 10
Section 1 UK income........................................................................................................... 11
Section 2 UK careers .......................................................................................................... 30
Section 3 Recent economic climate .................................................................................... 41
Section 4 UK recent graduates ........................................................................................... 45
Appendices ......... ......... ......... ......... .......... ......... .......... ......... .......... ......... ......... .......... ......... 51

8/10/2019 ICE Salary Survey 2013 UK Report
http://slidepdf.com/reader/full/ice-salary-survey-2013-uk-report 3/59
Institution of Civil Engineers3 Salary Survey 2013 UK report Institution of Civil Engineers
Glossary of terms
Basic income
Permanent salaried employment Gross basic rate salary before deducting tax and National Insurance (NI) in the UK or anequivalent state medical care contribution in other countries. Excludes bonuses and overtime.
Self-employed Income from all sources less direct expenses but before deducting tax, personal expensesand NI in the UK or an equivalent state medical care contribution in other countries.
Contractors or part-time salaried employment Total earnings before deducting tax and NI in the UK or equivalent state medical carecontribution in other countries. Excludes additions from benefits contributions paid to the
individual.
Secondary income Income from other civil engineering related occupations if these were part of the mainoccupation in the year. The gross figure is given before deducting tax, examin er’s fees and NI in the UK or an equivalent state medical care contribution in other countries. Includesroyalties and part-time consultancy fees.
Overtime All earnings for working extra hours. Excludes bonuses.
Bonuses Any share of profits, commission, fees, honoraria or other payments received from the sole orprincipal employer. Excludes overtime payments.
Additional income The sum of secondary income , overtime and bonuses .
Mean and median income Mean salary The sum of all salaries divided by their
number.
Example {1,2,3,4,5}
Mean value: (1+2+3+4+5)/5=3Median salary The central value of a range of salaries,
or the mean of two central values iftheir number is even.
Example {1,2, 3,4 ,5,6}Median value: (3+4)/2=3.5
Abbreviations used in the report UK United Kingdom
CPI Consumer Price Index (official measure of inflation for UK)
RPI Retail Price Index (measure of inflation)
8/10/2019 ICE Salary Survey 2013 UK Report
http://slidepdf.com/reader/full/ice-salary-survey-2013-uk-report 4/59
Institution of Civil Engineers4 Salary Survey 2013 UK report Institution of Civil Engineers
Introduction
I would like to thank all the ICE members who took part in ICE’s SalarySurvey 2013, our first in three years. The information provided hasbeen invaluable in bringing us up-to-date on salaries within civil
engineering.
The findings have been split into two reports – this version for the UK,and a separate report with results for Australia, Hong Kong, NewZealand and the United Arab Emirates.
Some signs of recovery
The civil engineering community was badly affected by the economic downturn, but there aresome signs of recovery emerging from this year’s results.
Members feel more positive about the future. Views on job security have improved and therehas been a significant jump in the proportion of respondents seeing signs of economicimprovement in their organisations.
Salary reviews are more common: 68% of respondents have had (or will have) a salaryreview in 2013, compared to only 35% in 2010.
At the top of the profession, total income for Managing Directors, Chief Executive Officersand partners increased again this year after falling in 2010, and has now returned to 2008levels. The number of civil engineers earning £100k or more increased from 2.8% in 2010 to4.2% in 2013.
Salaries for recent graduates are also recovering, following consecutive falls between 2008and 2010. Many recent graduates were employed before or immediately after theygraduated, and this group of members is also now more satisfied.
Civil engineers now earn on average just under £50,000 a year.
Still a challenging time for UK members
While overall salaries have increased slightly since 2010, they are still down in real terms.Mean basic income for the total sample has increased 2.5% since 2010, while the Consumer
Price Index (CPI) increased by 9.8% over the same period.Members are also less satisfied with their professional lives. Satisfaction with jobs,employers and salary packages is down this year.
Compared to other membership grades, Technician Members are least satisfied with theirsalary package, which is unsurprising given that their mean basic income has nominallydropped 7% since 2007.
Unfortunately, the gap between earnings of men and women continues. While there isalmost no difference in salaries for younger members (aged up to 29), overall femalerespondents earn significantly less than their male colleagues.

8/10/2019 ICE Salary Survey 2013 UK Report
http://slidepdf.com/reader/full/ice-salary-survey-2013-uk-report 5/59
Institution of Civil Engineers5 Salary Survey 2013 UK report Institution of Civil Engineers
Benchmark your salary
ICE members can see how their salary compares with other civil engineers by using ouronline salary calculator, available in the MyICE section of ICE’s website.
If you have any questions about the report, please email [email protected] . I hope you will
find our latest salary survey useful and informative.
NG Baveystock
Director General
8/10/2019 ICE Salary Survey 2013 UK Report
http://slidepdf.com/reader/full/ice-salary-survey-2013-uk-report 6/59
Institution of Civil Engineers6 Salary Survey 2013 UK report Institution of Civil Engineers
Methodology
Why a web survey?
Since over 90% of ICE members have registered their email address with ICE, an onlinesurvey was the most accurate and cost-effective approach to use.
To correct any imbalance in the sample profile, results were weighted by member age andgrade for the UK findings. These variables were chosen as weighting factors since they aremost likely to predict earnings.
Data confidentiality
The survey was conducted by an independent market research agency, which hosted theweb questionnaire and kept all replies strictly confidential following the Market ResearchSociety guidelines.
ICE only has access to this report and the aggregated results in the form of charts andtables, rather than any individual responses.
Response rate
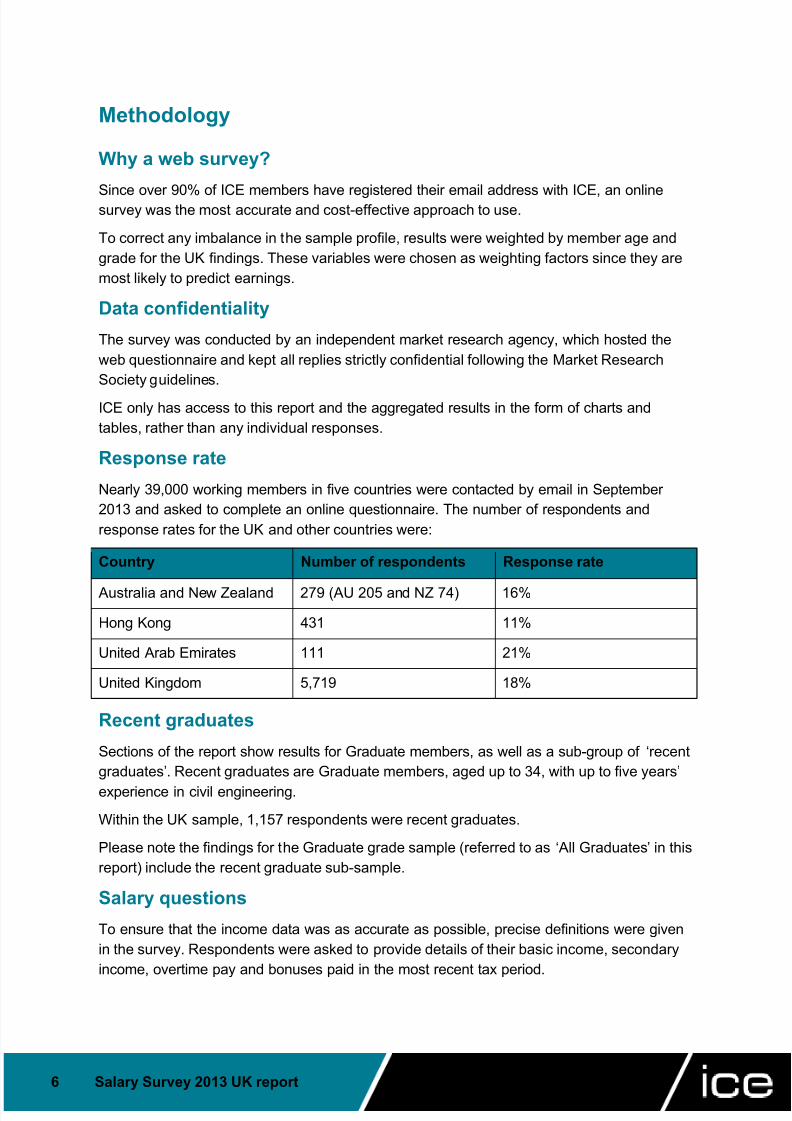
Nearly 39,000 working members in five countries were contacted by email in September2013 and asked to complete an online questionnaire. The number of respondents andresponse rates for the UK and other countries were:
Country Number of respondents Response rate
Australia and New Zealand 279 (AU 205 and NZ 74) 16%
Hong Kong 431 11%
United Arab Emirates 111 21%
United Kingdom 5,719 18%
Recent graduates
Sections of the report show results for Graduate members, as well as a sub-group of ‘recentgraduates’ . Recent graduates are Graduate members, aged up to 34, with up to five years’experience in civil engineering.
Within the UK sample, 1,157 respondents were recent graduates.
Please note the findings for the Graduate grade sample (referred to as ‘ All Graduates ’ in thisreport) include the recent graduate sub-sample.
Salary questions
To ensure that the income data was as accurate as possible, precise definitions were givenin the survey. Respondents were asked to provide details of their basic income, secondaryincome, overtime pay and bonuses paid in the most recent tax period.

8/10/2019 ICE Salary Survey 2013 UK Report
http://slidepdf.com/reader/full/ice-salary-survey-2013-uk-report 7/59
Institution of Civil Engineers7 Salary Survey 2013 UK report Institution of Civil Engineers
Main statistics used in the report
Charts in the report show the mean (commonly known as average) and median income.Mean is a more familiar term to most people; however, median is a better indicator of thetypical salary for a given respondent group as it is less affected by outliers (very low or high
values).
Period of research
The same core questionnaire and online methodology have been used for the ICE SalarySurvey since 2004, so meaningful comparisons can be made with previous salary findings.The table below shows the report titles and corresponding tax years.
Tax year Survey name
2012/2013 Salary Survey 20132009/2010 Salary Survey 2010
2008/2009 Salary Survey 2009
2007/2008 Salary Survey 2008
2006/2007 Salary Survey 2007
2005/2006 Salary Survey 2006
2003/2004 Salary Survey 2004

8/10/2019 ICE Salary Survey 2013 UK Report
http://slidepdf.com/reader/full/ice-salary-survey-2013-uk-report 8/59
Institution of Civil Engineers8 Salary Survey 2013 UK report Institution of Civil Engineers
UK findings: highlights
Income of UK members (section 1) Average salary for civil engineers nearly £50k – mean basic income for the total
sample in 2013 is £49,793 Basic income rises, slowly – mean basic income increased by 2.5% between 2010
and 2013, while median basic income improved by 5.4%; slow increases consideringthe three-year gap between surveys
Basic income decrease in real terms – taking inflation into account, mean basicincome is down since 2010 by 6.7% accounting for the Retail Price Index (RPI) or5.1% using the Consumer Price Index (CPI)
Value of being Chartered – Chartered Engineers (CEng MICE) earn 30% more(mean basic income) than Incorporated Engineers (IEng MICE) and the difference inmedian basic income is 25%
Women continue to earn less – the difference in salaries between male and femalemembers is nearly non-existent for younger members (aged up to 29), but for thoseaged 45-49, men earn 38% more than women. Overall, women earn 40% less thanmen, in line with the 42% difference registered in 2010
TMICE, the only grade recording negative change – since 2007 mean basicincome for TMICE decreased by 7%
Total income for MDs/CEOs/Partners is back up – mean income for this group
has increased by 8.3% since 2010, returning to the 2008 level Increase in proportion that earn £100k+ – those with basic income of £100k or
more increased from 2.8% of respondents in 2010 to 4.2% in 2013
See section 1 (pages 11 – 29) for more detailed results on the income of UK members.
Job satisfaction and professional development (section 2) Satisfaction down overall – across the whole sample, satisfaction with their current
role, employer and compensation package is down. Satisfaction with thecompensation package registered the biggest drop
Professional qualification a priority – in 2013, professional qualification was addedto the questionnaire and immediately topped the list as a priority for future careerdevelopment. Nearly one in four respondents said they want to obtain a professionalqualification (95% of this group do not have one yet)
Membership fees – the proportion of those whose professional fees are paid byemployers increased from 59% in 2010 to 69% in 2013
Skills development – the need to have greater technical depth has been indicatedby 43% of respondents, up from 39% in 2010, but the key area is still soft skills
What do members want? – in a strong message to employers, members say aclear career path is the factor that would most improve their working lives
See section 2 (pages 30 – 40) for more detailed results on non-salary related aspects of UKmembers’ professional lives.

8/10/2019 ICE Salary Survey 2013 UK Report
http://slidepdf.com/reader/full/ice-salary-survey-2013-uk-report 9/59
Institution of Civil Engineers9 Salary Survey 2013 UK report Institution of Civil Engineers
UK findings: highlights continued
Members and the economic climate (section 3) Salary reviews more common – 68% of respondents said they have had or will have a
salary review this year, a significant increase on the 2010 result (35%); male and femalemembers are equally likely to have their salary reviewed in 2013
Job security increases significantly – 65% of respondents feel secure or very secureabout their jobs, up from 40% in 2010. Young members are most secure in their jobs,public sector employees are least secure
More signs of improvement – the proportion of members seeing signs of economicimprovement increased significantly from 20% in 2010 to 72% in 2013
See section 3 (pages 41 – 44) for more detail on how members feel the current economicclimate affects their professional lives.
Recent graduates (section 4) Recent graduate salaries recovering – recent graduates experienced an increase of
2.3% in mean basic income, close to the average increase for all UK members and apositive change after falling in consecutive years between 2008 and 2010
Salaries increase at a quicker pace after graduation – the trend is becoming morepositive for graduates in recent years, with salaries going up more quickly in the firstcouple of years of work. Salaries for those graduating in 2009 were 7.7% higher after two
years, while salaries for 2011 graduates were 17.5% higher after two years
Recent graduates more satisfied – in 2010, only 37% of recent graduates were fairly orvery satisfied with their salary package, compared with 43% in 2009 and 49% in 2008. In2013 this proportion is again near the 2008 level, at 48%
No gender gap in basic income for recent graduates – recent female graduatescommand the same basic income as their male colleagues (close to £27k). However, thetotal salary received by male recent graduates is 2.5% higher, indicating men receive ahigher share of additional income (bonuses, overtime pay and secondary income)
Most find employment – 62% of recent graduates were employed before, orimmediately after they graduated; only 6% were looking for a job longer than a year
See section 4 (pages 45 – 50) for more detailed responses from recent graduates (ICEGraduate members aged up to 34 with no more than five years of professional experience).

8/10/2019 ICE Salary Survey 2013 UK Report
http://slidepdf.com/reader/full/ice-salary-survey-2013-uk-report 10/59
Institution of Civil Engineers10 Salary Survey 2013 UK report Institution of Civil Engineers
UK respondents: sample characteristics
Age bands Count of respondents Percentage Response rate25 or under 185 3% 16%
25-29 683 12% 16%30-34 653 11% 17%35-39 617 11% 17%40-44 621 11% 18%45-49 633 11% 18%50-54 651 11% 18%55-59 800 14% 18%60-65 652 11% 20%66 or over 224 4% 15%Total 5,719 100% 18%
Membership grade Count of respondents Percentage Response rateFICE 282 5% 17%MICE 3,133 55% 18%
AMICE 205 4% 19%TMICE 98 2% 17%
All Graduate members 2,002 35% 17%Total 5,719 100% 18%
UK region Count of respondents Percentage Response rateEast Midlands 327 6% 19%East of England 263 5% 10%London 1,019 18% 23%North East 182 3% 18%North West 577 10% 18%Northern Ireland 154 3% 17%Scotland 677 12% 17%South East England 960 17% 17%South West 542 9% 18%Wales 240 4% 15%West Midlands 432 8% 19%Yorkshire and Humber 347 6% 17%Total 5,719 100% 18%
Gender Count of respondents Percentage Response rateFemale 647 11% 20%Male 5,071 89% 17%Total 5,719 100% 18%

8/10/2019 ICE Salary Survey 2013 UK Report
http://slidepdf.com/reader/full/ice-salary-survey-2013-uk-report 11/59
S a l a r y S u r v e y 2 0 1 3
R e p o r t
S e c t i o n 1 : U K i n c o m e f i n d i n g s
Section 1
UK incomeThis section presents findings on UK members‘ earnings basedon:
Age Membership grade Level of responsibility Region Gender
It is followed by other job related information such as annualleave entitlement and employment benefits.

8/10/2019 ICE Salary Survey 2013 UK Report
http://slidepdf.com/reader/full/ice-salary-survey-2013-uk-report 12/59
12 Salary Survey 2013 UK report Institution of Civil Engineers
Section 1: UK income findings
1.1. Basic income change 2004-2013
Salaries rise again, slowly – ICE member salaries grew again after a small fall of 0.3% in 2009.But growth is slow considering the three-year gap between this and the previous survey
Most earn mid- or lower-level income – the mean salary is higher than the median. Althoughthe difference isn’t big, it indicates a large number of members with mid- or lower-level salaries
Increase in proportion that earn £100k+ – those with basic income of £100k or more increasedfrom 2.8% of respondents in 2010 to 4.2% in 2013. This high-earning group now commands12.5% of the earnings of the whole sample, up from 9.2% in 2010
3 9
, 1 9 1
4 4
, 2 5 1
4 5
, 1 6 6
4 7
, 4 1 4
4 7
, 2 8 2
4 8
, 5 8 8
4 9
, 7 9 3
3 5
, 6 4 7
3 9
, 8 8 0
4 0
, 0 0 0
4 1
, 7 5 0
4 1
, 4 2 1
4 2
, 5 9 8
4 3
, 6 4 0
0
10,000
20,000
30,000
40,000
50,000
60,000
2004 2006 2007 2008 2009 2010 2013
B a i s c
i n c o m e
i n £
Survey year
Basic income change 2004-2013
Mean Median
Keyfinding
The mean basic income increased by 2.5% between 2010 and 2013, whilemedian basic income improved by 5.4% in the same period. The averagemean basic income for civil en ineers in 2013 is £49 793.

8/10/2019 ICE Salary Survey 2013 UK Report
http://slidepdf.com/reader/full/ice-salary-survey-2013-uk-report 13/59
13 Salary Survey 2013 UK report Institution of Civil Engineers
1.2. Basic income change, RPI* and CPI*
Salaries grow slowly while inflation quite high – the economic crisis between 2007 and 2010and the resulting recession had a negative impact on salaries. At the same time, inflationremained relatively high and eroded salaries further in real terms
Mean basic income decrease in real terms – while salaries increased 2.5% between 2010 and2013, in real terms the mean basic income has gone down by 6.7% (if we account for RPI) or5.1% (if we account for CPI). This translates into a loss of between £4,450 and £3,668 in
purchasing power between 2010 and 2013
Year 2004 2006 2007 2008 2009 2010 2013
Mean 100.0 112.9 115.2 121.0 120.6 124.0 127.1
Median 100.0 111.9 112.2 117.1 116.2 119.5 122.4
RPI 100.0 106.3 111.0 116.1 114.2 120.0 133.7
CPI 100.0 104.5 107.0 111.1 113.1 116.8 128.3
RPI (Retail Price Index) and CPI (Consumer Price Index) are measures of inflation. More details areavailable on the Office for National Statistics website (www.ons.gov.uk )
90
95
100105
110
115
120
125
130
135
140
2004 2006 2007 2008 2009 2010 2013
Basic income and RPI and CPI change 2004-2013
Mean Median RPI CPI
Keyfinding
RPI and CPI increased more than mean and median basic salaries since2010, meaning civil engineers have less purchasing power now.

8/10/2019 ICE Salary Survey 2013 UK Report
http://slidepdf.com/reader/full/ice-salary-survey-2013-uk-report 14/59
14 Salary Survey 2013 UK report Institution of Civil Engineers
1.3. Basic and total income by age
Biggest rise for members aged 55-59 – salaries increased 9.6% for this group, closely followedby a 9.2% increase for the 45-49 age bracket (however salaries for these two groups fell in 2010)
Income falls for members aged 50-54 – the only age band to register a drop in mean basicincome, down 2% from 2010. However, this could be a small adjustment following the 2010results, when salaries increased at an above average rate for 50-54 year-olds, but dropped formembers aged 45-49 and 55-59
Above average increase for more age bands – only three age bands (35-39, 50-54 and over65) experienced an above average salary increase in 2010. In 2013 mean basic incomeincreased above the 2.5% average for seven age groups (under 25, 25-29, 30-34, 40-44, 45-49,55-59 and over 65)
Small salary differences for members aged up to 44 – indicated by the similar figures formean and median basic income within each age group up to this point. For members over 45,differences increase as some members accelerate their earning capabilities compared to theirpeers
2 4
, 8 0 8
2 8
, 6 8 6 3
6 , 7
6 6 4
4 , 5
2 6
5 0
, 4 7 6 5
8 , 3
6 1
5
9 , 8
6 5
6 3
, 5 9 9
5 8
, 1 6 6
5 8
, 2 3 1
4 9
, 7 9 3
2 4
, 4 9 8
2 8
, 0 0 0 3
4 , 7
3 7 4
1 , 9
6 8 4
8 , 0
0 0
5 1
, 5 0 0
5 2
, 5 0 0
5 7 , 0
0 0
5 2
, 0 0 0
4 5
, 0 0 0
4 3
, 6 4 0
0
10,000
20,000
30,000
40,000
50,000
60,000
70,000
<25 25-29 30-34 35-39 40-44 45-49 50-54 55-59 60-65 >65 Total
B a s
i c i n c o m e
i n £
Age bands
Basic income by age
Mean Median
Keyfinding
It now takes longer for members to reach their full earning potential. In2010 those aged 50-54 earned the highest mean basic income. In 2013 the
eak is for members a ed 55-59.

8/10/2019 ICE Salary Survey 2013 UK Report
http://slidepdf.com/reader/full/ice-salary-survey-2013-uk-report 15/59
15 Salary Survey 2013 UK report Institution of Civil Engineers
Earning peak moves from 50-54 age band in 2010 to 55-59 in 2013 – following the sametrend as for basic income
Biggest increase for members aged 45-49 – mean total income has grown 9.4% since 2010for this group: those aged over 65 and 50-54 saw total salaries drop 1.8% and 0.7% respectively
Additional income* accounts for 11% of total income – it increases with age and peaks formembers aged 60-65 (chart below shows the share of additional income by age)
** Additional income is the sum of secondary income, overtime pay and bonuses paid
2 6
, 2 6 3
3 0
, 7 0 4 3
9 , 1
0 9 4
7 , 7
6 0 5 4 ,
9 2 7 6
4 , 4
7 7
6 7
, 4 8 6
7 1
, 3 1 8
6 7
, 2 8 9
6 3
, 5 9 3
5 5 , 0 5 5
2 5
, 0 0 0
2 9
, 0 0 0 3
6 , 0
0 0 4
3 , 3
0 0
5 0
, 0 0 0 5 4 , 1
2 4
5 7
, 0 0 0
5 9
, 5 1 2
5 6 , 5
0 0
5 0
, 0 0 0
4 6
, 0 0 0
0
10,000
20,000
30,000
40,000
50,000
60,000
70,000
80,000
<25 25-29 30-34 35-39 40-44 45-49 50-54 55-59 60-65 >65 Total
T o
t a l i n c o m e
i n £
Age bands
Total income by age
Mean Median
Keyfinding
0%
10%
20%
30%
<25 25-29 30-34 35-39 40-44 45-49 50-54 55-59 60-65 >65 Total Age band
Share of mean additional income*in total income
2013 2010
Both mean and median total income have increased by 2% since 2010, asmall rise compared to the 4% year-on-year rise recorded in 2010. Theincrease is also less than basic income growth, showing a slowdown in theincrease of additional income*.

8/10/2019 ICE Salary Survey 2013 UK Report
http://slidepdf.com/reader/full/ice-salary-survey-2013-uk-report 16/59
16 Salary Survey 2013 UK report Institution of Civil Engineers
1.4. Basic and total income by membership grade – UK
Above average increases for three grades – between 2010 and 2013 mean basic incomegrew for AMICE, All Graduates and MICE (8.3%, 6.8% and 4.3% respectively)
Double digit mean income growth between 2007-2013 for four grades – salaries for FICE,MICE, AMICE and All Graduates have grown between 10% to 14% in the last six years
Slower growth for recent graduates since 2007 – while salaries increased at a near-averagerate for recent graduates between 2010 and 2013, since 2007 their mean basic income has
increased at a moderate rate of 5% TMICE, the only grade recording negative change in the long-term – the survey indicates
that TMICE salaries have dropped 17% since 2010. However, this figure should be treated withsome caution as the sample sizes for TMICE are smaller than other grades which means there isgreater volatility in year-on-year results. The overall trend since 2007 gives a more reliableindication, over which time TMICE mean basic income decreased by 7%
*See definition of recent graduates on page 6
8 1
, 4 4 7
5 5
, 8 8 0
4 6
, 5 8 8
3 2
, 1 7 7
3 7
, 0 0 2
2 6
, 6 6 8
4 9
, 7 9 3
7 4
, 2 0 0
5 0
, 0 0 0
4 2
, 0 0 0
3 1
, 0 0 0
3 1
, 5 6 7
2 6
, 0 0 0
4 3
, 6 4 0
0
10,000
20,000
30,000
40,000
50,000
60,000
70,00080,000
90,000
FICE MICE AMICE TMICE All Graduates RecentGraduates
Total
B a s
i c i n c o m e
i n £
Membership Grade
Basic income by membership grade
Mean Median
Keyfinding
Recent graduates* experienced a near-average increase of 2.3% in meanbasic income, a positive change after falling in consecutive years between
2008 and 2010.
8/10/2019 ICE Salary Survey 2013 UK Report
http://slidepdf.com/reader/full/ice-salary-survey-2013-uk-report 17/59
17 Salary Survey 2013 UK report Institution of Civil Engineers
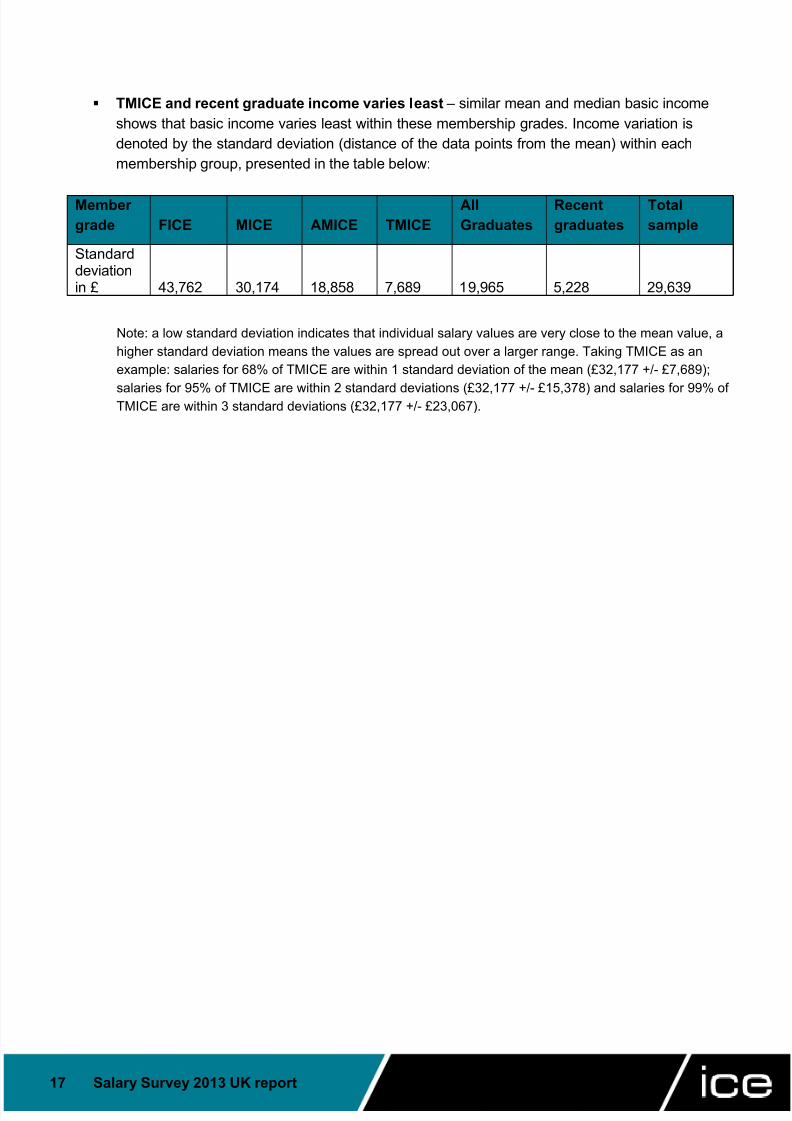
TMICE and recent graduate income varies least – similar mean and median basic incomeshows that basic income varies least within these membership grades. Income variation isdenoted by the standard deviation (distance of the data points from the mean) within eachmembership group, presented in the table below:
Membergrade FICE MICE AMICE TMICE
AllGraduates
Recentgraduates
Totalsample
Standarddeviationin £ 43,762 30,174 18,858 7,689 19,965 5,228 29,639
Note: a low standard deviation indicates that individual salary values are very close to the mean value, ahigher standard deviation means the values are spread out over a larger range. Taking TMICE as anexample: salaries for 68% of TMICE are within 1 standard deviation of the mean (£32,177 +/- £7,689);
salaries for 95% of TMICE are within 2 standard deviations (£32,177 +/- £15,378) and salaries for 99% ofTMICE are within 3 standard deviations (£32,177 +/- £23,067).
8/10/2019 ICE Salary Survey 2013 UK Report
http://slidepdf.com/reader/full/ice-salary-survey-2013-uk-report 18/59
18 Salary Survey 2013 UK report Institution of Civil Engineers
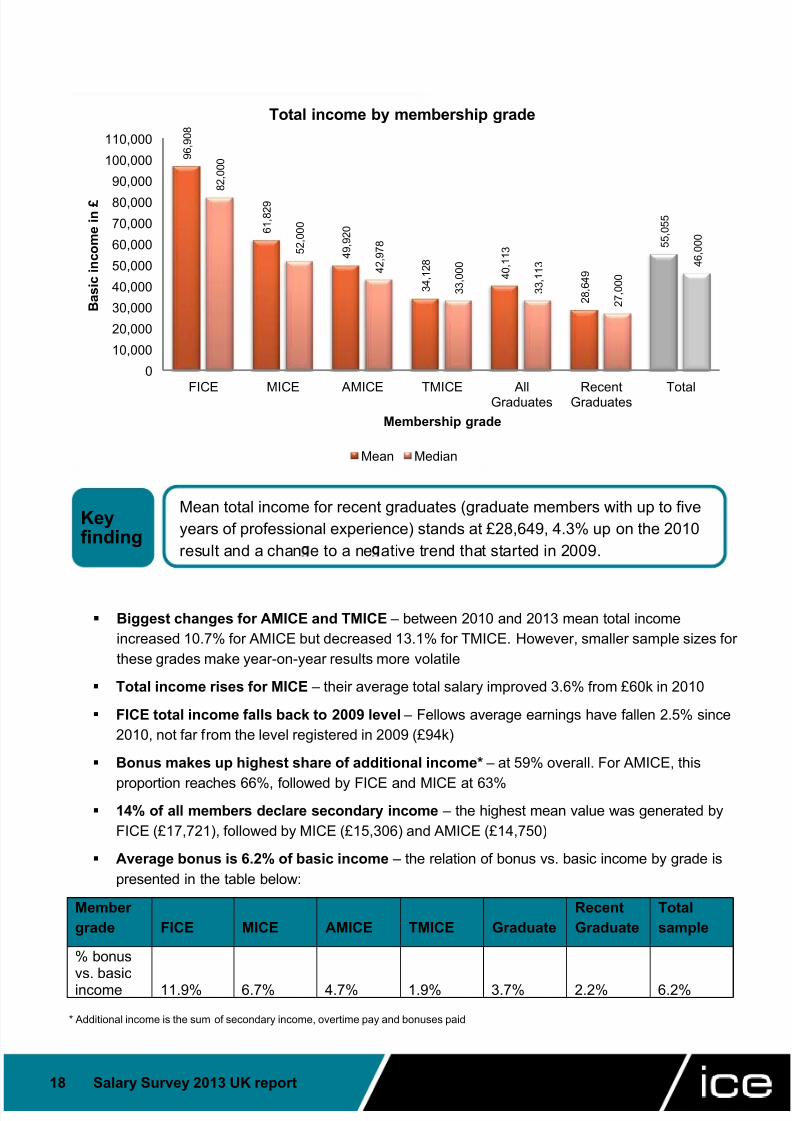
Biggest changes for AMICE and TMICE – between 2010 and 2013 mean total incomeincreased 10.7% for AMICE but decreased 13.1% for TMICE. However, smaller sample sizes forthese grades make year-on-year results more volatile
Total income rises for MICE – their average total salary improved 3.6% from £60k in 2010
FICE total income falls back to 2009 level – Fellows average earnings have fallen 2.5% since2010, not far from the level registered in 2009 (£94k)
Bonus makes up highest share of additional income* – at 59% overall. For AMICE, this
proportion reaches 66%, followed by FICE and MICE at 63% 14% of all members declare secondary income – the highest mean value was generated by
FICE (£17,721), followed by MICE (£15,306) and AMICE (£14,750)
Average bonus is 6.2% of basic income – the relation of bonus vs. basic income by grade ispresented in the table below:
Membergrade FICE MICE AMICE TMICE Graduate
RecentGraduate
Totalsample
% bonusvs. basicincome 11.9% 6.7% 4.7% 1.9% 3.7% 2.2% 6.2%
* Additional income is the sum of secondary income, overtime pay and bonuses paid
9 6
, 9 0 8
6 1
, 8 2 9
4 9
, 9 2 0
3 4
, 1 2 8
4 0
, 1 1 3
2 8
, 6 4 9
5 5
, 0 5 5
8 2
, 0 0 0
5 2
, 0 0 0
4 2
, 9 7 8
3 3
, 0 0 0
3 3
, 1 1 3
2 7
, 0 0 0
4 6
, 0 0 0
0
10,000
20,000
30,000
40,000
50,000
60,000
70,000
80,000
90,000
100,000
110,000
FICE MICE AMICE TMICE AllGraduates RecentGraduates Total
B a s
i c i n c o m e
i n £
Membership grade
Total income by membership grade
Mean Median
Keyfinding
Mean total income for recent graduates (graduate members with up to fiveyears of professional experience) stands at £28,649, 4.3% up on the 2010result and a chan e to a ne ative trend that started in 2009.

8/10/2019 ICE Salary Survey 2013 UK Report
http://slidepdf.com/reader/full/ice-salary-survey-2013-uk-report 19/59
19 Salary Survey 2013 UK report Institution of Civil Engineers
1.4.1 Basic salary by professional qualification
CEng MICE basic income higher than MICE overall – when comparing within the MICE grade,those with CEng qualification earned a mean basic income of £56,452 while MICE overallrecorded £55,880
EngTech TMICE mean basic income also higher – as observed for MICE, the same is true forTMICE. Those who are EngTech registered had a mean basic income of £32,398, while allTMICE earned £32,177 in the last fiscal year
5 6 , 4
8 4
4 4
, 4 3 7
3 2
, 3 9 8
5 6 , 4
5 2
4 3
, 5 3 8 5
0 , 0
0 0
4 0
, 0 0 0
3 1
, 0 0 0
5 0
, 0 0 0
4 0
, 0 0 0
0
10,000
20,000
30,000
40,000
50,000
60,000
70,000
CEng IEng EngTech MICE CEng MICE IEng
B a s
i c i n c o m e
i n £
Professional qualification
Basic income by professional qualification
Mean Median
Keyfinding
Chartered Engineers (CEng MICE) command higher salaries than holdersof other professional qualifications. Within MICE, CEng MICE earn 30%more (mean basic income) than Incorporated Engineers (IEng MICE). Thedifference in median basic income is 25%.

8/10/2019 ICE Salary Survey 2013 UK Report
http://slidepdf.com/reader/full/ice-salary-survey-2013-uk-report 20/59

8/10/2019 ICE Salary Survey 2013 UK Report
http://slidepdf.com/reader/full/ice-salary-survey-2013-uk-report 21/59
21 Salary Survey 2013 UK report Institution of Civil Engineers
Total income for MDs/CEOs/Partners back up – the mean compensation package for this
group has increased 8.3% since 2010, returning to the 2008 level before the economic downturntook hold
MDs/CEOs/Partners are best earners – they represent 3.5% of the total respondent sample,but account for 8.3% of the total income for all respondents
2.5% increase for managers/directors – accounting for 16.5% of the sample, this groupexperienced a 2.5% rise in mean total income, up from £72,806 in 2010
Overtime income most common early in career – those in on-the-job training received themost (paid) overtime, as a proportion of additional income
2 7
, 2 9 3 3
8 , 4
5 2 4
9 , 6
9 0
5 4
, 3 2 7
7 4
, 6 2 2
1 1 7
, 1 1 2
5 2
, 4 9 0
4 8
, 3 1 4 5
8 , 7
4 4
5 5
, 0 5 5
2 5
, 9 5 9
3 4
, 0 0 0
4 3
, 0 5 3
4 9
, 0 6 8
6 5
, 0 0 0
9 5 , 0 0 0
4 8
, 8 0 0
4 2
, 0 6 1
5 1
, 0 0 0
4 6
, 0 0 0
0
10,000
20,000
30,000
40,000
50,000
60,000
70,000
80,000
90,000
100,000
110,000
120,000
130,000
T o
t a l i n c o m e
i n £
Level of responsibility
Total income by main level of responsibility
Mean Median
Keyfinding
Mean total income of those just starting their civil engineering career (on-the-job training) has improved by 3.6% since 2010. However, mean basicincome for this group is just 0.5% higher than in 2006.

8/10/2019 ICE Salary Survey 2013 UK Report
http://slidepdf.com/reader/full/ice-salary-survey-2013-uk-report 22/59
22 Salary Survey 2013 UK report Institution of Civil Engineers
1.6 Basic and total income by region
London-based members still earn the most – although there was a small drop of 1% formembers in London, the mean basic income in this region continues to be highest, followed by
South East England (9.4% less than London) and the East Midlands (18.4% lower) South East England catching up with London – in 2010 London and South East England
experienced a below-average increase in mean basic salary on the 2009 survey. In 2013 SouthEast England income increased in line with the total sample, while London salaries dropped 1%
Salaries fall for two regions – mean basic salaries for the South West and the East of Englandincreased between 2007-2010, but since 2010 salaries have dropped 5.9% and 8.1%respectively
Slowest growth in Yorkshire and Humber – mean basic salary increased least between 2004and 2013 for Yorkshire and Humber (15.5%); while it increased most for the East Midlands(36.9%), North West (34.9%) and Wales (33.9%). The overall mean basic income increase inthat period was 27.1%
4 9
, 8 5 4
4 5
, 7 1 6
5 9
, 0 2 7
4 4
, 8 9 9
4 7
, 1 4 4
4 1
, 6 7 9
4 7
, 0 7 9 5
3 , 9 7
2
4 5
, 2 0 3
4 3
, 7 7 7
4 8
, 9 0 0
4 2
, 4 4 6 4
9 , 7
9 3
4 3
, 0 0 0
4 2
, 0 0 0 5
0 , 0
5 0
4 0
, 0 0 0
4 3
, 7 1 1
3 9
, 3 9 6
4 0
, 0 0 0 4
8 , 0
0 0
4 0
, 5 8 3
3 8
, 5 0 2
4 4
, 0 0 0
4 1
, 0 0 0
4 3
, 6 4 0
0
10,000
20,000
30,000
40,000
50,000
60,000
70,000
B a s
i c i n c o m e
i n £
Region
Basic income by region
Mean Median
Keyfinding
Mean basic income has increased the most (9.7%) since 2010 formembers in the North East, but salaries in the region are still 10% belowthe average for all regions.

8/10/2019 ICE Salary Survey 2013 UK Report
http://slidepdf.com/reader/full/ice-salary-survey-2013-uk-report 23/59
23 Salary Survey 2013 UK report Institution of Civil Engineers
Bonuses as a share of total salary – the share is highest in the East of England (8.2%) andsecond highest in the South East of England (6.5%). Members in the South West receive thelowest bonus as a share of mean total salary (4.0%)
Three regions register above average mean total salaries – London, South East England andEast Midlands, 21.0%, 8.8% and 0.5% respectively
Bonuses make up 71% of additional income for East of England – the highest proportionfrom all regions. At the other extreme are the North East and South West where this number is
just under 50%
Secondary income makes up 18% of additional income across sample – while in 2010secondary income formed the biggest part of the additional pay in Northern Ireland and theSouth West (over 50%), in 2013 has not exceeded 26%
Overtime pay has lowest share in additional income – the amount of mean overtime pay inthe additional income was highest for Scotland at 28% and lowest in Wales and Yorkshire &Humber at 15% for both regions
5 5 , 3 3 6
5 1
, 6 7 6
6 6
, 6 1 9
4 9
, 6 9 1
5 1
, 6 3 4
4 4
, 7 2 1
5 1
, 1 2 3 5
9 , 8
8 5
4 9
, 2 0 0
4 8
, 3 7 0
5 4
, 2 5 8
4 5
, 5 3 8 5
5 , 0 5 5
4 5
, 0 0 0
4 5
, 0 3 8 5
4 , 0 0
0
4 0
, 0 0 0
4 6
, 3 5 2
4 2
, 1 4 9
4 2
, 0 0 0 5
1 , 0
0 0
4 3
, 0 0 0
4 0
, 4 4 0
4 5
, 0 0 0
4 1
, 9 0 0
4 6
, 0 0 0
0
10,000
20,000
30,000
40,000
50,000
60,000
70,000
80,000
T o
t a l i n c o m e
i n £
Region
Total income by region
Mean Median
Keyfinding
Mean total income is lowest in Northern Ireland, 18.8% less than the totalsample average. This contrasts with London which commands a meantotal salary of 21% more than the total sample average, despite a 1% dropsince 2010.

8/10/2019 ICE Salary Survey 2013 UK Report
http://slidepdf.com/reader/full/ice-salary-survey-2013-uk-report 24/59
24 Salary Survey 2013 UK report Institution of Civil Engineers
1.7 Gender differences in payThe 2010 Salary Survey presented the salary differences by gender in full for the first time and we cannow observe trends over time. Since basic income makes up on average 90% of the total salary, theanalysis focuses on this component of income.
Note: results for groups with fewer than 20 respondents should be treated with caution due to the lowsample size (indicated with an asterisk throughout).
1.71 Basic income by age and gender
Further down the career path, earning gap narrows for women aged 55-59 – the table belowdemonstrates how the differences vary with age
Age band <25 25-29 30-34 35-39 40-44 45-49 50-54 55-59 60-65 >65
Premiumcommandedby men
-1% 0% 13% 22% 31% 38% 20% 9% 17%* 209%*
Femalesample size 37 135 121 120 98 64 42 21 7* 3*
* Caution: low female sample size
2 4
, 7 3 8
2 8
, 7 1 2
3 7
, 5 4 5
4 6
, 1 4 9 5
2 , 4
1 0
6 0
, 0 3 1
6 0
, 5 0 8
6 3
, 7 4 3
5 8
, 2 5 9
5 8
, 6 7 9
5 1
, 4 5 5
2 5
, 0 9 1
2 8
, 5 8 3 3
3 , 3
4 9 3
7 , 7
7 5
4 0
, 0 9 8
4 3
, 5 3 4 5
0 , 4
7 7
5 8
, 3 1 2
4 9 , 6
1 8 *
1 9
, 0 0 0 *
3 6
, 7 7 0
0
10,000
20,000
30,000
40,000
50,000
60,000
70,000
<25 25-29 30-34 35-39 40-44 45-49 50-54 55-59 60-65 >65 Total
B a s
i c i n c o m e
i n £
Age band
Basic income by age and gender
Mean Male Mean Female
KeyfindingThe difference in salaries of male and female members is nearly non-existent foryounger members (aged up to 29), but for those aged 45-49, men earn 38% morethan women.

8/10/2019 ICE Salary Survey 2013 UK Report
http://slidepdf.com/reader/full/ice-salary-survey-2013-uk-report 25/59
25 Salary Survey 2013 UK report Institution of Civil Engineers
1.7.2 Basic income by membership grade and gender
Few women in FICE, AMICE and TMICE samples – the proportion of female respondents inthese grades is 4.8%, 6.2% and 7.5% respectively, compared to 11.3% of the total sample. Thetable below demonstrates how the proportion of women in the sample changes by grade
Mean basic income differences smallest for recent graduates and TMICE – they becomemore pronounced for Graduates and AMICE
Membergrade FICE MICE AMICE TMICE
AllGraduates
RecentGraduates
Totalsample
Share ofwomen 5% 9% 6% 7% 17% 21% 11%Femalesample size 14* 275 13* 7* 339 246** 648Premium
commandedby men 29% 34% 17% 4% 24% -1% 40%* Caution: low female sample size** Not included in the total sample sum as already included in the All Graduates subgroup
8 2
, 3 4 3
5 7
, 1 4 2
4 7
, 0 2 1
3 2
, 2 7 8 3
8 , 2
5 7
2 6
, 6 3 7
5 1
, 4 5 5
6 3
, 7 7 0 *
4 2
, 7 5 0
4 0
, 0 3 6 *
3 0
, 9 3 9 *
3 0
, 8 4 7
2 6
, 7 8 3
3 6
, 7 7 0
0
10,000
20,000
30,000
40,000
50,000
60,000
70,000
80,000
90,000
FICE MICE AMICE TMICE All Graduates RecentGraduates
Total
B a s
i c i n c o m e
i n £
Membership grade
Basic income by membership grade and gender
Mean Male Mean Female
Keyfinding
The highest mean basic salary differences between male and femalemembers can be observed for MICE and FICE, where the premiumcommanded b men stands at 34% and 29% res ectivel .

8/10/2019 ICE Salary Survey 2013 UK Report
http://slidepdf.com/reader/full/ice-salary-survey-2013-uk-report 26/59
26 Salary Survey 2013 UK report Institution of Civil Engineers
1.7.3 Basic income by main level of responsibility and gender
Women continue to earn less – the small change between 2010 and 2013, with womencontinuing to earn significantly less, indicates that the salary gap between men and women incivil engineering is a systemic issue
Little difference early in career – as in 2010, the mean basic salary of female respondentsundergoing on-the-job training was slightly higher than their male equivalents
Gap increases as career progresses – after on-the-job training, the premium commandedby men increases for more senior levels of responsibility to between 16% and 28%. At thetop MD/CEO/partner level the difference jumps to 49% (however this result should be treatedwith caution due to very small number of female respondents in this group – 13 in 2010 and 7
in 2013)* Caution: low female sample size for some groups (indicated with an asterisk in chart)
2 5 , 6
3 0
3 7
, 1 6 2
4 7
, 5 7 7
5 1
, 2 7 0
6 6
, 3 9 2
9 2
, 0 6 7
4 7
, 1 9 3
4 7
, 1 2 3 5
4 , 8
9 7
5 1
, 4 5 5
2 5
, 9 7 6
3 1
, 1 1 9
3 7
, 0 7 2
4 1
, 9 3 0
5 3
, 6 7 9 6
1 , 6
0 4 *
4 0
, 6 5 8 *
3 7
, 1 9 4
4 3
, 2 9 3
3 6
, 7 7 0
0
10,000
20,000
30,000
40,000
50,000
60,000
70,000
80,000
90,000
100,000
B a s
i c i n c o m e
i n £
Main level of responsibility
Basic income by main level of responsibility and gender
Mean Male Mean Female
Keyfinding
Overall, women earn 40% less than men, in line with the 42% differenceregistered in 2010. The gap increases with the level of responsibility.

8/10/2019 ICE Salary Survey 2013 UK Report
http://slidepdf.com/reader/full/ice-salary-survey-2013-uk-report 27/59
27 Salary Survey 2013 UK report Institution of Civil Engineers
1.7.4 Basic income by region and gender
Big change for East Midlands – in the 2010 survey women in the East Midlands earned 11%less than men, but this difference increased to 63%* in 2013, the biggest difference across allregions (however small sample sizes could explain volatile results)
Highest difference in 2010 observed for South East England – in 2010 male respondents inthis region earned 61% more than their female colleagues, followed by the South West andLondon with a 52% and 50% premium respectively
Little change for London – the difference is again high in London, where men earn 53% morebasic income than women
* Due to a significantly lower sample base of female members per region, results may be more volatile and should be treated with caution
5 1
, 7 3 8
4 7
, 0 6 1
6 1
, 8 9 3
4 5
, 7 6 1
4 8
, 0 3 4
4 2
, 6 7 0 4
8 , 7
6 2 5
5 , 4 7 9
4 6
, 6 8 6
4 4
, 9 7 0 5
0 , 9
9 9
4 3
, 5 6 0 5
1 , 4
5 5
3 1
, 7 4 3
3 5
, 8 2 5
4 0
, 4 9 0
3 8
, 2 4 0
3 9
, 8 9 6
3 2
, 4 8 0
3 3
, 8 3 6
3 8
, 9 1 0
3 4
, 2 9 8
3 5
, 1 3 9
3 5
, 1 5 8
3 2
, 4 9 5
3 6
, 7 7 0
0
10,000
20,000
30,000
40,000
50,000
60,000
70,000
B a s
i c i n c o m e
i n £
Region
Basic income by region and gender
Mean Male Mean Female
Keyfinding
The North East and North West have the smallest mean basic incomedifferences between male and female members, but men still earn 20%more in both cases.

8/10/2019 ICE Salary Survey 2013 UK Report
http://slidepdf.com/reader/full/ice-salary-survey-2013-uk-report 28/59
28 Salary Survey 2013 UK report Institution of Civil Engineers
1.8 Last salary review and holiday entitlement
2% basic salary increase most common – one in five members received a 2% increase, while7% of respondents declared a salary increase of more than 10%
Highest increase most common among younger members – the 10% plus basic salaryincrease was most common among members aged 25-29
No gender gap in salary reviews – both male and female members are equally likely to havetheir salary reviewed in 2013 and there was no significant difference in the amount of theincrease received by men and women
Holiday entitlement stays the same – in line with previous years, the average annual holidayentitlement among UK members is 26.2 days (median = 25)
Annual leave increases slightly with age and seniority – however, the average variationacross these two variables is fairly small (2 days)
Those in education and R&D get biggest holiday allowance – the median value for membersin this category is 30 days annual leave
65%
33% 35%
68%
27%
58%
34%
23%
8% 8%
31%
9%
0%
10%
20%
30%
40%
50%
60%
70%
80%
2008 survey 2009 survey 2010 survey 2013 surveySurvey year
Last salary review
This year Previous year Two years ago or earlier
Keyfinding
68% of respondents have had or will have a salary review this year, asignificant increase from 35% in 2010.

8/10/2019 ICE Salary Survey 2013 UK Report
http://slidepdf.com/reader/full/ice-salary-survey-2013-uk-report 29/59

8/10/2019 ICE Salary Survey 2013 UK Report
http://slidepdf.com/reader/full/ice-salary-survey-2013-uk-report 30/59
S a l a r y S u r v e y 2 0 1 3
R e p o r t
S e c t i o n 2 : c a r e e r r e l a t e d
f i n d i n g s
Section 2
UK careersThis section presents findings related to the non- salary related aspects of members’professional lives. It covers career and professional development, job satisfaction,training needs and more.
It also includes details on members’ perceptions of the value of professionalqualification.

8/10/2019 ICE Salary Survey 2013 UK Report
http://slidepdf.com/reader/full/ice-salary-survey-2013-uk-report 31/59
31 Salary Survey 2013 UK report Institution of Civil Engineers
2.1 Highest priority for future career
Technical skills still a high priority – job related technical skills are a slightly lower priority thanin 2010 (20% of members vs. 16% in 2013), but they remain high on members’ agenda, followedby larger projects/schemes and project management experience (same proportions as in 2010)
Overall order of priorities the same for all respondents – the order of priorities forprofessionally qualified members follows a similar pattern (without obtaining professionalqualification at the top of the list)
Fewer respondents approaching retirement – in 2010 nearly one in four respondents wereapproaching retirement, in 2013 this proportion dropped to one in 10
Complete career change considered by only a small minority – mentioned by 2% ofrespondents, in line with previous surveys
2%
2%
2%
4%
5%
5%
8%
10%
11%
11%
16%
23%
0% 5% 10% 15% 20% 25%
Complete career change
Different industry or sector
Other
Business development skills
Line management role
No career development plans
Business management skills
I'm approaching retirement
Project management experience
Larger projects/schemes
Job related technical skills
Obtaining professional qualification (e.g. CEng)
Highest priority for future career
Keyfinding
Obtaining professional qualification was added to the 2013 questionnaireas a new future career priority and immediately goes to the top of the list,
selected by nearly one in four respondents as their highest priority.

8/10/2019 ICE Salary Survey 2013 UK Report
http://slidepdf.com/reader/full/ice-salary-survey-2013-uk-report 32/59
32 Salary Survey 2013 UK report Institution of Civil Engineers
2.2 Primary source of information about current job
Civil engineers use the internet as supplementary means for job search – only 6% ofmembers found a job on the internet/via a recruitment site (in line with 2010 survey)
Internet used mainly to contact employers direct – of those who found their current jobonline, 30% went directly to the company’s we bsite while 12% used ICE Recruit
One in 10 stayed with the same employer – in-house recruitment helped around 10% of
respondents to find their current job Fragmentation of online recruitment – there is no one specific recruitment website that
dominates the civil engineering hiring market as a whole
1%
1%
4%
6%
6%
7%
8%
10%
10%
12%
17%
17%
0% 2% 4% 6% 8% 10% 12% 14% 16% 18% 20%
Specialised magazine/publication
Careers fair
Newspaper
Other
Internet - recruitment website
NCE
University (open days, university job board, etc.)
In-house (internal job board, internal promotion,…
Recruitment agency
Approached by company/recr. agency
Word of mouth (friends, colleagues, etc.)
Approached the company directly
Primary source of information about current job
Key
finding
Traditional ways of finding a job are much more popular amongrespondents than the internet. Approaching companies directly, word of
mouth, being headhunted and using recruitment agencies top the list and

8/10/2019 ICE Salary Survey 2013 UK Report
http://slidepdf.com/reader/full/ice-salary-survey-2013-uk-report 33/59
33 Salary Survey 2013 UK report Institution of Civil Engineers
2.3 Plans to change current job
More consider changing employer – the employer loyalty level (respondents that plan to stayin their current job or change roles with the same employer) is 83%, slightly lower than in 2007when it stood at 85%
Majority plan to move to another company – of those who plan to change jobs, six in 10members plan to find another employer, the remainder plan to change roles within the samecompany
Reasons to change job same as in 2010 – primary reason to change jobs is to get moremoney (20%), followed by the desire to broaden knowledge/experience (16%) and have a moreinteresting job (15%). Although more money is still the number one motivator to change jobs, it isless so than in 2010 (43%)
Small proportion consider leaving civil engineering – 3% of the respondents would considermoving away from civil engineering, a small proportion but double the 2010 result
70%75%
80% 79%73%
15% 13%10%
13%16%15%
12% 10% 8% 10%
0%10%
20%
30%
40%
50%
60%
70%
80%
90%
2007 2008 2009 2010 2013 Year of the survey
Plans to change job
No, I don´t Yes - with another employer* Yes - with the same employer
Keyfinding
26% of members plan to change jobs, compared to 21% in 2010 (thefigures also include those who plan to become self-employed).

8/10/2019 ICE Salary Survey 2013 UK Report
http://slidepdf.com/reader/full/ice-salary-survey-2013-uk-report 34/59
8/10/2019 ICE Salary Survey 2013 UK Report
http://slidepdf.com/reader/full/ice-salary-survey-2013-uk-report 35/59
35 Salary Survey 2013 UK report Institution of Civil Engineers
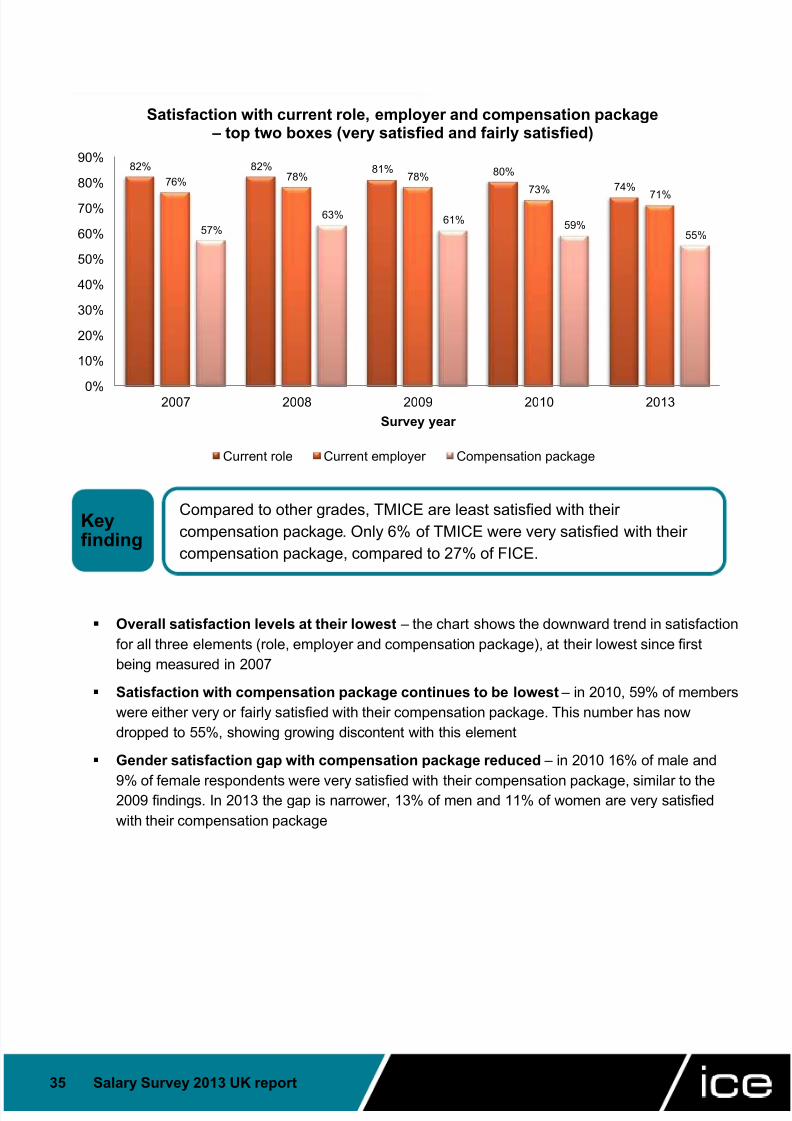
Overall satisfaction levels at their lowest – the chart shows the downward trend in satisfactionfor all three elements (role, employer and compensation package), at their lowest since firstbeing measured in 2007
Satisfaction with compensation package continues to be lowest – in 2010, 59% of memberswere either very or fairly satisfied with their compensation package. This number has nowdropped to 55%, showing growing discontent with this element
Gender satisfaction gap with compensation package reduced – in 2010 16% of male and
9% of female respondents were very satisfied with their compensation package, similar to the2009 findings. In 2013 the gap is narrower, 13% of men and 11% of women are very satisfiedwith their compensation package
82% 82% 81% 80%74%76% 78% 78%
73%71%
57%63% 61% 59%
55%
0%
10%
20%
30%
40%
50%
60%
70%
80%
90%
2007 2008 2009 2010 2013Survey year
Satisfaction with current role, employer and compensation package – top two boxes (very satisfied and fairly satisfied)
Current role Current employer Compensation package
Keyfinding
Compared to other grades, TMICE are least satisfied with theircompensation package. Only 6% of TMICE were very satisfied with theircompensation package, compared to 27% of FICE.

8/10/2019 ICE Salary Survey 2013 UK Report
http://slidepdf.com/reader/full/ice-salary-survey-2013-uk-report 36/59
36 Salary Survey 2013 UK report Institution of Civil Engineers
2.5 Factors that would most improve members’ working life
Little difference between 2010 and 2013 findings – four out of five factors that would mostimprove members’ working life remain the same as in 2010: reduced workload, more holidays,shorter working week and less travelling (all about a better work-life balance)
Working from home less of a priority in 2013 – now ranked fifth, it has dropped a fewpositions since the last survey
Formal non-financial recognition of achievements – a new element on the list ranks seventh
in terms of importance to members
2%
7%
7%
8%
8%
9%
9%
10%
11%
13%
15%
0% 2% 4% 6% 8% 10% 12% 14% 16% 18%
Other
More opportunities for training
Working from home
Flexibility in working hours
More recognition (non-financial)
Nothing
Less travelling
More holidays
Shorter working week
Reduced workload
Clear career path
Factors that would most improve members' working life
Keyfinding
A clear career path was added to the list and makes it straight to the top ofthe ranking, sending a strong message to employers about the importance
of this factor in i mproving members’ working life.

8/10/2019 ICE Salary Survey 2013 UK Report
http://slidepdf.com/reader/full/ice-salary-survey-2013-uk-report 37/59
37 Salary Survey 2013 UK report Institution of Civil Engineers
2.6 Professional development2.6.1 Areas where training needed
Soft skills top the ranking – as in the previous four surveys, the area members feel training ismost needed is soft skills such as management or communications
60% of respondents have identified their professional development needs – as in previousyears, six in 10 respondents have identified their annual training needs and almost one third planto do so
Same demand for improving technical breadth – the need for this area of professionaldevelopment remains at the same level as in previous years at 36%
70% of respondents expect employers to fund training – similar to 2010 (69%), but slightlylower than 76% observed in 2009 and 80% in 2008
One in five respondents will pay towards their training – 5% of respondents are prepared to
cover training costs themselves and 16% would fund the cost jointly with their employer (similarto previous surveys)
38%40% 39%
43%
35%37%
34% 36%
66% 66%
59% 60%
0%
10%
20%
30%
40%
50%
60%
70%
2008 2009 2010 2013Survey year
Areas where training needed
More technical depth (e.g. advancing your specialist knowledge)
More technical breadth (e.g. introducing you to new concepts)Non-technical areas such as management or communication (i.e. soft skills)
Keyfinding
43% of respondents want training for more technical depth, up from 39% in2010, but the key area members want to develop is still soft skills.

8/10/2019 ICE Salary Survey 2013 UK Report
http://slidepdf.com/reader/full/ice-salary-survey-2013-uk-report 38/59
38 Salary Survey 2013 UK report Institution of Civil Engineers
2.6.2 Employer support for member s’ professional development
More members receive support from employers – the proportion of members offered nosupport decreased from 11% in 2010 to 8% in 2013
Fully subsidised external training second most popular – at 56%, the second most commonform of professional development support offered to employees, in line with 2010 results
Same views on amount of training provided – similar to 2010 results, 53% of members feelthey receive enough training to help develop their professional skills, a third are of the oppositeview and 14% are unsure
Number of training days remains the same – on average members spent 4.7 days of trainingin the last fiscal year. Those who said they received sufficient training in that period spent onaverage 6.1 days, compared to just 2.7 days for those who said they did not. These numbers arein line with the 2010 findings
Impact of economic climate on training opportunities is lessening – 39% of respondentssay the current economic climate has had a negative impact on their training opportunities, adrop from 59% in 2010
Free internal training is most common form of professional development support – three-
quarters of members receive this form of employer support, up from 64% in 2010
2%
11%
6%
14%
57%
64%
1%
8%
10%
11%
56%
75%
0% 10% 20% 30% 40% 50% 60% 70% 80%
Other
None
Training allowance
Partly subsidised external training
Fully subsidised external training
Free internal training
Employer support for members' professional development
2013 2010
Keyfinding
The impact of the economic climate on training opportunities is lessening.39% of respondents say the current economic climate has had a negativeimpact on their training opportunities, down from 59% in 2010.

8/10/2019 ICE Salary Survey 2013 UK Report
http://slidepdf.com/reader/full/ice-salary-survey-2013-uk-report 39/59
39 Salary Survey 2013 UK report Institution of Civil Engineers
2.7 Value of professional qualification
Two new questions were added to the 2013 survey to gauge the value of professional qualification withICE. It is interesting to see what members themselves think of professional qualification and how it has
helped them to develop their career.
Clients value professional qualification – according to three in four members. A similarproportion believe it demonstrates a civil engineer ’s commitment to excellence
Less immediate and direct reward from employers – members clearly value their professionalqualification, but fewer receive a pay rise or promotion in recognition of achieving professionalqualification
Does your professional qualification with ICE enhance earning potential? – looking at setsof data from 2007, 2010 and 2013, MICE salaries were compared with those of Graduatemembers for specific groups of members. Both groups had similar characteristics (age, location,years of experience), to allow for close comparison. The income premium for those withprofessional qualification compared to non-professionally qualified peers with similarcharacteristics was between 10%-12%
40%
26%
16% 16%
25%
35%
29%
45% 45%
24%
30%
50% 51% 51%
10%
20%
24%
17%20%
9%
15%
4%7%
25% 22%
4% 4% 4%1% 2%
12%15%
2% 2% 1%
0%
10%
20%
30%
40%
50%
60%
Improvedcareer
prospects
Raised myprofile
Promotion Salaryincrease
Valued byclients
Recognised inmy country
Demonstratescommitmentto excellence
Value of professional qualification
Strongly agree Agree Neither agree nor disagree Disagree Strongly disagree
Keyfinding
85% of qualified members believe professional qualification with ICE hasimproved their career prospects and 71% say it has visibly raised theirprofile.
8/10/2019 ICE Salary Survey 2013 UK Report
http://slidepdf.com/reader/full/ice-salary-survey-2013-uk-report 40/59
40 Salary Survey 2013 UK report Institution of Civil Engineers
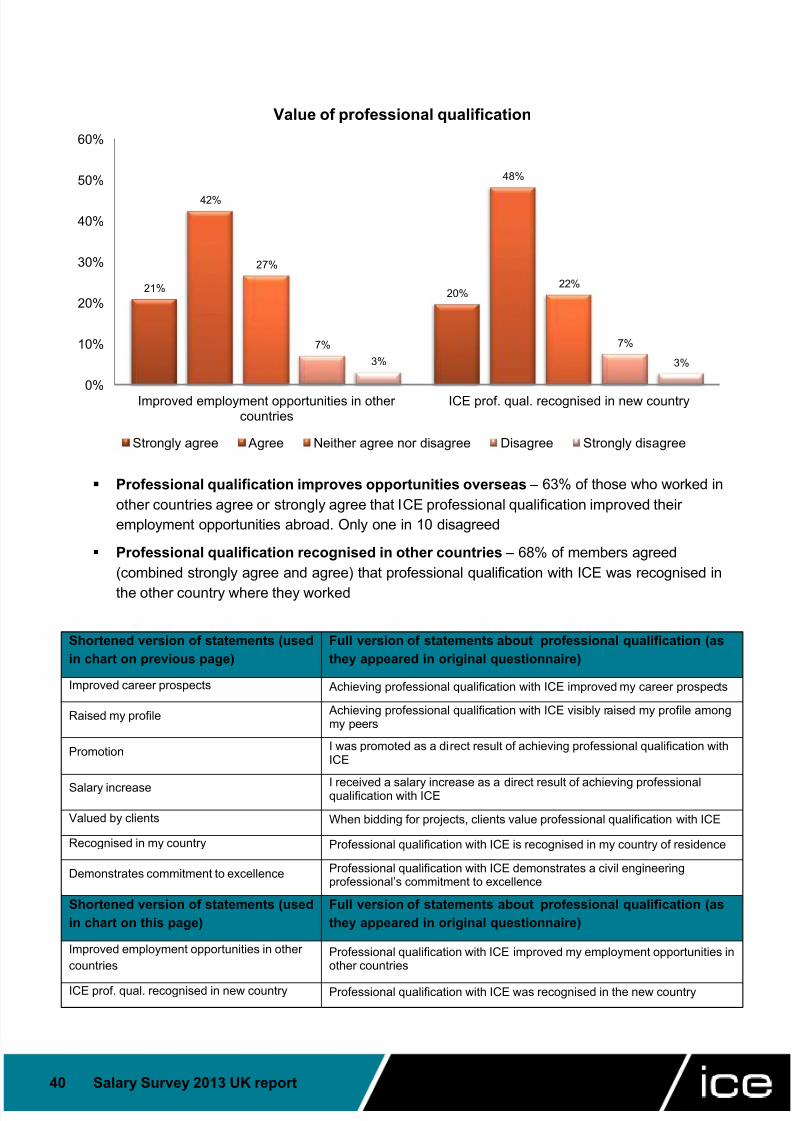
Professional qualification improves opportunities overseas – 63% of those who worked inother countries agree or strongly agree that ICE professional qualification improved theiremployment opportunities abroad. Only one in 10 disagreed
Professional qualification recognised in other countries – 68% of members agreed(combined strongly agree and agree) that professional qualification with ICE was recognised in
the other country where they worked
Shortened version of statements (usedin chart on previous page)
Full version of statements about professional qualification (asthey appeared in original questionnaire)
Improved career prospects Achieving professional qualification with ICE improved my career prospects
Raised my profile Achieving professional qualification with ICE visibly raised my profile amongmy peers
Promotion I was promoted as a direct result of achieving professional qualification withICE
Salary increase I received a salary increase as a direct result of achieving professionalqualification with ICE
Valued by clients When bidding for projects, clients value professional qualification with ICE
Recognised in my country Professional qualification with ICE is recognised in my country of residence
Demonstrates commitment to excellence Professional qualification with ICE demonstrates a civil engineeringprofessional’s commitment to excellence
Shortened version of statements (usedin chart on this page)
Full version of statements about professional qualification (asthey appeared in original questionnaire)
Improved employment opportunities in othercountries
Professional qualification with ICE improved my employment opportunities inother countries
ICE prof. qual. recognised in new country Professional qualification with ICE was recognised in the new country
21% 20%
42%
48%
27%
22%
7% 7%
3% 3%
0%
10%
20%
30%
40%
50%
60%
Improved employment opportunities in other countries
ICE prof. qual. recognised in new country
Value of professional qualification
Strongly agree Agree Neither agree nor disagree Disagree Strongly disagree
8/10/2019 ICE Salary Survey 2013 UK Report
http://slidepdf.com/reader/full/ice-salary-survey-2013-uk-report 41/59
S a l a r y S u r v e y 2 0 1 3
R e p o r t
S e c t i o n 3 : r e c e n t e c o n o m i c c l i m a t e
Section 3
Recent economic climateThis section presents the latest view of the economic climate for the UK.
The results show how members feel about their job security and other aspects oftheir professional lives affected by the economic climate. The survey followed aperiod when the global economic situation and how companies responded to thissituation were the main concerns of many employees.
This section gives an account of members’ qualitative perceptions of the situation.

8/10/2019 ICE Salary Survey 2013 UK Report
http://slidepdf.com/reader/full/ice-salary-survey-2013-uk-report 42/59
42 Salary Survey 2013 UK report Institution of Civil Engineers
3.1 Job security
Members feel more secure in their jobs – double the proportion feel very secure in their jobs(16%, up from 8% in 2010) and there was a four-fold decrease in those who feel very insecure(2%, down from 8% in 2010)
Young members feel most secure – looking at job security by age, it peaks for members aged22-24 (30% feel very secure), drops for those aged 40-44 (10% are very secure) and then risesagain towards the end of the professional life (29% of those aged 66 and over are very secure)
Public sector employees feel least secure – there is very little difference among those whoclaim to be very secure between the private, public and third sector (charities, NGOs, etc.).However, there are clear differences for the combined very secure and secure responses: 80%from the third sector, 67% private sector and 58% public sector
No gender gap in job security – as in 2010, there is little difference between how secure maleand female respondents feel
13%
44%
27%
10%
3%
8%
32%34%
18%
8%
16%
49%
24%
8%
2%
0%
10%
20%
30%
40%
50%
60%
Very secure Secure Neither secure nor insecure
Insecure Very insecure
Security level
Job security in the current economic climate
2009 2010 2013
Keyfinding
Job security has significantly improved. The proportion of those who feelsecure or very secure about their jobs stands at 65%, up from 40% in 2010.

8/10/2019 ICE Salary Survey 2013 UK Report
http://slidepdf.com/reader/full/ice-salary-survey-2013-uk-report 43/59
43 Salary Survey 2013 UK report Institution of Civil Engineers
3.2 Measures taken in response to economic challenges
More respondents say no (negative) measures have been taken – since the results arebased on members’ perceptions rather than hard employment data provided by employers, thebest metric that shows the true change in this area is the one indicating no measures have beentaken (none, in the chart above). In 2013 38% of members stated their companies had taken nomeasures in the last 12 months in response to economic challenges, compared to only 4% in2010
Three top methods of dealing with economic difficulties remain the same – pay freezes,redundancies and hiring freezes are the most common measures to deal with the economic
downturn (37%, 36% and 24% respectively). According to members, all three have increasedsince 2010 (27%, 24% and 18% respectively)
Smallest companies take fewer measures – companies employing up to 10 people had thelowest proportion of measures taken in the last 12 months and the highest proportion ofrespondents who declared that no measures were taken at all (see the table below)
Companysize
Up to 10 11-50 51-250 251-500 501-1,000Over1,000
Totalsampleaverage
Nomeasurestaken 56% 45% 42% 36% 35% 37% 38%
56%63%
49%
16%9%
27% 24%18%
7% 6% 5% 4% 4% 3% 4%
37% 36%
24%
13% 12%6%
38%
4% 2% 4%
0%10%20%30%40%50%60%70%
Measures taken by employers in response toeconomic challenges in the last 12 months
2009 2010 2013
Keyfinding
Although job security has increased, the three key measures taken byemployers in response to economic challenges over the last 12 monthshave also increased: pay freezes, redundancies and hiring freezes.

8/10/2019 ICE Salary Survey 2013 UK Report
http://slidepdf.com/reader/full/ice-salary-survey-2013-uk-report 44/59
44 Salary Survey 2013 UK report Institution of Civil Engineers
3.3 Signs of improving economic climate in last 12 months
More hiring and pay rises than in 2010 – more respondents see their companies hiring again(42% vs. 31% in 2010) and their companies either will or have awarded pay rises this year (32%up from 27% in 2010)
More signs of improvement, but fewer new projects – while more new projects again tops thelist of signs of improvement, fewer members this year noticed more new projects coming in (51%vs. 72% in 2010). This could indicate companies working closer to full capacity than in 2010
Smallest companies remain cautious – while companies with up to 10 people have taken
fewer (negative) measures to respond to economic challenges, they also show fewer positivesigns of improvement. Only 16% of respondents from this group declared their company startedhiring again vs. the average for the total sample at 42%
Pay rises least likely in companies with up to 10 employees – the smallest companies alsohave the lowest proportion of respondents that say their company will award pay rises this year – 12% against the total sample average of 32%
72%
31%27%
17%
11%
3%
51%
42%
32%
10%
2% 3%
0%
10%
20%
30%
40%
50%
60%
70%
80%
More new projectscoming in
My company hasstarted hiring again
My company willaward / has
awarded pay risesthis year
I work more nowthan during the
economicdownturn
Other My company isoffering benefits
again
What are the signs of the economic improvement?
2010 2013
Keyfinding
The proportion of members seeing recent signs of economic improvementincreased significantly from 20% in 2010 to 72% in 2013.

8/10/2019 ICE Salary Survey 2013 UK Report
http://slidepdf.com/reader/full/ice-salary-survey-2013-uk-report 45/59
S a l a r y S u r v e y 2 0 1 3
R e p o r t
S e c t i o
n 4 : U K r e c e n t g r a d u a t e s
Section 4
UK recent graduatesThis section presents detailed findings related to recent graduates.
Recent graduates are defined as those Graduate members aged upto 34 with no more than five years of professional experience, distinctfrom other Graduate members in a higher age bracket and with moreexperience.
8/10/2019 ICE Salary Survey 2013 UK Report
http://slidepdf.com/reader/full/ice-salary-survey-2013-uk-report 46/59
46 Salary Survey 2013 UK report Institution of Civil Engineers
4.1 Recent graduate salary by region
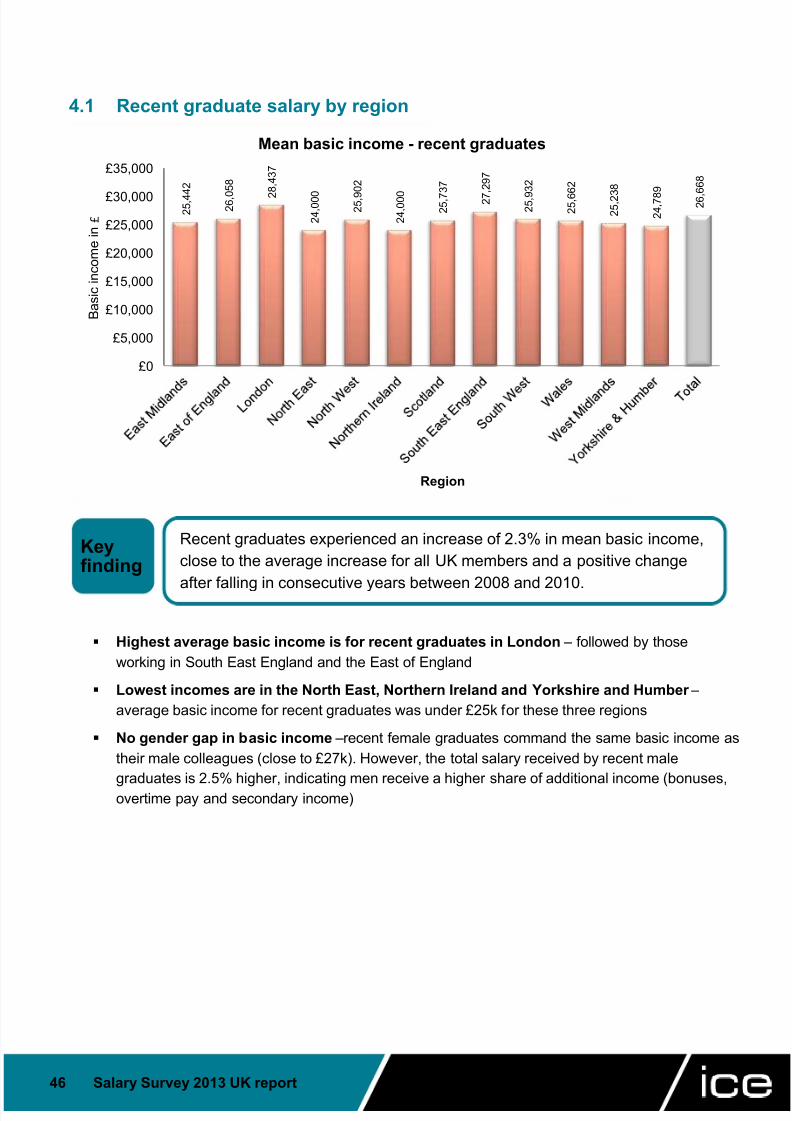
Highest average basic income is for recent graduates in London – followed by thoseworking in South East England and the East of England
Lowest incomes are in the North East, Northern Ireland and Yorkshire and Humber – average basic income for recent graduates was under £25k for these three regions
No gender gap in basic income –recent female graduates command the same basic income astheir male colleagues (close to £27k). However, the total salary received by recent male
graduates is 2.5% higher, indicating men receive a higher share of additional income (bonuses,overtime pay and secondary income)
2 5 , 4 4 2
2 6 , 0
5 8
2 8
, 4 3 7
2 4
, 0 0 0 2 5 , 9 0 2
2 4
, 0 0 0 2 5 , 7 3 7
2 7 , 2
9 7
2 5 , 9 3 2
2 5 , 6 6 2
2 5
, 2 3 8
2 4
, 7 8 9
2 6 , 6
6 8
£0
£5,000
£10,000
£15,000
£20,000
£25,000
£30,000
£35,000
B a s
i c i n c o m e
i n £
Region
Mean basic income - recent graduates
Keyfinding
Recent graduates experienced an increase of 2.3% in mean basic income,close to the average increase for all UK members and a positive change
after falling in consecutive years between 2008 and 2010.
8/10/2019 ICE Salary Survey 2013 UK Report
http://slidepdf.com/reader/full/ice-salary-survey-2013-uk-report 47/59
47 Salary Survey 2013 UK report Institution of Civil Engineers
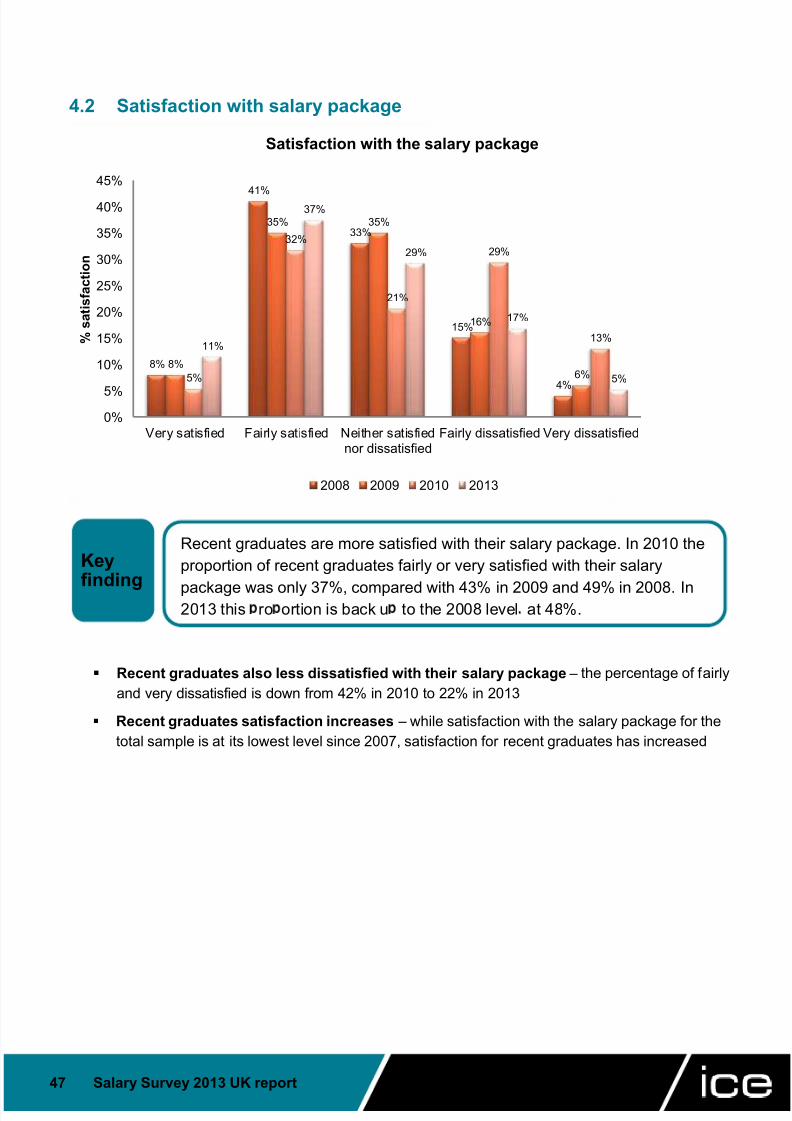
4.2 Satisfaction with salary package
Recent graduates also less dissatisfied with their salary package – the percentage of fairlyand very dissatisfied is down from 42% in 2010 to 22% in 2013
Recent graduates satisfaction increases – while satisfaction with the salary package for thetotal sample is at its lowest level since 2007, satisfaction for recent graduates has increased
8%
41%
33%
15%
4%
8%
35% 35%
16%
6%5%
32%
21%
29%
13%11%
37%
29%
17%
5%
0%5%
10%
15%
20%
25%
30%
35%
40%
45%
Very satisfied Fairly satisfied Neither satisfiednor dissatisfied
Fairly dissatisfied Very dissatisfied
% s
a t i s f a c
t i o n
Satisfaction with the salary package
2008 2009 2010 2013
Key
finding
Recent graduates are more satisfied with their salary package. In 2010 theproportion of recent graduates fairly or very satisfied with their salary
package was only 37%, compared with 43% in 2009 and 49% in 2008. In2013 this ro ortion is back u to the 2008 level at 48%.

8/10/2019 ICE Salary Survey 2013 UK Report
http://slidepdf.com/reader/full/ice-salary-survey-2013-uk-report 48/59
48 Salary Survey 2013 UK report Institution of Civil Engineers
4.3 Basic salary at graduation, two and five years later
Five-year trend less positive – for respondents in 2010, the mean basic income betweengraduation and five years after graduation rose by 41%. In 2013 the increase for respondents isonly 27%, indicating a slowdown in pay rises
Salary increase two years after graduation accelerates again – while the salary increase fiveyears down the line has slowed down, the comparison of basic salaries at each year ofgraduation with salaries two years later is more positive. The increase for 2011 graduates twoyears after graduation is more than double what 2008 and 2009 graduates received
Year of graduation Salary increase two years after graduation
2008 8.2%
2009 7.7%
2010 14.3%
2011 17.5%
Little change in starting salary – the mean basic salary at graduation has changed very littleover time. In 2012 it stood at £23,515, only 1.6% higher than in 2008, while between 2009-2011it was below £23k
20,214
23,409
28,523
23,151
25,038
29,909
£20,000
£22,000
£24,000
£26,000
£28,000
£30,000
£32,000
Basic income at graduation Basic income 2 years after graduation
Basic income 5 years after graduation
B a s
i c i n c o m e
i n £
Basic income at one, two and five years after graduation
2010 2013
Keyfinding
Recent graduate’s salaries have been increasing at a quicker pace.Salaries for those graduating in 2009 were 7.7% higher after two years,
while salaries for 2011 graduates were 17.5% higher after two years (seetable below .

8/10/2019 ICE Salary Survey 2013 UK Report
http://slidepdf.com/reader/full/ice-salary-survey-2013-uk-report 49/59
49 Salary Survey 2013 UK report Institution of Civil Engineers
4.4 Time taken to find the first jobThis year a new question was added, asking recent graduates how long it took them to find their first job.
74% of graduates in Wales were employed straight away – in the East of England on theother hand, one in 12 graduates searched for a job two years or longer
One in four found employment while studying – it is encouraging to see that 25% ofgraduates find jobs while still studying, resulting in a smooth transition into the professional world
1%
2%
3%
5%
4%
10%
12%
25%
37%
0% 5% 10% 15% 20% 25% 30% 35% 40%
More than 2 years
19-24 months
13-18 months
10-12 months
7-9 months
3-6 months
Up to 3 months
I was already employed when graduated
I was employed immediately after graduation
Time taken to find the first job
Key
finding
62% of recent graduates were employed before, or immediately after they
graduated; only 6% were looking for a job for longer than a year.

8/10/2019 ICE Salary Survey 2013 UK Report
http://slidepdf.com/reader/full/ice-salary-survey-2013-uk-report 50/59
50 Salary Survey 2013 UK report Institution of Civil Engineers
4.5 Plans to become professionally qualifiedRecent graduates were also asked about their plans to achieve professional qualification.
95% of recent graduates aim to achieve professionally qualified status with ICE – 2.5% arethinking of pursuing professional qualification with another institution and 0.4% do n’t plan tobecome professionally qualified
Most aspire to become Chartered Engineers – 86.3% hope to attain Chartered Engineerstatus, one in 10 aim to become Incorporated Engineers and 0.5% want to become EngineeringTechnicians
41% of recent graduates say their employer financially rewards achieving a professionalqualification – six in 10 of this group say their employer offers a one-off bonus, and four in 10 asalary increase. This is in line with responses to the question on the value of professionalqualifications, where 40% of respondents say they were promoted as a direct result of obtainingthe professional qualification and 46% received a salary increase
Higher basic salary among those who find their first job fastest – see the table below formore details
Timetaken toget a job
Beforegraduated
Immediatelyaftergraduated
Up to 3months
3-6months
7-9months
10-12months
13-18months
19-24months
Morethan 2years
Meanbasicincome
£27,357 £27,332 £25,840 £25,829 £26,277 £24,514 £24,932 £25,415 £23,480

8/10/2019 ICE Salary Survey 2013 UK Report
http://slidepdf.com/reader/full/ice-salary-survey-2013-uk-report 51/59
S a l a r y S u r v e y 2 0 1 3
R e p o r t
A p p e n d i x
Appendix

8/10/2019 ICE Salary Survey 2013 UK Report
http://slidepdf.com/reader/full/ice-salary-survey-2013-uk-report 52/59
52 Salary Survey 2013 UK report Institution of Civil Engineers
Appendix 1: UK income findings by region and grade (tables)Note: results for groups with fewer than 20 respondents should be treated with caution due to the lowsample size and are indicated with an asterisk. Results for groups with fewer than 10 respondents areomitted.
Region Membership gradeBasic income in
£ Total income in
£East Midlands FICE* N 11 11
Mean 102,540 108,584Median 93,697 102,616
MICE N 180 180Mean 56,928 64,034Median 47,709 51,000
AMICE* N 15 15
Mean 43,910 44,140Median 42,329 42,749TMICE* N 13 13
Mean 33,168 33,819Median 35,834 35,948
All Graduates N 109 109Mean 35,739 39,754Median 31,113 33,000
Recent graduates N 55 55Mean 25,442 27,826
Median 25,000 27,000Total N 327 327
Mean 49,854 55,336Median 43,000 45,000
*Low sample size

8/10/2019 ICE Salary Survey 2013 UK Report
http://slidepdf.com/reader/full/ice-salary-survey-2013-uk-report 53/59
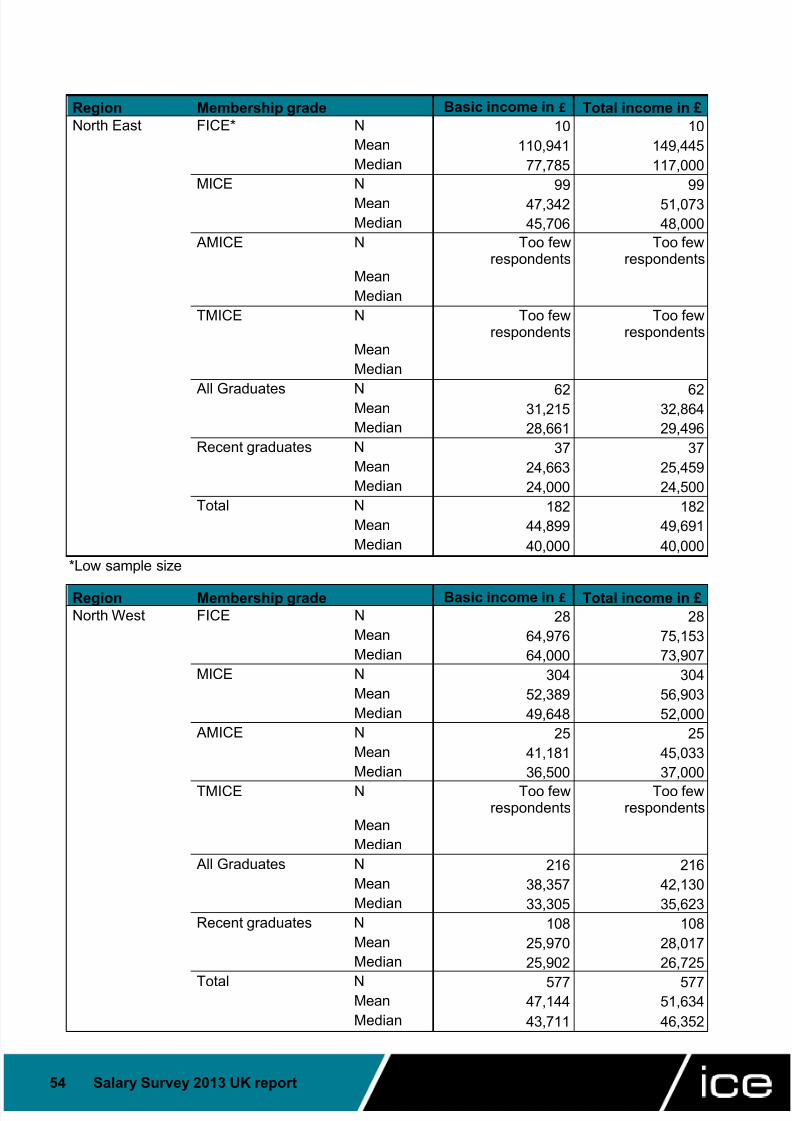
8/10/2019 ICE Salary Survey 2013 UK Report
http://slidepdf.com/reader/full/ice-salary-survey-2013-uk-report 54/59

8/10/2019 ICE Salary Survey 2013 UK Report
http://slidepdf.com/reader/full/ice-salary-survey-2013-uk-report 55/59
55 Salary Survey 2013 UK report Institution of Civil Engineers
Region Membership grade Basic income in £ Total income in £Northern Ireland FICE N
Too fewrespondents
Too fewrespondents
MeanMedian
MICE N 98 98Mean 44,096 47,671Median 43,682 46,000
AMICE NToo few
respondentsToo few
respondentsMeanMedian
TMICE NToo few
respondentsToo few
respondentsMeanMedian
All Graduates N 44 44Mean 31,644 33,526Median 26,251 27,455
Recent graduates N 24 24Mean 23,106 23,939Median 24,000 24,000
Total N 154 154Mean 41,679 44,721Median 39,396 42,149
Region Membership grade Basic income in £ Total income in £
Scotland FICE N 25 25Mean 76,831 86,733Median 77,959 91,030
MICE N 335 335Mean 53,763 58,375Median 48,000 50,000
AMICE N 27 27Mean 46,997 51,167Median 42,470 46,985
TMICE NToo few
respondentsToo few
respondentsMeanMedian
All Graduates N 283 283Mean 36,863 39,767Median 30,579 31,925
Recent graduates N 166 166Mean 27,043 29,706Median 25,737 26,500
Total N 677 677Mean 47,079 51,123
Median 40,000 42,000

8/10/2019 ICE Salary Survey 2013 UK Report
http://slidepdf.com/reader/full/ice-salary-survey-2013-uk-report 56/59
56 Salary Survey 2013 UK report Institution of Civil Engineers
Region Membership grade Basic income in £ Total income in £South EastEngland
FICE N 58 58Mean 79,150 94,944Median 75,000 83,298
MICE N 577 577Mean 58,448 64,430Median 53,000 56,176
AMICE N 36 36Mean 49,570 53,876Median 46,000 48,000
TMICE* N 15 15Mean 32,432 33,424Median 31,775 32,558
All Graduates N 275 275Mean 41,004 45,168Median 34,745 36,622
Recent graduates N 150 150Mean 27,297 29,520Median 26,450 27,625
Total N 960 960Mean 53,972 59,885Median 48,000 51,000
*Low sample size
Region Membership grade Basic income in £ Total income in £South West FICE N 30 30
Mean 80,208 89,832Median 65,125 72,752
MICE N 304 304Mean 49,098 53,754Median 45,000 47,000
AMICE* N 12 12Mean 45,890 48,721Median 45,607 48,554
TMICE* N 12 12Mean 32,326 32,787Median 30,000 30,354
All Graduates N 185 185Mean 33,932 36,239Median 30,000 31,297
Recent graduates N 120 120Mean 25,932 27,497Median 25,000 26,061
Total N 542 542Mean 45,203 49,200Median 40,583 43,000
*Low sample size

8/10/2019 ICE Salary Survey 2013 UK Report
http://slidepdf.com/reader/full/ice-salary-survey-2013-uk-report 57/59
57 Salary Survey 2013 UK report Institution of Civil Engineers
Region Membership grade Basic income in £ Total income in £Wales FICE* N 18 18
Mean 67,557 86,503Median 61,277 62,105
MICE N 119 119Mean 47,807 52,294Median 42,000 45,000
AMICE N Too fewrespondents
Too fewrespondents
MeanMedian
TMICE* N 11 11Mean 30,499 34,314Median 31,000 35,400
All Graduates N 86 86
Mean 35,331 37,356Median 31,070 32,500
Recent graduates N 33 33Mean 25,662 28,168Median 25,725 26,265
Total N 240 240Mean 43,777 48,370Median 38,502 40,440
*Low sample size
Region Membership grade Basic income in£
Total income in £West Midlands FICE* N 13 13Mean 88,142 100,749Median 68,659 100,000
MICE N 252 252Mean 55,819 62,800Median 50,000 53,000
AMICE N 22 22Mean 45,882 49,251Median 43,000 43,000
TMICE N Too fewrespondents
Too fewrespondents
MeanMedian
All Graduates N 139 139Mean 33,963 36,233Median 29,972 31,793
Recent graduates N 81 81Mean 25,238 26,953Median 25,007 25,700
Total N 432 432Mean 48,900 54,258Median 44,000 45,000
*Low sample size

8/10/2019 ICE Salary Survey 2013 UK Report
http://slidepdf.com/reader/full/ice-salary-survey-2013-uk-report 58/59
58 Salary Survey 2013 UK report Institution of Civil Engineers
Region Membership grade Basic income in £ Total income in £Yorkshire &Humber
FICE NToo few
respondentsToo few
respondentsMeanMedian
MICE N 215 215Mean 46,860 50,782Median 45,000 47,473
AMICE* N 12 12Mean 36,132 37,101Median 37,684 37,718
TMICE NToo few
respondentsToo few
respondentsMeanMedian
All Graduates N 102 102Mean 32,205 33,306Median 30,000 31,090
Recent graduates N 57 57Mean 24,789 25,412Median 25,000 25,100
Total N 347 347Mean 42,446 45,538Median 41,000 41,900
*Low sample size
Region Membership grade Basic income in £ Total income in £
All FICE N 282 282Mean 81,447 96,908Median 74,200 82,000
MICE N 3,133 3,133Mean 55,880 61,829Median 50,000 52,000
AMICE N 205 205Mean 46,588 49,920Median 42,000 42,978
TMICE N 98 98Mean 32,177 34,128Median 31,000 33,000
All Graduates N 2,002 2,002Mean 37,002 40,113Median 31,567 33,113
Recent graduates N 1,158 1,158Mean 26,668 28,649Median 26,000 27,000
Total N 5,719 5,719Mean 49,793 55,055Median 43,640 46,000

8/10/2019 ICE Salary Survey 2013 UK Report
http://slidepdf.com/reader/full/ice-salary-survey-2013-uk-report 59/59
S a l a r y S u r v e y 2 0 1 3
r e p o r t
I n s t i t u t i o n o f C i v i l E
n g i n e e r s
Institution of Civil EngineersOne Great George Street