icfa-scic net mon report · web viewinternational committee for future accelerators (icfa) standing...
TRANSCRIPT

International Committee for Future Accelerators (ICFA)
Standing Committee on Inter-Regional Connectivity (SCIC) Chairperson: Professor Harvey Newman, Caltech
ICFA SCIC Network Monitoring Report
Prepared by the ICFA SCIC Monitoring Working GroupOn behalf of the Working Group:
Les Cottrell [email protected]
1

January 2008 Report of the ICFA-SCIC Monitoring Working Group
Edited by R. Les Cottrell, Qasim Bilal Lone, Jared Greeno, Shawn McKeeon behalf of the ICFA-SCIC Monitoring WG
Created January 14, 2008, Finished Jan 31, 2008
ICFA-SCIC Home Page | Monitoring WG Home Page
This report is available from http://www.slac.stanford.edu/xorg/icfa/icfa-net-paper-jan08/
2
......................................................Error! Bookmark not defined.January 2008 Report of the ICFA-SCIC Monitoring Working Group..........................2Executive Overview...............................................................................................................5Introduction............................................................................................................................6ICFA/SCIC Network Monitoring Working Group................................................................6
Goals of the Working Group..............................................................................................7Methodology..........................................................................................................................7PingER Results......................................................................................................................8
Deployment........................................................................................................................8Historical Growth of PingER Coverage Since 2001.........................................................9Metric Meanings..............................................................................................................12
Packet Loss..................................................................................................................12RTTs............................................................................................................................17
Throughput......................................................................................................................19View from Europe............................................................................................................20Yearly Throughput Trends...............................................................................................21Variability of performance between and within regions.................................................22
Comparisons with Economic and Development Indicators.................................................24Human Development Index (HDI):.................................................................................25The Digital Opportunity Index (DOI):............................................................................26
Case Studies.........................................................................................................................27NIIT Case Study..............................................................................................................27South Asia Case Study.....................................................................................................28South Asia as Compared to the rest of the World Regions..............................................28
Routing Within South Asian Countries........................................................................29MOS (Mean Opinion Score)........................................................................................29Internet Usage and Bandwidth Allocation for South Asia...........................................31
Latin America Case Study...............................................................................................31Minimum RTT and Packet Loss...................................................................................32Routing As Seen From Brazil......................................................................................33ALICE and RedCLARA................................................................................................33
Case Study for Africa......................................................................................................34PingER and Internet Performance in Africa................................................................35
High Performance Network Monitoring..............................................................................37Accomplishments since last report......................................................................................42Efforts to Improve PingER Management............................................................................43
TULIP- IP Locator Using Triangulation.........................................................................43PingER Host Searching Tool...........................................................................................43PingER Validation Toolkit...............................................................................................44PingER Executive Plots...................................................................................................44ViPER (Visualization for PingER)...................................................................................46Advanced Google Maps for PingER................................................................................47
3

2007 Digital Divide Publications/Presentations:.................................................................48Talks (Most recent first)...................................................................................................48
Recommendations................................................................................................................48Future Support.................................................................................................................49
Acknowledgements..............................................................................................................50References............................................................................................................................50
4

Executive Overview
Internet performance is improving each year with throughputs typically improving by 25-40% per year and losses by up to 25% per year, and for some regions such as S. E. Europe, even more. Geosynchronous satellite connections are still important to countries with poor telecommunications infrastructure and for outlying areas. However, the number of countries with fiber connectivity has and continues to increase and in most cases, satellite links are used as backup or redundant links. In general for HEP countries satellite links are being replaced with land-line links with improved performance in particular for Round Trip Time (RTT). On the other side of the coin Internet usage is increasing (see http://www.internetworldstats.com/stats.htm), the application demands (see for example [bcr]) are growing and the expected reliability is increasing, so we cannot be complacent.
In general, throughput measured from within a region is much higher than when measured from outside. Links between the more developed regions including N. America1, Japan and Europe are much better than elsewhere (3 - 10 times more throughput achievable). Regions such as Russia, S.E. Asia, S.E. Europe and Latin America are 3-6 years behind. Russia and S.E. Asia are catching up slowly. However, Africa, S. Asia and C. Asia are 8-10 years behind and even worse appear to be falling further behind. Looking forward ten years to 2017, if the current rates of progress continue, then performance from N. America to Africa will be 1000 times worse than to Europe, to S. Asia and C. Asia will be 100 times worse than to Europe.
Africa and South Asia are two regions where the internet has seen phenomenal growth, especially in terms of usage. However, it appears that network capacity is not keeping up with demand in these regions. In fact many sites in Africa and India appear to have throughputs less than that of a well connected (cable, DSL or ISDN) home in Europe, Anglo America, Japan or Australia. Further the end-to-end networking is often very fragile both due to last mile effects and poor infrastructure (e.g. power) at the end sites, and also due to lack of adequate network backup routes. Africa is a big target of opportunity with close to a billion people and a 625% growth in number of Internet users from 2000-2006. However, there are many challenges including lack of power, import duties, lack of skills, disease, corruption, and protectionist policies. In almost all measurements Africa stands out as having the poorest performance and even worse is falling behind much faster than any other region. Further Africa is a vast region and there are great differences in performance between different countries and regions within Africa.
There is a moderate to strong positive correlation between the Internet performance metrics and various economic and development indices available from the UN and International Telecommunications Union (ITU). Besides being useful in their own right these correlations are an excellent way to illustrate anomalies and for pointing out measurement/analysis problems. The large variations between sites within a given country illustrate the need for careful checking of the results and the need for multiple sites/country to identify anomalies.
1 Since North America officially includes Mexico, the Encyclopedia Britannica recommendation is to use the terminology Anglo America (US + Canada). However, in this document North America is taken to mean the U.S. and Canada.
5

Also given the difficulty of developing the human and technical indicators (at best they are updated once a year and usually much less frequently), having indicators such as PingER that are constantly and automatically updated is a useful complement.
For modern HEP collaborations and Grids there is an increasing need for high-performance monitoring to set expectations, provide planning and trouble-shooting information, and to provide steering for applications.
To quantify and help bridge the Digital Divide, enable world-wide collaborations, and reach-out to scientists world-wide, it is imperative to continue and extend the PingER monitoring coverage to all countries with HEP programs and significant scientific enterprises.
IntroductionThis report may be regarded as a follow on to the May 1998 Report of the ICFA-NTF Monitoring Working Group [icfa-98], the January 2003 Report of the ICFA-SCIC Monitoring Working Group [icfa-03], the January 2004 Report of the ICFA-SCIC Monitoring Working Group [icfa-04], the January 2005 Report of the ICFA-SCIC Monitoring Working Group [icfa-05], the January 2006 Report of the ICFA-SCIC Monitoring Working Group [icfa-06], and the January 2007 Report of the ICFA-SCIC Monitoring Working Group [icfa-07].
The current report updates the January 2007 report, but is complete in its own right in that it includes the tutorial information and other from the previous reports. The main changes in this year’s reports are:
Figures 1-7 and 9-13, and Tables 1, 2, and 4 have been updated. The text related to all the above tables and figures has been updated. Sections have been added on:
o A case study for South Asiao A case study for Latin America
Refinements have been made to some of the case studies presented last year. Updates have been made to the discussions on new tools being employed by the
PingER project. We have updated the section on digital divide-related publications and talks.
ICFA/SCIC Network Monitoring Working Group
The formation of this working group was requested at the ICFA/SCIC meeting at CERN in March 2002 [icfa-mar02]. The mission is to: Provide a quantitative/technical view of inter-regional network performance to enable understanding the current situation and making recommendations for improved inter-regional connectivity.
The lead person for the monitoring working group was identified as Les Cottrell. The lead person was requested to gather a team of people to assist in preparing the report and to prepare the current ICFA report for the end of 2002. The team membership consists of:
6

Table 1: Members of the ICFA/SCIC Network Monitoring team
Les Cottrell SLAC US [email protected] Hughes-Jones University of Manchester UK [email protected]
Sergei Berezhnev RUHEP, Moscow State.Univ. Russia [email protected]
Sergio F. Novaes FNAL S. America [email protected] Fukuko Yuasa KEK Japan and E. Asia [email protected]
Shawn McKee Michigan I2 HEP Net Mon WG [email protected]
Goals of the Working Group
Obtain as uniform picture as possible of the present performance of the connectivity used by the ICFA community
Prepare reports on the performance of HEP connectivity, including, where possible, the identification of any key bottlenecks or problem areas.
MethodologyThere are two complementary types of Internet monitoring reported on in this report.
1. In the first we use PingER [pinger] which uses the ubiquitous "ping" utility available standard on most modern hosts. Details of the PingER methodology can be found in the May 1998 Report of the ICFA-NTF Monitoring Working Group [icfa-98] and [ejds-pinger]. PingER provides low intrusiveness (~ 100bits/s per host pair monitored2) RTT, loss, jitter, reachability (if a host does not respond to a set of 21 pings it is presumed to be non-reachable). The low intrusiveness enables the method to be very effective for measuring regions and hosts with poor connectivity. Since the ping server is pre-installed on all remote hosts of interest, minimal support is needed for the remote host (no software to install, no account needed etc.)
2. The second method (IEPM-BW [iepm], perfSONAR [perfSONAR] etc.) is for measuring high network and application throughput between hosts with excellent connections. Examples of such hosts are to be found at HEP accelerator sites and tier 1 and 2 sites, major Grid sites, and major academic and research sites in N. America2, Japan and Europe. The method can be quite intrusive (for each remote host being monitored from a monitoring host, it can utilize hundreds of Mbits/s for ten seconds to a minute each hour). It also requires more support from the remote host. In particular either various services must be installed and run by the local administrator or an account is required, software (servers) must be installed, disk space, compute cycles etc. are consumed, and there are security issues. The method provides expectations of throughput achievable at the network and application levels, as well as information on how to achieve it, and trouble-shooting information.
2 In special cases, there is an option to reduce the network impact to ~ 10bits/s per monitor-remote host pair.
7

PingER Results
Deployment
The PingER data and results extend back to the start of 1995. They thus provide a valuable history of Internet performance. PingER has over 40 monitoring nodes in 21 countries, that monitor over 800 remote nodes at over 600 sites in over 150 countries (see PingER Deployment [pinger-deploy]). These countries contain over 95% of the world's population (see Table 2) and over 99% of the online users of the Internet. Most of the hosts monitored are at educational or research sites. We try and get at least 2 hosts per country to help identify and avoid anomalies at a single host, although we are making efforts to increase the number of monitoring hosts to as many as we can. The requirements for the remote host can be found in [host-req]. Figure1 below shows the locations of the monitoring and remote (monitored sites).
Figure1 : Locations of PingER monitoring and remote sites as of Jan 2008. Red sites are monitoring sites, blue sites are beacons that are monitored by most monitoring sites, and green sites are remote sites that
are monitored by one or more monitoring sites
There are over nineteen hundred monitoring/monitored-remote-host pairs, so it is important to provide aggregation of data by hosts from a variety of "affinity groups". PingER provides aggregation by affinity groups such as HEP experiment collaborator sites, country, Top Level Domain (TLD), Internet Service Provider (ISP), or by world region etc. The world regions, as defined for PingER, and countries monitored are shown below in Figure 2. The regions are chosen starting from the U.N. definitions [un]. We modify the region definitions to take into account which countries have HEP interests and to try and ensure the countries in a region have similar performance.
8
Figure 2 Major regions of the world for PingER aggregation by regions, countries in white are not monitored
More details on the regions are provided in Table 2 that highlights the number of countries monitored in each of these regions, and the distribution of population in these regions.
Table 2: PingER Monitored Countries and populations by region Jul-Dec 2007
Regions# of Countries
% of World Population
Africa 45 13Central Asia 9 1.2Europe 40 8.8Latin America 20 8.2North America 2 5East Asia 4 23South East Asia 9 8South Asia 7 23Middle East 12 3.2Oceania 4 0.5Russia 1 2.1Total 153 95.5
Historical Growth of PingER Coverage Since 2001
Figure 3 shows the growth in the number of hosts monitored by PingER from SLAC for each region since 1988. As can be seen, initially the main regions monitored were North America, Europe, East Asia, and Russia. These were the regions with the main HEP interest. More
9

recently the increased number of hosts monitored in developing regions such as Africa, Latin America, Middle East and South Asia is very apparent.
Figure 3 : Number of hosts monitored from SLAC by regionTowards the end of 2001 the number of sites monitored started dropping as sites blocked pings due to security concerns. The rate of blocking was such that out of 214 hosts that were pingable in July 2003, 33 (~15%) were no longer pingable in December 2003.
The increases in monitored sites towards the end of 2002 and early 2003 was due to help from the Abdus Salam Institute of Theoretical Physics (ICTP). The ICTP held a Round Table meeting on Developing Country Access to On-Line Scientific Publishing: Sustainable Alternatives [ictp] in Trieste in November 2002 that included a Proposal for Real time monitoring in Africa [africa-rtmon]. Following the meeting a formal declaration was made on RECOMMDENDATIONS OF the Round Table held in Trieste to help bridge the digital divide [icfa-rec]. The PingER project is collaborating with the ICTP to develop a monitoring project aimed at better understanding and quantifying the Digital Divide. On December 4th the ICTP electronic Journal Distribution Service (eJDS) sent an email entitled Internet Monitoring of Universities and Research Centers in Developing Countries [ejds-email] to their collaborators informing them of the launch of the monitoring project and requesting participation. By January 14th 2003, with the help of ICTP, we added about 23 hosts in about 17 countries including: Bangladesh, Brazil, China, Columbia, Ghana, Guatemala, India (Hyderabad and Kerala), Indonesia, Iran, Jordan, Korea, Mexico, Moldova, Nigeria, Pakistan, Slovakia and the Ukraine. The increase towards the end of 2003 was spurred by preparations for the second Open Round Table on Developing Countries Access to Scientific Knowledge: Quantifying the Digital Divide 23-24 November Trieste, Italy and the WSIS conference and associated activities in Geneva December 2003.
The increases in 2004 were due to adding new sites especially in Africa, S. America, Russia and several outlying islands.
In 2005, the Pakistan Ministry Of Science and Technology (MOST) and the US State Department funded SLAC and the National University of Sciences and Technology’s (NUST) Institute of Information Technology (NIIT) to collaborate on a project to improve and extend PingER. As part of this project and the increased interest from Internet2 in the “Hard to Reach Network Places” Special Interest Group, many new sites in the South Asia and Africa were added to increase the coverage in these regions and also to replace sites that
10

were blocking pings. For instance we were unable to find pingable sites in Angola prior to December 2005. Also as part of this project we started to integrate PingER with the NLANR/AMP project and as a result a number of the AMP nodes were added as PingER remote hosts in the developing regions. With help of Duncan Martin and the South Africa Tertiary Education Network (TENET) (http://www.tenet.ac.za), we successfully set up a monitoring node in South Africa, which became a great help in viewing the Digital Divide from within the Divide. With the help of NIIT (www.niit.edu.pk), a monitoring node was set up at NIIT and in Nov. 2005, another node was added at NTC (National Telecommunication Corporation www.ntc.net.pk), which is the service provider for the PERN (Pakistan Educational and Research Network www.pern.edu.pk).
Again in 2006 in preparation for a conference on Sharing Knowledge Across the Mediterranean at ICTP Trieste Nov 6-8, 2006, we added many new sites especially in Africa.
In 2007, an effort was made to find new monitored nodes in countries not previously being observed. This was:
To improve comparisons with human and economic development indices from the ITU, the UNDP, the World Bank, the CIA and also measures of International bandwidth capacity/country.
To better enable validation of PingER derived throughputs versus throughput measures from Ookla Speedtest.net and ZDnet speedtest.
To prepare for case studies on South Asia [casesasia] and Sub-Saharan Africa [caseafrica].
To prepare for invited talks given at the American Physical Society (APS) meeting in Jacksonville Florida [aps07], the IHY in Addis Ababa, Ethiopia [ihy07], and the Sharing Knowledge Foundation in Montpellier, France [skf07]. In addition a talk was given at the Internet2 Spring Members meeting [i207].
To prepare for a visit to NIIT in Pakistan and talks to be given there.
As a result of a collaboration with James Whitlock of the Bethlehem Alliance resulting in two monitoring hosts in Palestine (Jerusalem and the Gaza Strip).
As a result, in 2007, the total number of hosts monitored from SLAC went up from 334 to 442, the main increases being in Africa which went from 58 to 95 hosts, South Asia from 20 to 37 hosts, Middle East 15 to 26 hosts, and South East Asia from 12 to 22 hosts. We are also in the process of adding 135 new hosts from Ookla servers which cover 66 countries.
Metric Meanings
11

To assist in interpreting the results in terms of their impact on well-known applications, we categorize the losses into quality ranges. These are shown below in Table 3.
Table 3: Quality ranges used for loss Excellent Good Acceptable Poor Very Poor Bad
Loss <0.1% >=0.1% & < 1%
> =1% & < 2.5%
>= 2.5% & < 5%
>= 5% & < 12% >= 12%
More on the effects of packet loss and RTT can be found in the Tutorial on Internet Monitoring & PingER at SLAC [tutorial], briefly:
At losses of 4-6% or more video-conferencing becomes irritating and non-native language speakers become unable to communicate. The occurrence of long delays of 4 seconds (such as may be caused by timeouts in recovering from packet loss) or more at a frequency of 4-5% or more is also irritating for interactive activities such as telnet and X windows. Conventional wisdom among TCP researchers holds that a loss rate of 5% has a significant adverse effect on TCP performance, because it will greatly limit the size of the congestion window and hence the transfer rate, while 3% is often substantially less serious, Vern Paxson. A random loss of 2.5% will result in Voice Over Internet Protocols (VOIP) becoming slightly annoying every 30 seconds or so. A more realistic burst loss pattern will result in VOIP distortion going from not annoying to slightly annoying when the loss goes from 0 to 1%. Since TCP throughput for the standard (Reno based) TCP stack goes as 1/(sqrt(loss) [mathis]) (see M. Mathis, J. Semke, J. Mahdavi, T. Ott, "The Macroscopic Behavior of the TCP Congestion Avoidance Algorithm",Computer Communication Review, volume 27, number 3, pp. 67-82, July 1997), it is important to keep losses low for achieving high throughput.
For RTTs, studies in the late 1970s and early 1980s showed that one needs < 400ms for high productivity interactive use. VOIP requires a RTT of < 250ms or it is hard for the listener to know when to speak.
It must be understood that these quality designations apply to normal Internet use. For high performance, and thus access to data samples and effective partnership in distributed data analysis, much lower packet loss rates may be required.
Packet Loss
Of the two metrics, packet loss and RTT, loss is more critical since a loss of a packet will typically cause timeouts that can last for several seconds, moreover, RTT increases with increase in distance between any two nodes and also, with the increase in the number of hops, whereas loss is less distance dependent. For instance RTT between a node at SLAC and somewhere in Europe is expected to be around 160ms.
12

Figure 4 : Jul-Sep ’07 median average monthly packet loss per mil seen from SLAC to the world.
Figure 4 shows a snapshot of the median average monthly losses from SLAC to the world between January and September 2007. We observe that most countries have low (< 1%) losses, with most of the poor or worse performance being confined to Africa..
Another way of looking at the losses is to see how many hosts fall in the various loss quality categories defined above as a function of time. An example of such a plot is seen in. Figure 5
Figure 5 : Number of hosts measured from SLAC for each quality category from February 1998 through November 2007.
It can be seen that recently most sites fall in the good quality category. The plot also shows the increase in the total number of sites monitored from SLAC over the years. The
13

improvements are particularly encouraging since most of the new sites are added in developing regions.
Figure 6 below shows the long term loss trends for the various regions as seen from SLAC.
Figure 6 : Packets loss trends from SLAC to various regions of the world. The bold green line shows a 25% improvement/year or a factor of 10 in 8 years. The data points for the actual average yearly losses
are shown for N. America and Africa to give an idea of the variation in the results from year to year
The following general observations can be made for the losses:
For most regions (except Africa) the improvement in losses is typically between 14% (S. Asia) and 25% per year.
The better regions (N. America, Europe, E. Asia and Australaisia), shown by dashed lines, are achieving better than 1% packet loss for most of their sites (with the exception of a few sites in China) seen from SLAC
Africa has the highest loss rates and is falling further behind other regions (<3% improvement/year).
Figure 7 shows the world's connected population fractions obtained by dividing countries up by loss quality seen from the US, and adding the connected populations for the countries (we
14

obtained the population/country figures from "How many Online" [nua] for 2001 and from CIA World Factbook for 2006 [cia-pop-figures]).
Figure 7 : Fraction of the world's population in countries with measured loss in 2001 and 2007.
It can be seen that in 2001, <20% of the population lived in countries with acceptable or better packet loss. By 2007 this had risen to over 90%. The coverage of PingER has also increased from about 50 countries at the start of Jan 2001 to over 150 in December 2007. This in turn reduced the fraction of the connected population for which PingER has no measurements from 49% to 3.2%. The results are even more encouraging when one bears in mind that the newer countries being added typically are from regions that have traditionally poorer connectivity. It is interesting to compare the packet losses seen by various regions with those seen by residential DSL customers in the San Francisco Bay Area. This is shown in Figure 8 below.
15

Figure 8 :Losses from SLAC to various world regions compared with that for residential customers in the San Francisco Bay Area
RTTsThere are limits to the minimum RTT due to the speed of light in fibers or electricity in copper. Typically today, the minimum RTTs for terrestrial circuits are about 2 * distance / ( 0.6 * c), or roughly 100km/ms (RTT time,) where c is the velocity of light, the factor of 2 accounts for the round-trip, 0.6*c is roughly the speed of light in fibre. For geostationary satellites links, the minima are between 400 and 600ms. For U.S. cross country links (e.g. from SLAC on the US West Coast to the Brookhaven National Laboratory (BNL) on the US East Coast) the typical minimum RTT (i.e. a packet sees no queuing delays) is about 70 msec.
Figure 9 below shows the trends of the min-RTT measured from ESnet sites in the US to the various regions of the world. The straight lines are exponential fits to the data (straight lines on a log-linear plot), and the wiggly lines are the monthly rolling averages.
16

Figure 9 : Minimum RTT measured from the US to sites in regions of the world
South Asia has made substantial improvements in particular moving from satellite to land lines as can be seen in Figure 10 below. Africa and S. E. Asia are improving. Central Asia on the other hand has been stuck with geo-stationary satellites and so little change is seen for it. Latin America took a huge step down in RTT at the end of 1999 going from mainly satellite (>~400ms) to 200ms (i.e. mainly landlines) but is trending back up because of additional hosts being monitored in the region. S.E. Asia looks like a gradual improvement. For most of the other regions the improvements are marginal. This is at least partially since upgrading high speed links from say 45 to 155, 622 or 2400 or 10,000 Mbps has a small effect on the minimum RTT, the main effect being the distance.
Figure 10 shows the RTT from the U.S. to the world in January 2000, December 2003 and December 2006. It also indicates which countries of the world contain sites that were monitored countries not monitored from the US are shown in white.
17
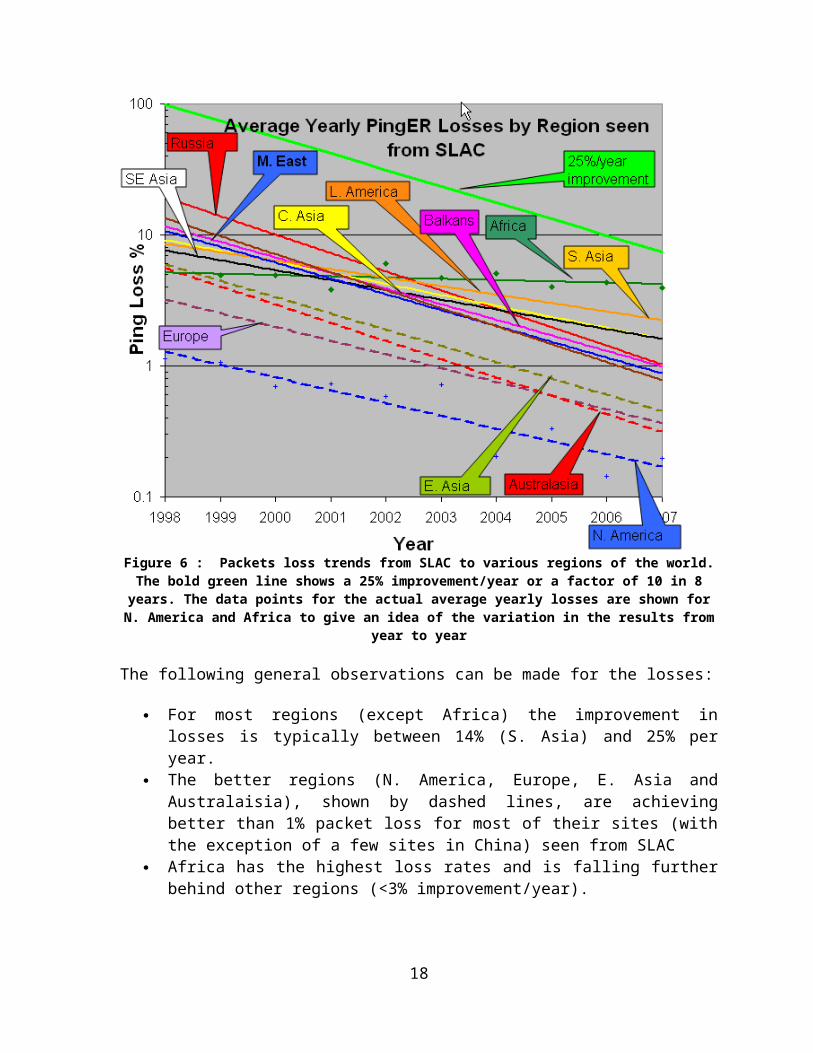
Figure 10 : Jan-Sep 2007 comparison of Minimum RTT with 2003 and 2000 results
It is seen that countries such as Argentina and China with satellite links (> 400ms RTT or dark red) in January 2000 have moved to land lines and now have good minimum RTT. Today satellite links are used in places where it is hard or unprofitable to pull terrestrial-lines (typically fibers) to. Barring a few countries in Sub Saharan Africa (Burundi, Democratic Republic of Congo, Mauritania, Mozambique, Niger, Rwanda, Tanzania, Uganda, Zimbabwe, Zambia), Central Asia (Armenia, Azerbaijan, Afghanistan, Kyrgistan, Tajikistan, all of which are served by the Virtual Silk Highway project [Silk] geostationary satellite link), Cuba and Nepal; most of the countries being monitored by PingER now have optical fiber connectivity. The Eastern Africa Submarine Cable System (EASSy [EASSy]) Project has been established to develop and implement a submarine cable system to provide fibre optic telecommunications facilities to the Eastern coast of Africa. The partners include Botswana, Burundi, Djibouti, Ethiopia, Kenya, Madagascar, Mozambique, Rwanda, Somalia, South Africa, Sudan, Zanzibar, Tanzania and Uganda so this could make a big improvement for this area. This cable will also link Northern and Southern African international gateways to the system. Other fibres for Eat Africa are now planned, including projects from TEAMS [TEAMS] and SEACOM [SEACPM]. Hopefully this will provide better competition..
Throughput
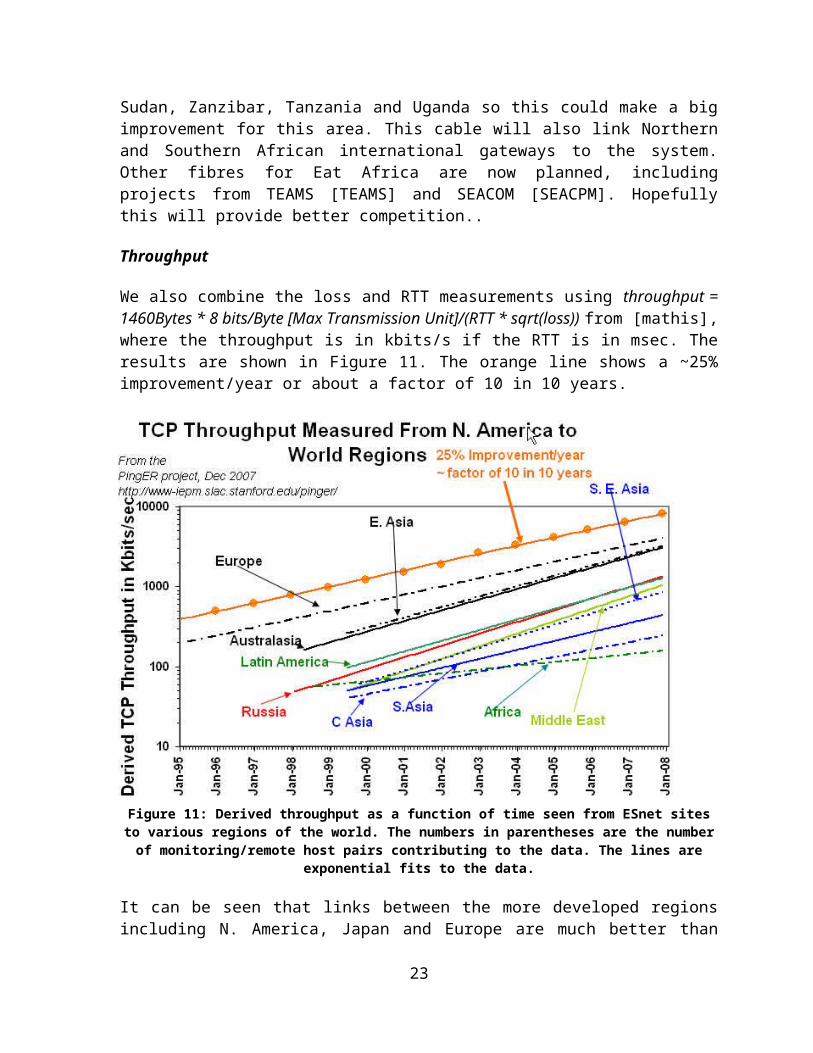
We also combine the loss and RTT measurements using throughput = 1460Bytes * 8 bits/Byte [Max Transmission Unit]/(RTT * sqrt(loss)) from [mathis], where the throughput is in kbits/s if the RTT is in msec. The results are shown in Figure 11. The orange line shows a ~25% improvement/year or about a factor of 10 in 10 years.
18

Figure 11: Derived throughput as a function of time seen from ESnet sites to various regions of the world. The numbers in parentheses are the number of monitoring/remote host pairs contributing to the data.
The lines are exponential fits to the data.
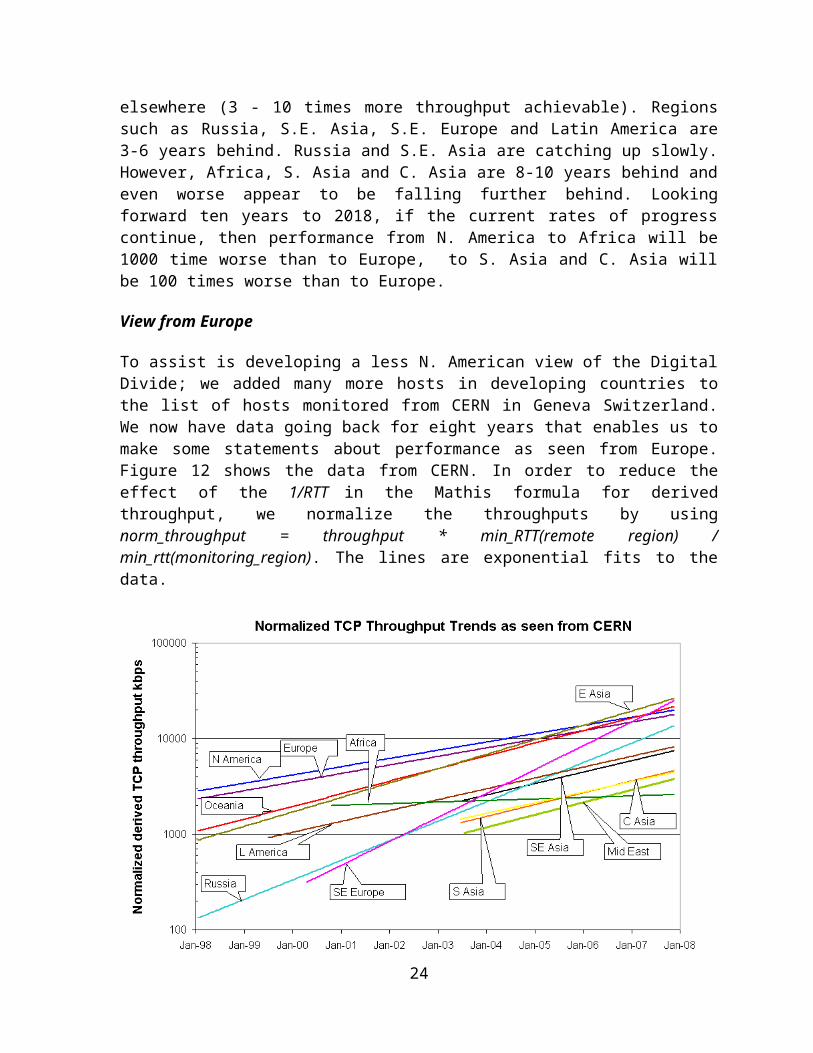
It can be seen that links between the more developed regions including N. America, Japan and Europe are much better than elsewhere (3 - 10 times more throughput achievable). Regions such as Russia, S.E. Asia, S.E. Europe and Latin America are 3-6 years behind. Russia and S.E. Asia are catching up slowly. However, Africa, S. Asia and C. Asia are 8-10 years behind and even worse appear to be falling further behind. Looking forward ten years to 2018, if the current rates of progress continue, then performance from N. America to Africa will be 1000 time worse than to Europe, to S. Asia and C. Asia will be 100 times worse than to Europe.
View from Europe
To assist is developing a less N. American view of the Digital Divide; we added many more hosts in developing countries to the list of hosts monitored from CERN in Geneva Switzerland. We now have data going back for eight years that enables us to make some statements about performance as seen from Europe. Figure 12 shows the data from CERN. In order to reduce the effect of the 1/RTT in the Mathis formula for derived throughput, we normalize the throughputs by using norm_throughput = throughput * min_RTT(remote region) / min_rtt(monitoring_region). The lines are exponential fits to the data.
19

Figure 12 : Derived throughputs to various regions as seen from CERN. The open square points are the monthly averages for E. Asia and the plus signs (+) are for N. America.
The slow increases for North America and Europe are partially an artifact of the difficulty of accurately measuring loss with a relatively small number of pings (14,400 pings/month at 10 pings/30 minute interval, i.e. a loss of one packet ~ 1/10,000 loss rate). Looking at the data points one can see that the East Asian trend crossing Europe and North America is mainly a result of East Asia starting from a lower throughput which gives a steeper slope to its trendline. Looking at the data points they are seen to overlap for the last two years. Russia, S. E. Europe (Balkans) and Oceania are catching up with Europe, East Asia and North America; the Middle East, Central Asia, Latin America and S. E. Asia are falling behind. Africa on the other hand is falling behind.
Yearly Throughput Trends
The exponential trendline fits to the monthly averages, though useful for guiding the eye and showing long term trends, can hide changes such as network upgrades etc. which tend to happen in a stepwise fashion. To better visualize such major changes in performance we added the capability to average the data into yearly intervals. This is shown in Figure 13 where the data is normalized [normal] as in Figure 12 and there is one point/year. The lines simply are to assist the eye and are smoothed lines to join the points. By comparing with Figure 11, it can be seen that there are several instances of step changes in performance hidden in Figure 11. In particular note the improved performance as parts of Latin America moved from satellite to fibre in 2001, and the impact of the ESnet routing E. Asian (in particular Japanese academic and research networks) to the US via New York in 1999 and 2000.
20

Figure 13 : Yearly averaged normalized derived TCP throughputs from the US to various regions of the world.
Variability of performance between and within regions
The throughput results, so far presented in this report, have been measured from North America or to a lesser extent from Europe. This is partially since there is more data for a longer period available for the North America monitoring hosts. Table 4 shows the throughputs seen between monitoring and remote/monitored hosts in the major regions of the world. Each column is for monitoring hosts in a given region, each row is for monitored hosts in a given region. The cells are colored according to the median quality for the monitoring region/monitored region pair. White is for derived throughputs > 5000 kbits/s (good), blue for <= 5000 kbits/s and >1000kbits/s (acceptable), yellow for <= 100kbits/s and > 500 kbits/s, orange for <= 500kbits/s (very poor to bad), and magenta for no measurements. The table is column ordered by decreasing median performance. The Monitoring countries are identified by the Internet two-character Top Level Domain (TLD). Just for the record CH=Switzerland, DE=Denmark, HU=Hungary, CA=Canada, RU=Russia, JP=Japan, BR=Brazil, BO=Bolivia, IN=India, PK=Pakistan and ZA=South Africa. S. Asia is the Indian sub-continent; S.E. Asia is composed of measurements to Indonesia, Malaysia, Singapore, Thailand and Vietnam.
21

Table 4: Derived throughputs in kbits/s from monitoring hosts to monitored hosts by region of the world for December 2007
As expected it can be seen that within regions (the circled cells) performance is generally better than between regions. Also performance is better between closely located regions such as Europe and S. E. Europe, Russia and E. Asia (the Russian monitoring site is in Novosibirsk).
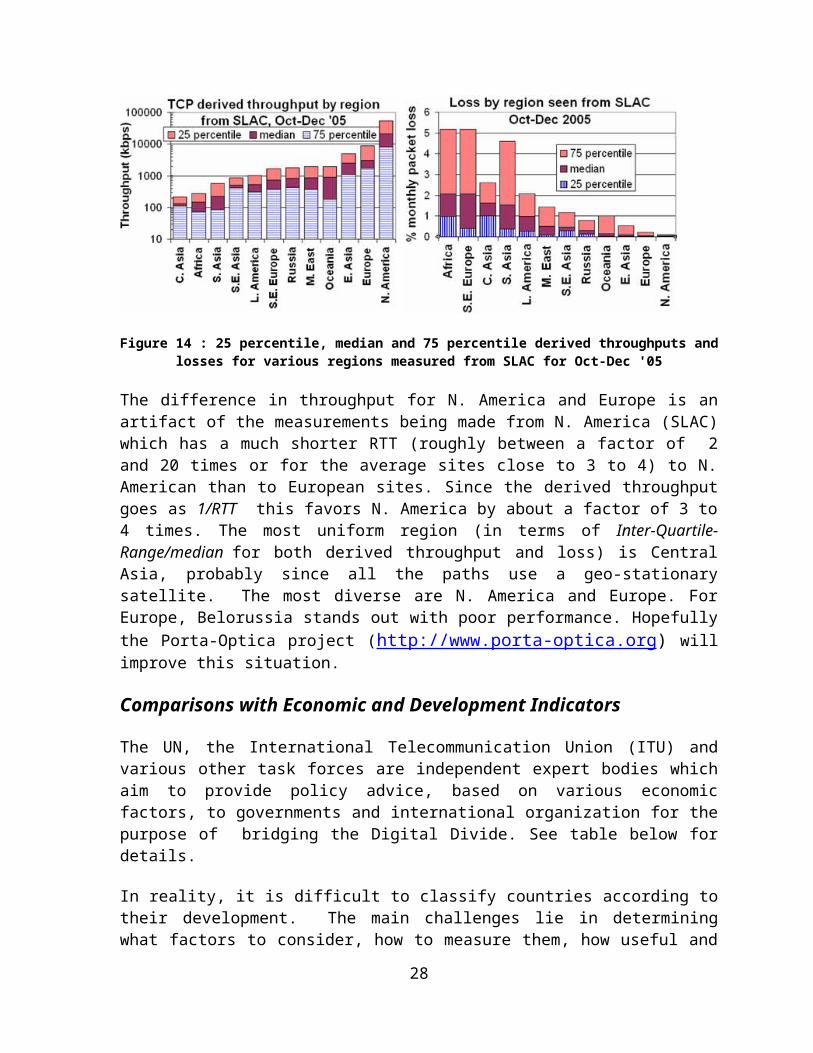
To provide further insight into the variability in performance for various regions of the world seen from SLAC, Figure 14 shows various statistical measures of the losses and derived throughputs. The regions are sorted by the median of the measurement type displayed. Note the throughput graph uses a log y-scale to enable one to see the regions with poor throughput. The countries comprising a region can be seen in Figure 2.
Figure 14 : 25 percentile, median and 75 percentile derived throughputs and losses for various regions measured from SLAC for Oct-Dec '05
The difference in throughput for N. America and Europe is an artifact of the measurements being made from N. America (SLAC) which has a much shorter RTT (roughly between a factor of 2 and 20 times or for the average sites close to 3 to 4) to N. American than to European sites. Since the derived throughput goes as 1/RTT this favors N. America by about
22
a factor of 3 to 4 times. The most uniform region (in terms of Inter-Quartile-Range/median for both derived throughput and loss) is Central Asia, probably since all the paths use a geo-stationary satellite. The most diverse are N. America and Europe. For Europe, Belorussia stands out with poor performance. Hopefully the Porta-Optica project (http://www.porta-optica.org) will improve this situation.
Comparisons with Economic and Development Indicators
The UN, the International Telecommunication Union (ITU) and various other task forces are independent expert bodies which aim to provide policy advice, based on various economic factors, to governments and international organization for the purpose of bridging the Digital Divide. See table below for details.
In reality, it is difficult to classify countries according to their development. The main challenges lie in determining what factors to consider, how to measure them, how useful and pervasive they are, how well defined they are and making them unique for every country. Various organizations such as the ITU, UNDP, CIA, World Bank etc. have come up with Indices based on measured items such as life expectancy, GDP, literacy, phone lines, Internet penetration etc. Although many of the above challenges are not insurmountable they can require a lot of cost and time. Thus, most of these measurements are outdated and hence do not depict the current position of the country.
One of the most important factors determining the economic development of a country in today’s information age is its Internet connectivity. Thus we may expect moderate to strong correlations between the economy and development of a country with its Internet performance measurement. The significance of also using PingER’s Internet measurements to characterize a country’s development is due to the fact that its data is current (up-to date) and covers most of the countries of the world. The following table shows the most commonly used indices categorized by organizations which produce them, the number of countries covered and date of the latest data..
Table 5: Economic and development indicatorsAbbreviation Name Organization No of
countriesDate of Data
GDP Gross Domestic Product per capita
CIA 229
2001-2006
HDI Human Development Index
UNDP 175 2004
DAI Digital Access Index ITU 180
1995-2003
NRI Network Readiness Index
World Economic Forum 120
2007
TAI Technology Achievement Index
UNDP 72 1995-2000
23
DOI Digital Opportunity Index
ITU 180 2004-2005
OI Opportunity Index
ITU 139 1996-2003
CPI Corruption Perception Index
Transparency Organization 180
2007
From this list of indices we selected the HDI and DOI for further analysis and comparisons with PingER measurements because they are enriched with most of the important factors, cover a large number of countries and are reasonably up-to-date.
Human Development Index (HDI):
The UNDP Human Development Indicator (HDI) (see http://hdr.undp.org/reports/global/2002/en/) measures the average achievements in a country in three basic dimensions of human development:
A long and healthy life, as measured by life expectancy at birth Knowledge, as measured by the adult literacy rate (with two-thirds weight) and the
combined primary, secondary and tertiary education gross enrollment ratio (with one-third weight)
A decent standard of living, as measured by GDP per capita (or Purchasing Power Parity (PPP) in US$).
Figure 15 shows a scatter plot of the HDI versus the PingER Derived Throughput for July 2006. Each point is colored according to the country’s region. A logarithmic fit is also shown. Logarithmic is probably appropriate since Internet performance is increasing exponentially with time and the differences between the countries can be related to number of years they are behind the developing countries, while human development is more linear. Since the PingER Derived TCP Throughput is linearly inversely proportional to RTT, countries close to the U.S. (i.e. the U.S., Canada and Central America) may be expected to have elevated throughputs compared to their HDI. We thus do not plot or use these countries in the correlation fit between the HDI and throughput. It is seen that there is a strong correlation (R2 > 0.6, see [an96]) between the HDI and throughput. As expected countries in Africa generally occupy the lower values in x and y, and European countries together with Australia, New Zealand, Korea and Japan occupy the higher values of x and y.
24

Figure 15 : Comparison of PingER derived throughputs seen from N. America to various countries and regions versus the U.N. Development Program (UNDP) Human Development Indicator (HDI).
The Digital Opportunity Index (DOI):
Digital Opportunity Index is a comprehensive metric made up of a composite of 11 core indicators which aims to track progress made in infrastructure, opportunity and utilization. If we correlate the PingER performance measurements (jitter, loss and throughput) with ITU’s indices we get moderate to strong correlations. Moderate to strong correlations3 are obtained with the DOI and other development indices (not shown here) that are more technology or Internet related. The Following table summarizes the R2 values which are for the correlations of pingER measurements with DOI and GDP/cap.
Table 6: R2 values on correlations between PingER data vs. DOI and GDP/capJitter (ms) Loss (%) Derived TCP
Throughput UnreachabilityDOI 0.58 0.64 0.67 0.37GDP/capita 0.61 0.53 0.59 0.35
The scatterplot in the Figure 16shows the correlation of PingER throughput versus DOI.
3 The interpretation of correlations by statisticians is explained as 0 relates to “no correlation”; a correlation between 0 and 0.3 as “weak”; a correlation between 0.3 and 0.6 as “moderate”; a correlation between 0.6 and 1.0 as “strong”; and a correlation of 1 as “perfect”[an06].
25
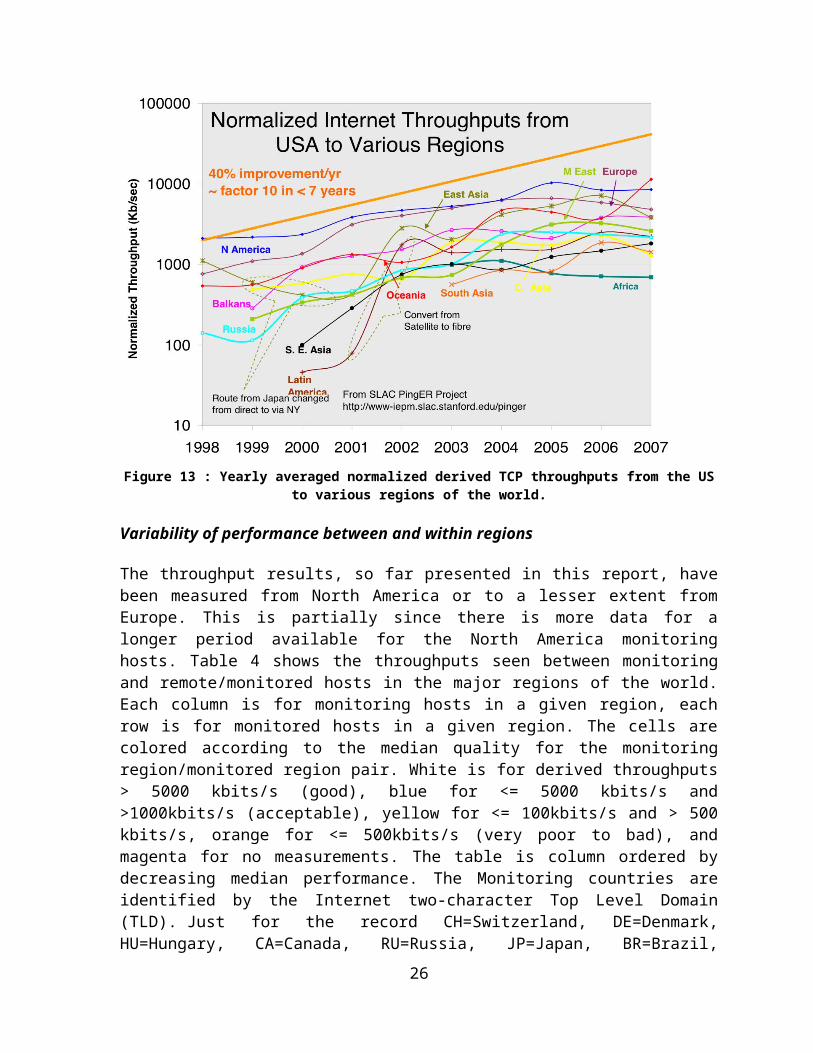
Figure 16: Normalized throughput vs. Digital Opportunity Index
Case StudiesPingER can help in establishing comprehensive analysis of poor internet connection at any region./country which can help to eliminate/pin point problems and hence can lead to improving bandwidth in that region. Some of our recent work is shown below in different case studies.
NIIT Case Study
With NIIT being an important collaborator with SLAC, Caltech and CERN, we prepared a small case study with three PingER monitoring sites in Pakistan to provide a brief overview and a measure of the issues at NIIT in particular and Pakistan in general. This case study actually summarizes the work we carried out at NIIT. For details please visit the details in last year’s report.
The PingER project worked with NTC (National Telecommunication Corporation), which is the national telecommunication carrier to install a PingER monitoring site at NTC headquarters in Islamabad. The other two monitoring hosts were at NIIT, one of the hosts uses NTC/PERN to provide external connectivity at 1-1.5Mbits/s, the second uses Micronet, a commercial network with a 512kbits/s connection to NIIT. We analyzed the data to compare the results from the three monitoring hosts to a common set of sites in Pakistan, for seven weeks, from 7th Dec 2005 thru 28th Jan 06.
The minimum RTT from NTC is about 5ms versus about 10-12 ms from NIIT via NTC/PERN. From NIIT via Micronet the minimum RTT is closer to 60ms. This may be partially due to slower backbone links (it takes longer to clock the packets onto the network
26

links) and different routes. Looking at the average RTT results there is a lot of variability, typically ranging from 150-400ms for the NIIT NTC/PERN host and 80-180ms for the NIIT Micronet host, and the data points for each remote host track one another closely. This indicates a common point of congestion. The results also revealed that the hosts in NIIT have poorer and variable RTT’s than results from NTC which indicated that congestion is located close to or at the NIIT site.
It appears that the NTC has an un-congested infrastructure and the minimum RTT from NTC to the PERN connected institutes is good. Adding another hop, the minimum RTT from NIIT being slightly higher is also understandable. However, the minimum RTT for the Micronet link suggests that the traffic, even if going to the same city adds around 45-50 ms to the RTT value. It also appears that the NIIT default link via NTC/PERN is heavily congested. Recent attempts to upgrade the link from 1 to 1.5Mbits/s have met with limited success.
International connectivity for Pakistan is extremely fragile with inadequate backup for the only fibre link (at least until recently). There are steps which the government of Pakistan is already taking that include laying of a new submarine, SEASMEW-4, which should help in providing better connectivity and bandwidth.
PERN has been fairly active in upgrading its infrastructure. Efforts to shift from copper to fiber over the last mile are underway [Pernprop], however, in order to catch up with the rest of the world, the pace of development needs to be more aggressive.
South Asia Case Study
South Asia, being one of the rapidly developing regions, became an obvious focus for PingER for the purpose of quantifying the digital divide. In this case study we compare the network connectivity of South Asia with the rest of the world, network routing within South Asian countries, Mean Opinion Score (MOS)4 of South Asian Countries and the current status of the Network
South Asia as Compared to the rest of the World Regions
The World Internet Statistics [wis] shows that developed nations (US, Europe, New Zealand and Australia) comprise 40% of total internet users while South Asia only has about 5%. Based on packet loss, the region has the worst connectivity after Africa (see Figure 6 earlier in this report). Since losses are usually dependent on last-mile connections they are fairly distance independent so no attempt has been made to normalize the data for distance. It is seen that the world divides into two major super regions: N. America, Europe, E. Asia and Oceania with losses below 0.1%, and Latin America, C. Asia, Russia, S.E. Asia, S. Asia and Africa with losses > 0.1% and as high as a few percent. In general, the packet losses have declined by almost 25% each year. However the progress for Africa and South Asia has been much slower.
4 In multimedia (audio, voice telephony, or video) especially when codecs are used to compress the bandwidth requirements the (MOS) provides a numerical indication of the perceived quality of received media after compression and/or transmission. The MOS ranges from 1 to 5, where 1 is lowest perceived quality, and 5 is the highest perceived quality.
27
Routing Within South Asian CountriesWe have PingER monitoring stations in India, Pakistan and Sri Lanka. Reverse traceroute [Traceroute] servers are deployed at PingER monitoring stations which helps us understand how India and Pakistan are connected with different countries of South Asia. India's VSNL provides Internet Service to Nepal and Bhutan. In the case of Bhutan it first goes from India to Hong Kong, then returns to India and then eventually goes to Bhutan .Afghanistan is served by a satellite provider from DESY, Hamburg, Germany (part of the Silk Road project), so the traffic goes to Germany via satellite and then is beamed back to Afghanistan. Between sites in Pakistan or between sites in India traffic goes relatively directly without leaving the country. Figure 17 shows a map of routing as seen from India to other South Asian Countries.
Figure 17: Routing as seen from Pakistan/India to other South Asian CountriesThe traffic between India and Pakistan going via the US and the UK raises serious concerns as it increases the International costs, the RTTs, and reduces throughput. This problem could be overcome if both countries agree to make Internet eXchange Points (IXPs).
MOS (Mean Opinion Score)The telecommunications industry uses the Mean Opinion Score (MOS) [3] as a voice quality metric. The values of the MOS are: 1=bad; 2=poor; 3=fair; 4=good; 5=excellent. A typical reasonable range for Voice over IP (VoIP) is 3.5 to 4.2. There are three factors that significantly impact call quality: latency, packet loss, and jitter. We calculate the jitter using the Inter Packet Delay Variability (IPDV) [mos] .
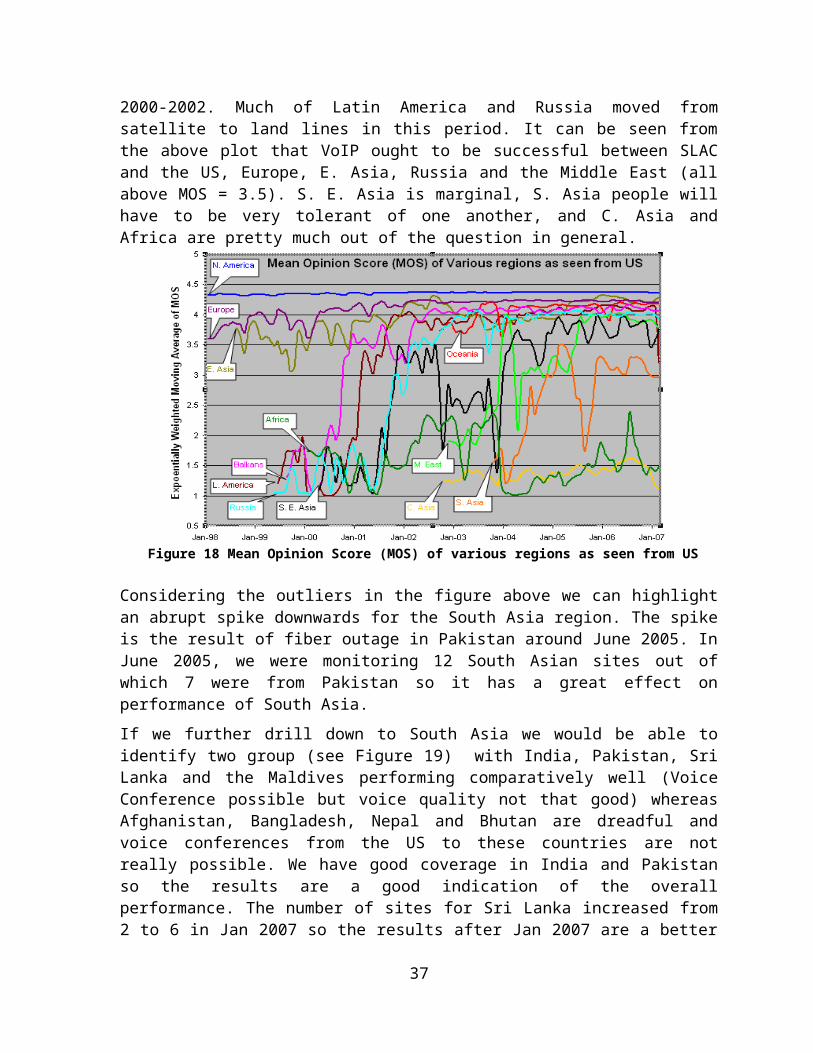
Figure 18 shows the MOS of various regions seen from US. It is seen that Russia and Latin America improved dramatically in 2000-2002. Much of Latin America and Russia moved from satellite to land lines in this period. It can be seen from the above plot that VoIP ought to be successful between SLAC and the US, Europe, E. Asia, Russia and the Middle East (all above MOS = 3.5). S. E. Asia is marginal, S. Asia people will have to be very tolerant of one another, and C. Asia and Africa are pretty much out of the question in general.
28

Figure 18 Mean Opinion Score (MOS) of various regions as seen from US
Considering the outliers in the figure above we can highlight an abrupt spike downwards for the South Asia region. The spike is the result of fiber outage in Pakistan around June 2005. In June 2005, we were monitoring 12 South Asian sites out of which 7 were from Pakistan so it has a great effect on performance of South Asia.
If we further drill down to South Asia we would be able to identify two group (see Figure 19) with India, Pakistan, Sri Lanka and the Maldives performing comparatively well (Voice Conference possible but voice quality not that good) whereas Afghanistan, Bangladesh, Nepal and Bhutan are dreadful and voice conferences from the US to these countries are not really possible. We have good coverage in India and Pakistan so the results are a good indication of the overall performance. The number of sites for Sri Lanka increased from 2 to 6 in Jan 2007 so the results after Jan 2007 are a better indication of the overall performance for Sri Lanka. Before Jan 2007 we were monitoring one host in Sri Lanka (University of Peradeniya) that was performing very badly with average RTT > 500 ms and losses of 3-8%. Since then we have added several nodes with improved performance, in particular one at the Lanka Education and Research Network (LEARN) which has good to excellent packet loss and RTTs (from SLAC) of around 300ms. Afghanistan is stuck with satellite connectivity and the land locked countries of Nepal and Bhutan have limited fiber connectivity, so they mostly lie at the bottom.
29
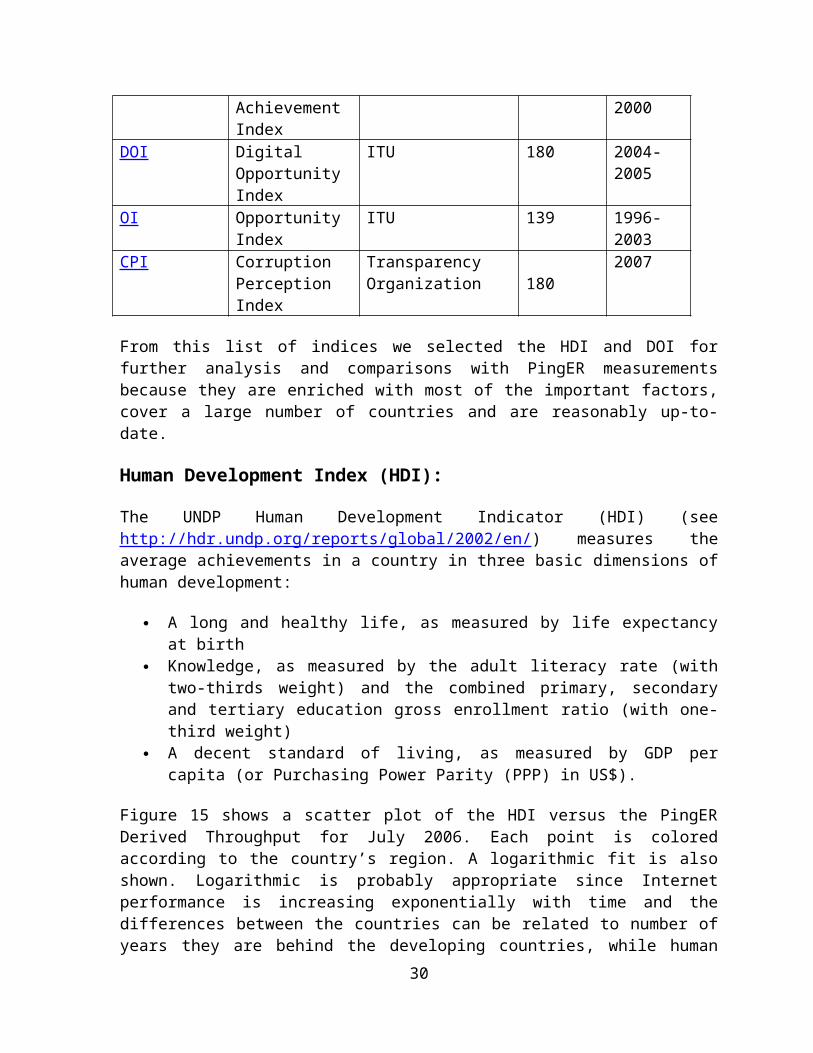
Figure 19 : Mean Opinion Score (MOS) to South Asian Countries as seen from US
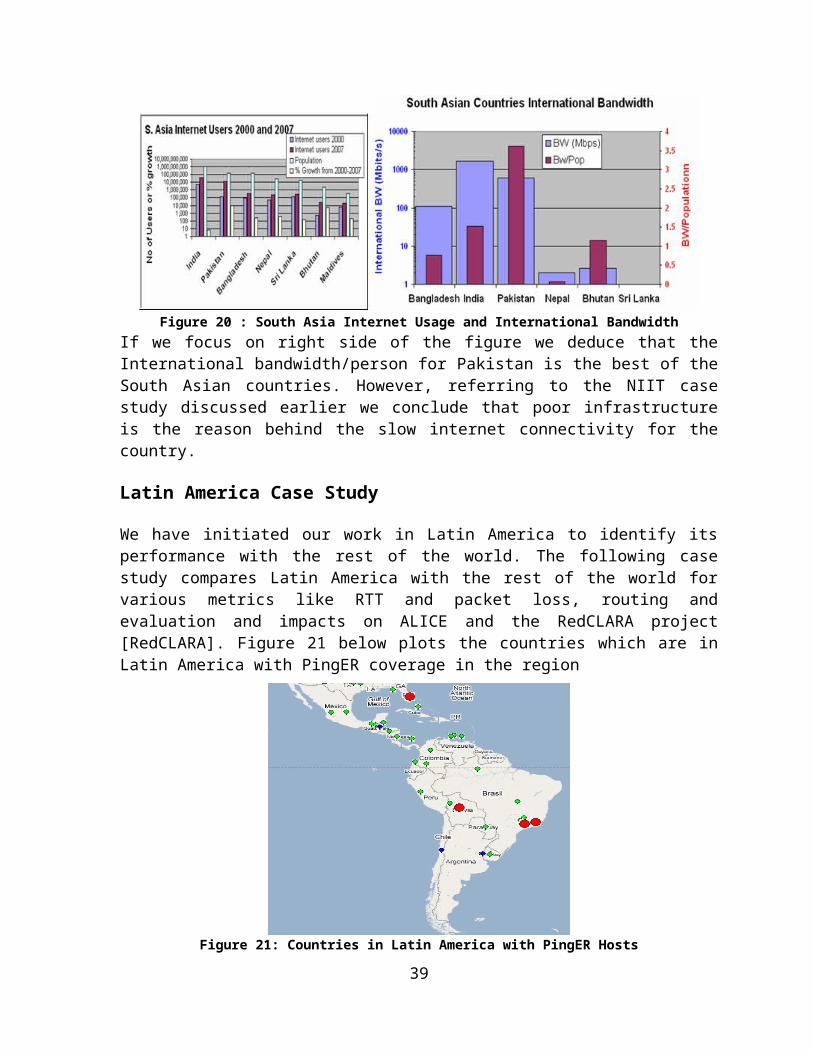
Internet Usage and Bandwidth Allocation for South AsiaBesides the poor connectivity to the world Internet, usage in the South Asian region is increasing at a rapid rate. The left-hand side of the Figure below summarizes the Asia Internet Usage and Population Stats. For 2007, the growth in Internet users from 2000-2007 was 700% for India and 8,862% for Pakistan.
Figure 20 : South Asia Internet Usage and International BandwidthIf we focus on right side of the figure we deduce that the International bandwidth/person for Pakistan is the best of the South Asian countries. However, referring to the NIIT case study discussed earlier we conclude that poor infrastructure is the reason behind the slow internet connectivity for the country.
Latin America Case Study
We have initiated our work in Latin America to identify its performance with the rest of the world. The following case study compares Latin America with the rest of the world for various metrics like RTT and packet loss, routing and evaluation and impacts on ALICE and the RedCLARA project [RedCLARA]. Figure 21 below plots the countries which are in Latin America with PingER coverage in the region
30
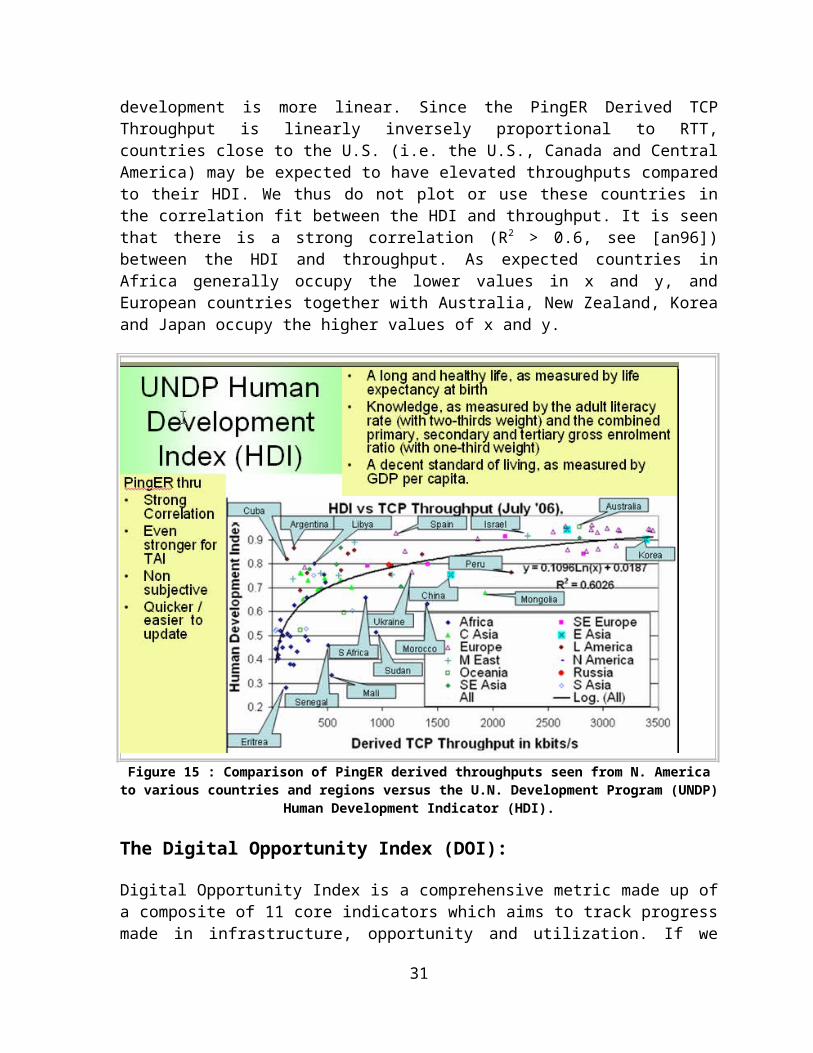
Figure 21: Countries in Latin America with PingER Hosts
PingER nodes which are shown in red above are monitoring nodes, sites which are monitored by all monitoring hosts (these are referred to as beacon sites and also include monitor sites) are shown in blue, and other monitored remote sites are shown in green
Minimum RTT and Packet LossWe determine the status of Internet connectivity of Latin America compared with the rest of the world using RTT and loss.
Figure 22 : Min RTT from US to Latin AmericaIn Figure 22, we can clearly identify that Argentina, Chile and Uruguay have substantially poorer connectivity to the US than Brazil and Central America, and Cuba has bad connectivity.
31

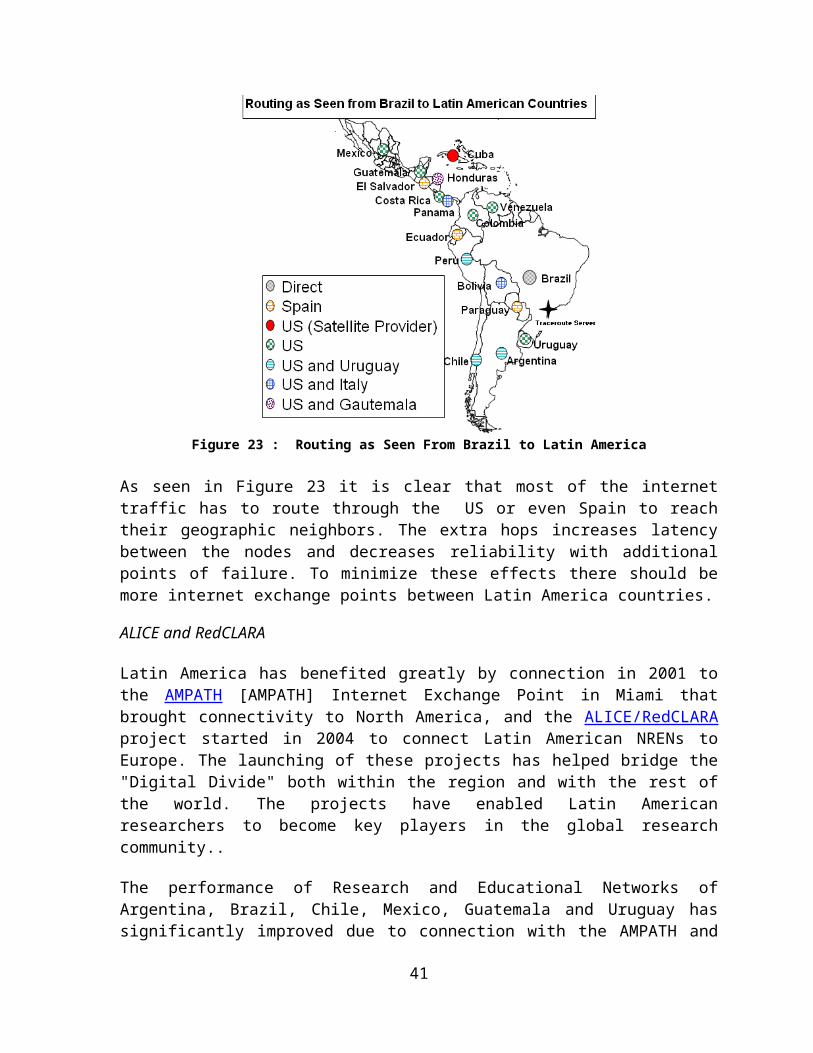
Routing As Seen From Brazil
Figure 23 : Routing as Seen From Brazil to Latin America
As seen in Figure 23 it is clear that most of the internet traffic has to route through the US or even Spain to reach their geographic neighbors. The extra hops increases latency between the nodes and decreases reliability with additional points of failure. To minimize these effects there should be more internet exchange points between Latin America countries.
ALICE and RedCLARA
Latin America has benefited greatly by connection in 2001 to the AMPATH [AMPATH] Internet Exchange Point in Miami that brought connectivity to North America, and the ALICE/RedCLARA project started in 2004 to connect Latin American NRENs to Europe. The launching of these projects has helped bridge the "Digital Divide" both within the region and with the rest of the world. The projects have enabled Latin American researchers to become key players in the global research community..
The performance of Research and Educational Networks of Argentina, Brazil, Chile, Mexico, Guatemala and Uruguay has significantly improved due to connection with the AMPATH and the ALICE/RedCLARA project. See the graphs at http://confluence.slac.stanford.edu/display/IEPM/Latin+America+Case+Study for the country details, which we now summarize:
In December 2001, Argentina's (RETINA) connected to AMPATH, so the increase in performance to Argentina can be seen from the US. Around June 2006, the TCP throughput of Argentina increased significantly. Before this only one host was
32

monitored in Argentina. The minimum RTT for this host did not change significantly and the newly added host(s) had similar minimum RTT(s). The average RTT reduced from 600 ms to 200 ms. Between May 2006 and Sep 2006 the packet loss dropped from 2% to 1% and the average RTT for the first host dropped from 600ms to 350ms. Thus though the new hosts had somewhat better performance than the first, the improved throughput affected all hosts.
From January 2001 - July 2001 the loss from US to Brazil decreased from 8 % to 1 %. The Average RTT decreased from 375 ms to 200 ms. The TCP throughput improved but it has not stabilized (still lots of variations).
In June 2001, Chile's REUNA became the first Latin American NREN (National Research and Educational Network) to get connected to the AMPATH POP in Miami. As a result the TCP throughput increased significantly. Minimum RTT reduced from 230 ms to 200 ms and average RTT reduced from 725 ms to 250ms. Packet loss reduced from 10 % to 1 %.
In July 2003 Mexico's connectivity improved. Minimum RTT became stable from 100 ms to 60 ms and average RTT also became stable. Since Uruguay joined in June, 2005 its TCP throughput has improved. Average RTT reduced from about 325 ms to 225 ms. Minimum RTT reduced from about 270 ms to 220 ms The loss situation has not seen much improvement.
In the beginning of 2006 Paraguay moved from satellite to fiber but Cuba is still connected through satellite. Average and min RTT of Cuba are greater than 800ms and the packet loss is around 2-4 % which is dreadful. RedCLARA is also planning for a connection to Cuba in the near future, so that it can also play role in global research initiatives.
Case Study for Africa
In August, 2005, with the assistance of the South African Tertiary Education Network (TENET), we deployed a monitoring node in South Africa to get a view of Africa from within Africa. Since then we are actively monitoring and presenting issues related to Sub-Saharan Africa in various conferences. In this case study we discuss the status of African Internet performance and coverage and comparison of the PingER metrics for Africa with the rest of the world. Many parts of this region suffer from severe disadvantages including lack of electricity, education/skills, disease, protectionist policies, unemployment, poverty and corruption. At the same time, the percentage of the population using the Internet in Africa is only 3.6% [worldstats], which is almost three times lower than any other region.
Internet usage and coverage for Africa is also not very promising. Figure 24 illustrates the number of Internet connections per city worldwide, it is seen that most of the Africa is black which shows poor coverage of the Internet in this region. This is due to many reasons which include low international bandwidth capacity, cost of bandwidth and growth in number of users. All of these parameters are low because there is only one fiber connection in the region – most of the traffic goes via high-cost (300-1000 times the cost/Mbits/s of landline connections) long-latency (>400 ms) satellite links.
33

Figure 24 : World Internet Connection Density and Internet subscribers. The rapid growth of Mobile phones (bottom left corner of right hand figure) suggest that integration of the Internet and Mobile
phones may be an effective way of extending Internet coverage.
PingER and Internet Performance in AfricaFigure 6 gives us the idea about the losses. Africa has the highest packet loss percentage compared with the rest of the world. The trend line for regions shows that improvement in other countries is quite rapid but in the case of Africa it is almost static and improvement is very slow.
We use Mathis’ formula to calculate throughput for various regions. Figure 11 gives a brief overview of different regions. Figure 25 shows a scattered plot of PingER throughput and International bandwidth.
Figure 25: Throughput vs Intl Bandwidth
34

The figure clearly highlights poor throughput for majority regions of Africa as compared to regions in America and Europe. Other than poor connectivity one major factor for the low throughput is the low international bandwidth for the region, which is very poor for most of the countries in Africa. There exists a strong correlation (R2 ~ 0.59) between throughput and international bandwidth that can be seen in Figure 25.
We have already mentioned the UN HDI and its importance in the beginning of the report. Now we compare it with throughput and population size to analyze its impact on various countries in Africa and compare with other countries in the Mediterranean region. Figure 26 shows a scatter plot of UN HDI and throughput
Figure 26 Throughput vs. UN Human Development Index
The results indicate that the performance for most of Africa is far worse than other Mediterranean countries. It is also apparent that the performance for North Africa is several times better than the rest of Africa and East Africa is an order of magnitude worse than Southern Europe.
Figure 27 gives an overview of the normalized derived PingER throughput for Africa where one can see the overall throughput performance is poor to bad. Once again, it is evident that N. Africa is several times better off than the rest of Africa. E. Africa is poor, limited by its satellite access. For W. Africa there are big differences, some such as Senegal can afford SAT3 fibre while others use satellite. There is great diversity between and within regions; there is a factor of 10 difference between Angola and Libya. For the major African regions N Africa is the best, and E Africa the worst.
35

Figure 27 : Throughput for African sub-regions
Considering the poor MOS values for Africa, seen in Figure 18, the Internet availability and performance seen in Figure 24, and the continued use of satellites seen in Figure 10, it is apparent that applications such as VoIP will be poor to unavailable/unusable for most African countries.
Serious efforts are required to shift from satellite to fiber connectivity, to reduce the high latency connections, and to enable cheaper bandwidth costs. However, Africa has a huge potential, containing 14% of the world population, and its use of the Internet is growing more rapidly there than any other region of the world (626% between 2000 and 2006). For more on Africa see Connectivity Mapping in Africa [ictp-jensen], African Internet Connectivity [africa] and Internet Performance to Africa [ejds-africa]).
High Performance Network Monitoring
IEPM-BW Results
The PingER method of measuring throughput breaks down for high speed networks due to the different nature of packet loss for ping compared to TCP, and also since PingER only measures about 14,400 pings of a given size/month between a given monitoring host/monitored host pair. Thus if the link has a loss rate of better than 1/14400 the loss measurements will be inaccurate. For a 100Byte packet, this is equivalent to a Bit Error Rate (BER) of 1 in 108, and leading networks are typically better than this today For example if the loss probability is < 1/14400 then we take the loss as being 0.5 packet to avoid a division by zero, so if the average RTT for ESnet is 50msec then the maximum throughput we can use
36
PingER data to predict is ~ 1460Bytes*8bits/(0.050sec*sqrt(0.5/14400)) or ~ 40Mbits/s and for an RTT of 200ms this reduces to 10Mbits/s.
To address this challenge and to understand and provide monitoring of high performance throughput between major sites of interest to HEP and the Grid, we developed the IEPM-BW monitoring infrastructure and toolkit. There are about 5 major monitoring hosts and about 50 monitored hosts in 9 countries (CA, CH, CZ, FR, IT, JP, NL, UK, US). Both application (file copy and file transfer), TCP throughputs, available bandwidth, RTT, losses and traceroutes are measured.
These measurements indicate that throughputs of one to many Gbits/s are regularly achievable on today's production academic and research networks, using common off the shelf hardware, standard network drivers, TCP stacks etc., standard packet sizes etc. Achieving these levels of throughput requires care in choosing the right configuration parameters. These include large TCP buffers and windows, multiple parallel streams, sufficiently powerful multi-core cpus (typically better than 2 GHz), fast enough interfaces and busses, and a fast enough link (> 1 to 10 Gbits/s) to the Internet. In fact sufficient progress has been made in the network tuning area that file operations (end-system I/O) are more typically the bottleneck. An increasing focus area for HEP is in tuning “end-to-end” with an emphasis on storage systems that are well designed and configured.
Though not strictly monitoring, there is currently much activity in understanding and improving the TCP stacks (e.g. [floyd], [low], [ravot]). In particular with high speed links (> 500Mbits/s) and long RTTs (e.g. trans-continental or trans-oceanic) today's standard TCP stacks respond poorly to congestion (back off too quickly and recover too slowly). To partially overcome this one can use multiple streams or in a few special cases large (>> 1500Bytes, sometimes call jumbo grams) packets. In addition new applications ([bbcp], [bbftp], [gridftp], [FDT]) are being developed to allow use of larger windows, targeted threads and multiple streams as well as non TCP strategies ([tsnami], [udt]). Also there is work to understand how to improve the operating system configurations [os] and kernel related tuning to improve the throughput performance. As it becomes increasingly possible to utilize more of the available bandwidth, more attention will need to be paid to fairness and the impact on other users (see for example [coccetti] and [bullot]). Besides ensuring the fairness of TCP itself, we may need to deploy and use quality of service techniques such as QBSS [qbss] or TCP stacks that back-off prematurely hence enabling others to utilize the available bandwidth better [kuzmanovic]. These subjects will be covered in more detail in the companion ICFA-SCIC Advanced Technologies Report. We note here that monitoring infrastructures such as IEPM-BW can be effectively used to measure and compare the performance of TCP stacks, measurement tools, applications and sub-components such as disk and file systems and operating systems in a real world environment.
New Monitoring and Diagnostic Efforts in HEP
PingER and IEPM-BW are excellent systems for monitoring the general health and capability of the existing networks used worldwide in HEP. However, we need additional end-to-end tools to provide individuals with the capability to quantify their network connectivity along
37

specific paths in the network and also easier to use top level navigation/drill-down tools. The former are needed to both ascertain the user's current network capability as well as to identify limitations which may be impeding the user’s ultimate (expected) network performance. The latter are needed to simplify finding the relevant data.
Most HEP users are not "network wizards" and don't wish to become one. In fact as pointed out by Mathis and illustrated in Error: Reference source not found, the gap in throughput between what a network wizard and a typical user can achieve is growing.
Figure 28: Bandwidth achievable by a network wizard and a typical user as a function of time. Also shown are some recent network throughput achievements in the HEP community.
Because of HEP's critical dependence upon networks to enable their global collaborations and grid computing environments, it is extremely important that more user specific tools be developed to support these physicists.
Efforts are underway in the HEP community, in conjunction with the Internet2 End-to-End (E2E) Performance Initiative [E2Epi], to develop and deploy a network measurement and diagnostic infrastructure which includes end hosts as test points along end-to-end paths in the network. The E2E piPEs project [PiPES], the NLANR/DAST Advisor project [Advisor] and the LISA (Localhost Information Service Agent) [LISA] are all working together to help develop an infrastructure capable of making on demand or scheduled measurements along specific network paths and storing test results and host details for future reference in a common data architecture. The perfSONAR project has become the organizing entity for these efforts during the last year (2007) and is broadly supported (see below). The perfSONAR effort is utilizing the GGF NMWG [NMWG] schema to provide portability for
38
the results. This information could be immediately used to identify common problems and provide solutions as well as to acquire a body of results useful for baselining various combinations of hardware, firmware and software to define expectations for end users.
More recent efforts are underway to insure commonality in both monitoring and provisioning of networks. The GLIF and DICE communities are both working toward implementing “managed” network services and the corresponding monitoring that will be needed to support their efforts. HEP (US LHCnet, the various HEP network research projects and the national labs) is working closely within these groups to insure our needs are being addressed.
A primary goal is to provide as "lightweight" a client component as possible to enable widespread deployment of such a system. The LISA Java Web Start client is one example of such a client, and another is the Network Diagnostic Tester (NDT) tool [NDT]. By using Java and Java Web Start, the most current testing client can be provided to end users as easily as opening a web page. The current NDT version supports both Linux and Windows clients and is being maintained by Rich Carlson of Internet2.
Details of how the data is collected, stored, discovered and queried are being worked out. A demonstration of a preliminary system was shown at the Internet2 Joint-techs meeting in Hawaii on January 25th, 2004.
The goal of easier-to-use top-level drill down navigation to the measurement data is being tackled by MonALISA [MonALISA] in collaboration with the IEPM project.
The US ATLAS collaboration has recently initiated an effort to improve the throughput of their Tier-1 and Tier-2 centers and has coupled this with active testing and monitoring to track performance over time. The “Load Test” TWiki page at http://www.usatlas.bnl.gov/twiki/bin/view/Admins/LoadTests has further details. The active monitoring effort is combing MonALISA and some customized scripts to create a tracking system for the Tier-1 to Tier-2 performance and separately tests the network, I/O and disk-to-disk performance to help locate where any problems might occur quickly. Details are available in these US ATLAS slides from Dantong Yu at http://indico.cern.ch/materialDisplay.py?contribId=25&materialId=slides&confId=22677. Example monitoring graphs are available at https://www.racf.bnl.gov/Facility/Monitor/tier2_dashboard.html.
LHC-OPN Monitoring
During the last two years there has been a concerted effort to deploy and monitor the central data distribution network for the Large Hadron Collider (LHC). This network, dubbed the LHC-OPN (Optical Private Network), has been created to primarily support data distribution from the CERN Tier-0 to the various Tier-1’s worldwide. In addition, traffic between Tier-1 sites is also allowed to traverse the OPN.
Given the central role this network will play in the distribution of data it is critical that this network and its performance be well monitored. A working group was convened in Fall of
39

2005 to study what type of monitoring might be appropriate for this network. A number of possible solutions were examined including MonALISA, IEPM-BW/Pinger, various EGEE working group efforts and perfSONAR.
By Spring of 2006 there was a consensus that LHC-OPN monitoring should build upon the perfSONAR effort which was already being deployed in some of the most important research networks. perfSONAR is a standardized framework for capturing and sharing monitoring information, other monitoring systems can be plugged into it with some interface “glue”.
During 2007 a newly created organization named the E2ECU (End to End Coordination Unit), operated by the GEANT2 NOC, started using perfSONAR tools to monitor the status of almost all the circuits in the LHCOPN.
DANTE has proposed a no-cost managed network measurement service to the LHCOPN community to perform significantly more robust measurement of the LHCOPN, including active latency & bandwidth tests, link utilization, etc all based on perfSONAR tools & protocols. This is still in the discussion stage as of this report.
Related HEP Network Research
There is also a significant amount of research around managed networks for HEP that is ongoing. There are efforts funded by the National Science Foundation (UltraLight) and Department of Energy (Terapaths, LambdaStation, OSCARS, PLaNetS and the proposed VINCI project) which are strongly based in HEP. These projects are not primarily focused upon monitoring but all have aspects of their efforts that do provide network information applications. Some of the existing monitoring discussed in previous sections are either came out of these efforts or are being further developed by them.
Comparison with HEP Needs
Previous studies of HEP needs, for example the TAN Report (http://gate.hep.anl.gov/lprice/TAN/Report/TAN-report-final.doc) have focused on communications between developed regions such as Europe and North America. In such reports packet loss less than 1%, vital for unimpeded interactive log-in, is assumed and attention is focused on bandwidth needs and the impact of low, but non-zero, packet loss on the ability to exploit high-bandwidth links. The PingER results show clearly that much of the world suffers packet loss impeding even very basic participation in HEP experiments and points to the need for urgent action.
The PingER throughput predictions based on the Mathis formula assume that throughput is mainly limited by packet loss. The 25% per year growth curve in Figure 11 is somewhat lower than the 79% per year growth in future needs that can be inferred from the tables in the TAN Report. True throughput measurements have not been in place for long enough to measure a growth trend. Nevertheless, the throughput measurements, and the trends in predicted throughput, indicate that current attention to HEP needs between developed regions could result in needs being met. In contrast, the measurements indicate that the throughput to
40
less developed regions is likely to continue to be well below that needed for full participation in future experiments.
Accomplishments since last report
We have extended the measurements to cover more developing countries and to increase the number of hosts monitored in each developing country. We have carefully evaluated the routes and minimum ping RTTs to verify that hosts are where they are identified to be in our database. As a result we have worked with contacts in relevant countries and sites to find alternatives, and about 20-30 hosts have been replaced by more appropriate hosts. In addition (see Table 6) since December of 2006, we have added a net of over 230 new remote hosts, and added 51 countries (Africa: BF, CD, CV, CI, DJ, GA, GM, GH, GW, LR, LY, MU, NA, SC, SL, SZ, TG, ZM; Balkans/S.E. Europe: BA, LV, MD; Central Asia: TM, Europe: AD, AT, BE, BG, CZ, FO, GI, LI, LU, SM, SE; Latin America: AN, BS, CO, CU, DO, NI; Middle East: AE, BH, OM, QA, SA; South East Asia: KH, LA, PH, TH; South Asia: AF, BT, MV). While ping blocking is still a big problem as many hosts start blocking over time, no countries were lost this year.
The collaboration between SLAC and the NIIT in Rawalpindi Pakistan was funded by the Pakistan Ministry of Science and Technology and the US Department of State for one year starting September 2004. The funding is for travel only. The collaboration has successfully developed and populated a new PingER configuration database to keep track of location (city, country, region, latitude/longitude), contacts, site name, affinity groups etc. This data is already being used to provide online maps such as Figure1. Work has also been completed on automating the process of generating graphs of performance aggregated by region
We still spend much time working with contacts to unblock pings to their sites (for example ~15% of hosts pingable in July 2003 were no longer pingable in December 2003), to identify the locations of hosts and to find new hosts/sites to monitor. It is unclear how cost-effective this activity is. It can take many emails to explain the situation, sometimes requiring restarting when the problem is passed to a more technically knowledgeable person. Even then there are several unsuccessful cases where even after many months of emails and the best of intentions the pings remain blocked. One specific case was for all university sites in Vietnam were blocked for ping.
Even finding knowledgeable contacts, explaining what is needed and following up to see if the recommended hosts are pingable, is quite labor intensive. To assist with this we have created a brochure for PingER describing its purposes, goals and requirements. More recently we have had some success by using Google to search for university web sites in specific TLDs and this year have automated this. The downside is that this way we do not have any contacts with specific people with whom we can deal in case of problems.
Efforts to Improve PingER ManagementWith the increase in the monitoring data of PingER, we initiated efforts to develop supporting systems for better management and installation of PingER. In all, several major initiatives have been taken, which are summarized below:
41

TULIP- IP Locator Using Triangulation
With the growth in the coverage of PingER arises the great difficulty of keeping track of the changes in the physical locations of the monitored sites. This might lead to mis-leading conclusions, for instance our sole monitoring node in Sweden had a minimum RTT of 59ms from SLAC. This is not possible as a node deployed at the East Coast in USA has a minimum RTT value greater than 70 ms. Moreover, many nodes in the developing region often change their geographical locations for a variety of reasons. In order to detect and track changes in the physical locations of nodes, the PingER team launched a task to build a tool to give the latitude and longitude for a given IP address or URL. This tool will then be used to identify hosts whose located position is in conflict with the PingER database latitude and longitude by comparing the minimum RTT with that predicted from distance between the monitor and remote sites and making traceroute measurements to further vindicate the results. Anomalies will be reported so the PingER database can be corrected using values from the locator tool and/or new hosts can be chosen to be monitored.
The location of an IP address is being determined using the minimum RTT measured from multiple “landmark” sites at known locations, and triangulating the results to obtain an approximate location. The basic application, prototype deployed at http://www.slac.stanford.edu/comp/net/wan-mon/tulip/ is a java based jnlp application that takes RTT measurements from landmarks to a selected target host (typically at an unknown location) specified by the user and figures out the latitudes and longitudes of the target host. The application is under-development and its algorithm and the provision of landmark sites under constant improvement to make the process reasonably accurate.
TULIP (IP Locator Using Triangulation) will also utilize the historical min-RTT PingER data in order to verify the locations of hosts/sites recorded in the PingER configuration database, and to optimize the choices of parameters used by TULIP.
PingER Host Searching Tool
Increasing the coverage of PingER in developing countries has been difficult historically because it is hard to find hosts which are geographically located within those countries and do not block pings. PingER host searching tool is an attempt to solve this problem. It completely automates the process of searching for hosts for monitoring within a country by doing the following:
1. It downloads the search results for the required country from Google using its TLD(Top Level Domain).
2. Using regular expressions and pattern matching it searches for hostnames in the results.
3. After compiling a list of unique hostnames, it pings each hostname in turn and filters out those which block pings.
4. Finally it checks the hosts in the filtered list on GeoIptool (http://www.geoiptool.com), further sorting out the hosts which are not geographically located in the target country. It was found that Geoiptool geo-locates hosts with a high degree of accuracy.
5. After going thorough the above steps the tool reports the final filtered list of hosts which are candidates for monitoring in the required country.
42
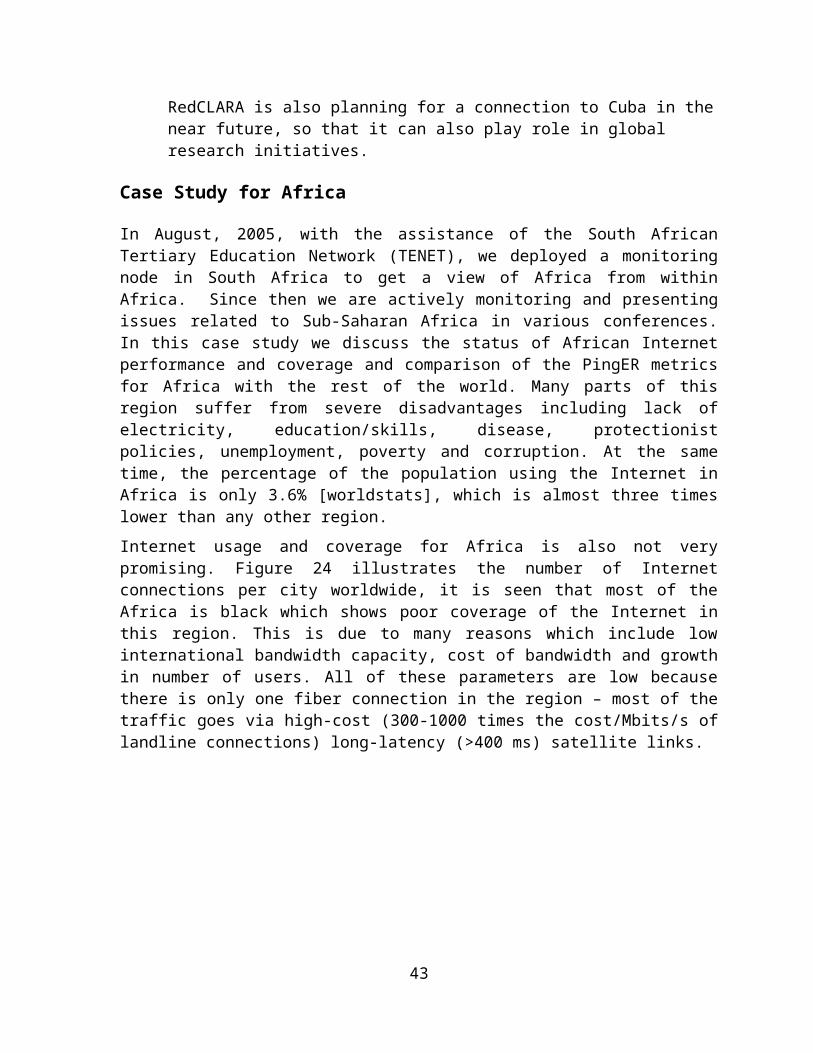
It was very helpful in improving the coverage of PingER in Africa where we now have 101 monitored hosts in 45 countries. The tool allowed us to efficiently find more hosts in the rest of the world as well.
PingER Validation Toolkit
Since its inception, the size of the PingER project has grown to where it is now monitoring hosts in over 155 countries from about 42 monitoring hosts in 21 countries. With growth in the number of monitoring as well as monitored (remote) nodes, it was perceived that automated mechanisms need to be developed for managing this project. We therefore developed a tool that runs daily and reports on the following:
Database errors such as invalid or missing IP addresses, all hosts have an associated region, each host only appears once in the database, all hosts have a latitude and longitude, the names of the monitoring hosts match the labeling of the data gathered from the monitoring host, each host has a unique IP address.
The list of beacons are now generated from the database, as is the list of sites to be monitored
We ping all hosts, those not responding are tested to see if the exist (i.e. they do not respond to a name service request), whether they respond to any of the common TCP ports, if so they are marked as blocking pings. If they do not ping with the IP address we try the name in case the IP address has changed.
We track how long a host pair (monitor host/remote host) has not successfully pinged and whether the remote host is blocked.
We keep track of how long we have been unable to gather data from each monitoring host.
We also compare the minimum RTT for sites within a region with one another and look to see whether any are outside 3-4 standard deviations. This is designed to help find hosts that are not really located in a region (e.g. a web site proxied elsewhere).
PingER Executive Plots
As PingER grew in coverage and scope, a need was felt for software to provide a coherent way of quickly analyzing the trends in the data. PingER Executive Plots is a set of tools aimed at seamlessly integrating a high-level graphical analysis front-end to the raw data being generated. It was developed in Java as a jnlp application and can be run anywhere in the world over the web.
The two main analysis capabilities provided by this suite are:
1. High-level trend analysis of data for metrics like TCP Throughput, Packet Loss, Min/Avg RTT etc for various regions from all PingER monitoring sites.
2. Cumulative quality graphs showing breakup of sites with a particular loss quality within a region.
These analysis capabilities are supplemented by a wide-variety of features that make it a useful tool, including:
43

1. It allows the user to dynamically download the current data available in the SLAC archives, over the web, for graphing. This means that as soon as the latest data is updated at the SLAC archives, it is available for analysis anywhere.
2. Other features include: a. Ability to select logarithmic or exponential views of the trendlines.b. Zoom in/out on a particular time-interval. c. Adding/removing the lines/points corresponding to specific countries/regions.d. Dynamic tooltips on the entire chart area displaying information about
specific datapoints.e. Saving a snapshot of the graphs as image files.f. Viewing and storing the goodness of fit parameters for trendlines in a file.
3. The cumulative quality graphs application enables the user to form their own query consisting of a specific monitoring site, remote region and metric for graphing.
Figure 29 shows a screen snapshot of exponential trendlines from SLAC to various regions (labeled continent) of the world together with the data points for two of the lines.
Figure 29: Snapshot of PingER Executive Plots in action
ViPER (Visualization for PingER)
With the wide deployment of PingER, ViPER provides an extremely valuable, eye-catching, overview of PingER's deployment and the performance between various regions of the
44
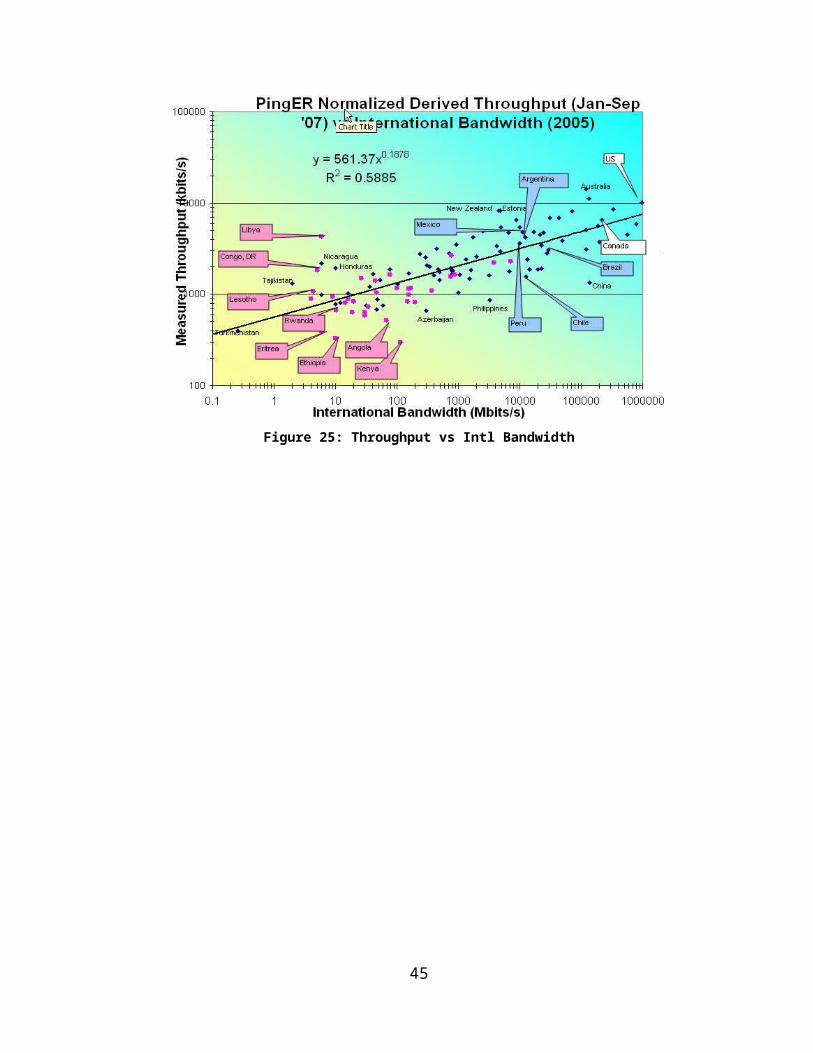
world. Since PingER is focusing on mapping the Digital Divide, it desperately needs simple to use, graphically engaging tools such as ViPER to grab the attention of politicians, executives and upper management at funding agencies, and NGOs. ViPER also is valuable to the management of PingER since it quickly identifies PingER database errors (e.g. hosts with incorrect latitude/longitude) enabling better quality control.
ViPER has a user friendly interface that allows a user to perform interactive analysis on PingER data. It uses a world map to show the geographic location of all the PingER nodes. When the user selects a particular node, detailed information about that node is shown. Also the links are colored according to their performance so the user can compare the performance of various links.
The user can plot graphs of various metrics such as TCP throughput, minimum RTT and packet loss between a remote monitoring site pair. The graph will show the historical performance of the link. The user can save the analysis information for future reference. A screen shot of ViPER is shown in Figure 30.
Figure 30: Screen shot of ViPER showing the losses from CDAC India in Mumbai to CERN in Geneva Switzerland
At the bottom of the screen shot is shown the user selection for the monitoring site and remote site, and the metric, also shown on the map in red are the Monitoring sites and in green the remote sites. A colored line from the chosen monitoring site (CDAC in Mumbai) to the remote host (at CERN in Geneva) indicates the quality of the end-to-end path in terms of the chosen metric - loss (the legend of colors is given in the top right). Moving the mouse over a site will pop up the name of the site or sites if there are multiple sites in the area. Clicking on the site will give detailed configuration information about the site(s). In the case
45
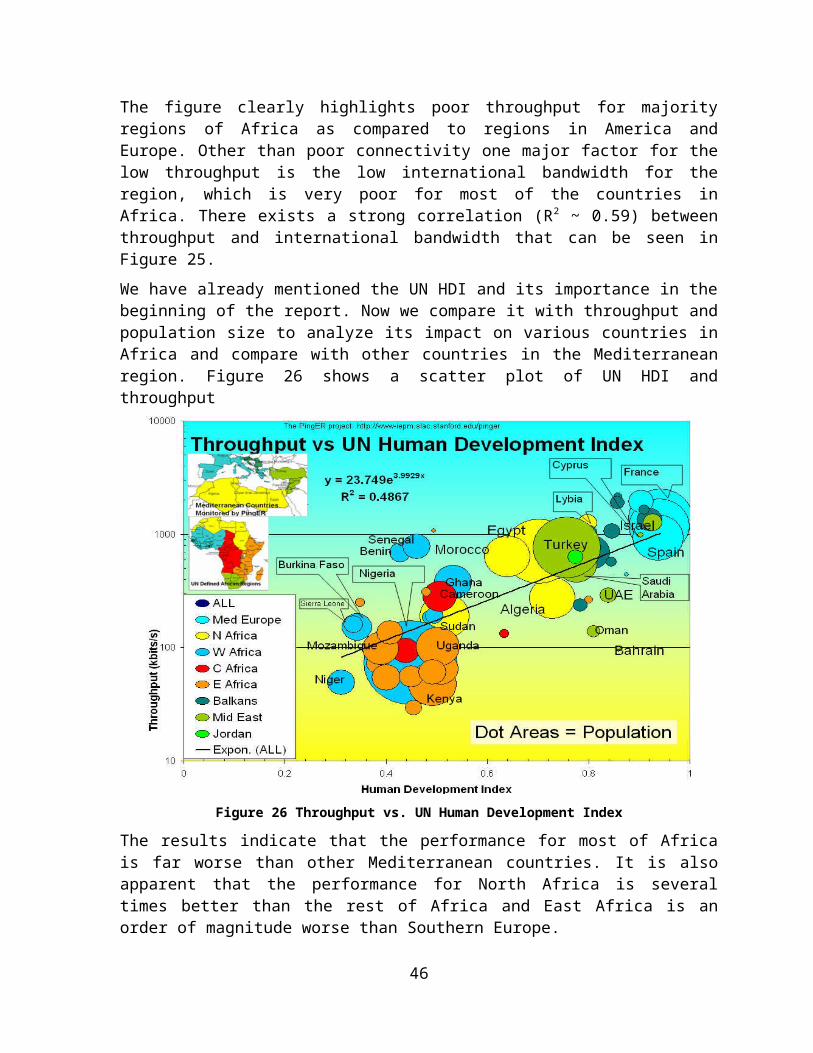
of Figure 30 the user has also requested to plot the losses for the last 60 days that is shown in the overlaid window.
ViPER is a Java application that has been deployed on JNLP (the Java Network Launching Protocol). Thus the application is launched through a simple mouse click and the users do not need to install the application. The application is deployed at http://www.slac.stanford.edu/comp/net/wan-mon/viper/.
Advanced Google Maps for PingER
Google maps are an efficient way to visualize data on a world map. The Google map facilitates pin-pointing a location based on latitude and longitude. The default behaviour allows one to add pop ups with particular information about the location clicked. In our case the pop up is populated with geographic information for each PingER node and the URL for the site.
Google maps also allow you to visualize on map, satellite view or hybrid of both of these. The map also allows you to zoom in /zoom out to see the regions in cities, these powerful features of google maps allow you to pin point your host location.
Figure 31: Google Map for PingER showing the monitor nodes in red, the beacons in blue, the remote nodes in green, plus International Heliophysical Year (IHY) probes in yellow. Also shown is a pop up for a site in Sweden. The legend allws one to select which groups of sites are to appear.
Figure 31 shows a screen short of a Google map for PingER. The new feature includes characterization of data according to their groups i.e. a separate image is used according to the group in which the node lie in.
46
Another enhancement which is done in the map is the plotting of the nodes only by selection which means that only those nodes should appear on the map which are selected from the legend. This feature makes the map more flexible for the user, just by checking/un-checking simple check boxes from the legend, the nodes in the group will appear/disappear. This feature is not provided by Google maps and was hence added with the help of Java Script code.
Google maps are programmed in Java Script so they can be used with any browser supporting Java Script. Thus this application does not require any sort of installation, the application is deployed at:
http://www.slac.stanford.edu/comp/net/wan-mon/viper/ihy_googlemap.htm
2007 Digital Divide Publications/Presentations: Quantifying the Digital Divide: A Scientific Overview of Network Connectivity and
Grid Infrastructure in South Asian Countries, S. Khan, R. L. Cottrell, U Kalim, A. Ali, CHEP07.
Talks (Most recent first)
Internet Connectivity in Africa , invited talk presented by Les Cottrell at the Internet and Grids in Africa: An Asset from African Scientists for the Benefit of African Society, 10-12 December 2007, Montpellier France.
Internet View of the Digital Divide, Especially for Sub-Saharan Africa , invited talk presented by Les Cottrell at the IHY Africa Workshop 11-16 November 2007, Addis Ababa, Ethiopia.
Quantifying the Digital Divide: Latin America, S. Asia, Africa , presented by Les Cottrell at the ICFA Workshop on Digital Divide Issues for Global e Science, Mexico City Oct 24-27, 2007
Quantifying the Need for Improved Network Performance for S. Asia , Les Cottrell, Shahryar Khan, I2 Planning Meeting: Enhancing Research & Education Connectivity to and within S. Asia, Arlington VA, US April 26, 2007.
Quantitative Measurement of the Digital Divide , Les Cottrell, Shahryar Khan, invited talk presented at the April APS meeting, Jacksonville Florida April 15, 2007.
The Digital Divide , by Les Cottrell, Shahryar Khan & Akbar Mehdi at the Qaid-e-Azam University Islamabad, Pakistan, March 2007.
Recommendations
There is interest from ICFA, ICTP, IHY and others to extend the monitoring further to countries with no formal HEP programs, but where there are needs to understand the Internet connectivity performance in order to aid the development of science. Africa is a region with many such countries. The idea is to provide performance within developing regions, between developing regions and between developing regions and developed regions.
We should ensure there are >=2 remote sites monitored in each Developing Country. All results should continue to be made available publicly via the web, and publicized to the HEP
47

community and others. Typically HEP leads other sciences in its needs and developing an understanding and solutions. The outreach from HEP to other sciences is to be encouraged. The results should continue to be publicized widely.
We need assistance from ICFA and others to find sites to monitor and contacts in the developing and the rest of the world, especially where we have <= 1 site/country. A current list of countries with active nodes can be found at http://www-iepm.slac.stanford.edu/pinger/sites-per-country.html.
Future Support
Although not a recommendation per se, it would be disingenuous to finish without noting the following. SLAC & FNAL are the leaders in the PingER project. The funding for the PingER effort came from the DoE MICS office since 1997, however it terminated at the end of the September 2003, since it was being funded as research and the development is no longer regarded as a research project. From 2004 onwards, development was continued with funding from the Pakistani Higher Education Commission (HEC) and the US State Department. The funding for this has recently been renewed for a further three years. The development consists of extending and enhancing the project, fixing known non-critical bugs, improving visualization, automating reports generated by hand today, finding new country site contacts, adding route histories and visualization, automate alarms, updating the web site for better navigation, adding more Developing Country monitoring sites/countries, improve code portability. The daily management, operation and supervising/leading the development has been continued with discretionary funding from the SLAC and FNAL HEP programs. The management and operation includes maintaining data collection and archiving, explaining needs, identifying and reopening broken connections, identifying and opening firewall blocks, finding replacement hosts, making limited special analyses and case studies, preparing and making presentations, responding to questions. The equipment performing this is currently in place at both SLAC and FNAL. Tmanagement, operation and supervision requires central funding at a level of about 20% of a Full Time Equivalent (FTE) person, plus travel. This has been provided by dioscretionary funding from the HEP budgets of SLAC and FNAL. The recent cuts in the US science budget, the impact on the Department of Energy, HEP and SLAC (see http://www.science.doe.gov/News_Information/speeches/speeches/08/SC08.htm?ReleaseNumber=mr20080124-00) have meant that SLAC no longer has discretionary funding and has thus cut continued the Digital Divide activities. Without funding, for the operational side, the future of PingER and reports such as this one is unclear, and the level of effort sustained in previous years will not be possible. Many agencies/organizations have expressed interest (e.g DoE, ESnet, NSF, ICFA, ICTP, IDRC, UNESCO, IHY) in this work but none have so far stepped up to funding the management and operation.
AcknowledgementsWe gratefully acknowledge the following: the assistance from NUST/NIIT in improving the PingER toolkit and management has been critical to keeping the project running, with respect to this we particularly acknowledge the support of their leader Arshad Ali; Akbar Khan of NIIT helped in updating some of the graphs and the case study on Africa; Shawn McKee of
48

the University of Michigan kindly provided the sections on LHC-OPN Monitoring and Related Network Research; Mike Jensen provided much useful information on the status of networking in Africa, Alberto Santoro of UERJ provided very useful information on Latin America; Sergio Novaes of UNESP and Julio Ibarra of Florida International University provided useful contacts in Latin America. We received much encouragement from Marco Zennaro and Enrique Canessa of ICTP and from the ICFA/SCIC in particular from Harvey Newman the chairman. We must also not forget the help and support from the administrators of the PingER monitoring sites worldwide
References[Advisor] http://dast.nlanr.net/Projects/Advisor/ [africa] Mike Jensen, "African Internet Connectivity". Available http://www3.sn.apc.org/africa/afrmain.htm [africa-rtm] Enrique Canessa, "Real time network monitoring in Africa - A proposal - (Quantifying the Digital; Divide)". Available http://www.ictp.trieste.it/~ejds/seminars2002/Enrique_Canessa/index.html [AMPATH] “International Exchange Point in Miami”, see http://www.ampath.fiu.edu/.[aps07] “Quantitative Measurement of the Digital Divide”, Les Cottrell, Shahryar Khan, presented at the April APS meeting, Jacksonville Florida April 15, 2007[bbcp] Andrew Hanushevsky, Artem Trunov, and Les Cottrell, "P2P Data Copy Program bbcp", CHEP01, Beijing 2002. Available at http://www.slac.stanford.edu/~abh/CHEP2001/p2p_bbcp.htm [bbftp] "Bbftp". Available http://doc.in2p3.fr/bbftp/. [bcr] “Application Demands Outrun Internet Improvements”, P. Sevcik, Business Communications Review, January 2006.[bullot] "TCP Stacks Testbed", Hadrien Bullot and R. Les Cottrell. Avialble at http://www-iepm.slac.stanford.edu/bw/tcp-eval/ [caseafrica] “Sub-Sahara case Study”, Les Cottrell, available at: https://confluence.slac.stanford.edu/display/IEPM/Sub-Sahara+Case+Study[casesasia] “South Asia case Study”, Les Cottrell, available at: https://confluence.slac.stanford.edu/display/IEPM/South+Asia+Case+Study[cia-pop-figures] Available at: http://www.cia.gov/cia/publications/factbook/fields/2119.html[coccetti] "TCP STacks on Production Links", Fabrizzio Coccetti and R. Les Cottrell. Available at http://www-iepm.slac.stanford.edu/monitoring/bulk/tcpstacks/ [E2Epi] http://e2epi.internet2.edu/ [eassy] The East African Submarine System http://eassy.org/ [ejds-email] Hilda Cerdeira and the eJDS Team, ICTP/TWAS Donation Programme, "Internet Monitoring of Universities and Research Centers in Developing Countries". Available http://www.slac.stanford.edu/xorg/icfa/icfa-net-paper-dec02/ejds-email.txt[ejds-africa] "Internet Performance to Africa" R. Les Cottrell and Enrique Canessa, Developing Countries Access to Scientific Knowledge: Quantifying the Digital Divide, ICTP Trieste, October 2003; also SLAC-PUB-10188. Available http://www.ejds.org/meeting2003/ictp/papers/Cottrell-Canessa.pdf [ejds-pinger] "PingER History and Methodology", R. Les Cottrell, Connie Logg and Jerrod Williams. Developing Countries Access to Scientific Knowledge: Quantifying the Digital Divide, ICTP Trieste, October 2003; also SLAC-PUB-10187. Available
49
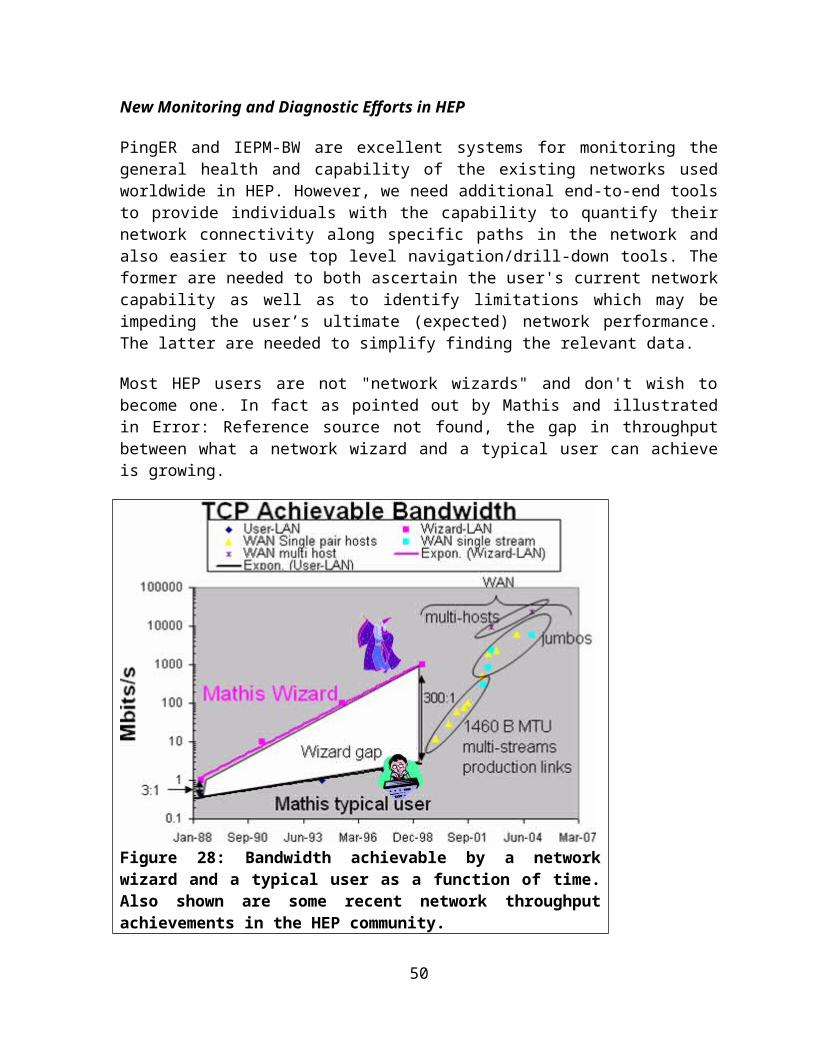
http://www.ejds.org/meeting2003/ictp/papers/Cottrell-Logg.pdf[EMA] http://monalisa.cern.ch/EMA/ [floyd] S. Floyd, "HighSpeed TCP for Large Congestion Windows", Internet draft draft-floyd-tcp-highspeed-01.txt, work in progress, 2002. Available http://www.icir.org/floyd/hstcp.html [gridftp] "The GridFTP Protocol Protocol and Software". Available http://www.globus.org/datagrid/gridftp.html [host-req] "Requirements for WAN Hosts being Monitored", Les Cottrell and Tom Glanzman. Available at http://www.slac.stanford.edu/comp/net/wan-req.html [icfa-98] "May 1998 Report of the ICFA NTF Monitoring Working Group". Available http://www.slac.stanford.edu/xorg/icfa/ntf/[icfa-mar02] "ICFA/SCIC meeting at CERN in March 2002". Available http://www.slac.stanford.edu/grp/scs/trip/cottrell-icfa-mar02.html[icfa-jan03] "January 2003 Report of the ICFA-SCIC Monitoring Working Group". Available http://www.slac.stanford.edu/xorg/icfa/icfa-net-paper-dec02/[icfa-jan04] "January 2004 Report of the ICFA-SCIC Monitoring Working Group". Available http://www.slac.stanford.edu/xorg/icfa/icfa-net-paper-jan04/[icfa-jan05] "January 2005 Report of the ICFA-SCIC Monitoring Working Group". Available http://www.slac.stanford.edu/xorg/icfa/icfa-net-paper-jan05/[icfa-jan06] "January 2006 Report of the ICFA-SCIC Monitoring Working Group". Available http://www.slac.stanford.edu/xorg/icfa/icfa-net-paper-jan06/[icfa-jan07] "January 2006 Report of the ICFA-SCIC Monitoring Working Group". Available http://www.slac.stanford.edu/xorg/icfa/icfa-net-paper-jan07/[iepm] "Internet End-to-end Performance Monitoring - Bandwidth to the World Project". Available http://www-iepm.slac.stanford.edu/bw [ictp] Developing Country Access to On-Line Scientific Publishing: Sustainable Alternatives, Round Table meeting held at ICTP Trieste, Oct 2002. Available http://www.ictp.trieste.it/~ejds/seminars2002/program.html [ictp-jensen] Mike Jensen, "Connectivity Mapping in Africa", presentation at the ICTP Round Table on Developing Country Access to On-Line Scientific Publishing: Sustainable Alternatives at ITCP, Trieste, October 2002. Available http://www.ictp.trieste.it/~ejds/seminars2002/Mike_Jensen/jensen-full.ppt [ictp-rec] RECOMMDENDATIONS OF the Round Table held in Trieste to help bridge the digital divide. Available http://www.ictp.trieste.it/ejournals/meeting2002/Recommen_Trieste.pdf [ihy07] “Internet View of the Digital Divide, Especially for Sub-Saharan Africa,” presented by Les Cottrell at the IHY Africa Workshop 11-16 November 2007, Addis Ababa, Ethiopia[kuzmanovic] "HSTCP-LP: A Protocol for Low-Priority Bulk Data Transfer in High-Speed High-RTT Networks", Alexander Kuzmanovic, Edward Knightly and R. Les Cottrell. Available at http://dsd.lbl.gov/DIDC/PFLDnet2004/papers/Kuzmanovic.pdf [LISA] http://monalisa.cern.ch/monalisa__Interactive_Clients__LISA.html[low] S. Low, "Duality model of TCP/AQM + Stabilized Vegas". Available http://netlab.caltech.edu/FAST/meetings/2002july/fast020702.ppt [mathis] M. Mathis, J. Semke, J. Mahdavi, T. Ott, "The Macroscopic Behavior of the TCP Congestion Avoidance Algorithm",Computer Communication Review, volume 27, number 3, pp. 67-82, July 1997
50
[MonALISA] http://monalisa.cacr.caltech.edu/ [NDT] http://miranda.ctd.anl.gov:7123/ [NMWG] http://www-didc.lbl.gov/NMWG/ [normal] “Deriving TCP throughput from ping measurements” available at http://www.slac.stanford.edu/comp/net/wan-mon/tutorial.html#derive. [nua] NUA Internet Surveys, "How many Online". Available http://www.nua.ie/surveys/how_many_online/ [os] "TCP Tuning Guide". Available http://www-didc.lbl.gov/TCP-tuning/ [pak-develop-news] News Article entitled “PM launches Seamewe-4 submarine cable” Available at http://www.jang.com.pk/thenews/jan2006-daily/03-01-2006/main/main5.htm[pak-fibre] “Fiber Outage in Pakistan June 27th 2005 to July 8th 2005”, R. L. Cottrell, A. Rehmatullah, available at http://www.slac.stanford.edu/grp/scs/net/case/pakjul05/ [pinger] "PingER". Available http://www-iepm.slac.stanford.edu/pinger/; W. Matthews and R. L. Cottrell, "The PingER Project: Active Internet Performance Monitoring for the HEP Community", IEEE Communications Magazine Vol. 38 No. 5 pp 130-136, May 2002. [perfSONAR] PERFormance Service Oriented Network monitoring Architecture , see http://www.perfsonar.net/[Pernprop] PC-1 Documents: 1) “Last Mile Pakistan Education and Research Network Connectivity Model PC-1” and 2 ) “Conversion of last mile Pakistan Education and Research Network Connectivity to Fiber Optics Model” PC-1 Available at: http://www.pern.edu.pk/PC-1doc/pc-1doc.html[pinger-deploy] "PingER Deployment". Available http://www.slac.stanford.edu/comp/net/wan-mon/deploy.html [PiPES] http://e2epi.internet2.edu/ [qbss] "SLAC QBSS Measurements". Available http://www-iepm.slac.stanford.edu/monitoring/qbss/measure.html [ravot] J. P. Martin-Flatin and S. Ravot, "TCP Congestion Control in Fast Long-Distance Networks", Technical Report CALT-68-2398, California Institute of Technology, July 2002. Available http://netlab.caltech.edu/FAST/publications/caltech-tr-68-2398.pdf [RedCLARA] “Latin American Cooperation of Advanced Networks”, see http://www.redclara.net/en/03.htm[SEACOM] “SEACOM”, see http://www6.lexisnexis.com/publisher/EndUser?Action=UserDisplayFullDocument&orgId=1614&topicId=21924&docId=l:724211277[Silk]”Virtualk Silk Highway”, see http://www.silkproject.org/.[skf07] “Internet Connectivity in Africa” , presented by Les Cottrell at the Internet and Grids in Africa: An Asset for African Scientists for the Benefit of African Society, 10-12 December 2007, Montpellier France.{TEAMS] “East Africa Marine System”, see http://allafrica.com/stories/200801100785.html[traceroute] “Traceroute Servers for HENP & Esnet”, available at http://www.slac.stanford.edu/comp/net/wan-mon/traceroute-srv.html[tsunami] "Tsunami". Available http://ncne.nlanr.net/training/techs/2002/0728/presentations/pptfiles/200207-wallace1.ppt [tutorial] R. L. Cottrell, "Tutorial on Internet Monitoring & PingER at SLAC". Available http://www.slac.stanford.edu/comp/net/wan-mon/tutorial.html[udt] Y Gu, R. L Grossman, “UDT: An Application Level Transport Protocol for Grid
51
Computing”, submitted to the Second International Workshop on Protocols for Fast Long-Distance Networks.[un] "United Nations Population Division World Population Prospects Population database". Available http://esa.un.org/unpp/definition.html [an96] T.W Anderson Jeremy D.Finn, “The New Statistical Analysis of Data”, 1996[wis] http://www.internetworldstats.com/stats.htm[mos] http://www.slac.stanford.edu/comp/net/wan-mon/tutorial.html#mos
h. These countries appear in the Particle Data Group diary and so would appear to have HEP programs.
52