icg prelim 14
TRANSCRIPT
1
Irish Continental Group plc
2014 Results Presentation
5th March 2015
2
ICG Business Units
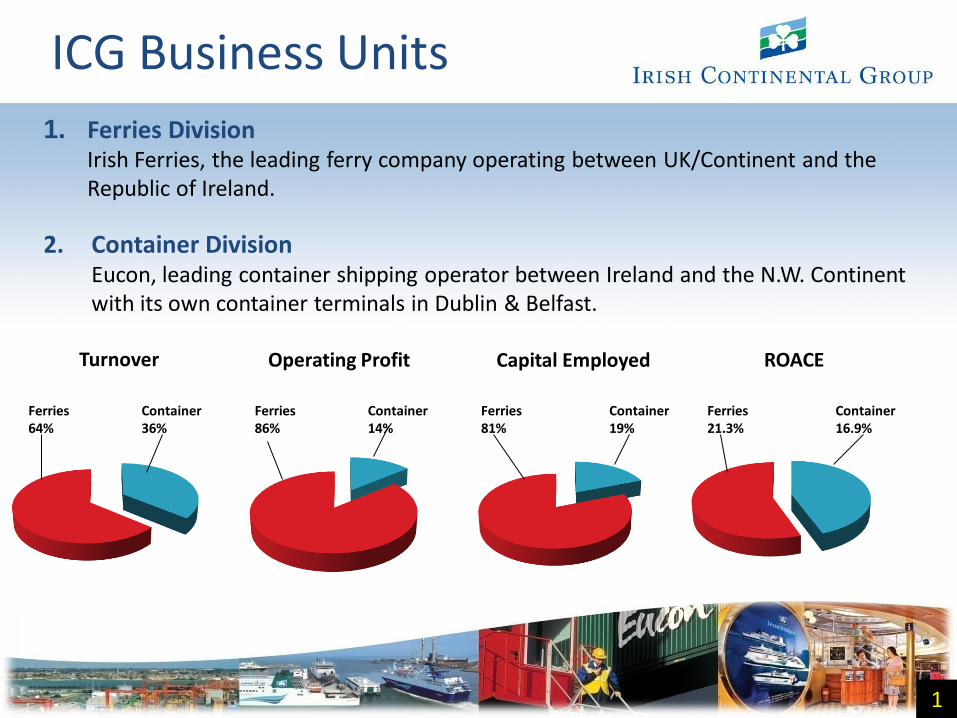
1. Ferries Division Irish Ferries, the leading ferry company operating between UK/Continent and the Republic of Ireland.
2. Container Division Eucon, leading container shipping operator between Ireland and the N.W. Continent with its own container terminals in Dublin & Belfast.
1
Turnover
Ferries 64%
Container 36%
Operating Profit
Container 14%
Ferries 86%
Capital Employed
Container 19%
Ferries 81%
ROACE
Ferries 21.3%
Container 16.9%
3
2
Ferries Division
2
4
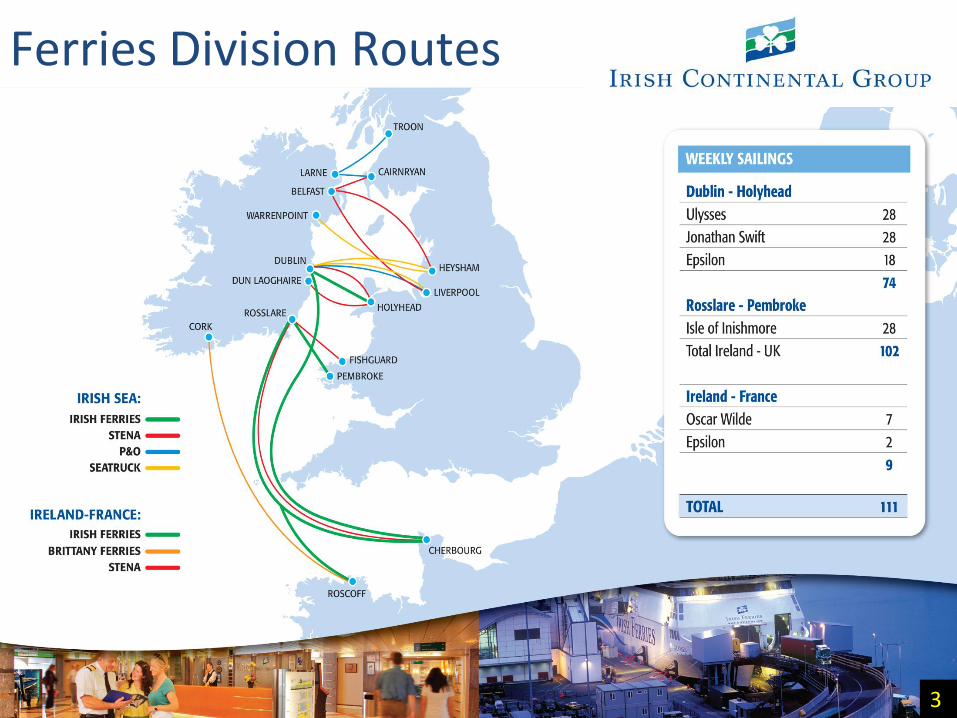
Ferries Division Routes
3
5
Ferries Division
4
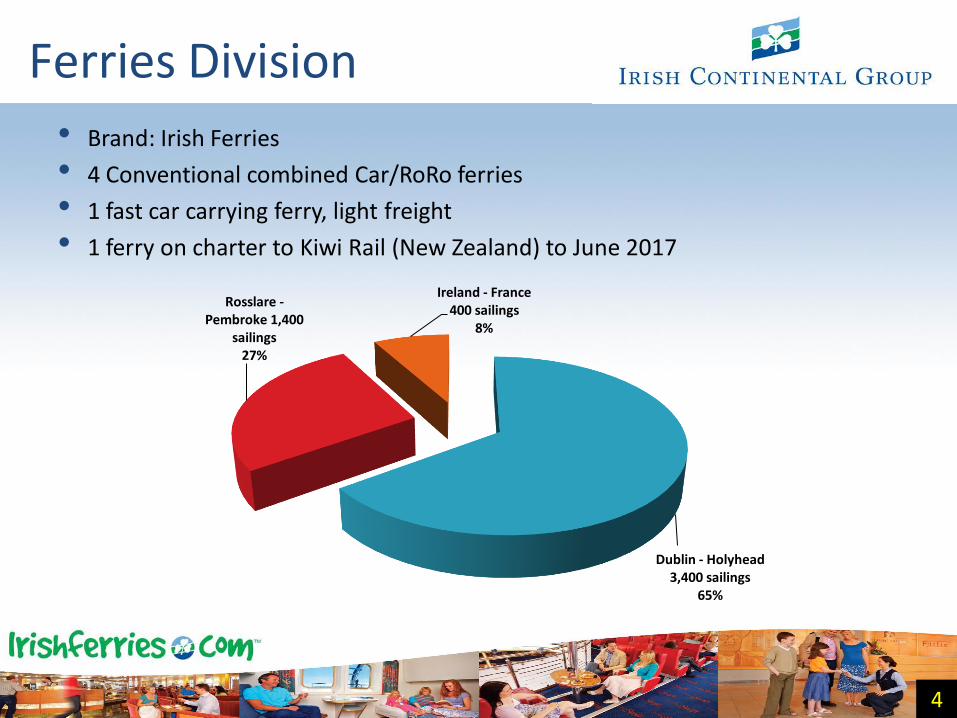
• Brand: Irish Ferries
• 4 Conventional combined Car/RoRo ferries
• 1 fast car carrying ferry, light freight
• 1 ferry on charter to Kiwi Rail (New Zealand) to June 2017
Dublin - Holyhead 3,400 sailings
65%
Rosslare -Pembroke 1,400
sailings 27%
Ireland - France 400 sailings
8%
6
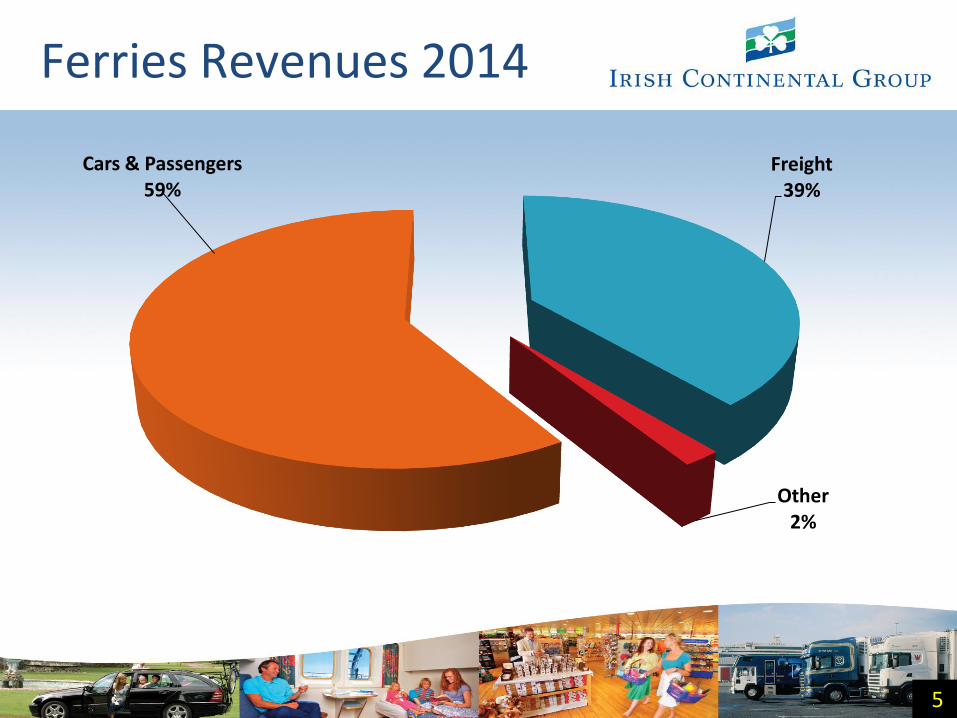
Ferries Revenues 2014
5
Freight 39%
Other 2%
Cars & Passengers 59%

7
Ferries Costs 2014
6
Payroll 24%
Port Costs 21%
Fuel 26%
Repairs/Insurance 5%
Depreciation 10%
Other 14%
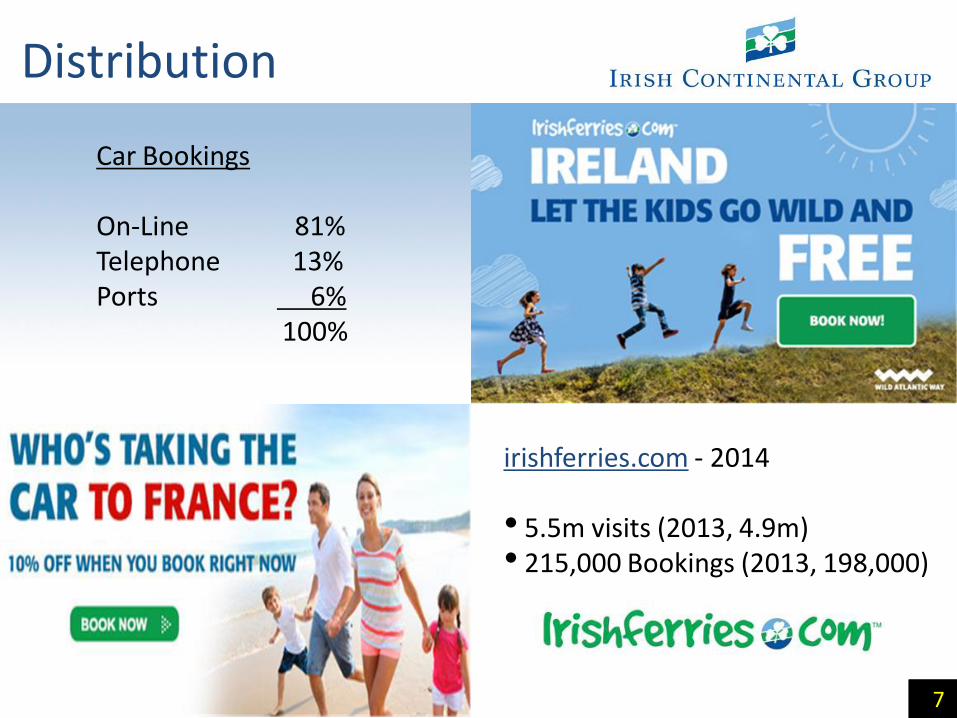
Distribution
6
Car Bookings On-Line 81% Telephone 13% Ports 6% 100%
7 7
irishferries.com - 2014 • 5.5m visits (2013, 4.9m) • 215,000 Bookings (2013, 198,000)
9
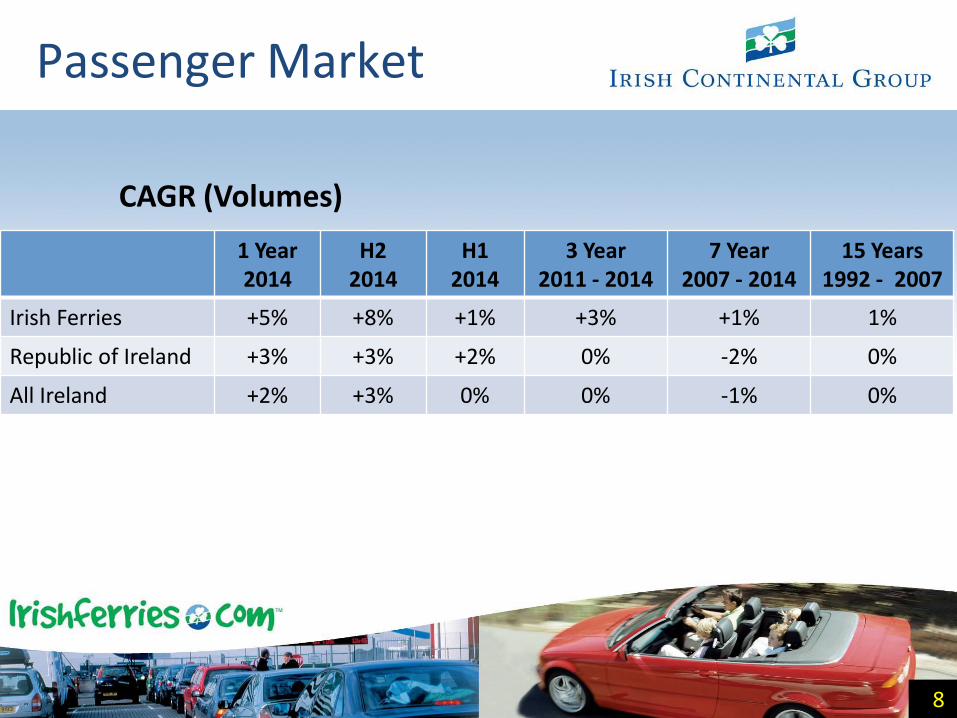
Passenger Market
1 Year 2014
H2 2014
H1 2014
3 Year 2011 - 2014
7 Year 2007 - 2014
15 Years 1992 - 2007
Irish Ferries +5% +8% +1% +3% +1% 1%
Republic of Ireland +3% +3% +2% 0% -2% 0%
All Ireland +2% +3% 0% 0% -1% 0%
CAGR (Volumes)
8
10
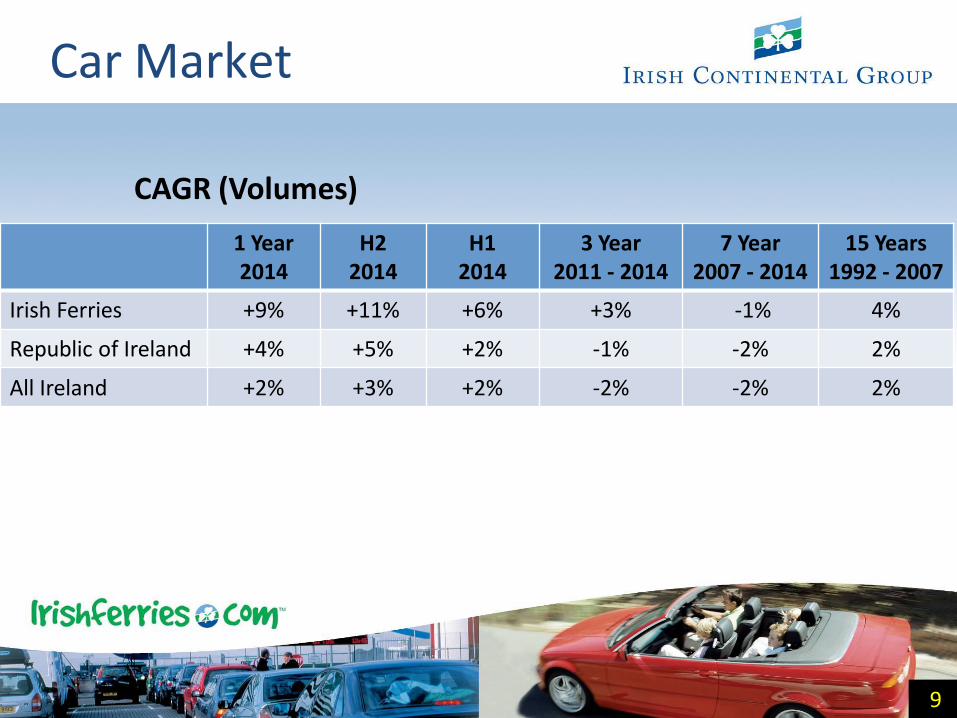
Car Market
1 Year 2014
H2 2014
H1 2014
3 Year 2011 - 2014
7 Year 2007 - 2014
15 Years 1992 - 2007
Irish Ferries +9% +11% +6% +3% -1% 4%
Republic of Ireland +4% +5% +2% -1% -2% 2%
All Ireland +2% +3% +2% -2% -2% 2%
CAGR (Volumes)
9
11
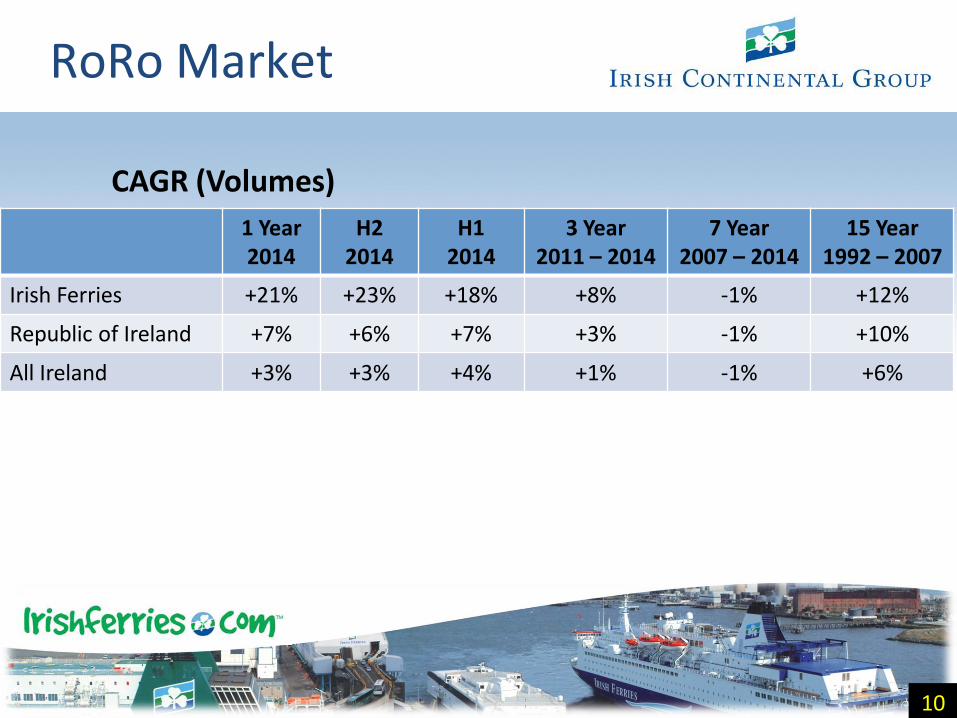
RoRo Market
1 Year 2014
H2 2014
H1 2014
3 Year 2011 – 2014
7 Year 2007 – 2014
15 Year 1992 – 2007
Irish Ferries +21% +23% +18% +8% -1% +12%
Republic of Ireland +7% +6% +7% +3% -1% +10%
All Ireland +3% +3% +4% +1% -1% +6%
CAGR (Volumes)
10
12
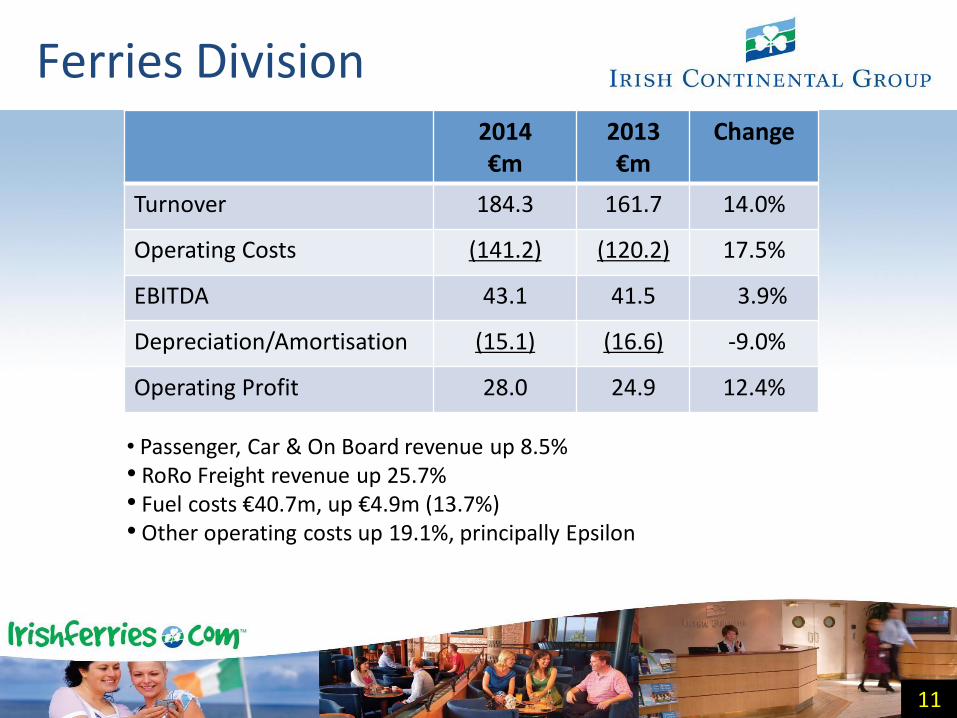
Ferries Division 2014 €m
2013 €m
Change
Turnover 184.3 161.7 14.0%
Operating Costs (141.2) (120.2) 17.5%
EBITDA 43.1 41.5 3.9%
Depreciation/Amortisation (15.1) (16.6) -9.0%
Operating Profit 28.0 24.9 12.4%
11
• Passenger, Car & On Board revenue up 8.5% • RoRo Freight revenue up 25.7% • Fuel costs €40.7m, up €4.9m (13.7%) • Other operating costs up 19.1%, principally Epsilon
13
12
Container & Terminal Division
12
12
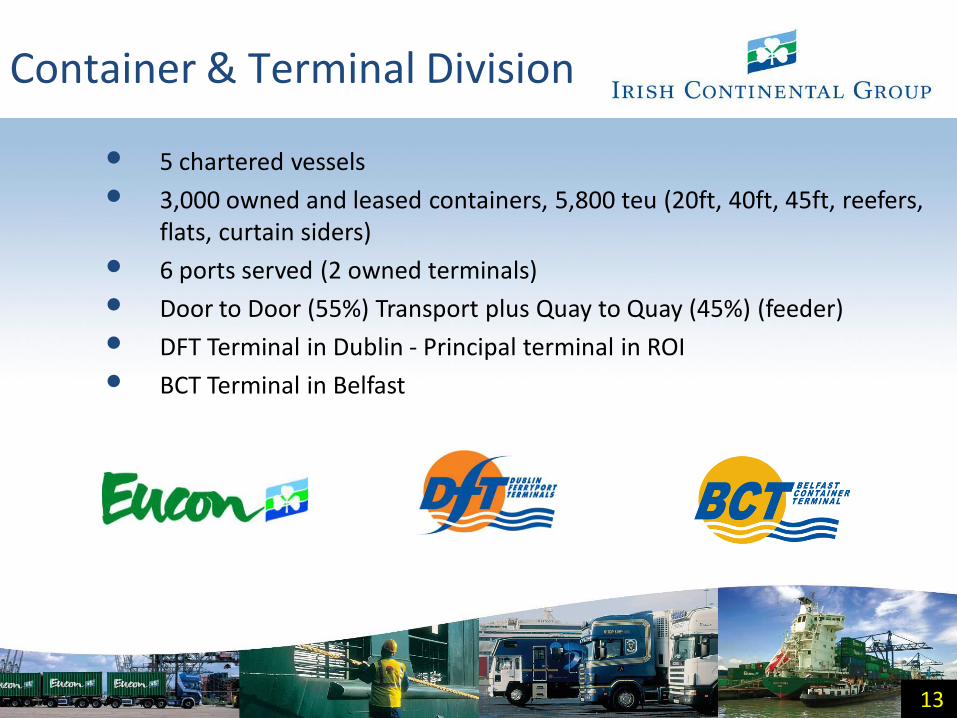
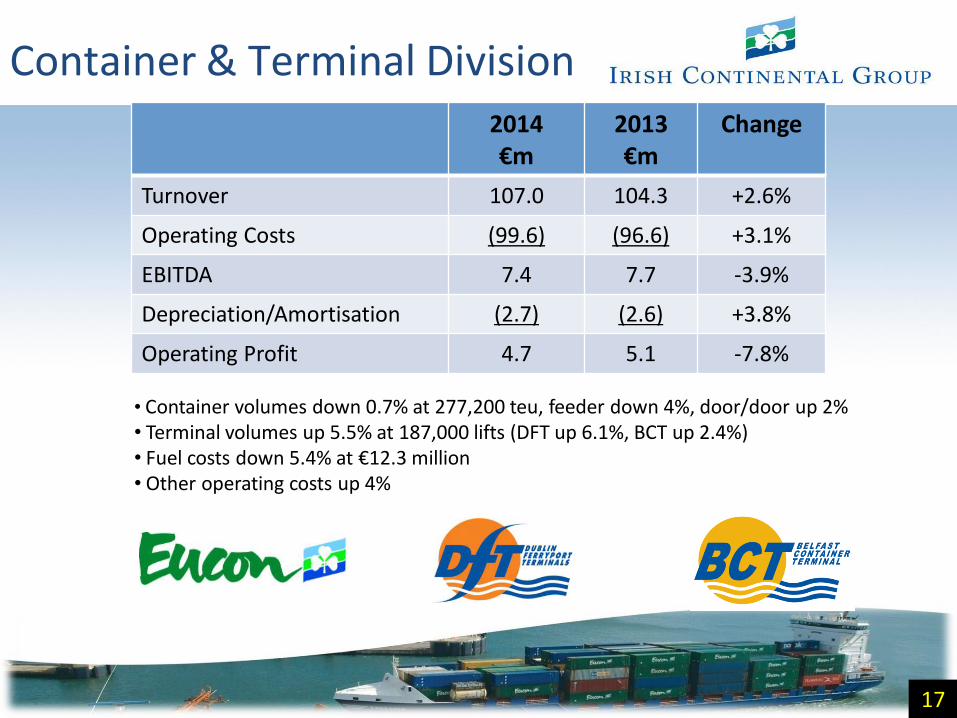
Container & Terminal Division
• 5 chartered vessels
• 3,000 owned and leased containers, 5,800 teu (20ft, 40ft, 45ft, reefers, flats, curtain siders)
• 6 ports served (2 owned terminals)
• Door to Door (55%) Transport plus Quay to Quay (45%) (feeder)
• DFT Terminal in Dublin - Principal terminal in ROI
• BCT Terminal in Belfast
13
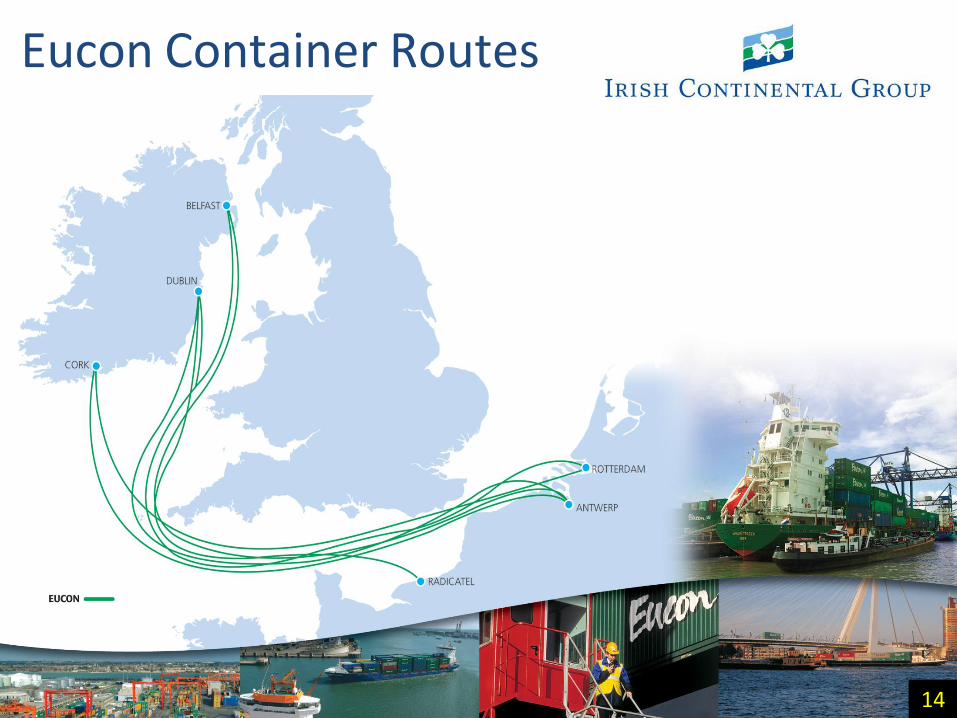
Eucon Container Routes
14
Terminals
15
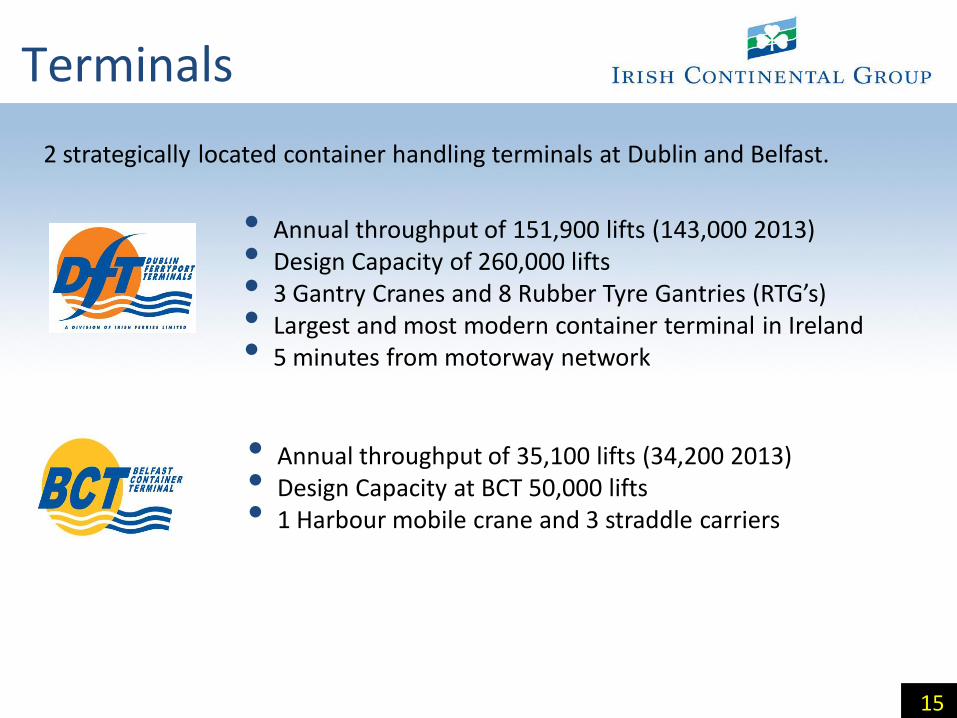
2 strategically located container handling terminals at Dublin and Belfast.
• Annual throughput of 151,900 lifts (143,000 2013) • Design Capacity of 260,000 lifts • 3 Gantry Cranes and 8 Rubber Tyre Gantries (RTG’s) • Largest and most modern container terminal in Ireland • 5 minutes from motorway network
• Annual throughput of 35,100 lifts (34,200 2013) • Design Capacity at BCT 50,000 lifts • 1 Harbour mobile crane and 3 straddle carriers
Container Handling Irl.
17
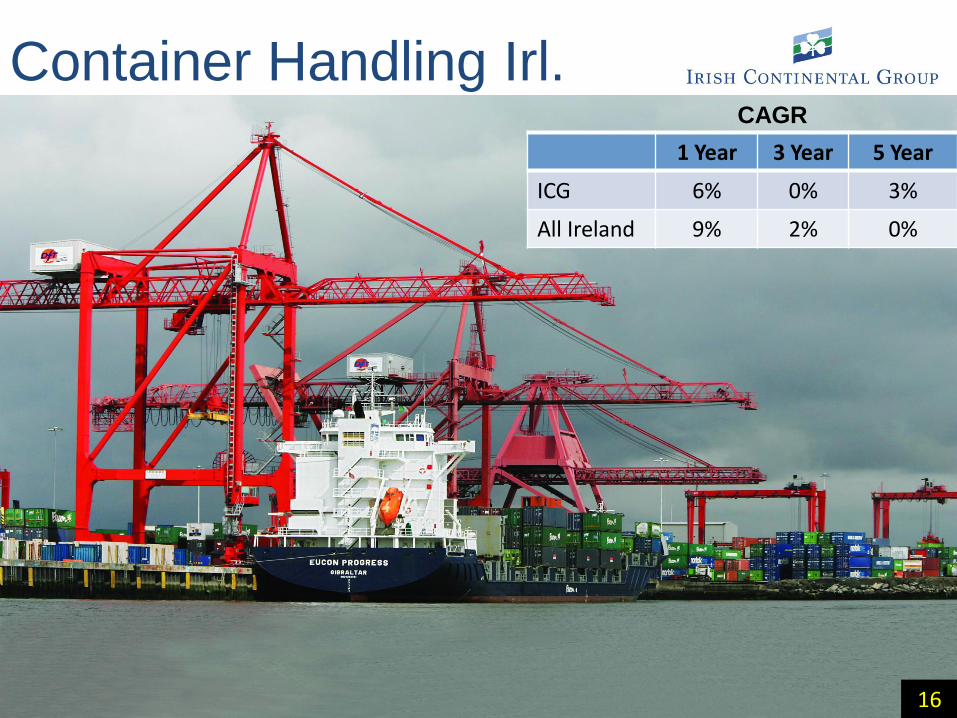
1 Year 3 Year 5 Year
ICG 6% 0% 3%
All Ireland 9% 2% 0%
CAGR
16
18
Container & Terminal Division 2014 €m
2013 €m
Change
Turnover 107.0 104.3 +2.6%
Operating Costs (99.6) (96.6) +3.1%
EBITDA 7.4 7.7 -3.9%
Depreciation/Amortisation (2.7) (2.6) +3.8%
Operating Profit 4.7 5.1 -7.8%
17
• Container volumes down 0.7% at 277,200 teu, feeder down 4%, door/door up 2% • Terminal volumes up 5.5% at 187,000 lifts (DFT up 6.1%, BCT up 2.4%) • Fuel costs down 5.4% at €12.3 million • Other operating costs up 4%
19
18
Group • Financials
• Fuel
• Pension Funds
• Dividends/Share Buybacks
• Outlook
20
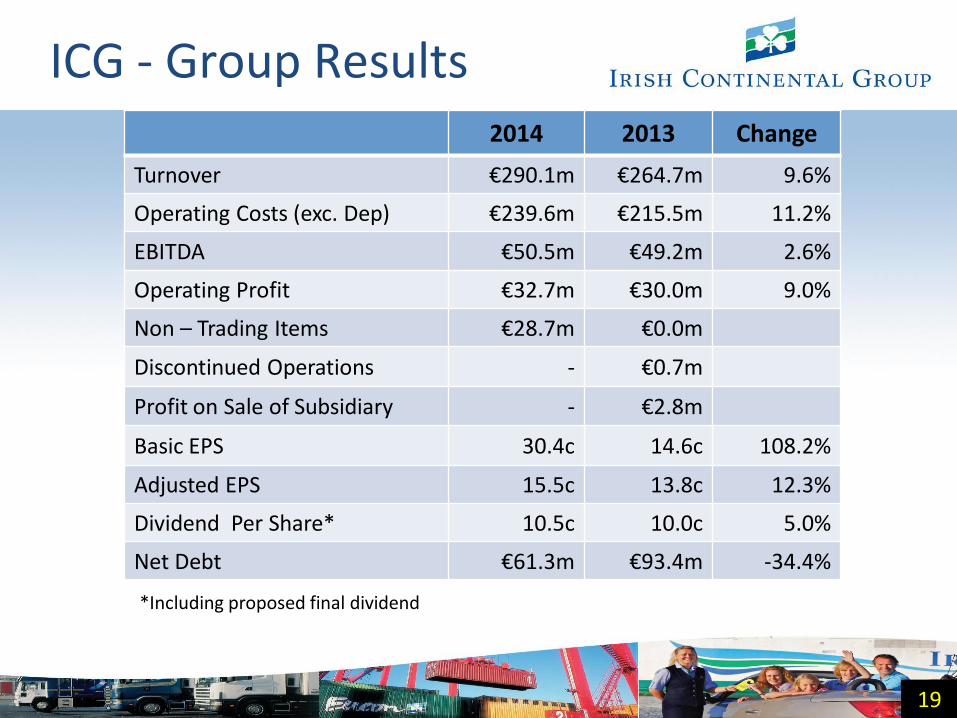
2014 2013 Change
Turnover €290.1m €264.7m 9.6%
Operating Costs (exc. Dep) €239.6m €215.5m 11.2%
EBITDA €50.5m €49.2m 2.6%
Operating Profit €32.7m €30.0m 9.0%
Non – Trading Items €28.7m €0.0m
Discontinued Operations - €0.7m
Profit on Sale of Subsidiary - €2.8m
Basic EPS 30.4c 14.6c 108.2%
Adjusted EPS 15.5c 13.8c 12.3%
Dividend Per Share* 10.5c 10.0c 5.0%
Net Debt €61.3m €93.4m -34.4%
ICG - Group Results
19
*Including proposed final dividend
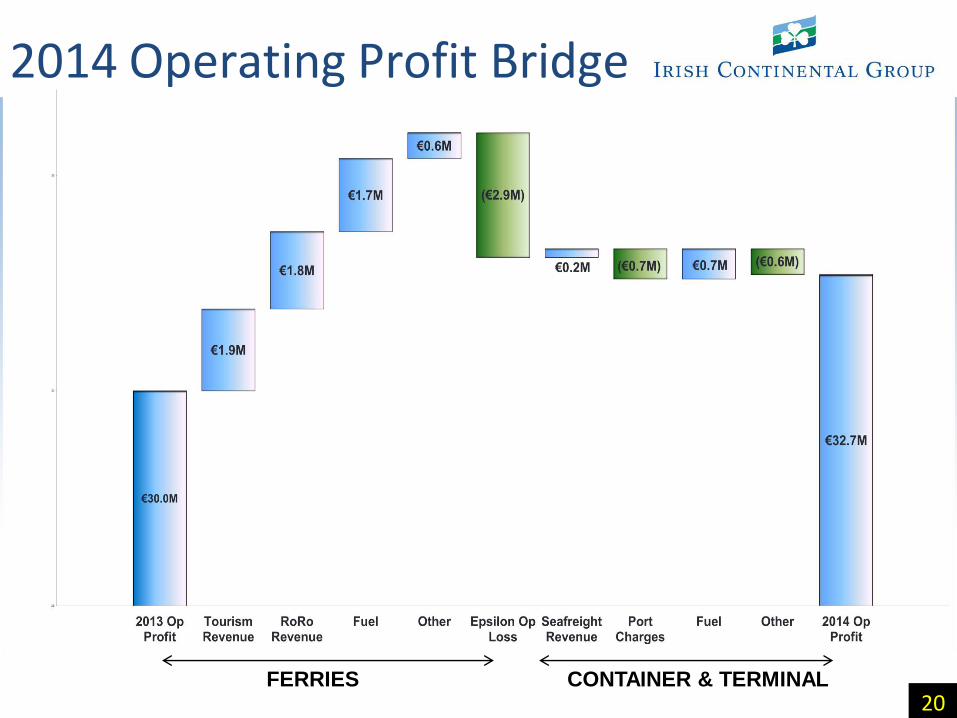
2014 Operating Profit Bridge
20 FERRIES CONTAINER & TERMINAL
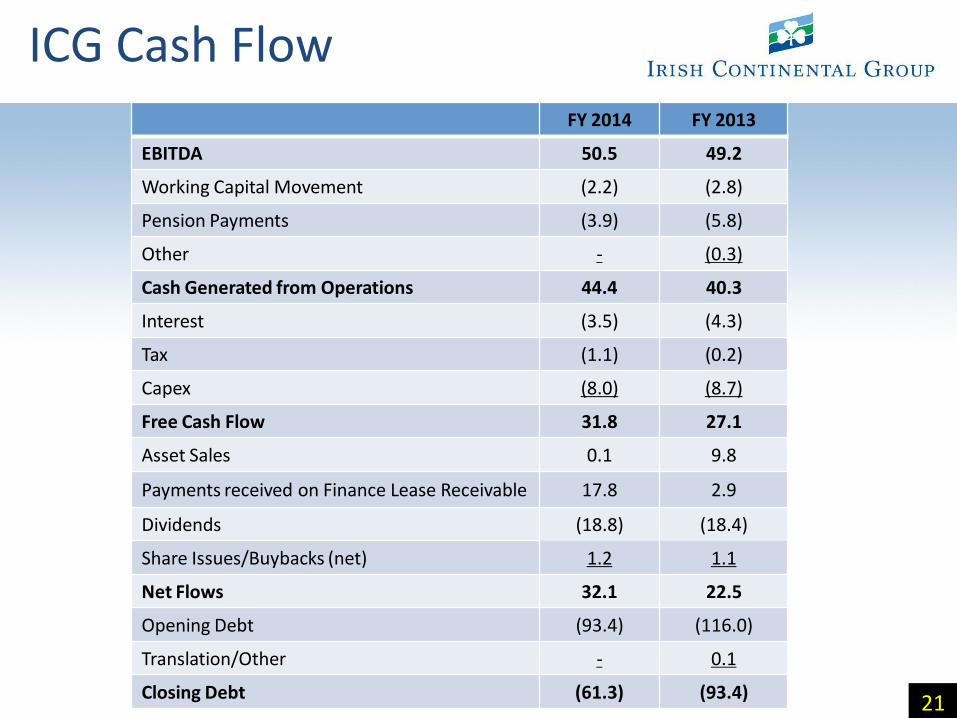
ICG Cash Flow FY 2014 FY 2013
EBITDA 50.5 49.2
Working Capital Movement (2.2) (2.8)
Pension Payments (3.9) (5.8)
Other - (0.3)
Cash Generated from Operations 44.4 40.3
Interest (3.5) (4.3)
Tax (1.1) (0.2)
Capex (8.0) (8.7)
Free Cash Flow 31.8 27.1
Asset Sales 0.1 9.8
Payments received on Finance Lease Receivable 17.8 2.9
Dividends (18.8) (18.4)
Share Issues/Buybacks (net) 1.2 1.1
Net Flows 32.1 22.5
Opening Debt (93.4) (116.0)
Translation/Other - 0.1
Closing Debt (61.3) (93.4) 21
23
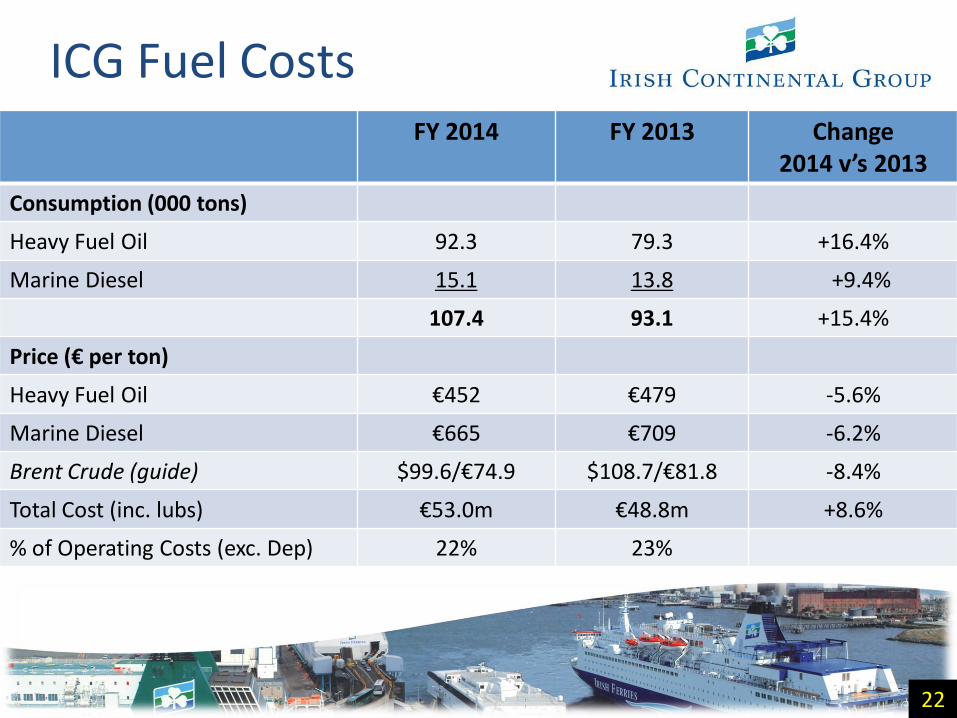
ICG Fuel Costs FY 2014 FY 2013 Change
2014 v’s 2013
Consumption (000 tons)
Heavy Fuel Oil 92.3 79.3 +16.4%
Marine Diesel 15.1 13.8 +9.4%
107.4 93.1 +15.4%
Price (€ per ton)
Heavy Fuel Oil €452 €479 -5.6%
Marine Diesel €665 €709 -6.2%
Brent Crude (guide) $99.6/€74.9 $108.7/€81.8 -8.4%
Total Cost (inc. lubs) €53.0m €48.8m +8.6%
% of Operating Costs (exc. Dep) 22% 23%
22
24
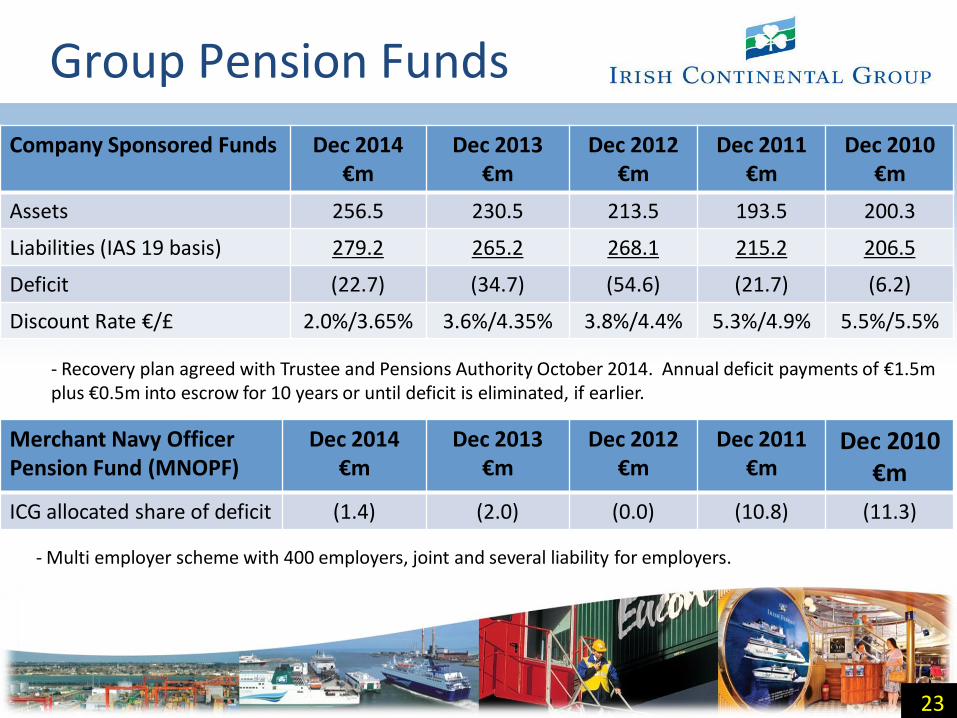
Group Pension Funds
Company Sponsored Funds Dec 2014 €m
Dec 2013 €m
Dec 2012 €m
Dec 2011 €m
Dec 2010 €m
Assets 256.5 230.5 213.5 193.5 200.3
Liabilities (IAS 19 basis) 279.2 265.2 268.1 215.2 206.5
Deficit (22.7) (34.7) (54.6) (21.7) (6.2)
Discount Rate €/£ 2.0%/3.65% 3.6%/4.35% 3.8%/4.4% 5.3%/4.9% 5.5%/5.5%
23
Merchant Navy Officer Pension Fund (MNOPF)
Dec 2014 €m
Dec 2013 €m
Dec 2012 €m
Dec 2011 €m
Dec 2010 €m
ICG allocated share of deficit (1.4) (2.0) (0.0) (10.8) (11.3)
- Recovery plan agreed with Trustee and Pensions Authority October 2014. Annual deficit payments of €1.5m plus €0.5m into escrow for 10 years or until deficit is eliminated, if earlier.
- Multi employer scheme with 400 employers, joint and several liability for employers.
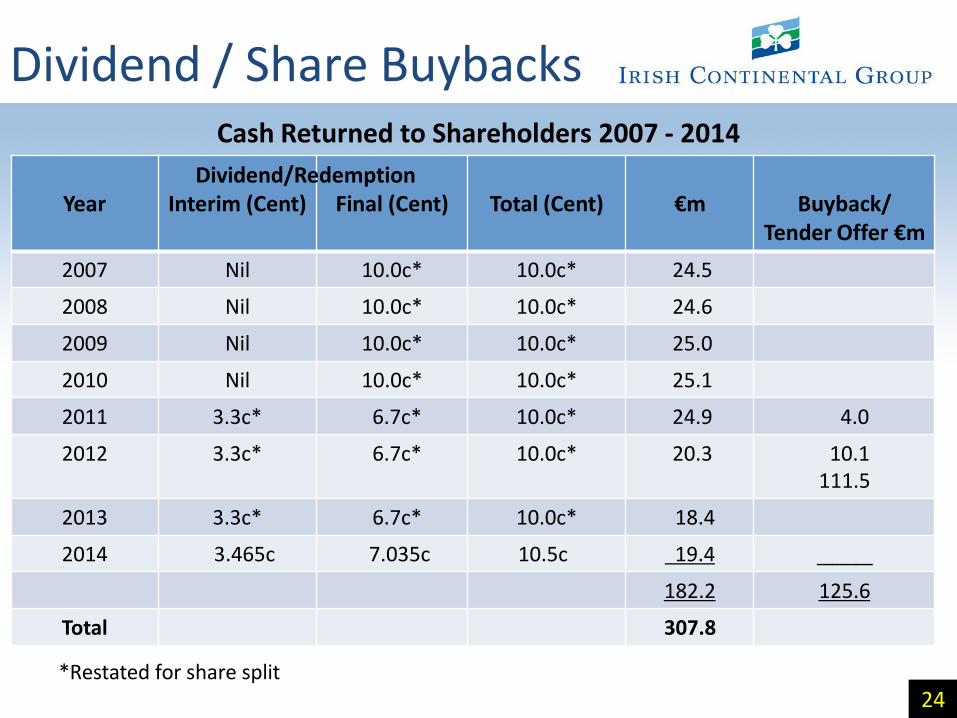
Dividend / Share Buybacks
24
Cash Returned to Shareholders 2007 - 2014
Year Interim (Cent) Final (Cent) Total (Cent) €m
Buyback/ Tender Offer €m
2007 Nil 10.0c* 10.0c* 24.5
2008 Nil 10.0c* 10.0c* 24.6
2009 Nil 10.0c* 10.0c* 25.0
2010 Nil 10.0c* 10.0c* 25.1
2011 3.3c* 6.7c* 10.0c* 24.9 4.0
2012
3.3c*
6.7c*
10.0c*
20.3
10.1 111.5
2013 3.3c* 6.7c* 10.0c* 18.4
2014 3.465c 7.035c 10.5c 19.4 _____
182.2 125.6
Total 307.8
*Restated for share split
Dividend/Redemption
26
Current Trading
25
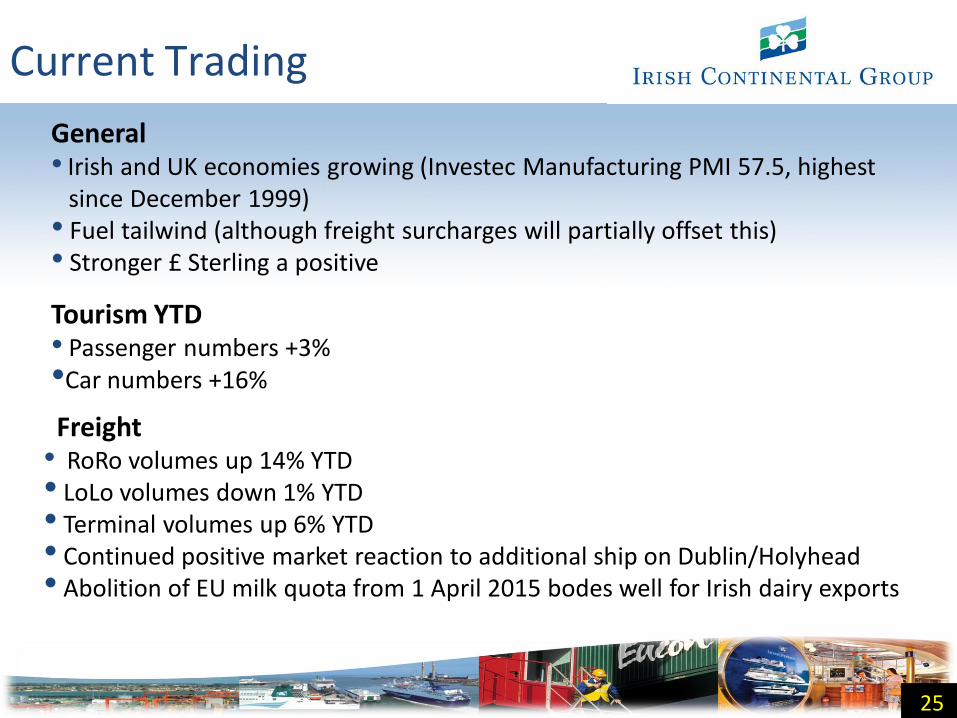
Freight • RoRo volumes up 14% YTD • LoLo volumes down 1% YTD • Terminal volumes up 6% YTD • Continued positive market reaction to additional ship on Dublin/Holyhead • Abolition of EU milk quota from 1 April 2015 bodes well for Irish dairy exports
General • Irish and UK economies growing (Investec Manufacturing PMI 57.5, highest since December 1999) • Fuel tailwind (although freight surcharges will partially offset this) • Stronger £ Sterling a positive
Tourism YTD • Passenger numbers +3% •Car numbers +16%
27
APPENDIX FLEET
APP
Ferries - Fleet
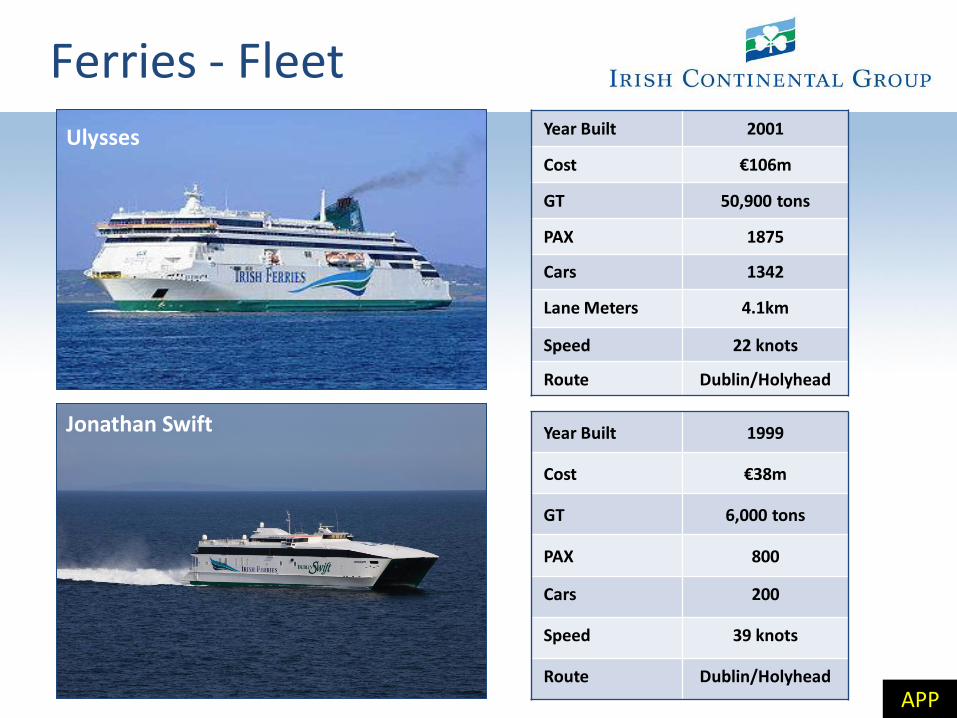
Ferries - Fleet Year Built 2001
Cost €106m
GT 50,900 tons
PAX 1875
Cars 1342
Lane Meters 4.1km
Speed 22 knots
Route Dublin/Holyhead
Year Built 1999
Cost €38m
GT 6,000 tons
PAX 800
Cars 200
Speed 39 knots
Route Dublin/Holyhead
Jonathan Swift
APP
Ulysses
Jonathan Swift
Ulysses
Ulysses
Jonathan Swift
Ferries - Fleet
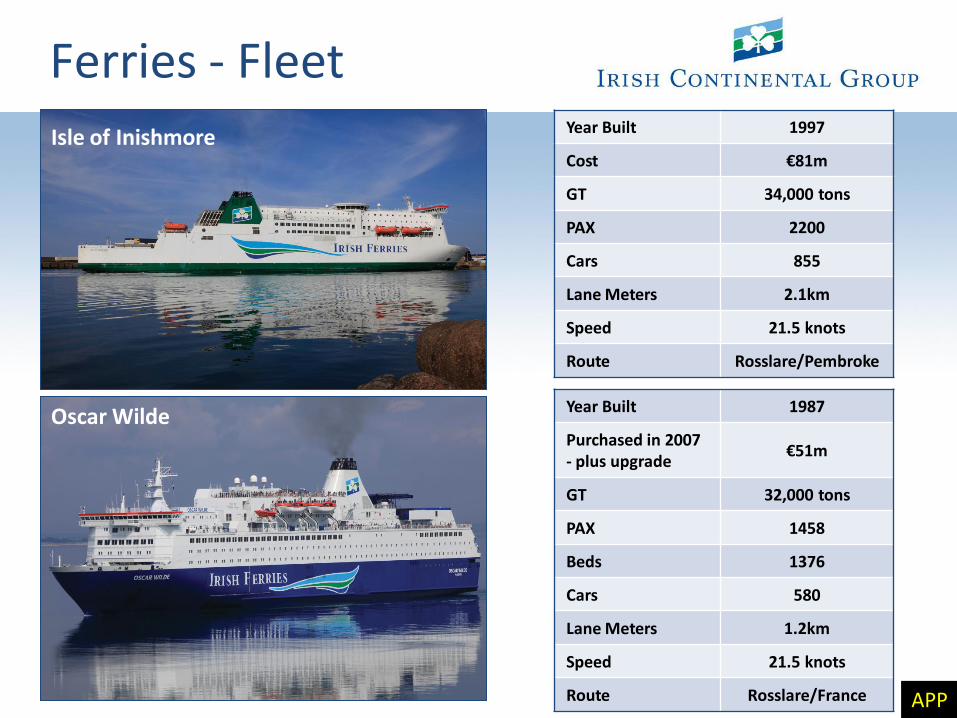
Oscar Wilde
Year Built 1997
Cost €81m
GT 34,000 tons
PAX 2200
Cars 855
Lane Meters 2.1km
Speed 21.5 knots
Route Rosslare/Pembroke
Year Built 1987
Purchased in 2007 - plus upgrade
€51m
GT 32,000 tons
PAX 1458
Beds 1376
Cars 580
Lane Meters 1.2km
Speed 21.5 knots
Route Rosslare/France APP
Isle of Inishmore
Oscar Wilde
Isle of Inishmore
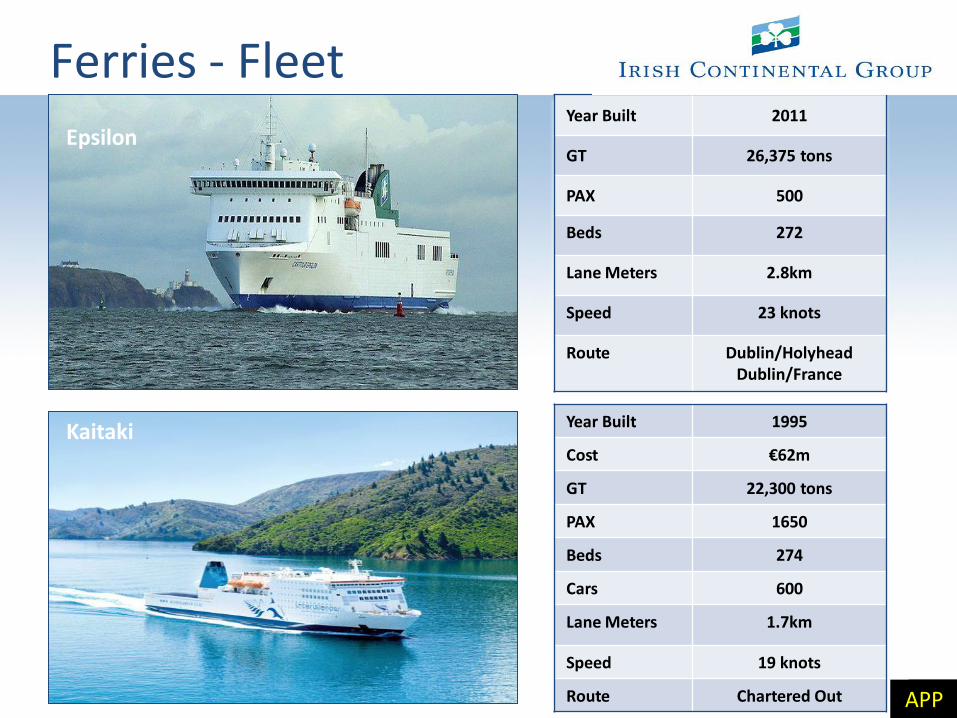
Ferries - Fleet
15
Year Built 1995
Cost €62m
GT 22,300 tons
PAX 1650
Beds 274
Cars 600
Lane Meters 1.7km
Speed 19 knots
Route Chartered Out APP
Kaitaki
Year Built 2011
GT 26,375 tons
PAX 500
Beds 272
Lane Meters 2.8km
Speed 23 knots
Route Dublin/Holyhead Dublin/France
Epsilon