icsg 2010 statistical yearbook (2000-2009)ec.europa.eu/competition/consultations/2011...59 60 61 62...
TRANSCRIPT

ICSG 2010 STATISTICAL YEARBOOK
(2000-2009)
Published July 2010
INTERNATIONAL COPPER STUDY GROUP Annual Publication
Vol. 7
www.icsg.org

International Copper Study Group Tel: 351 - 21 - 351 3870 Rua Almirante Barroso, n. 38, 6th Floor Fax: 351 - 21 - 352 4035 1000-013 Lisbon http://www.icsg.org Portugal E-mail: [email protected] INTERNATIONAL COPPER STUDY GROUP OFFICERS FOR 2010 Chairman Mr Erik Heimlich (Chile) Vice-Chairman Mr Carlos Caxaria (Portugal) Vice-Chairman Mr Bian Gang (China)
STANDING COMMITTEE Chairman Mr Salim Bhabhrawala (U.S.A) Vice-Chairman Mr Alejandro Alarcón Garza (Mexico) Finance Committee Chairman Mr Henrique Santos (Portugal)
ENVIRONMENTAL AND ECONOMIC COMMITTEE Chairman Ms Ajita Bajpai Pande (India) Vice-Chairman Ms Magdalena Kopijkowska-Gozuch (Poland)
STATISTICAL COMMITTEE Chairman Mr Daniel Edelstein (U.S.A.) Vice-Chairman Mr Juan Cristóbal Ciudad (Chile)
INDUSTRY ADVISORY PANEL Chairman Mr Mark Loveitt (IWCC)
SECRETARIAT Secretary-General Mr Don Smale ([email protected]) Chief Statistician Ms Ana Rebelo ([email protected]) Head of Environment and Economics Mr Carlos Risopatron ([email protected]) Economist Mr Joseph Pickard ([email protected]) Secretary Ms Fátima Cascalho ([email protected])
ICSG 2009 Statistical Yearbook- July 2010
- 2 -

ICSG 2010 STATISTICAL YEARBOOK Contents
THE INTERNATIONAL COPPER STUDY GROUP DEFINITIONS AND EXPLANATORY NOTES ACKNOWLEDGEMENTS SUMMARY TABLES TABLE 1. World Refined Copper Production and Us-
age Trends TABLE 2. Copper Mine, Smelter, and Refinery Produc-
tion by Geographical Area COPPER STATISTICS TABLE 3. World Copper Mine Production TABLE 4. World Copper Smelter Production TABLE 5. World Copper Refinery Production TABLE 6. World Copper Production by Solvent Ex-
traction and Electrowinning Processes TABLE 7. World Refined Copper Usage TABLE 8. Refined Copper Stocks A. At Metal Exchanges B. At Producers/Consumers/Merchants Copper Stocks Charts TABLE 9. LME, COMEX and U.S. Producers Prices TABLE 10 World Copper and Copper Alloy Semifabri-
cates Production
WORLD TRADE IN COPPER TABLE 11. Copper Ores and Concentrates A. Imports B. Exports TABLE 12. Copper Blister and Anodes A. Imports B. Exports TABLE 13. Refined Copper A. Imports B. Exports TABLE 14. Copper Alloy Ingots A. Imports B. Exports TABLE 15. Copper and Copper Alloy Semifabricates
A. Imports B. Exports
TABLE 16. Copper and Copper Alloy Scrap A. Imports B. Exports
Page 4
5
7
9
10
17 19 21 24
25
26 27 28 29 30
32 33
34 35
36 37
38 40
42 45
48 50
COUNTRY COPPER BALANCES TABLE 17. Copper balances of select countries
Argentina Australia Belgium Brazil Canada Chile China Finland France Germany Greece India Indonesia Iran Italy Japan Kazakhstan Korean Rep. Mexico Peru Poland Portugal Russian Fed. Spain Sweden Taipei, China UK USA Serbia Zambia
TRADE MATRIX (imports and exports by origin and
destination TABLE 18 A & B Copper Ores and Concentrates TABLE 19 A & B Copper Blister and Anodes TABLE 20 A & B Refined Copper TABLE 21 A & B Copper and Copper Alloy Scrap INGOTS AND FOUNDRY PRODUCTION TABLE 22. Copper Alloy Foundry Production TABLE 23. Copper Alloy Ingot Production ICSG PUBLICATIONS ORDER FORM CHARTS CHART 1. Trends in World Refined Copper Stocks and Price CHART 2. Main Copper Producing and Consuming Regions (charts A to C) CHART 3. World Copper Balance/Price CHART 4. World Copper Production CHART 5. Regional Mine Production CHART 6. Regional Refinery Production CHART 7. Regional Copper Usage 2010 The contents of this publication may not be
photocopied, distributed, scanned into electronic form, or otherwise reproduced in whole or in part, without express permission of the International Copper Study Group. Reasonable extracts are per-mitted for the purpose of comment or review pro-vided the International Copper Study Group is ac-knowledged as the source.
Page
52 53 54 55 56 57 58 59 60 61
62 64 66 70
74 74
80
8
11
75 76 77 78 79
SPECIAL EDITION
This Yearbook is an International Copper Study Group publication that provides 10 years of copper statistics, revised and updated. The Yearbook serves as a useful tool for consultations and analysis on the longer term evolution of world copper production, us-age, stocks and prices. Subscribers to the Copper Bulletin receive the Yearbook as part of their annual subscription.
ICSG 2009 Statistical Yearbook- July 2010
- 3 -

THE INTERNATIONAL COPPER STUDY GROUP
Introduction The International Copper Study Group (ICSG) was formally established as an autonomous intergovern-mental organisation on January 23, 1992, following a series of Ad Hoc meetings sponsored by the United Nations (UNCTAD) in 1986 and 1987 to review the world situation of copper and discuss the need for such a body. A negotiating conference was convened in June 1988 and, by February 1989, the terms of ref-erence were finalised. The inaugural meeting was held in June 1992, and in November 1992, the Group’s headquarters site was selected to be Lisbon, Portugal. Objectives and Functions The mandate of the Study Group provides for en-hanced co-operation on issues related to copper and a forum in which governmental consultations on copper can be held. The Study Group is to provide a forum for all market participants, both producers and con-sumers, to examine their common problems and carry out open dialogue and free exchange of information. Greater market transparency is an important goal of the Group through more complete reliable and up-to-date statistics, as well as through special investiga-tions and studies. Greater transparency in the market should aid companies in choosing correct market strategies. A better balance between supply and de-mand is thus more likely. The principal functions of the Group are to conduct consultations and exchanges of information on the international copper economy; to improve statistics on copper; to undertake studies on issues of the Group; and to consider special problems or difficulties that exist or may arise, in the international copper econ-omy. The Group shall hold discussions among mem-bers and third parties, such as copper research and market development organisations, on ways and means of increasing the demand and developing the market of copper, and within this framework, suggest market development studies that would be directed to, and undertaken by, established market development organisations. The Group shall offer to facilitate co-ordination between these organisations and support the extension of market development activities The Study Group will endeavour to provide its mem-bership with the most accurate, comprehensive and timely information on capacities, production, usage, trade, stocks, prices, technologies, research develop-ment, and in other areas that may influence the supply and demand for copper.
International Commodity Body The Study Group was accepted as an “International Commodity Body” (ICB), under the Common Fund for Commodities (CFC). The CFC is an international financial institution financed by contributions from United Nations members. The Common Fund can finance special studies aimed at improving the struc-tural conditions of the market through grants proposed by organisations designated as ICBs. The Study Group may organise discussions between its mem-bers, and between them and third parties, in order to conduct studies and projects related to copper market development and research. If the Study Group re-search is financed by the Common Fund, third party market development and research institutions will carry it out. Membership Membership is open to any country involved in cop-per production, usage, or international trade, and any international governmental organisation competent to negotiate, conclude and implement international agreements, in particular related to commodities. The current members are: Belgium Chile China Finland France Germany Greece India Italy Japan Luxembourg Mexico Netherlands Peru Poland Portugal Russian Fed. Serbia Spain Sweden United States EC- European Community Organisational Structure and Meetings The General Session of member countries is the su-preme authority of the ICSG. The executive head of the ICSG is the Secretary General, assisted by a pro-fessional staff at the Group’s Lisbon headquarters. The detailed work program is co-ordinated by subor-dinate Committees, such as the Standing, Finance, Statistical, Environmental and Economic. An Indus-try Advisory Panel provides expert advice to the Study Group and is composed of copper industry representa-tives. The ICSG meets in General Session once a year. Meetings of all committees are held immedi-ately ahead of the General Session. A second session is also held near year-end for the Standing, Statistical and Environmental and Economic Committees.
ICSG 2009 Statistical Yearbook- July 2010
- 4 -

DEFINITIONS AND EXPLANATORY NOTES
PRODUCTION Mine production The goal is to achieve uniform contained copper sta-tistics for mine production. Contained copper is de-fined as the analytical amount of copper outputted in concentrates and precipitates. Where applicable, statistical notation is made for sol-vent-extraction/electrowinning (SX-EW) at the mine level to distinguish this production from copper de-rived from concentrates and cement copper. While only one SX-EW category is shown at the mine level, SX-EW is separated statistically into two marketable types at the smelter and refinery levels. High-grade electrowon (Commercial Cathode) is SX-EW produc-tion that can be treated as refined cathode and sold as such. Low-grade electrowon is SX-EW production that must be re-refined. Smelter Production Smelter production is divided into three groupings relating to the source of material used in producing blister, anode and other smelter-level products. The three categories are: Primary, from concentrates and precipitates; Low-grade electrowon from SX-EW and RLE plants; and Secondary, from scrap materials. Electrowon copper resulting from roast-leach-electrowon (RLE) processes is treated as from con-centrates at the mine-level and, as from electrowin-ning at the smelter and refinery levels. Low-grade electrowon from scrap is included in secondary smelter-production. To avoid double counting blister and anode, purchased and returned anode is excluded. Copper of Cu-Ni-matte is treated as smelter produc-tion at the source. Refinery Production Refinery production is broken into three statistical source categories: Primary (electrolytic and fire-refined); Secondary (electrolytic and fire-refined); and Electrowon (High-grade SX-EW) refined produc-tion. Electrowon from copper-nickel matte is in-cluded in the primary category where this is neces-sary. USAGE Recognising that metals are not consumed, but rather used, and therefore available for future reuse and re-cycling, the ICSG refers to refined copper production and refined copper usage in its reports. Copper usage represents refined copper used by semi-fabricators, i.e., at wire-rod mills, brass mills, foun-dries, chemical plants and other miscellaneous manu-facturers. Usage data is either directly reported by the
country, or the Secretariat estimates an apparent usage using the following formula: Refined copper produc-tion + refined imports - refined exports + refined beginning stocks - ending stocks. Some countries, such as Canada, use shipments of refined copper where stocks at consumers and producers are inher-ently considered. Metal Exchanges warehouse stocks are treated according to the trade reporting scheme of a particular country. For many countries, some of the parts of this formula are missing, i.e., some countries do not produce refined copper or hold refined stocks. Trade data is available for most countries STOCKS Refined copper stocks are reported where held by the exchanges, the London Metal Exchange (LME), the Commodity Metal Exchange (COMEX), New York, Shanghai Futures Exchange (SHFE) and by consum-ers, producers and governments. Merchant stocks are included where it is certain that these are nonduplica-tive to those already reported. Only refined products at plant sites are included. Items such as wire rod, tube and other semifabricated forms are not included. TRADE Trade in all forms of crude, unwrought, wrought and semifabricated products and scrap are reported. In the case of semifabricates, only the major groupings are shown. Trade in copper and copper alloy ingot and master alloys are reported. Although there are more than 370 copper and copper alloys cast, the ingot type is not identified in the trade classes. Master alloys and hardeners are copper based alloys cast with high alloying element content and are used for producing copper alloys. Quantities reported are indicated on the tables. Most data is in copper content, but where gross weight is reported, this is indicated on the table. In the case of copper ores and concentrates, most countries only report trade in gross weight. In this case, estimates of copper content of concentrates are made on information available. Trade data originates from reporting countries.
ICSG 2009 Statistical Yearbook- July 2010
- 5 -

Harmonised System Trade Codes for Copper and Copper Products used in ICSG Copper Bulletin Tables
Ores & Concentrates 2603 Matte 7401 10 Cement Copper (Precipitates) 7401 20 Blister & Anode 7402 Refined Copper Cathodes
Wire Bars Billets Other
7403 11 7403 12 7403 13 7403 19
Ingots Copper Alloy -Cu-Zn -Cu-Sn -Cu-Ni, Cu-Ni-Zn -Other
7403 21 7403 22 7403 23 7403 29
Master Alloy 7405 Total
-Bars & Profiles -Wire -Plates, Sheets & Strips -Foils, Not Backed -Tubes -Powders & Flakes
7407 7408 7409 7410 1 7411 7406
Semifabricates Copper -Bars & Profiles -Wire (Rod) --Section > 6 mm --Other -Plates, Sheets & Strips --In Coils --Other -Foils -Tubes
7407 10 7408 11 7408 19 7409 11 7409 19 7410 11 7411 10
Copper Alloy -Bars & Profiles --Cu-Zn --Cu-Ni, Cu-Ni-Zn --Other -Wire --Cu-Zn --Cu-Ni, Cu-Ni-Zn --Other -Plates, Sheets & Strips --Cu-Zn, in Coils --Cu-Zn, Other --Cu-Sn, in Coils --Cu-Sn, Other --Cu-Ni, Cu-Ni-Zn --Other -Foils -Tubes --Cu-Zn --Cu-Ni, Cu-Ni-Zn --Other
7407 21 7407 22 7407 29 7408 21 7408 22 7408 29 7409 21 7409 29 7409 31 7409 39 7409 40 7409 90 7410 12 7411 21 7411 22 7411 29
Total 7404 Scrap Copper 7404 00 10 Copper Alloy -- Cu-Zn
-- Other 7404 00 91 7404 00 99
ICSG 2009 Statistical Yearbook- July 2010
- 6 -

PRICES Refined copper prices not only relate to the refined shape and its quality, but also to the manner in which it is priced; i.e., through producer's annually negoti-ated contracts, or through the commodity exchanges. Refined copper prices reported in this bulletin are the average high grade cathode spot price at the London Metal Exchange and at the COMEX, and the U.S. Producer Price. The U.S. producer price is based on estimated U.S. refined cathode selling prices of U.S. producers, quoted on a delivered basis. The producer price is weighted by each producer's estimated share of shipments. Futures contracts have changed gradu-ally over the years to correspond to the most active markets. At the end of December 1989, COMEX dropped the standard contract, and adopted a high-grade contract. The LME dropped its standard cath-ode contract in January 1989 and currently trades only the Grade A (high-grade) cathode contract. Copper has been traded internationally on the LME since January 1, 1877. Trading on the COMEX began on May 15, 1929. GEOGRAPHIC GROUPINGS The geographic groups used in this report include the following countries: America - North, Central and South American coun-tries.
Africa - Includes all African countries.
Europe - Includes all European countries, including Turkey. All of the former U.S.S.R. countries are in-cluded in Europe, unless otherwise noted.
Asia - Includes countries of both the Middle East and the Far East, such as China, Israel, Iran, India, Indo-nesia, Japan, Mongolia, Pakistan, Philippines, South and North Korea, and Thailand.
Oceania - Includes Australia, Papua New Guinea and New Zealand.
EU-15 - Includes Austria, Belgium, Denmark, Finland, France, Germany, Greece, Ireland, Italy, Luxembourg, the Netherlands, Portugal, Spain, Swe-den and United Kingdom.
EU-25 - Includes EU-15 countries plus Cyprus, Czech Republic, Estonia, Hungary, Latvia, Lithuania, Malta, Poland, Slovakia, Slovenia.
EU-27 - Includes EU-25 countries plus Bulgaria and Romania.
RECYCLING Scrap statistics are collected at each processing level. Refined secondary material represents scrap that has been fire-refined, or that has been converted to anode at the smelter level and then electrolytically refined. Direct, or Remelt scrap is secondary material that can be used directly in a furnace without cleanup through the use of fluxes and poling and re-refining. Remelt scrap is made up largely of purchased "new" or "manufacturing” return scrap, whereas most scrap for refining is made up of "old" used copper items. New scrap has a shelf life of only a few months, whereas old scrap has an average shelf life of about 20 years. Old scrap is considered to be a resource that competes with newly mined material. Refined scrap is ap-proximately 70% old scrap, on average. Trade is re-ported in two general scrap types, unalloyed copper scrap and alloyed copper-base scrap. Ashes and resi-dues are generally made up of materials containing less than 30% copper. QUANTITIES All quantities in this report are in metric tonnes unless otherwise indicated. Prices will be given in cents per pound and U.S. dollars per metric tonne. Most items are in copper content. Gross weight items are indi-cated on the tables. SYMBOLS Estimates are indicated in italics. A zero will appear where the amount is less than one-half unit. A (p) indicates preliminary data and blank spaces indicate no available data, or zero quantity. All explanatory footnotes will appear at the end of tables. World To-tals are independently calculated, consequently they may not add to the detail shown in the tables. Ton-nes-per-year may be abbreviated as tpy. ACKNOWLEDGEMENTS Compilation of this Bulletin is made possible thanks to the cooperation of member and nonmember gov-ernments, public and private sector statistical organi-sations, international organisations, industry associa-tions and companies, and market and research institu-tions.
ICSG 2009 Statistical Yearbook- July 2010
- 7 -

0
100
200
300
400
500
600
700
800
900
1,000
1,100
1,200
1,300
1,400
1,500
1,600
1,700
1,800
1,900
2,000
2,100
2,200
2000 2001 2002 2003 2004 2005 2006 2007 2008 2009
Tho
usan
d m
etric
tonn
es, c
oppe
r
0
15
30
45
60
75
90
105
120
135
150
165
180
195
210
225
240
255
270
285
300
315
330
Pric
e LM
E (
US
cen
ts/p
ound
)
Exchanges Producers
Merchants Consumers
Price LME (UScents/pound) Refined Copper Usage (monthly average)
Chart 1: Trends in World Refined Copper Stocks and Price
Stocks are end of period. Prices are averages for the period.
ICSG 2009 Statistical Yearbook- July 2010
- 8 -

TABLE 1. WORLD REFINED COPPER PRODUCTION AND USAGE TRENDS 2000-2009
Thousand metric tonnes, copper2000 2001 2002 2003 2004 2005 2006 2007 2008 2009
p/
World Mine Production 13,203 13,633 13,577 13,757 14,594 14,924 14,991 15,474 15,528 15,754
World Mine Capacity 14,277 14,532 15,193 15,338 16,072 16,826 17,141 18,098 18,739 19,513
Mine Capacity Utilization (%) 92.5 93.8 89.4 89.7 90.8 88.7 87.5 85.5 82.9 80.7
Primary Refined Production 12,696 13,746 13,457 13,485 13,848 14,411 14,678 15,191 15,399 15,466
Secondary Refined Production 2,100 1,892 1,898 1,786 2,069 2,161 2,613 2,743 2,823 2,911
World Refined Production (Secondary+Primary)
14,796 15,638 15,354 15,272 15,918 16,572 17,291 17,934 18,222 18,377
World Refinery Capacity 17,145 17,760 18,320 18,804 19,179 20,250 20,604 21,559 22,462 23,503
Refinery Capacity Utilization (%) 86.3 88.1 83.8 81.2 83.0 81.8 83.9 83.2 81.1 78.2
Secondary Refined as % in Total Refined Prod.
14.2 12.1 12.4 11.7 13.0 13.0 15.1 15.3 15.5 15.8
World Refined Usage 1/ 15,185 15,014 15,210 15,717 16,833 16,683 17,058 18,239 18,056 18,198
Four Weeks of World Refined Usage
1,168 1,155 1,170 1,209 1,295 1,283 1,312 1,403 1,389 1,400
Refined Stocks End of Period
1,291 1,992 2,048 1,780 923 867 1,131 1,027 1,161 1,428
Period Stock Change -344 702 55 -267 -857 -56 264 -105 135 267
Refined Balance 2/ -389 624 144 -446 -915 -112 233 -305 167 179
LME Copper Price 3/ 1,814 1,578 1,558 1,780 2,868 3,684 6,727 7,126 6,952 5,164
Comex Copper Price 4/ 83.97 72.57 71.69 80.99 129.17 168.31 309.42 322.84 313.18 236.54
p/ Preliminary 1/ Apparent refined usage is used for the European Union instead of the accumulation of the individual countries' refined usage 2/ Surplus or deficit is calculated using total refined production minus refined usage. 3/ Averages for the period in US dollars per ton of copper 4/ Averages for the period in US cents per pound of copper
Each month the ICSG issues the above table, with monthly data, in a Press Release which is also included in ICSG's web site:
http://www.icsg.org
ICSG 2009 Statistical Yearbook- July 2010
- 9 -

TABLE 2. COPPER MINE, SMELTER, REFINERY PRODUCTION AND REFINED COPPER USAGE BY GEOGRAPHICAL AREA
Thousand metric tonnes, copper
2000 2001 2002 2003 2004 2005 2006 2007 2008 2009
p/
AFRICAMine 477.6 511.4 522.2 581.0 611.5 670.6 738.7 822.9 952.0 1,075.7Smelter 373.5 392.1 420.3 418.7 435.4 410.1 450.2 385.3 371.2 465.7Refinery 347.4 413.2 467.1 474.3 528.1 529.3 553.1 589.0 581.8 672.4Refined Usage 100.8 130.5 165.8 171.3 202.2 229.5 236.7 271.9 298.5 306.3
AMERICAMine 7,800.9 8,050.5 7,752.3 8,039.4 8,867.2 8,831.6 8,893.5 9,262.5 9,165.5 8,969.0Smelter 3,954.3 4,031.9 3,504.4 3,337.4 3,402.0 3,445.4 3,460.8 3,396.7 3,216.4 3,189.1Refinery 6,100.2 6,408.8 5,927.1 5,699.1 5,782.3 5,745.0 5,684.4 5,717.1 5,791.7 5,695.0Refined Usage 4,306.4 3,863.8 3,409.4 3,409.2 3,656.3 3,530.8 3,338.2 3,219.7 3,117.2 2,553.4
ASIA (post 1992)Mine 2,480.8 2,581.4 2,675.5 2,567.5 2,554.3 2,780.8 2,759.2 2,810.6 2,842.7 3,185.7Smelter 4,367.4 4,689.2 4,945.8 5,284.7 5,474.1 6,092.4 6,524.0 7,012.7 7,461.2 7,510.6Refinery 4,526.6 4,817.1 4,967.2 5,285.4 5,652.4 6,275.5 6,993.8 7,626.4 7,740.5 8,057.3Refined Usage 5,767.2 6,030.3 6,766.1 7,179.6 7,774.1 7,933.9 8,069.7 9,455.0 9,600.4 11,338.1
EUROPE (post 1992)Mine 1,411.6 1,414.7 1,547.9 1,533.4 1,533.2 1,531.6 1,546.1 1,537.6 1,524.4 1,503.0Smelter 2,989.2 3,113.3 3,156.0 3,036.0 3,125.2 3,141.5 3,148.4 3,046.0 3,096.8 2,923.8Refinery 3,334.1 3,438.5 3,450.1 3,328.8 3,465.0 3,553.1 3,630.8 3,559.9 3,606.9 3,506.8Refined Usage 4,835.8 4,817.8 4,681.4 4,773.7 5,033.0 4,834.0 5,270.4 5,145.2 4,888.9 3,871.0
OCEANIAMine 1,032.1 1,074.8 1,079.1 1,035.7 1,027.5 1,109.2 1,053.2 1,040.4 1,043.2 1,020.7Smelter 393.0 457.1 455.9 435.0 443.2 411.9 377.0 398.5 446.9 422.0Refinery 487.3 560.1 542.6 484.0 490.0 468.8 428.9 441.6 501.5 445.5Refined Usage 174.5 171.9 187.3 183.3 167.0 155.2 143.4 147.6 150.7 129.5
WORLD TOTALSMine 13,203.0 13,632.8 13,577.1 13,757.0 14,593.7 14,923.7 14,990.6 15,473.9 15,527.8 15,754.1
Smelter 12,077.4 12,683.6 12,482.3 12,511.8 12,879.8 13,501.2 13,960.3 14,239.2 14,592.6 14,511.2
Refinery 14,795.6 15,637.8 15,354.1 15,271.6 15,917.8 16,571.7 17,291.0 17,934.0 18,222.4 18,377.1
Refined Usage 15,184.7 15,014.3 15,210.0 15,717.1 16,832.7 16,683.3 17,058.4 18,239.4 18,055.7 18,198.2
WESTERN COUNTRIESMine 10,855.2 11,188.0 10,992.8 11,132.7 11,848.3 12,236.2 12,121.5 12,612.7 12,518.6 12,858.0
Smelter 8,851.0 9,151.2 8,783.7 8,611.1 8,642.1 8,915.1 9,164.7 9,190.2 9,097.2 8,997.2
Refinery 11,576.0 12,128.9 11,761.4 11,454.7 11,583.7 11,824.7 12,134.8 12,331.5 12,371.3 12,168.8
Refined Usage 12,695.8 11,884.6 11,630.3 11,735.7 12,411.2 11,951.6 12,249.6 12,037.0 11,678.5 10,136.8
EUROPEAN UNION (EU-15)Mine 188.9 179.4 165.9 176.1 194.9 199.2 185.0 172.9 166.9 177.2
Smelter 1,367.7 1,425.8 1,450.0 1,336.4 1,335.7 1,313.9 1,342.2 1,318.3 1,423.7 1,305.5
Refinery 1,819.7 1,859.7 1,905.4 1,784.7 1,783.4 1,792.5 1,828.3 1,801.7 1,894.6 1,791.6
Refined Usage 4,016.3 3,918.4 3,742.4 3,712.7 3,793.6 3,471.7 3,835.9 3,623.8 3,429.1 2,756.2
EUROPEAN UNION (EU-27)Mine 757.6 774.8 787.1 799.2 841.7 821.5 805.7 742.3 709.4 728.6
Smelter 2,046.3 2,113.8 2,188.7 2,145.6 2,156.6 2,125.9 2,130.4 2,045.9 2,211.9 2,093.0
Refinery 2,357.0 2,426.5 2,477.6 2,380.0 2,414.5 2,433.5 2,473.0 2,425.6 2,566.1 2,511.3
Refined Usage 4,331.5 4,277.6 4,069.6 4,019.0 4,118.5 3,823.3 4,197.4 4,052.9 3,815.6 3,095.8
p/ Preliminary data.
AFRICA includes Algeria, Botswana, Congo, Egypt, Morocco, Mozambique, Namibia, South Africa, Tunisia, Zaire, Zambia and Zimbabwe.AMERICA includes Argentina, Bolivia, Brazil, Canada, Chile, Colombia, Cuba, Ecuador, Mexico, Peru, United States and Venezuela.ASIA includes China, Cyprus, Hong Kong (China), India, Indonesia, Iran, Israel, Japan, Malaysia, Mongolia, Myanmar, North Korea, Oman, Pakistan Philippines, Republic of Korea, Saudi Arabia, Singapore, Taipei (China), Thailand, and Vietnam and former U.S.S.R. countries: Armenia, Azerbeijan, Georgia, Kazakhstan, Krygyzstan, Taijikistan and Uzbekistan (according to U.N. classification).EUROPE (post 1992) includes Albania, Austria, Belgium-Luxembourg, Bulgaria, Croatia, Czech Rep., Denmark, Finland, France, Germany, Greece, Hungary, Ireland, Italy, Macedonia, Netherlands, Norway, Poland, Portugal, Romania, Spain, Slovakia, Sweden, Switzerland, Turkey, United Kingdom, Serbia and former U.S.S.R. countries: Belarus, Estonia, Latvia, Lithuania, Moldova, Russian Federation and Ukraine (according to U.N. classification).EUROPEAN UNION (EU-15) Includes Austria, Belgium, Denmark, Finland, France, Germany, Greece, Ireland, Italy, Luxembourg, the Netherlands, Portugal, Spain, Sweden and United KingdomOCEANIA includes Australia, New Zealand and Papua New Guinea.NB: WESTERN COUNTRIES will be published as long as requested by clients
ICSG 2009 Statistical Yearbook- July 2010
- 10 -

Chart 2-A, COPPER PRODUCING AND CONSUMING REGIONS (2000,2009)(% SHARE OF WORLD TOTALS)
2000 2009
2000 2009
2000 2009
COPPER MINE PRODUCTION(% OF WORLD COPPER MINE PRODUCTION)
REFINED COPPER USAGE(% OF WORLD REFINED COPPER USAGE)
REFINED COPPER PRODUCTION(% OF WORLD REFINED COPPER PRODUCTION)
North america; 25%
Africa; 1%
Asia; 38%
Other Europe; 3,3%
EU; 29%
Oceania; 1,1%
Latin America; 3%
Oceania; 0,7%
Latin America; 3%
North america; 11%
Africa; 2%Other Europe; 4,3%
Asia; 62%
EU; 17%
Latin America; 22,5%
North america; 18,7%
Asia; 30,6%
EU; 15,9%
Other Europe; 6,6%
Oceania; 3,3%Africa; 2,3%
Latin America; 21,4%
North america; 9,6%
Africa; 3,7%
Oceania; 2,4%
Other Europe; 5,4%
EU; 13,7%
Asia; 43,8%
North america; 18,7%
Oceania; 7,8%
Latin America; 40,4%
EU; 5,7%
Asia; 18,8%
Africa; 3,6%
Other Europe; 5,0%
Oceania; 6,5%
Latin America; 44,7%
Asia; 20,2%
EU; 4,6%
Other Europe; 4,9%
Africa; 6,8%
North america; 12,3%
ICSG 2009 Statistical Yearbook- July 2010
- 11 -

Chart 2-B, COPPER PRODUCING AND CONSUMING REGIONS (% CHANGE FROM 2000 TO 2009)
COPPER MINE PRODUCTION(% CHANGE FROM 2000 TO 2009)
REFINED COPPER USAGE(% CHANGE FROM 2000 TO 2009)
REFINED COPPER PRODUCTION(% CHANGE FROM 2000 TO 2009)
-60%-40%-20%
0%20%40%60%80%
100%120%140%160%180%200%220%
Africa North america Latin America Asia EU Other Europe Oceania
-40%
-20%
0%
20%
40%
60%
80%
100%
Africa North america Latin America Asia EU Other Europe Oceania
-40%
-20%
0%
20%
40%
60%
80%
100%
120%
140%
Africa North america Latin America Asia EU Other Europe Oceania
ICSG 2009 Statistical Yearbook- July 2010
- 12 -

Chart 2-C, COPPER PRODUCING AND CONSUMING REGIONS (CHANGE IN TONNES FROM 2000 TO 2009)
COPPER MINE PRODUCTION(TONS CHANGE FROM 2000 TO 2009)
REFINED COPPER USAGE(TONS CHANGE FROM 2000 TO 2009)
REFINED COPPER PRODUCTION(TONS CHANGE FROM 2000 TO 2009)
-2.000-1.500-1.000
-5000
5001.0001.5002.0002.5003.0003.5004.0004.5005.0005.500
Africa North america Latin America Asia EU Other Europe Oceania
Th
ou
san
d T
on
s C
u
-1.500
-1.000
-500
0
500
1.000
1.500
2.000
2.500
3.000
3.500
Africa North america Latin America Asia EU Other Europe Oceania
Th
ou
san
d T
on
s C
u
-750
-500
-250
0
250
500
750
1.000
1.250
1.500
1.750
Africa North america Latin America Asia EU Other Europe Oceania
Th
ou
san
d T
on
s C
u
ICSG 2009 Statistical Yearbook- July 2010
- 13 -

Chart 2-D, MAIN COPPER PRODUCING AND CONSUMING COUNTRIES (2000,2009)(% SHARE OF WORLD TOTALS)
2000 2009
2000 2009
2000 2009
COPPER MINE PRODUCTION(% OF WORLD COPPER MINE PRODUCTION)
REFINED COPPER USAGE(% OF WORLD COPPER REFINED USAGE)
REFINED COPPER PRODUCTION(% OF WORLD COPPER REFINED PRODUCTION)
United States; 20%
Others; 18% China; 12%
Turkey; 1,6%
Germany; 9%Russian Fed.;
1,2%
Spain; 1,8%
Taiwan; 4,1%
Italy; 4,1% Japan; 8,9%India; 1,7%
Korean Rep.; 5,7%
Mexico; 3,2%France; 3,8%
Brazil; 2,2%
Belgium; 2,3%China; 40%
United States; 9%
Others; 15%
Belgium; 1,3%
Russian Fed.; 2,1%
Taiwan; 2,7%
Germany; 6%
Italy; 2,9%
Brazil; 1,8%
India; 3,4%
Mexico; 1,5%France; 1,7%
Korean Rep.; 5,0%
Japan; 4,8%
Spain; 1,9%Turkey; 1,8%
China; 9,2%
Chile; 18,0%
Japan; 9,7%
Korean Rep.; 3,2%
Germany; 4,8%
Poland; 3,3%
Australia; 3,3%Peru; 3,1%
India; 1,8%Russian Fed.;
5,7%
Others; 15,1%
United States; 12,1%
Zambia; 1,5%Belgium; 2,9%
Kazakhstan; 2,7%
Canada; 3,7%China; 22,4%
Chile; 17,8%
Australia; 2,4%
Peru; 2,3%
Japan; 7,8%
Poland; 2,7%
Germany; 3,6%
Korean Rep.; 2,9%
India; 3,9%
Others; 14,8%
Russian Fed.; 4,8%
United States; 6,3%
Zambia; 2,3%Belgium; 2,0%
Kazakhstan; 2,0%
Canada; 1,8%
Chile; 34,9%
Peru; 4,2%
Zambia; 1,9%
Mexico; 2,8%
Iran; 1,0%
Poland; 3,4%
Kazakhstan; 3,3%
Congo; 0,2%
Canada; 4,8%
United States; 11,1%
Brazil; 0,2%
Indonesia; 7,6% China; 4,5%
Australia; 6,3%
Russian Fed.; 4,0%
Others; 9,8%
Chile; 34,2%
Indonesia; 6,3%
Australia; 5,4%
Russian Fed.; 4,3%
China; 6,5%
Others; 8,9%Mexico; 1,5%
Iran; 1,7%
Canada; 3,1%
Poland; 2,8%
Kazakhstan; 2,5%
Congo; 1,9%
Zambia; 3,7%
Peru; 8,1%
Brazil; 1,4%
United States; 7,6%
ICSG 2009 Statistical Yearbook- July 2010
- 14 -

Chart 2-E, MAIN COPPER PRODUCING AND CONSUMING COUNTRIES (% CHANGE FROM 2000 TO 2009)
COPPER MINE PRODUCTION(% CHANGE FROM 2000 TO 2009)
REFINED COPPER USAGE(% CHANGE FROM 2000 TO 2009)
REFINED COPPER PRODUCTION(% CHANGE FROM 2000 TO 2009)
-60%
-40%
-20%
0%
20%
40%
60%
80%
100%
120%
140%
160%
China UnitedStates
Germany KoreanRep.
Japan India Italy Taiwan RussianFed.
Spain Turkey Brazil France Mexico Belgium Others
Note: (*) China up by 283%
(*)
-60%
-40%
-20%
0%
20%
40%
60%
80%
100%
120%
140%
160%
China Chile Japan UnitedStates
RussianFed.
India Germany KoreanRep.
Poland Australia Peru Zambia Belgium Kazakhstan Canada Others
Note: (*) China and India up by 204% and 175% respectively.
(*) (*)
-60%
-40%
-20%
0%
20%
40%
60%
80%
100%
120%
140%
160%
Chile Peru UnitedStates
China Indonesia Australia RussianFed.
Zambia Canada Poland Kazakhstan Congo Iran Mexico Brazil Others
Note: (*) Brazil and Congo up by 598% and 813% respectively.
(*) (*)
ICSG 2009 Statistical Yearbook- July 2010
- 15 -

Chart 2-F, MAIN COPPER PRODUCING AND CONSUMING COUNTRIES (IN TONNES CHANGE FROM 2000 TO 2009)
COPPER MINE PRODUCTION(TONS CHANGE FROM 2000 TO 2009)
REFINED COPPER USAGE(TONS CHANGE FROM 2000 TO 2009)
REFINED COPPER PRODUCTION(TONS CHANGE FROM 2000 TO 2009)
-1.500-1.000
-5000
5001.0001.5002.0002.5003.0003.5004.0004.5005.0005.500
China UnitedStates
Germany KoreanRep.
Japan India Italy Taiwan RussianFed.
Spain Turkey Brazil France Mexico Belgium Others
Th
ou
san
d T
on
s C
u
-1.000-750-500-250
0250500750
1.0001.2501.5001.7502.0002.2502.5002.750
China Chile Japan UnitedStates
RussianFed.
India Germany KoreanRep.
Poland Australia Peru Zambia Belgium Kazakhstan Canada Others
Th
ou
san
d T
on
s C
u
-500
-250
0
250
500
750
1.000
Chile Peru UnitedStates
China Indonesia Australia RussianFed.
Zambia Canada Poland Kazakhstan Congo Iran Mexico Brazil Others
Th
ou
san
d T
on
s C
u
ICSG 2009 Statistical Yearbook- July 2010
- 16 -

TABLE 3. WORLD COPPER MINE PRODUCTIONThousand metric tonnes, copper
COUNTRY Source 2000 2001 2002 2003 2004 2005 2006 2007 2008 2009
1/ p/
Argentina Concentrates 145.2 191.6 203.7 198.5 176.4 187.3 180.1 180.2 156.9 143.1
Armenia Concentrates 12.2 16.5 16.6 18.1 17.7 16.4 18.0 17.6 18.8 22.6
Concentrates 732.1 769.3 790.7 772.6 795.8 865.3 806.4 829.1 830.5 830.6
Australia SX-EW 96.9 101.8 77.1 67.4 58.3 50.9 52.4 42.1 53.0 23.4
Total 829.0 871.1 867.8 840.0 854.1 916.2 858.8 871.2 883.5 854.0
Botswana Concentrates 21.0 19.2 21.6 27.4 22.5 26.3 24.2 24.4 28.8 29.1
Concentrates 31.0 30.1 30.6 27.3 98.7 130.8 143.6 205.4 216.8 206.7
Brazil SX-EW 0.9 3.8 9.5
Total 31.0 30.1 30.6 27.3 98.7 130.8 143.6 206.3 220.6 216.2
Bulgaria Concentrates 93.3 97.2 95.5 92.2 94.1 94.5 110.4 109.6 105.0 105.0
Concentrates 633.9 633.5 603.5 557.6 562.8 595.5 603.3 594.8 605.4 489.8
Canada SX-EW 1.5 1.6 0.8
Total 633.9 633.5 603.5 557.6 562.8 595.5 603.3 596.2 607.0 490.6
Concentrates 3,229.8 3,200.8 2,978.6 3,251.1 3,776.2 3,735.9 3,669.0 3,724.9 3,356.6 3,276.9
Chile 2/ SX-EW 1,372.6 1,538.2 1,602.0 1,653.1 1,636.3 1,584.6 1,691.8 1,831.9 1,971.0 2,112.4
Total 4,602.4 4,739.0 4,580.6 4,904.2 5,412.5 5,320.5 5,360.8 5,556.8 5,327.6 5,389.3
Concentrates 592.6 587.0 568.0 604.4 742.2 761.6 872.9 928.0 1,076.1 1,009.0
China SX-EW 5.0 8.0 10.0 10.0 12.0 15.0 16.1 18.2 16.6 20.0
Total 597.6 595.0 578.0 614.4 754.2 776.6 889.0 946.2 1,092.7 1,029.0
Colombia Concentrates 2.2 2.3 2.0 1.7 1.6 1.9 0.6 0.9 1.2 1.3
Concentrates 33.0 37.8 28.3 29.1 33.1 51.0 74.4 95.1 161.2 150.4
Congo SX-EW 11.8 29.5 41.5 49.5 53.3 47.4 52.9 150.8
Total 33.0 37.8 40.1 58.6 74.6 100.5 127.7 142.5 214.1 301.2
Cuba Concentrates 1.0 0.5
Cyprus SX-EW 5.2 5.2 3.6 2.5 1.2 0.0 1.0 2.9 3.0 2.4
Dominican Rep. Concentrates 2.6 11.5
Georgia Concentrates 8.0 8.0 10.4 12.0 11.8 9.5 9.3 9.6 12.0 10.0
India Concentrates 33.8 34.3 30.8 28.3 30.0 25.1 29.0 32.9 28.0 29.5
Concentrates 1,004.6 1,047.4 1,162.9 1,003.5 843.2 1,064.9 816.2 788.9 650.6 994.5
Indonesia SX-EW 1.1
Total 1,004.6 1,047.4 1,162.9 1,003.5 843.2 1,064.9 816.2 788.9 650.6 995.6
Concentrates 120.0 124.4 119.2 115.3 135.5 154.6 207.2 236.5 240.8 255.7
Iran SX-EW 9.0 9.2 8.8 12.5 10.8 9.6 9.0 7.7 7.3 6.8
Total 129.0 133.6 128.0 127.8 146.3 164.2 216.2 244.2 248.1 262.5
Italy Concentrates 0.8 1.0
Japan Concentrates 1.2 0.7 1.0 1.5 1.0 1.0 0.3
Kazakhstan Concentrates 430.2 469.5 473.8 485.4 461.8 401.7 434.1 406.8 419.9 388.9
Concentrates 24.9 54.0
Laos SX-EW 30.5 60.8 62.5 64.1 67.5
Total 30.5 60.8 62.5 89.0 121.5
Macedonia Concentrates 8.0 8.0 8.0 4.0 3.0 7.0 7.4 8.4 7.6
Mauritania Concentrates 5.0 28.8 33.1 36.6
Concentrates 309.0 311.0 260.6 281.0 327.5 336.6 248.0 230.5 172.4 172.7
Mexico SX-EW 55.6 60.6 69.3 76.4 78.1 92.7 86.0 107.0 74.5 65.7
Total 364.6 371.6 329.9 357.4 405.6 429.3 334.0 337.5 246.8 238.4
ICSG 2009 Statistical Yearbook- July 2010
- 17 -

TABLE 3. WORLD COPPER MINE PRODUCTIONThousand metric tonnes, copper
COUNTRY Source 2000 2001 2002 2003 2004 2005 2006 2007 2008 2009
1/ p/
Concentrates 123.2 134.1 132.4 130.3 130.0 126.5 129.7 130.2 126.8 126.5
Mongolia SX-EW 0.6 1.5 1.5 1.6 2.3 2.4 2.4 2.4 2.6 2.5
Total 123.8 135.6 133.9 131.9 132.4 128.9 132.1 132.6 129.4 128.9
Morocco Concentrates 6.5 5.4 5.0 4.9 5.0 5.0 5.0 5.0 5.0 5.0
Myanmar SX-EW 26.4 26.0 27.6 27.9 31.8 34.5 19.5 13.9 3.5
Namibia Concentrates 5.1 15.0 18.0 16.2 13.8 10.7 6.4 9.6 9.0
North Korea Concentrates 12.0 12.0 12.0 12.0 12.0 12.0 12.0 12.0 12.0 12.0
Oman Concentrates 9.1 9.0 19.8
Pakistan Concentrates 3.2 15.0 18.0 20.0 21.3 20.0 20.0
Papua New Guinea Concentrates 203.1 203.8 211.3 195.7 173.4 193.0 194.4 169.2 159.7 166.7
Concentrates 426.8 590.9 688.1 691.4 868.6 843.9 875.4 1,018.2 1,107.7 1,112.0
Peru SX-EW 127.2 131.1 156.5 171.2 167.0 165.5 173.8 172.1 160.1 162.8
Total 554.0 722.0 844.6 862.6 1,035.6 1,009.5 1,049.1 1,190.3 1,267.8 1,274.7
Philippines Concentrates 31.9 23.4 19.3 20.4 16.0 16.3 17.6 22.0 21.3 46.9
Poland Concentrates 454.1 474.0 502.8 505.0 531.0 511.5 497.2 451.9 429.4 439.0
Portugal Concentrates 76.3 82.9 77.2 77.5 95.7 89.5 78.6 90.2 89.6 86.9
Romania Concentrates 16.1 19.1 19.3 23.4 20.4 16.3 12.1 5.0 5.0 5.0
Concentrates 530.0 540.0 662.1 650.0 630.0 638.0 670.2 680.0 695.0 665.7
Russian Fed. SX-EW 2.0 4.8 10.0 10.0 10.0
Total 530.0 540.0 662.1 650.0 630.0 640.0 675.0 690.0 705.0 675.7
Saudi Arabia Concentrates 1.0 2.0
Scandinavia 3/ Concentrates 89.4 85.9 86.5 97.9 97.8 101.9 99.8 76.4 70.3 69.2
Serbia Concentrates 46.0 27.5 30.7 21.3 12.2 12.9 12.0 16.5 18.8 19.0
South Africa Concentrates 162.4 111.3 90.3 89.5 87.0 88.6 89.5 97.0 108.7 107.6
Concentrates 23.3 9.8 1.2 0.6 1.4 7.9 6.6 6.3 7.1 15.4
Spain SX-EW 5.6
Total 23.3 9.8 1.2 0.6 1.4 7.9 6.6 6.3 7.1 21.0
Turkey Concentrates 70.0 64.4 60.0 59.0 49.3 54.1 46.4 81.4 82.9 72.1
Tanzania Concentrates 3.6 3.7 4.0 4.0 4.0 4.0 4.0 4.0 5.0
Concentrates 909.6 731.7 556.9 539.1 590.0 603.1 691.4 690.0 827.0 728.6
United States 4/ SX-EW 557.1 628.2 600.5 591.1 584.0 553.7 530.4 504.2 508.0 475.4
Total 1,466.7 1,360.0 1,157.4 1,130.2 1,174.0 1,156.8 1,221.8 1,194.2 1,335.0 1,204.0
Uzbekistan Concentrates 69.4 77.5 79.9 80.0 80.0 80.0 80.0 80.0 80.0 80.0
Vietnam Concentrates 0.6 1.9 1.2 1.2 1.2 1.2 5.2 11.0 11.0 13.0
Concentrates 184.1 230.0 258.0 299.0 319.5 330.0 350.0 341.0 383.6 447.7
Zambia SX-EW 65.0 87.0 83.0 79.0 82.6 102.8 124.1 168.0 163.0 140.5
Total 249.1 317.0 341.0 378.0 402.1 432.8 474.1 509.0 546.6 588.2
Zimbabwe Concentrates 0.6 2.1 2.5 2.4 2.5 2.7 2.7 2.7 2.7 3.0
Others Concentrates
SX-EW
Concentrates 10,882.3 11,036.0 10,925.3 11,034.8 11,887.8 12,230.1 12,165.3 12,481.2 12,436.4 12,493.3
WORLD SX-EW 2,320.7 2,596.8 2,651.8 2,722.2 2,705.9 2,693.7 2,825.3 2,992.8 3,091.4 3,260.7
TOTALS Total 13,203.0 13,632.8 13,577.1 13,757.0 14,593.7 14,923.7 14,990.6 15,473.9 15,527.8 15,754.1
Source: Official country, company reports and ICSG estimates.p/ Preliminary data.1/ Copper content of concentrates and precipitates unless otherwise noted.2/ Copper content of final shipments (concentrate, blister or cathode)3/ Includes Finland, Norway and Sweden.4/ The United States used to report Cu recoverable in Concentrates as 714 (2001), 887 (2000). Started reporting Cu contained in concentrates in August 2002
ICSG 2009 Statistical Yearbook- July 2010
- 18 -

TABLE 4. WORLD COPPER SMELTER PRODUCTIONThousand metric tonnes, copper in primary and secondary blister and anode
COUNTRY Feed 2000 2001 2002 2003 2004 2005 2006 2007 2008 2009Type p/
Primary 6.8 4.9 4.7 6.2 9.4 9.8 8.8 6.9 6.4 6.4
Armenia Secondary 0.4 2.1 1.8
Total 7.2 7.0 6.5 6.2 9.4 9.8 8.8 6.9 6.4 6.4
Australia Primary 393.0 457.1 455.9 435.0 443.2 411.9 377.0 398.5 446.9 422.0
Austria Secondary 70.0 60.0 60.2 57.1 59.4 52.7 65.9 80.2 94.2 90.8
Belgium Secondary 144.7 138.3 125.9 117.5 107.7 97.2 114.6 115.2 124.5 114.4
Botswana Primary 21.0 19.2 21.6 27.4 21.2 28.1 29.7 27.0 25.0 24.7
Primary 170.0 204.3 173.8 170.3 181.7 156.6 179.6 171.1 184.4 176.4
Brazil Secondary 15.0 8.0 16.9 20.4 23.0 40.0 40.0 40.0 39.1 30.6
Total 185.0 212.3 190.7 190.7 204.7 196.6 219.6 211.1 223.5 206.9
Primary 163.0 134.7 167.0 199.3 215.8 225.0 217.0 217.6 257.1 256.2
Bulgaria Secondary 17.0 22.2 14.5 16.0 11.4 15.0 24.0 11.5 21.2 20.0
Total 180.0 156.9 181.5 215.3 227.2 240.0 241.0 229.1 278.2 276.2
Primary 543.6 601.4 513.9 430.1 446.2 441.3 484.7 470.7 443.8 316.5
Canada Secondary 60.1 41.6 24.8 26.8 30.0 30.5 35.8 46.1 41.8 29.7
Total 603.7 643.0 538.7 456.9 476.2 471.9 520.5 516.8 485.6 346.2
Chile Primary 1,460.4 1,503.3 1,438.7 1,542.4 1,517.6 1,558.4 1,565.4 1,514.3 1,369.2 1,522.3
Primary 1,013.9 1,145.0 1,179.9 1,379.2 1,502.9 1,751.5 1,917.5 2,111.5 2,453.4 2,648.3
China Secondary 173.8 222.1 330.0 334.3 415.0 500.0 600.0 750.0 860.3 800.0
Total 1,187.7 1,367.1 1,509.9 1,713.5 1,917.9 2,251.5 2,517.5 2,861.5 3,313.7 3,448.3
Colombia Secondary 10.0 10.0 10.0 10.0 10.0 10.0 10.0 10.1 10.0 10.0
CongoLow-grade Electrowon 33.0 25.0 10.0 8.0 20.0 10.0 10.0 1.8
Primary 211.2 317.7 295.1 288.8 278.6 257.2 273.8 270.2 295.0 251.1
Germany 1/ Secondary 360.4 240.9 283.1 205.3 262.6 251.4 266.3 273.4 293.3 282.7
Total 571.6 558.6 578.2 494.1 541.1 508.6 540.0 543.6 588.3 533.8
Primary 256.0 287.1 374.9 386.2 399.6 482.3 609.6 699.9 651.0 705.1
India Secondary 5.0 15.0 15.0 15.0 11.0 10.0
Total 256.0 287.1 374.9 386.2 404.6 497.3 624.6 714.9 662.0 715.1
Indonesia Primary 173.8 217.5 211.2 247.4 211.6 275.0 201.2 277.0 253.3 295.9
Primary 128.0 128.9 119.9 121.2 134.1 170.2 177.5 180.3 179.8 192.7
Iran Secondary 45.0 52.6 51.7 47.5 51.0 57.1 66.6 70.6 67.7 69.1
Total 173.0 181.5 171.6 168.7 185.1 227.3 244.1 250.9 247.5 261.8
Primary 1,332.4 1,328.5 1,317.3 1,343.4 1,270.5 1,319.2 1,409.1 1,367.3 1,366.3 1,297.9
Japan Secondary 148.3 139.8 182.1 173.4 194.9 198.5 219.2 245.2 259.1 243.9
Total 1,480.6 1,468.3 1,499.4 1,516.8 1,465.4 1,517.8 1,628.3 1,612.5 1,625.4 1,541.8
Kazakhstan Primary 396.0 430.0 459.6 437.8 452.2 425.8 426.2 408.8 430.0 369.0
Primary 369.7 386.2 380.0 410.0 392.5 436.6 449.2 470.0 502.0 455.4
Korean Rep. Secondary 54.4 42.3 50.0 50.0 50.0 49.9 34.8 45.0 42.0 43.8
Total 424.1 428.5 430.0 460.0 442.5 486.5 484.0 515.0 544.0 499.2
Primary 321.8 342.8 258.4 217.6 268.6 298.7 257.6 222.6 190.9 160.0
Mexico Secondary 5.0 5.0 5.0 5.0 5.0 5.0 5.0 5.0 5.0 5.0
Total 326.8 347.8 263.4 222.6 273.6 303.7 262.6 227.6 195.9 165.0
Namibia Primary 13.5 27.7 26.7 26.3 24.7 21.7 21.9 20.6 19.5 20.1
Primary 10.0 10.0 10.0 10.0 10.0 10.0 10.0 10.0 10.0 10.0
North Korea Secondary 5.0 5.0 5.0 5.0 5.0 5.0 5.0 5.0 5.0 5.0
Total 15.0 15.0 15.0 15.0 15.0 15.0 15.0 15.0 15.0 15.0
Oman Primary 25.0 25.0 25.0 25.0 15.1 24.5 20.7 13.9 11.9 12.0
Pakistan Primary 3.2 15.0 15.0 20.0 20.0 20.0 20.0
Peru Primary 366.7 396.4 379.6 376.1 377.8 381.6 381.3 296.1 360.4 341.5
ICSG 2009 Statistical Yearbook- July 2010
- 19 -

TABLE 4. WORLD COPPER SMELTER PRODUCTIONThousand metric tonnes, copper in primary and secondary blister and anode
COUNTRY Feed 2000 2001 2002 2003 2004 2005 2006 2007 2008 2009Type p/
Philippines Primary 150.0 165.0 165.8 227.9 217.3 201.3 239.6 219.9 239.7 230.1
Primary 462.8 485.9 510.7 560.0 547.2 526.6 445.1 438.1 438.6 408.2
Poland Secondary 19.7 27.9 29.4 24.1 33.3 30.0 80.0 39.8 43.8 68.8
Total 482.5 513.8 540.1 584.1 580.5 556.6 525.1 477.9 482.4 477.0
Primary 15.5 9.3 9.0 4.0
Romania Secondary 0.5
Total 16.0 9.3 9.0 4.0
Primary 550.0 608.0 660.3 662.0 661.9 695.5 635.0 650.0 602.0 579.6
Russian Fed. Secondary 295.0 290.0 201.7 180.0 257.0 261.5 312.0 289.0 250.0 218.2
Total 845.0 898.0 862.0 842.0 918.9 957.0 947.0 939.0 852.0 797.8
Primary 255.1 343.9 335.6 321.3 345.2 311.4 301.1 273.5 301.0 260.1
Scandinavia 2/ Secondary 33.5 45.0 52.1 56.1 58.0 59.7 57.0 48.5 55.8 41.6
Total 288.5 388.9 387.7 377.4 403.2 371.1 358.1 322.0 356.7 301.6
Slovakia Secondary 8.0 8.1 5.8 13.3 15.5 22.0 20.6 27.5 34.2
South Africa Primary 124.0 117.2 117.0 112.0 89.3 105.5 98.9 111.9 94.8 86.9
Primary 258.6 261.0 281.3 276.3 210.2 278.6 263.1 250.7 256.9 261.0
Spain Secondary 31.3 19.0 16.7 14.0 14.1 5.5 0.6 6.7 3.0 3.9
Total 289.9 280.0 298.0 290.3 224.3 284.2 263.7 257.4 259.9 264.9
Primary 17.7 28.6 1.0 5.6
Thailand Secondary 1.9 2.0 0.1 0.5
Total 19.6 30.6 1.1 6.1
Primary 27.6 29.5 30.6 25.4 29.7 22.6 25.0 25.0
Turkey Secondary 5.0 4.0 2.0 5.0 5.0 5.0 5.0 5.0
Total 32.6 33.5 32.6 30.4 34.7 27.6 30.0 30.0
United Kingdom Secondary 3.0
Primary 861.7 834.1 683.3 538.7 542.1 523.2 501.3 620.6 571.7 597.2
United States 3/ Secondary 140.0 85.0
Total 1,001.7 919.1 683.3 538.7 542.1 523.2 501.3 620.6 571.7 597.2
Ukraine Secondary 18.0 30.0 30.0
Primary 69.0 81.3 77.0 77.0 103.4 115.0 93.0 90.2 90.1 90.0
Uzbekistan Secondary 10.0 16.0
Total 79.0 97.3 77.0 77.0 103.4 115.0 93.0 90.2 90.1 90.0
Primary 33.8 24.0 36.1 15.1 13.9 30.0 40.0 30.2 31.9 32.0
Serbia Secondary 13.6 14.0 6.7 3.0 1.1 1.0 1.0 1.0 1.0 1.0
Total 47.4 38.0 42.7 18.1 15.0 31.0 41.0 31.2 32.9 33.0
Vietnam Primary 2.2 6.0
Zambia Primary 180.0 203.0 245.0 245.0 280.1 244.8 289.7 224.0 232.0 334.0
Zimbabwe Primary 2.0 Low-grade Electrowon
Others Primary
Secondary Low-grade Electrowon 33.0 25.0 10.0 8.0 20.0 10.0 10.0 1.8
WORLD Primary 10,365.8 11,129.8 10,964.7 11,147.5 11,246.3 11,783.6 11,970.4 12,114.1 12,337.4 12,388.5
TOTALS Secondary 1,678.6 1,528.8 1,507.6 1,356.3 1,613.6 1,707.6 1,979.9 2,123.3 2,255.2 2,122.7
Total 12,077.4 12,683.6 12,482.3 12,511.8 12,879.8 13,501.2 13,960.3 14,239.2 14,592.6 14,511.2Source: Official country, company reports and ICSG estimates.
p/ Preliminary data.1/ Secondary smelter production revised in August 2002 to reconcile the German figures with the definition used throughout this table.2/ Includes Finland and Sweden. 3/ Since June 2000, only total U.S. smelter production is reported. Since that time the split between secondary and primary is estimated by the ICSG.
ICSG 2009 Statistical Yearbook- July 2010
- 20 -

TABLE 5. WORLD COPPER REFINERY PRODUCTIONThousand metric tonnes, primary and secondary copper
COUNTRY Feed 2000 2001 2002 2003 2004 2005 2006 2007 2008 2009Source 1/ p/
Argentina Secondary 16.0 16.0 16.0 16.0 16.0 16.0 16.0 16.0 16.0 16.0
Electrowon 96.9 101.8 77.1 67.4 58.3 50.9 52.4 42.1 53.0 23.4
Australia Primary 390.4 458.4 465.5 416.6 431.8 417.9 376.5 399.5 448.6 422.1
Total 487.3 560.1 542.6 484.0 490.0 468.8 428.9 441.6 501.5 445.5
Austria Secondary 79.0 68.6 60.1 65.1 74.2 72.3 72.6 81.4 106.7 96.2
Belgium- Primary 237.0 245.0 201.7 218.7 220.6 223.9 237.9 230.0 233.1 220.6Luxembourg Secondary 186.0 178.9 225.2 204.6 172.3 161.8 152.8 164.5 162.7 153.1
Total 423.0 423.9 426.9 423.3 392.8 385.6 390.7 394.4 395.8 373.7
Electrowon 0.9 3.8 9.5
Brazil Primary 169.6 204.2 170.7 153.1 185.0 159.0 179.7 178.4 183.7 176.4
Secondary 15.0 8.0 16.9 20.4 23.0 40.0 40.0 40.0 39.3 30.6
Total 184.6 212.2 187.6 173.5 208.0 199.0 219.7 219.3 226.8 216.5
Primary 28.0 31.7 37.6 42.7 52.5 56.8 60.7 64.4 114.2 183.6
Bulgaria Secondary 3.0 2.8 3.1 3.2 2.8 3.2 4.8 5.7 12.6 13.2
Total 31.0 34.5 40.7 45.9 55.3 60.1 65.6 70.0 126.7 196.9
Electrowon 1.5 1.6 0.8
Canada Primary 490.1 524.9 468.8 426.9 495.9 483.7 463.6 405.2 398.1 304.5
Secondary 61.3 42.8 25.7 28.0 31.1 31.5 36.9 46.9 42.4 30.6
Total 551.4 567.7 494.5 454.9 527.0 515.2 500.5 453.5 442.1 335.9
Electrowon 1,372.6 1,538.2 1,602.0 1,653.1 1,636.3 1,584.6 1,691.8 1,831.9 1,971.0 2,112.4
Chile Primary 1,295.7 1,344.0 1,248.1 1,248.8 1,200.4 1,239.4 1,119.5 1,104.4 1,086.6 1,159.1
Total 2,668.3 2,882.2 2,850.1 2,901.9 2,836.7 2,824.0 2,811.3 2,936.3 3,057.6 3,271.5
Electrowon 5.0 8.0 10.0 10.0 12.0 15.0 16.1 18.2 16.6 20.0
China Primary 1,003.0 1,147.8 1,202.2 1,400.0 1,616.7 1,901.4 1,988.1 2,345.2 2,581.9 2,721.4
Secondary 347.7 357.5 400.3 426.0 570.0 684.0 999.1 1,136.0 1,196.0 1,380.0
Total 1,355.7 1,513.3 1,612.5 1,836.0 2,198.7 2,600.4 3,003.3 3,499.4 3,794.6 4,121.4
Electrowon 13.5 41.3 145.9
Congo Primary 20.0 20.0 20.0 20.0 24.2 22.5 19.9 12.5
Total 20.0 20.0 20.0 20.0 24.2 36.0 61.2 158.4
Colombia Secondary 10.0 10.0 10.0 10.0 10.0 10.0 10.0 10.0 10.0 10.0
Cyprus Electrowon 5.2 5.2 3.6 2.5 1.2 0.0 1.0 2.9 3.0 2.4
Egypt Secondary 4.0 4.0 4.0 4.0 4.0 4.0 4.0 4.0 4.0 4.0
Primary 245.0 352.4 327.0 296.0 283.7 293.8 312.1 301.9 300.5 290.2
Germany Secondary 464.4 341.4 368.8 301.0 369.0 344.4 350.2 363.6 389.3 378.7
Total 709.4 693.8 695.8 597.0 652.6 638.3 662.3 665.5 689.8 668.9
Primary 260.0 284.4 374.0 390.0 400.3 477.9 609.6 699.9 650.6 705.1
India Secondary 5.0 15.0 15.0 15.0 11.0 10.0
Total 260.0 284.4 374.0 390.0 405.3 492.9 624.6 714.9 661.6 715.1
Electrowon 1.1
Indonesia Primary 158.4 212.5 192.3 223.3 210.5 262.9 217.6 277.0 254.0 288.1
Total 158.4 212.5 192.3 223.3 210.5 262.9 217.6 277.0 254.0 289.2
Electrowon 9.0 9.2 8.8 12.5 10.8 9.6 9.0 7.7 7.3 6.8
Iran Primary 136.9 101.9 94.1 95.6 102.8 126.2 139.5 141.3 140.4 149.8
Secondary 10.0 41.6 40.6 37.5 38.9 42.3 52.4 55.3 53.0 53.7
Total 155.9 152.7 143.5 145.6 152.5 178.0 200.9 204.3 200.6 210.3
Italy Secondary 32.8 30.2 32.4 26.7 33.6 32.2 36.4 28.6 24.2 6.5
ICSG 2009 Statistical Yearbook- July 2010
- 21 -

TABLE 5. WORLD COPPER REFINERY PRODUCTIONThousand metric tonnes, primary and secondary copper
COUNTRY Feed 2000 2001 2002 2003 2004 2005 2006 2007 2008 2009Source 1/ p/
Primary 1,289.9 1,287.2 1,211.1 1,251.7 1,188.0 1,227.5 1,342.3 1,369.8 1,328.2 1,238.0
Japan Secondary 147.5 138.5 190.0 178.6 192.0 167.8 189.7 207.0 211.7 201.8
Total 1,437.4 1,425.7 1,401.1 1,430.3 1,380.0 1,395.3 1,532.1 1,576.8 1,539.8 1,439.8
Kazakhstan Primary 394.7 425.7 453.0 432.5 445.3 418.4 427.7 406.1 398.4 368.0
Laos Electrowon 30.5 60.8 62.5 64.1 67.5
Primary 415.5 432.6 455.3 465.0 451.0 474.3 541.1 537.0 489.0 495.2
Korean Rep. Secondary 52.5 41.0 45.0 45.0 45.0 45.0 34.4 45.0 42.0 43.8
Total 468.0 473.6 500.3 510.0 496.0 519.3 575.5 582.0 531.0 539.0
Electrowon 55.6 60.6 69.3 76.4 78.1 92.7 86.0 107.0 74.5 65.7
Mexico Primary 364.1 379.5 279.9 238.0 290.1 317.7 278.0 245.3 215.5 190.0
Secondary 5.0 5.0 5.0 5.0 5.0 5.0 5.0 5.0 5.0 5.0
Total 424.7 445.1 354.2 319.4 373.2 415.4 369.0 357.3 295.0 260.7
Mongolia Electrowon 0.6 1.5 1.5 1.6 2.3 2.4 2.4 2.4 2.6 2.5
Myanmar Electrowon 26.4 26.0 27.6 27.9 31.8 34.5 19.5 13.9 3.5
Primary 10.0 10.0 10.0 10.0 10.0 10.0 10.0 10.0 10.0 10.0
North Korea Secondary 5.0 5.0 5.0 5.0 5.0 5.0 5.0 5.0 5.0 5.0
Total 15.0 15.0 15.0 15.0 15.0 15.0 15.0 15.0 15.0 15.0
Oman Primary 25.0 25.0 25.0 25.0 15.1 24.5 20.7 13.9 11.9 12.0
Electrowon 127.2 131.1 156.5 171.2 167.0 165.5 173.8 172.1 160.1 162.8
Peru Primary 324.4 343.9 346.3 345.8 338.3 344.9 333.8 241.8 303.9 260.5
Total 451.6 475.0 502.7 517.0 505.3 510.4 507.6 413.9 463.9 423.3
Philippines Primary 150.0 164.5 144.3 171.2 176.2 171.5 181.0 160.2 174.6 178.0
Primary 466.0 470.5 478.7 500.4 520.1 530.2 476.1 493.2 483.0 433.6
Poland Secondary 20.0 28.0 30.0 29.2 30.0 30.0 80.5 39.8 43.8 68.8
Total 486.0 498.5 508.7 529.6 550.1 560.2 556.6 533.0 526.8 502.5
Primary 13.6 16.6 9.5 15.2 21.5 18.7 18.6 15.0 12.0 15.0
Romania Secondary 1.5 1.5 1.5 1.5 3.0 2.0 3.0 3.0 3.0 3.0
Total 15.1 18.1 11.0 16.7 24.5 20.7 21.5 18.0 15.0 18.0
Electrowon 2.0 4.8 10.0 10.0 10.0
Russian Fed. Primary 547.0 644.5 653.4 662.0 682.1 684.4 634.7 650.0 602.0 646.0
Secondary 295.0 250.0 201.7 180.0 237.0 248.5 311.9 289.0 250.0 218.1
Total 842.0 894.5 855.1 842.0 919.1 934.9 951.4 949.0 862.0 874.1
Primary 239.1 313.4 329.7 328.9 347.7 334.5 349.4 309.4 343.0 301.7
Scandinavia 2/ Secondary 33.5 45.0 52.1 56.1 59.7 59.6 57.2 48.5 53.1 43.3
Total 272.6 358.4 381.8 385.0 407.3 394.1 406.7 357.9 396.1 345.0
Slovakia Secondary 10.6 8.1 0.6
South Africa Primary 105.5 104.7 99.1 93.3 87.3 98.7 100.1 110.7 92.7 88.6
Electrowon 5.6
Spain Primary 245.3 241.5 271.5 259.0 194.1 242.7 235.3 243.0 257.0 262.5
Secondary 80.0 70.0 67.5 64.5 64.3 66.0 64.0 65.0 62.0 67.0
Total 325.3 311.5 339.0 323.5 258.4 308.7 299.3 308.0 319.0 335.1
Primary 18.1 13.0 18.7 7.6
Thailand Secondary 1.9 2.0 1.3 0.8
Total 20.0 15.0 20.0 8.4
Primary 59.1 54.4 39.0 34.9 58.8 89.9 100.8 94.6 83.0 28.5
Turkey Secondary 5.0 4.0 2.0 2.0 5.0 5.0 5.0 5.0 5.0 5.0
Total 64.1 58.4 41.0 36.9 63.8 94.9 105.8 99.6 88.0 33.5
ICSG 2009 Statistical Yearbook- July 2010
- 22 -

TABLE 5. WORLD COPPER REFINERY PRODUCTIONThousand metric tonnes, primary and secondary copper
COUNTRY Feed 2000 2001 2002 2003 2004 2005 2006 2007 2008 2009Source 1/ p/
United Kingdom Secondary 3.0
Electrowon 557.1 628.2 600.5 591.1 584.0 553.7 530.4 504.2 508.0 475.4
United States Primary 1,038.0 1,006.9 841.4 662.1 671.3 654.1 675.2 764.4 718.0 639.4
Secondary 198.5 165.5 70.0 53.2 50.8 47.2 44.8 42.2 54.3 46.4
Total 1,793.6 1,800.6 1,511.9 1,306.4 1,306.0 1,255.0 1,250.3 1,310.8 1,280.3 1,161.2
Ukraine Secondary 10.0 20.0 20.0 20.0 20.0 20.0 20.0 20.0
Primary 69.4 81.3 77.1 77.0 103.8 115.0 92.8 89.6 90.1 90.0
Uzbekistan Secondary 10.0 16.0
Total 79.4 97.3 77.1 77.0 103.8 115.0 92.8 89.6 90.1 90.0
Primary 31.4 22.4 29.2 11.0 10.9 30.1 40.0 30.6 32.8 33.0
Serbia Secondary 14.2 10.0 6.7 3.0 1.1 1.0 1.0 1.0 1.0 1.0
Total 45.6 32.4 35.9 14.0 12.0 31.1 41.0 31.6 33.8 34.0
Vietnam Primary 2.2 6.0
Electrowon 65.0 87.0 89.0 109.0 124.0 152.4 177.6 202.4 175.0 145.4
Zambia 3/ Primary 162.4 209.5 247.8 240.8 285.6 247.0 240.0 228.7 241.9 269.0
Total 227.4 296.5 336.8 349.8 409.6 399.4 417.6 431.1 416.9 414.4
Zimbabwe Primary 10.0 8.0 7.2 7.2 7.2 7.2 7.2 7.2 7.0 7.0
Electrowon
Others Primary 0.5
Secondary
Electrowon 2,320.7 2,596.8 2,646.0 2,722.7 2,705.8 2,693.7 2,825.5 2,993.2 3,091.8 3,260.8
WORLD Primary 10,375.1 11,149.1 10,810.6 10,762.7 11,142.5 11,717.3 11,852.5 12,197.6 12,307.5 12,205.3
TOTALS Secondary 2,099.9 1,891.9 1,897.6 1,786.1 2,069.4 2,160.7 2,613.0 2,743.2 2,823.0 2,911.0
Total 14,795.6 15,637.8 15,354.1 15,271.6 15,917.8 16,571.7 17,291.0 17,934.0 18,222.4 18,377.1
Source: Official country, company reports and ICSG estimates.
p/ Preliminary data.1/ Primary feed sources include both fire-refined and electrolytic processes from mined and smelted materials. In some countries, primary may also include electrowon from copper-nickel mattes. Commercial, high-grade electrowon cathode derived from mine sites is shown under electrowon. Secondary includes fire-refined, and electrolytically refined scrap anode.2/ Includes Finland, Norway and Sweden.3/ SXEW production at the refined level, includes treatment of ore imported from Congo.
ICSG 2009 Statistical Yearbook- July 2010
- 23 -

TABLE 6. WORLD COPPER PRODUCTION BY SOLVENT EXTRACTIONAND ELECTROWINNING PROCESSES
Thousand metric tonnes, copper
COUNTRY 2000 2001 2002 2003 2004 2005 2006 2007 2008 2009
p/
Australia 96.9 101.8 77.1 67.4 58.3 50.9 52.4 42.1 53.0 23.4
Brazil 0.9 3.8 9.5
Canada 1.5 1.6 0.8
Chile 1,372.6 1,538.2 1,602.0 1,653.1 1,636.3 1,584.6 1,691.8 1,831.9 1,971.0 2,112.4
China 5.0 8.0 10.0 10.0 12.0 15.0 16.1 18.2 16.6 20.0
Congo 1/ 33.0 25.0 10.0 8.0 20.0 10.0 10.0 15.3 41.3 145.9
Cyprus 5.2 5.2 3.6 2.5 1.2 0.0 1.0 2.9 3.0 2.4
Indonesia 1.1
Iran 9.0 9.2 8.8 12.5 10.8 9.6 9.0 7.7 7.3 6.8
Laos 30.5 60.8 62.5 64.1 67.5
Mexico 55.6 60.6 69.3 76.4 78.1 92.7 86.0 107.0 74.5 65.7
Mongolia 0.6 1.5 1.5 1.6 2.3 2.4 2.4 2.4 2.6 2.5
Myanmar 26.4 26.0 27.6 27.9 31.8 34.5 19.5 13.9 3.5
Peru 127.2 131.1 156.5 171.2 167.0 165.5 173.8 172.1 160.1 162.8
Russian Fed. 2.0 4.8 10.0 10.0 10.0
Spain 5.6
United States 557.1 628.2 600.5 591.1 584.0 553.7 530.4 504.2 508.0 475.4
Zambia 2/ 65.0 87.0 89.0 109.0 124.0 152.4 177.6 202.4 175.0 145.4
Others
WORLD TOTAL 2,320.7 2,596.8 2,646.0 2,722.7 2,705.8 2,693.7 2,825.5 2,993.2 3,091.8 3,260.8
Source: Official country, company reports and ICSG estimates.
p/ Preliminary data.1/ Low-grade electrowon cathode is included2/ SXEW production at the refined level, includes treatment of ore imported from Congo.
ICSG 2009 Statistical Yearbook- July 2010
- 24 -

TABLE 7. WORLD REFINED COPPER USAGEThousand metric tonnes, refined copper
COUNTRY 2000 2001 2002 2003 2004 2005 2006 2007 2008 2009
p/
Argentina 48.9 43.6 20.6 28.0 33.1 33.6 30.0 30.6 30.5 27.4
Australia 168.5 164.7 186.3 183.3 167.0 155.2 143.4 147.6 150.7 129.5
Brazil 330.5 336.1 242.0 300.3 332.4 334.9 339.2 331.7 372.2 319.3
Bulgaria 15.0 15.3 16.0 16.0 15.2 38.0 46.0 58.5 58.6 51.8
Canada 272.1 265.2 276.4 257.3 297.2 289.7 300.6 206.0 196.9 142.1
Chile 1/ 83.0 90.0 81.5 94.7 100.4 102.7 110.7 105.3 103.3 91.3
China 3/ 9/ 1,876.5 2,360.1 2,774.5 3,096.9 3,380.7 3,652.4 3,604.2 4,957.1 5,202.1 7,189.1
Colombia 4.1 11.1 10.0 10.0 10.0 10.0 10.0 10.0 10.0 10.0
Czech Rep. 14.0 18.0 12.0 5.7 5.7 5.7 5.7 5.7 5.7 5.7
Ecuador 2.8 3.6 3.8 3.5 3.5 3.5 3.5 3.5 3.5 3.5
Egypt 13.0 42.0 61.0 68.0 81.0 105.0 108.0 138.9 171.4 181.0
Hungary 19.7 18.5 17.0 11.8 7.4 8.0 8.0 8.0 8.0 8.0
India 265.0 280.9 296.9 311.1 350.0 415.0 450.0 540.0 570.0 610.0
Indonesia 70.0 110.0 125.0 179.0 190.0 197.0 220.0 200.0 195.0 165.0
Iran 95.0 100.0 110.1 110.0 120.0 124.0 130.0 134.8 135.0 133.3
Japan 1,347.6 1,146.8 1,167.4 1,202.1 1,279.0 1,229.0 1,282.3 1,251.9 1,184.7 876.0
Kazakhstan 16.0 38.6 64.6 57.0 54.4 17.2 71.4 62.7 56.1 59.5
Korean Rep. 861.2 827.9 911.1 906.0 937.0 863.8 811.8 821.0 780.0 901.0
Malaysia 166.3 160.2 170.0 168.9 175.0 180.0 188.5 184.0 177.0 167.2
Mexico 491.5 441.9 365.8 363.4 406.1 430.0 360.0 340.0 325.0 277.3
North Korea 15.0 15.0 15.0 15.0 15.0 15.0 15.0 15.0 15.0 15.0
Oman 1.0 1.0 2.0 3.0 7.0 12.0 15.0 15.0 15.0 15.0
Pakistan 10.0 13.0 16.9 14.8 17.4 30.0 35.0 40.0 41.0 40.2
Peru 45.3 47.5 44.7 55.8 57.9 51.4 52.9 54.5 54.8 53.0
Philippines 35.0 35.1 40.0 43.0 46.0 43.0 42.0 40.0 39.3 38.0
Poland 247.2 272.0 246.6 253.4 267.0 274.7 275.0 296.6 246.9 213.6
Romania 16.8 17.0 18.8 17.7 28.6 24.1 26.8 41.6 35.5 27.3
Russian Fed. 219.1 309.8 349.6 447.4 587.6 634.6 691.7 671.3 649.9 393.0
Saudi Arabia 160.0 159.7 170.0 165.0 176.0 180.0 190.0 190.0 185.0 192.7
Singapore 12.0 10.0
Slovakia 1.5 17.4 15.6 0.6 18.70 31.75 33.15
South Africa 69.0 70.3 84.3 76.2 91.2 88.5 89.7 93.0 86.1 85.6
Taipei, China 628.4 540.0 654.6 619.6 690.1 638.3 640.0 603.1 582.3 493.6
Thailand 150.6 166.5 186.2 204.4 240.2 241.0 254.0 250.0 240.0 215.0
Turkey 244.0 196.5 225.0 264.9 280.9 316.2 320.0 358.0 360.1 322.5
United Arab Emirates 5.0 33.0 80.0
Ukraine 8.0 8.0 10.0 20.0 20.0 20.0 20.0 20.0 20.0 20.0
United States 1/ 3,027.0 2,623.8 2,363.6 2,295.3 2,414.8 2,274.0 2,130.3 2,137.0 2,020.0 1,628.5
Uzbekistan 40.0 40.0 40.0 40.0 40.0 42.0 45.0 47.1 47.6 45.1
Venezuela 1.2 1.0 1.0 1.0 1.0 1.0 1.0 1.0 1.0 1.0
Vietnam 17.3 25.2 21.6 43.5 56.0 54.0 75.2 98.0 102.0 102.0
Serbia 25.0 17.0 20.0 17.0 20.0 35.0 36.3 37.0 37.0 36.0
Zambia 6.7 6.0 8.4 15.0 18.0 24.0 27.0 28.0 29.0 28.1
Zimbabwe 10.0 10.1 10.0 10.0 10.0 10.0 10.0 10.0 10.0 9.6
EU-15 5/ 4,016.3 3,918.4 3,742.4 3,712.7 3,793.6 3,471.7 3,835.9 3,623.8 3,429.1 2,756.2
Others 6/ 9.6 11.0 4.9 3.9 3.7 3.7 2.6 2.6 2.6 2.6
WORLD TOTAL 7/ 15,184.7 15,014.3 15,210.0 15,717.1 16,832.7 16,683.3 17,058.4 18,239.4 18,055.7 18,198.2
ICSG 2009 Statistical Yearbook- July 2010
- 25 -

TABLE 7. WORLD REFINED COPPER USAGEThousand metric tonnes, refined copper
COUNTRY 2000 2001 2002 2003 2004 2005 2006 2007 2008 2009
p/
EUROPEAN UNION (EU-15) 8/
Austria 36,0 33,4 30,0 27,0 41,3 29,7 33,2 33,8 33,0 30,8
Belgium-Luxembourg 347,0 301,0 304,4 288,7 299,9 269,1 290,5 308,7 284,7 234,1
Denmark 0,1 0,1 0,1 0,1 0,1 0,1 0,1 0,1 0,1 0,1
France 574,0 538,0 545,0 540,0 550,0 505,0 540,1 440,0 410,0 310,0
Germany 1.309,7 1.091,9 1.075,0 1.011,9 1.120,8 1.179,9 1.397,7 1.391,8 1.398,0 1.133,6
Greece 134,6 129,7 125,9 107,2 118,4 89,3 103,9 103,7 75,5 56,6
Italy 624,9 677,6 672,7 664,7 719,3 681,0 801,0 764,1 635,0 522,9
Netherlands 49,2 50,0 53,0 55,0 42,0 32,0 27,0 22,0 22,0 20,2
Portugal 0,1 0,1 0,1 2,2 1,6 1,5 1,5 1,5 1,5 1,5
Scandinavia 4/ 302,4 294,3 265,5 289,0 292,4 255,4 266,2 254,0 246,4 231,8
Spain 275,0 298,4 307,0 311,0 331,0 321,0 319,1 330,0 385,0 338,1
United Kingdom 322,8 285,2 250,0 240,0 242,0 200,0 180,0 55,0 54,0 49,0
Source: Official country, apparant calculation and ICSG estimates. p/ Preliminary data.
1/ Reported usage 2/ Including variation of German brands in LME warehouses in Germany until end 2003.
3/ After 1996 Hong Kong usage is included in China. 4/ Includes Finland and Sweden. Norway is included in others.
5/ Based on apparent usage taking into consideration extra EU-15 trade. 6/ Includes Albania, Israel, Norway, Tunisia.
7/ World total based on EU-15 apparent usage 8/ Individual EU-15 country data, based on reported data, apparant calculation and estimates
9/ Chinese apparent consumption, accounting for changes in SHFE, but not accounting for changes in strategic stock pile.
TABLE 8A. REFINED COPPER STOCKS AT METAL EXCHANGESThousand metric tonnes, refined copper, end of period
STOCK TYPE AND 2000 2001 2002 2003 2004 2005 2006 2007 2008 2009COUNTRY
LONDON METAL EXCHANGE (LME) Belgium 2,475 2,150 1,100 0,175 0,000 0,000 0,000 1,075 2,025 2,325
France 0,000 0,500 0,000 0,000 0,000 0,000 0,000 0,000 0,000 0,000
Germany 33,550 10,550 2,675 0,000 0,000 0,000 0,000 0,000 15,975 12,025
Italy 13,025 20,025 0,175 10,200 0,000 0,000 4,200 16,000 27,125 5,125
Korean rep. 0,000 0,000 0,000 0,000 1,500 69,900 50,475 78,925 61,425 110,900
Malaysia 0,000 0,000 0,000 0,000 1,125 0,100 0,000 0,125 0,000 3,575
Netherlands 17,625 43,475 54,825 9,175 1,275 3,675 18,275 24,225 90,700 35,000
Singapore 27,650 20,525 5,300 0,125 9,275 12,675 32,200 13,300 11,375 25,425
Spain 48,925 46,475 77,450 39,625 0,050 3,400 0,925 2,775 23,475 13,200
Sweden 5,225 27,050 19,300 0,000 0,650 0,000 3,350 0,000 0,000 0,000
United Arab Emirates 0,000 0,000 60,175 0,300 0,000 1,675 0,150 0,025 0,025 0,500
United Kingdom 4,425 12,100 33,750 35,800 0,000 0,000 5,400 1,925 2,500 10,925
United States 204,325 616,375 600,875 335,125 35,000 0,800 75,600 60,550 105,925 283,400
Total LME 357,225 799,225 855,625 430,525 48,875 92,225 190,575 198,925 340,550 502,400
COMEX 58,669 243,806 362,276 254,862 43,729 6,182 30,915 13,816 31,311 89,976
SHFE 107,816 94,487 75,087 120,631 31,685 57,844 31,300 25,597 17,822 95,315
TOTAL EXCHANGES 523,710 1.137,518 1.292,988 806,018 124,289 156,251 252,790 238,338 389,683 687,691
ICSG 2009 Statistical Yearbook- July 2010
- 26 -

TABLE 8B. REFINED COPPER STOCKS AT PRODUCERS,CONSUMERS AND MERCHANTS
Thousand metric tonnes, refined copper, end of period
STOCK TYPE AND 2000 2001 2002 2003 2004 2005 2006 2007 2008 2009
COUNTRY
Australia (producers) 1/ 4,9 4,9 5,0 5,0 5,0 5,0 5,0 5,0 5,0 5,0
Brazil (producers) 4,1 6,2 3,6 4,0 11,8 10,8 10,6 14,2 27,5 44,7
Bulgaria 1/ 1,4 1,4 1,4 1,4 1,4 1,4 1,4 1,4 1,4 1,4
Canada (producers) 12,0 18,2 10,0 10,4 8,4 11,2 13,8 12,1 8,7 1,7
Chile (producers) 2/ 212,0 262,2 260,6 502,3 343,0 265,1 359,2 280,5 254,3 255,3
China (total) 1/ 110,0 72,0 39,0 37,0 30,0 47,0 73,0 63,0 80,0 80,0
France (consumers) 42,8 44,3 57,8 35,3 35,4 17,2 20,2 20,1 28,0 21,0
Germany (producers) 57,1 69,1 60,1 47,0
Germany (merchants) 2,9 6,1 4,5 5,7
Germany (consumers) 32,8 29,2 28,7 27,3
Germany Total 3/ 92,8 104,4 93,3 80,0 70,0 70,0 70,0 70,0 70,0 70,0
India (producers/merchants) 1/ 5,7 6,0 6,0 6,0 6,0 6,0 6,0 6,0 6,0 6,0
Italy (consumers) 14,9 15,0 15,0 15,0 11,6 12,5 12,0 11,6 11,2 11,2
Japan (producers) 69,5 80,9 49,6 75,9 68,7 75,4 76,0 71,0 71,9 75,2
Japan (merchants) 12,9 16,0 8,5 11,1 8,7 5,9 6,3 9,9 14,5 9,9
Japan (consumers) 21,3 26,3 35,3 23,5 27,6 16,4 20,5 21,0 37,9 18,7
Japan Total 103,7 123,2 93,5 110,5 105,1 97,7 102,8 101,9 124,4 103,9
Korean Rep. (producers) 5,7 6,3 4,0 4,0 4,0 10,0 5,0
Korean Rep. (merchants) 2,0 2,0 2,0 2,0 2,0 10,0 5,0
Korean Rep. (consumers) 8,0 8,0 8,0 8,0 8,0 10,0 5,0
Korean Rep. (Government) 13,1 30,0 34,0 34,0 34,0 10,0 10,0
Korean Rep. (total) 4/ 28,8 46,3 48,0 48,0 48,0 45,0 45,0 41,0 40,0 25,0
Peru (producers) 1/ 4,8 4,8 4,8 4,8 5,0 5,0 5,0 5,0 5,0 5,0
Philippines Total 1/ 8,0 8,0 8,0 7,0 7,0 7,0 7,0 7,0 7,0 7,0
Poland (producers) 1/ 6,0 6,0 6,0 6,0 15,0 10,7 17,1 21,0 10,7 6,8
Scandinavia (producers) 1/ 6,3 3,8 3,2 3,4 8,2 8,2 8,2 12,5 10,2 10,2
South Africa (producers) 1/ 13,0 13,0 13,0 13,0 13,0 13,0 13,0 13,0 13,0 13,0
United Kingdom (consumers) 1/ 10,4 7,3 7,0 7,0 7,0 7,0 7,0 7,0 7,0 7,0
U.S. (producers) 14,8 29,0 11,7 12,1 10,3 8,2 28,1 20,0 15,7 16,0
U.S. (consumers) 57,3 66,2 55,3 53,5 45,3 50,8 61,7 63,8 34,2 38,2
U.S. Total 72,1 95,2 67,0 65,5 55,7 59,0 89,8 83,8 49,9 54,2
Zambia (producers) 1/ 12,8 12,0 12,0 12,0 12,0 12,0 12,0 12,0 12,0 12,0
TOTAL COUNTRY STOCKS 766,8 854,6 754,5 974,0 799,0 711,1 878,6 788,4 771,6 740,8
REFINED STOCK SUMMARY
Producers 547,1 602,9 497,0 751,3 618,9 600,9 750,4 629,6 608,4 614,3
Merchants 17,8 24,1 15,0 18,8 10,7 5,9 6,3 14,9 24,5 14,9
Consumers 188,8 197,7 208,5 169,9 135,4 104,3 121,8 133,9 128,7 101,5
Government 13,1 30,0 34,0 34,0 34,0 10,0 10,0 10,0
Exchanges 523,7 1.137,5 1.293,0 806,0 124,3 156,3 252,8 238,3 389,7 687,7
TOTAL ALL STOCKS 1.290,5 1.992,1 2.047,5 1.780,0 923,3 867,3 1.131,3 1.026,8 1.161,3 1.428,5
Source: Official country and ICSG estimates.
1/ Estimates.2/ Stocks are calculated monthly on the basis of production, plus previous month stocks, less net trade, less reported usage.3/ From 2004 onwards, only total stocks, ICSG estimate.4/ From 2005 onwards, only total stocks, ICSG estimate
ICSG 2009 Statistical Yearbook- July 2010
- 27 -

COPPER STOCKS CHARTS
Comparision of Annual Stock Level vs 10 Years Average Stock Level
-400
-300
-200
-100
-
100
200
300
400
500
600
2000 2001 2002 2003 2004 2005 2006 2007 2008 2009
Th
ou
san
d T
on
s
LME
COMEX
SHFE
Copper Stocks by Exchange
0
200
400
600
800
1.000
1.200
1.400
2000 2001 2002 2003 2004 2005 2006 2007 2008 2009
Th
ou
san
d T
on
s
SHFE
COMEX
LME
LME Copper Stocks by Location
0
100
200
300
400
500
600
700
800
900
2000 2001 2002 2003 2004 2005 2006 2007 2008 2009
Th
ou
san
d T
on
s
United States
United Kingdom
United Arab Emirates
Sweden
Spain
Singapore
Netherlands
Malaysia
Korean rep.
Italy
Germany
France
Belgium
ICSG 2009 Statistical Yearbook- July 2010
- 28 -

TABLE 9. LME, COMEX AND U.S. PRODUCER PRICESCurrency in U.S. Dollars
LME LME COMEX COMEX U.S.PERIOD Grade A, Cash Grade A, Cash HG, 1st Pos. HG, 1st Pos. Producer Price
$/metric tonne Cents/pound $/metric tonne Cents/pound Cents/poundANNUAL AVERAGES
2000 1.814,3 82,29 1.851,2 83,97 88,162001 1.577,8 71,57 1.599,8 72,57 76,852002 1.557,5 70,65 1.580,4 71,69 75,822003 1.779,9 80,73 1.785,5 80,99 85,172004 2.868,3 130,11 2.847,7 129,17 134,202005 3.683,6 167,09 3.710,5 168,31 173,572006 6.727,2 305,14 6.821,5 309,42 315,592007 7.126,35 323,25 7.117,39 322,84 328,672008 6.951,52 315,32 6.904,48 313,18 318,872009 5.163,59 234,22 5.214,71 236,54 242,36
ANNUAL HIGHS2000 2.009,0 91,13 2046,99 92,85 97,172001 1.837,0 83,33 1911,41 86,70 91,022002 1.689,5 76,63 1727,32 78,35 82,512003 2.293,0 104,01 2297,21 104,20 108,392004 3.287,0 149,10 3400,63 154,25 159,522005 4.650,0 210,92 5026,53 228,00 233,272006 8.788,0 398,62 8984,93 407,55 413,382007 8.301,00 376,53 8.276,14 375,40 381,232008 8.985,00 407,55 8.989,34 407,75 413,582009 7.346,00 333,21 7.335,87 332,75 338,58
ANNUAL LOWS2000 1.607,0 72,89 1635,83 74,20 78,262001 1.319,0 59,83 1331,59 60,40 64,622002 1.421,0 64,46 1438,51 65,25 69,412003 1.544,5 70,06 1563,08 70,90 75,092004 2.337,0 106,00 2342,41 106,25 110,442005 3.072,0 139,34 3075,44 139,50 144,772006 4.537,0 205,80 4695,84 213,00 218,832007 5.225,50 237,02 5.301,01 240,45 246,282008 2.770,00 125,65 2.750,04 124,74 130,582009 3.050,50 138,37 3.044,58 138,10 143,93
LME COPPER PRICE (Cash)
0
1.000
2.000
3.000
4.000
5.000
6.000
7.000
8.000
9.000
2000 2001 2002 2003 2004 2005 2006 2007 2008 2009
US
$/to
n
LME average LME highs LME lows
ICSG 2009 Statistical Yearbook- July 2010
- 29 -

TABLE 10. WORLD COPPER AND COPPER ALLOY SEMIFABRICATES PRODUCTION 1/2/
Thousand metric tonnes, gross weight
COUNTRY Semis- 2000 2001 2002 2003 2004 2005 2006 2007 2008 2009Type p/
Albania Copper 0.1 0.1 0.0 0.1
Argentina Total 50.4 56.4 20.0 40.0 42.2 60.0 61.5 81.6
Australia Total 196.0 201.0
Austria Total 41.3 45.4 41.6 44.7 50.9 45.1
Benelux 3/ Total 437.1 390.2 361.7 365.5 388.6 337.0 282.3
Copper 222.4 211.4 152.3 188.0 212.9 218.0 229.0 222.0 219.0 192.1
Brazil 4/ Not Specif. 128.8 132.4 119.8 123.0 143.8 136.1 143.5 148.3 152.1 130.1
Total 351.2 343.8 272.1 311.0 356.6 354.1 372.5 370.3 371.1 322.2
Bulgaria Total 1.0 7.5 17.4 22.8 36.7 46.6
Copper 57.1 60.0 60.7 64.9 71.3 77.8
Chile Not Specif. 38.3 36.0 34.5 36.3 40.0 34.5 115.5 114.7
Total 95.3 96.0 95.2 101.2 111.3 112.3 115.5 114.7
Copper 1,658.0 1,928.0 2,211.0 2,681.0 3,057.0 3,389.0 3,786.0 4,355.8 5,537.2
China Cu Alloy 764.0 878.0 1,007.0 1,227.0 1,340.0 1,483.0 1,580.0 1,946.3 2,829.8
Total 2,422.0 2,806.0 3,218.0 3,908.0 4,397.0 4,872.0 5,366.0 6,302.1 8,367.0 8,884.2
Copper 11.9 12.8 11.4 10.9 14.7 14.6 6.7 5.1
Czech Rep. Cu Alloy 23.1 19.4 8.9 12.7 19.0 20.8
Total 11.9 12.8 34.4 30.3 23.6 27.3 25.7 25.9
Egypt Total 13.0 42.0 61.0 68.0 81.0 105.0 110.0 140.0 170.0 180.0
Copper 592.4 532.6 546.8 524.6 519.7 486.5 444.0 360.0 396.1
France Cu Alloy 195.5 147.9 141.0 132.9 130.0 113.7 116.4 96.6 76.8
Total 787.9 680.5 687.8 657.5 649.7 600.2 666.0 543.0 472.9 327.6
Copper 1,169.8 1,085.7 1,023.7 1,056.1 1,024.3 1,036.5 1,219.2 1,214.9 1,238.6 937.7
Germany Cu Alloy 742.7 658.4 626.5 582.5 618.9 567.1 650.6 642.8 581.9 419.5
Total 1,912.5 1,744.1 1,650.2 1,638.6 1,643.2 1,603.6 1,869.8 1,857.7 1,820.5 1,357.2
Greece Total 200.5 193.1 149.6 103.1 100.9 106.5 109.1 119.3 91.4
Copper 32.7 25.7 25.2 13.2 9.8 2.7
Hungary Cu Alloy 23.7 23.3 31.1 5.8 11.2 8.0 10.2 2.5
Total 56.3 49.0 56.2 19.0 21.0 10.8 10.2 2.5
India 5/ Copper 231.0 229.7 219.9 242.6 241.2 275.6 316.0 402.9 417.8 412.5
Indonesia Total 101.7 80.5 158.0 180.9
Iran Total 118.3 139.4
Copper 607.5 595.4 576.1 582.2 635.0 627.7 705.5 694.7 617.1 547.7
Italy Cu Alloy 766.2 701.2 683.7 669.6 708.9 648.1 721.9 660.0 572.2 390.7
Total 1,373.7 1,296.6 1,259.8 1,251.8 1,343.9 1,275.8 1,427.4 1,354.7 1,189.3 938.4
Copper 1,443.5 1,261.5 1,266.5 1,171.0 1,234.3 1,243.2 1,300.8 1,253.2 1,190.2 884.0
Japan Cu Alloy 604.6 508.7 505.3 513.7 530.4 501.2 540.0 502.7 467.8 317.9
Total 2,048.1 1,770.2 1,771.8 1,684.7 1,764.8 1,744.4 1,840.8 1,755.9 1,657.9 1,202.0
Kazakhstan Total 9.6 41.3 69.0 60.6 53.0 14.2 33.9 41.0 53.7 18.9
Copper 871.6 887.1 945.7 957.1 1,011.2 923.4 900.6 863.3 753.0 865.4
Korean Rep. Cu Alloy 315.2 299.9 350.1 345.6 375.8 422.3 403.8 427.6 420.4 388.9
Total 1,186.8 1,187.0 1,295.8 1,302.7 1,386.9 1,345.6 1,304.4 1,290.8 1,173.4 1,254.3
Malaysia Total 201.5 206.3 207.8 230.8
Copper 476.5 452.3 389.3 369.0 398.0 417.2 389.5 397.4 333.7
Mexico Cu Alloy 57.0 50.8 52.0 52.9 54.2 51.7 53.4 48.6 46.1
Total 533.5 503.1 441.3 421.9 452.3 468.8 443.0 446.0 379.8
Philippines Total 33.1 22.4 23.6 21.0 6.0 5.8
Copper 239.7 249.8 234.0 240.9 262.1 258.3 270.2 293.1 238.7
Poland Cu Alloy 67.4 58.3 53.9 53.9 60.7 55.1 52.3 45.3 25.6
Total 307.0 308.1 287.9 294.8 322.7 313.4 322.5 338.4 264.4
Romania Total 24.6 34.9 26.3 25.5 48.4 47.0 25.0 36.0 26.0
Russian Fed. Total 259.4 354.3 403.0 512.4 661.7 726.5 786.8 794.9
Saudi Arabia Total 195.0 195.0 191.3 180.7 195.0
Scandinavia Total 375.0 344.0 332.6 347.5 336.0 296.0 287.9 267.1 68.8
Serbia Total 47.1 42.9 43.4 38.4 47.8 50.2 50.4
ICSG 2009 Statistical Yearbook- July 2010
- 30 -

TABLE 10. WORLD COPPER AND COPPER ALLOY SEMIFABRICATES PRODUCTION 1/2/
Thousand metric tonnes, gross weight
COUNTRY Semis- 2000 2001 2002 2003 2004 2005 2006 2007 2008 2009Type p/
Copper 0.7 16.2 17.1 4.3 1.2 0.5 17.8 31.1 30.7
Slovakia Cu Alloy 6.4 7.4 8.0 11.9 13.1 9.1
Total 7.1 23.6 25.1 16.2 14.2 9.6 2.0 17.8 31.1 30.7
Slovenia Total 9.8 8.9 10.3 8.0 7.1 6.6 8.0
South Africa Copper 86.1 73.4 78.8 64.0 71.9 69.8 72.5 66.9 51.4
Copper 297.8 272.6 283.1 287.4 301.7 270.9 264.9 272.7 320.1 291.8
Spain Cu Alloy 76.8 77.8 71.5 67.0 65.1 62.6 63.9 63.0 64.5 56.8
Total 374.6 350.5 354.5 354.4 366.8 333.5 328.8 335.7 384.6 348.6
Switzerland Total 45.5 42.5 28.6 29.3 34.0 28.5
Copper 634.6 517.4 538.0 476.6 519.6 487.6 484.4 423.4 393.8 377.1
Taipei, China Cu Alloy 113.8 79.6 92.5 112.1 132.8 116.5 113.8 122.9 108.4 99.1
Not Specif. 286.5 203.5 269.8 316.8 331.3 319.0 322.5 306.5 259.5 235.7
Total 1,034.8 800.5 900.3 905.5 983.7 923.1 920.7 852.8 761.7 711.9
Thailand 6/ Total 184.0 159.6 179.0 185.7 221.3 237.3
Turkey Total 322.5 275.0 326.4 351.2 336.9 362.0 411.4 336.0 350.0 315.0
Copper 3.8 5.9 11.8 15.7 34.2 42.3 48.1
Ukraine Cu Alloy 7.6 8.3 5.8 10.6 24.3 34.2 40.0
Total 11.4 14.1 17.6 26.3 58.5 76.4 88.1
Copper 362.9 304.9 243.1 240.0 239.8 204.7 200.8 59.0 47.8
United Kingdom Cu Alloy 112.7 116.9 88.0 75.5 76.2 64.7 49.4 6.7 10.4
Total 475.6 421.8 331.1 315.6 316.0 269.4 250.2 102.2 98.8
Copper 3,012.5 2,634.9 2,532.6 2,404.4 2,708.1 2,514.1 2,359.1 2,328.5 2,101.8 1,609.0
United States 7/ Cu Alloy 904.0 671.3 724.6 671.0 727.5 694.1 702.0 618.4 554.3 409.7
Total 3,916.5 3,306.2 3,257.2 3,075.4 3,435.5 3,208.2 3,061.2 2,946.9 2,656.0 2,018.7
Uzbekistan Total 21.0 26.2 10.3 10.4 11.3
Vietnam Total 20.0 21.0 30.0 41.0
Zambia Total 7.7 7.2 10.0 15.0 19.7 25.2
Others Total 406.3 78.1 64.0 62.0 63.5 69.0 74.9 83.2 99.5 79.0
Copper 14,712.1 13,489.0 13,752.9 13,932.4 14,714.5 14,656.5 14,983.2 14,975.9 14,787.1 6,740.9
WORLD TOTALS Cu Alloy 5,285.8 4,693.3 4,771.9 4,842.2 5,116.4 5,090.1 5,299.3 5,287.4 5,758.8 2,082.7
By Semifabricate Not Specif. (8) 611.6 513.0 504.8 610.7 676.9 716.0 957.0 954.3 592.1 9,772.6
Type Total 20,609.4 18,695.3 19,029.6 19,385.3 20,507.9 20,462.6 21,239.5 21,217.6 21,137.9 18,596.2
Source: Official country and company reports.
p/ Preliminary. For some countries incomplete.1/ Semifabricate types do not include castings at foundries, or chemicals.2/ Beginning with the March 03 issue of the Copper Bulletin, "copper semis" includes only wire rod and wire drawn from other unwrought copper shapes besides brassmill products. Production of downstream wire mill products, which does not represent the first use of refined copper, is excluded and historical data has been adjustedto reflect this change.3/ From 2001 onwards only Belgium (source: Statistical Office)4/ Copper content5/ Copper wire rod production ("CCR"). From 2003 onwards only production from refined producers.6/ From 1999 onwards, only copper tube and copper wire rod.7/ 2006 data may not be comparable to prior year periods8/ Includes all semis production of not specified composition.
ICSG 2009 Statistical Yearbook- July 2010
- 31 -

TABLE 11A. IMPORTS OF COPPER ORES AND CONCENTRATES 1/
Thousand metric tonnes, gross weight and copper content
COUNTRY UNIT 2000 2001 2002 2003 2004 2005 2006 2007 2008 2009p/
Australia Gross Wt. 0.0 0.0 0.0 15.7 0.0 2.4 0.0 3.7 0.0 0.0Cu Cont. 0.0 0.0 0.0 4.7 0.0 0.7 0.0 1.1 0.0 0.0
Belgium Gross Wt. 0.1 0.1 0.0 0.1 0.9 5.2 17.3 21.1 12.1 16.4Cu Cont. 0.0 0.0 0.0 0.0 0.3 1.6 5.2 6.3 3.6 4.9
Brazil Gross Wt. 495.1 635.4 462.8 412.6 541.1 403.0 536.0 482.9 473.7 423.1Cu Cont. 156.8 180.4 141.9 131.3 162.3 120.9 160.8 144.9 142.2 126.9
Bulgaria Gross Wt. 244.8 316.8 281.7 454.9 561.6 632.3 581.1 536.8 604.8 635.0Cu Cont. 73.5 95.1 84.5 136.5 168.0 189.7 145.3 161.1 181.4 190.5
Canada Gross Wt. 704.3 731.8 432.9 246.3 219.7 272.1 347.5 189.5 246.1 172.0Cu Cont. 211.3 219.5 129.9 73.8 65.9 81.6 104.3 56.9 73.8 51.6
Chile Gross Wt. 0.0 3.3 20.9 5.0 58.2 72.6 126.5 93.4 124.2 52.8Cu Cont. 0.0 1.0 6.3 1.5 17.4 21.7 37.9 28.0 37.2 15.8
China Gross Wt. 1,813.3 2,255.3 2,065.4 2,669.7 2,869.5 4,060.0 3,611.7 4,525.1 5,192.0 6,132.3Cu Cont. 544.0 676.6 619.6 800.9 860.8 1,217.7 1,083.5 1,357.5 1,479.0 1,655.7
Finland Gross Wt. 468.6 503.4 500.8 543.1 528.9 504.7 544.2 448.1 536.6 343.9Cu Cont. 140.6 151.0 150.8 162.9 158.7 151.4 163.2 134.4 161.0 103.2
Germany Gross Wt. 708.6 1,095.0 1,037.3 880.3 1,141.8 1,149.1 1,148.8 1,300.5 1,088.3 1,252.4Cu Cont. 212.6 329.0 311.2 264.1 342.6 344.4 344.6 390.2 326.5 375.7
India Gross Wt. 658.4 827.5 1,000.0 610.3 774.1 1,072.9 2,707.4 2,102.2 2,070.9 2,103.9Cu Cont. 197.5 248.3 300.0 183.0 232.2 321.9 812.2 630.7 621.3 631.2
Indonesia Gross Wt. 0.2 10.2 0.2 0.0 0.0 47.8 25.0 0.0 0.1 10.0Cu Cont. 0.1 3.1 0.1 0.0 0.0 14.4 7.5 0.0 0.0 3.0
Japan Gross Wt. 4,469.3 4,113.0 4,258.9 4,108.3 4,457.5 4,320.0 4,633.4 5,051.2 4,941.3 4,145.1Cu Cont. 1,347.9 1,285.0 1,281.0 1,232.5 1,292.5 1,252.8 1,390.0 1,515.4 1,482.4 1,243.5
Kazakhstan Cu Cont. 0.0 0.0 0.0 0.0 17.8 29.7 1.3 0.0 0.0 Korean Rep. Gross Wt. 1,177.3 1,173.7 1,271.3 1,325.3 1,307.9 1,393.7 1,458.1 1,402.9 1,483.9 1,598.7
Cu Cont. 377.0 376.0 381.4 397.5 392.4 417.8 437.4 420.9 445.2 479.6Mexico Gross Wt. 297.8 45.4 29.3 5.0 0.0 22.2 91.5 0.0 154.8 13.6
Cu Cont. 91.8 13.6 8.8 1.5 0.0 6.7 27.5 0.0 46.5 4.1Namibia Cu Cont. 0.5 5.7 3.9 10.8 10.6 0.0 0.0 0.0 0.0 Oman Gross Wt. 276.0 70.5 85.4 191.8 31.7 96.2 52.5 31.2 20.4
Cu Cont. 82.8 21.2 25.6 57.5 9.5 28.9 15.8 9.4 Philippines Gross Wt. 435.7 509.3 376.7 452.0 617.0 705.7 509.0 599.6 621.6 698.0
Cu Cont. 130.7 152.7 113.0 135.6 185.2 211.7 152.7 179.9 186.5 209.4Poland Cu Cont. 0.0 1.6 1.6 0.0 0.0 13.1 33.8 18.4 18.7 23.4Russian Fed. Gross Wt. 127.0 163.0 143.9 12.3 117.1 122.9 76.7 63.2 124.8 138.4
Cu Cont. 39.1 50.3 43.2 3.7 35.1 36.9 23.0 18.9 37.5 41.5South Africa Gross Wt. 0.3 1.0 10.7 63.8 62.4 59.4 57.4 53.2 35.0 15.5
Cu Cont. 0.1 0.3 3.2 19.0 18.6 17.8 17.2 16.0 10.5 4.7Spain Gross Wt. 938.9 902.4 1,057.4 1,041.2 777.0 1,039.6 1,100.3 1,001.3 1,122.1 1,184.3
Cu Cont. 269.2 256.5 284.6 286.9 233.1 311.9 330.1 300.4 336.6 355.3Sweden Gross Wt. 151.4 314.5 349.4 300.6 339.1 299.3 261.3 416.1 393.6 370.8
Cu Cont. 45.4 94.4 114.1 90.2 101.7 89.4 78.4 124.8 118.1 111.2Thailand Gross Wt. 86.3 100.1 10.1 74.6 0.0 0.0
Cu Cont. 25.9 30.0 3.0 22.4 0.2 0.0Turkey Gross Wt. 56.9 45.1 61.3 54.4 10.4 44.6 8.7 0.0 3.9
Cu Cont. 14.2 13.5 18.6 16.4 3.2 13.4 2.6 0.0 1.2 United Kingdom Gross Wt. 0.5 0.8 0.8 0.6 0.3 0.3 2.6 1.7 0.7 0.6
Cu Cont. 0.2 0.2 0.4 0.2 0.1 0.1 0.8 0.5 0.2 0.2United States Gross Wt. 0.2 155.3 239.8 90.2 22.9 0.2 0.2 0.0 0.0
Cu Cont. 0.1 47.0 71.9 27.1 6.9 0.1 0.1 0.0 0.0 Serbia Gross Wt. 67.9 51.7 37.8 8.0 7.9 115.3 125.7 50.5 55.2 33.9
Cu Cont. 19.1 15.5 11.3 2.4 2.4 34.6 37.7 15.2 16.8 10.1Zambia Cu Cont. 1.1 0.1 0.9 8.4 18.3 6.2 51.3 23.4 85.9 Others Cu Cont. 18.9 2.6 2.7 69.9 100.4 25.8 1.8 3.0 6.9 2.3
TOTAL IMPORTS, copper content 3,974.3 4,240.1 4,110.5 4,118.2 4,461.9 4,992.9 5,468.9 5,579.4 5,819.1 5,643.9
EU-15 2/ Gross Wt. 2,005.3 2,475.8 2,663.1 2,427.3 2,452.7 2,635.2 2,695.5 2,825.9 2,771.0 2,840.6Cu Cont. 539.8 746.5 798.9 728.2 735.8 790.3 808.6 847.8 831.3 852.2
EU-25 3/ Gross Wt. 2,435.6 2,681.0 2,788.1 Cu Cont. 730.7 804.3 836.4
EU-27 4/ Gross Wt. 3,339.5 3,419.9 3,532.1Cu Cont. 1,001.9 1,026.0 1,059.6
Source: Official country trade statistics.p/ Preliminary. For some countries incomplete.1/ Conversion from Gross to Net, or vice versa, is based on 30% Cu grade, if no specific information available.2/ Includes only Extra EU-15 trade. 3/ Includes only Extra EU-25 trade. 4/ Includes only Extra EU-27 trade.
ICSG 2009 Statistical Yearbook- July 2010
- 32 -

TABLE 11B. EXPORTS OF COPPER ORES AND CONCENTRATES 1/
Thousand metric tonnes, gross weight and copper content
COUNTRY UNIT 2000 2001 2002 2003 2004 2005 2006 2007 2008 2009p/
Argentina Gross Wt. 509.7 693.0 749.7 696.4 692.8 690.6 671.8 685.5 628.2 545.9Cu Cont. 141.3 187.5 202.4 191.5 190.5 189.9 178.0 178.2 163.5 142.0
Australia Gross Wt. 1,064.2 1,248.0 1,153.8 1,366.4 1,184.0 1,607.0 1,634.4 1,541.6 1,806.6 1,919.3Cu Cont. 319.3 318.7 346.1 409.9 355.2 482.1 490.4 399.7 542.0 575.8
Armenia Gross Wt. 25.8 51.6 55.3 59.4 51.4 26.0 54.2 61.0 68.7 Cu Cont. 5.4 12.9 13.8 14.9 12.8 6.5 13.6 18.3 17.2
Bulgaria Gross Wt. 97.6 96.1 83.0 72.9 78.7 124.7 193.4 168.2 105.9 134.9Cu Cont. 19.5 19.2 16.6 14.6 15.7 25.2 58.0 50.5 31.8 40.5
Brazil Gross Wt. 0.0 0.0 0.0 0.0 229.3 387.8 364.0 573.2 637.9 597.4Cu Cont. 0.0 0.0 0.0 0.0 66.5 112.3 109.2 172.0 191.4 179.2
Canada Gross Wt. 683.5 631.2 494.9 569.5 529.8 852.2 894.4 704.8 1,039.5 857.7Cu Cont. 205.4 185.4 148.4 170.9 158.9 255.7 268.3 211.4 311.8 257.3
Chile Gross Wt. 4,997.7 5,137.7 4,436.3 5,135.9 6,510.9 6,257.1 6,530.8 6,822.5 6,464.8 5,591.2Cu Cont. 1,749.2 1,798.2 1,552.7 1,797.5 2,278.8 2,190.0 2,171.5 2,251.4 2,133.4 1,845.1
China Gross Wt. 39.8 64.0 35.8 62.1 14.4 0.9 0.1 0.7 1.7 0.5Cu Cont. 9.7 22.3 10.7 20.6 4.3 0.1 0.0 0.2 0.6 0.1
Colombia Gross Wt. 10.9 9.3 8.3 9.2 7.9 5.3 15.5 0.0 6.5 15.8Cu Cont. 2.4 2.1 1.9 2.1 1.6 1.2 3.4 0.0 2.0 4.8
Georgia Gross Wt. 46.5 60.5 62.5 72.2 61.9 64.2 62.4 59.2 94.7 Cu Cont. 9.3 15.1 15.6 18.0 15.5 16.1 15.6 17.8 20.8
Germany Gross Wt. 26.1 19.4 15.6 48.6 49.5 45.7 54.2 61.5 48.2 58.9Cu Cont. 7.8 5.8 4.7 14.4 14.7 13.7 17.3 18.5 14.5 17.7
India Gross Wt. 87.2 12.9 121.1 0.3 19.0 0.0 44.6 0.5 26.7 0.5Cu Cont. 22.3 3.9 31.8 0.1 5.7 0.0 13.4 0.2 8.0 0.2
Indonesia Gross Wt. 2,580.0 2,511.0 2,875.1 2,381.6 1,807.8 2,382.9 2,330.7 1,726.6 1,627.0 2,330.3Cu Cont. 812.7 803.7 920.0 762.1 578.2 762.5 699.2 518.0 488.1 699.1
Kazakhstan Gross Wt. 121.4 150.2 160.6 219.1 259.8 126.0 81.9 219.7 308.1 516.2Cu Cont. 35.2 45.0 48.2 65.7 77.9 37.8 24.6 65.9 92.5 154.9
Mauritania Gross Wt. 102.8 150.1 Cu Cont. 30.8 45.0
Mexico Gross Wt. 321.1 109.3 137.3 142.5 239.8 132.1 111.7 167.6 199.2 241.8Cu Cont. 79.4 32.8 35.1 42.9 71.9 39.6 33.5 50.3 59.7 72.5
Mongolia Gross Wt. 448.0 490.0 499.4 512.2 562.6 587.1 599.5 550.7 523.4 530.3Cu Cont. 123.7 134.2 134.6 130.5 126.5 129.2 179.9 132.2 126.3 125.8
Morocco Gross Wt. 23.2 19.0 17.5 18.4 12.4 14.8 17.2 25.3 33.6 58.4Cu Cont. 6.5 5.3 4.9 5.2 3.7 4.4 5.2 7.6 10.2 17.6
Macedonia Gross Wt. 40.6 27.1 17.5 3.7 0.6 21.4 31.6 32.2 Cu Cont. 10.1 6.8 4.4 0.9 0.2 5.4 7.9 9.7
Papua New Guinea Gross Wt. 643.9 712.3 706.7 632.3 561.3 622.6 626.3 563.5 532.3 Cu Cont. 187.9 213.7 212.0 196.0 174.0 193.0 194.1 169.0 159.7
Peru Gross Wt. 326.4 682.0 1,268.0 1,045.6 1,607.5 1,608.6 1,784.7 2,632.5 2,909.5 2,889.8Cu Cont. 97.9 205.0 380.0 313.1 482.1 482.7 528.3 789.7 872.9 866.9
Philippines Gross Wt. 92.3 63.6 57.1 40.3 29.8 61.4 68.9 102.3 110.3 164.0Cu Cont. 27.7 17.2 15.4 10.3 8.9 15.4 17.2 22.6 33.1 49.2
Poland Gross Wt. 0.0 0.0 20.4 0.0 0.1 0.0 9.0 0.0 0.0 0.0Cu Cont. 0.0 0.0 6.1 0.0 0.0 0.0 2.7 0.0 0.0 0.0
Portugal Gross Wt. 319.1 367.2 321.7 324.5 346.5 375.3 328.3 399.6 377.3 352.1Cu Cont. 76.9 88.0 77.7 76.4 83.2 90.1 98.5 91.9 92.1 90.8
Romania Gross Wt. 19.5 64.0 87.3 94.7 81.5 84.1 72.9 23.7 33.4 6.7Cu Cont. 5.8 19.0 17.5 18.9 16.3 16.8 14.6 7.1 10.0 2.0
Russian Fed. Gross Wt. 25.2 8.9 11.6 3.7 71.4 96.3 1.8 10.6 8.0 16.9Cu Cont. 7.6 2.7 3.5 1.1 21.3 29.1 0.5 3.2 2.4 4.9
South Africa Gross Wt. 2.3 30.4 18.5 25.8 41.1 50.2 140.0 236.8 361.1 261.4Cu Cont. 0.6 9.1 5.6 7.8 12.3 15.0 42.0 71.1 108.3 78.4
Spain Gross Wt. 26.4 72.0 5.8 1.7 4.3 14.0 6.4 1.0 0.5 110.7Cu Cont. 5.6 15.1 1.2 0.5 0.8 4.2 1.9 0.3 0.1 33.2
Sweden Gross Wt. 40.1 14.8 0.0 0.1 0.0 0.0 4.8 0.0 0.0 Cu Cont. 12.0 4.5 0.0 0.0 0.0 0.0 1.4 0.0 0.0
Turkey Gross Wt. 190.0 156.3 227.7 151.7 180.6 148.1 169.4 283.0 252.0 356.9Cu Cont. 51.3 42.2 61.5 41.0 54.3 44.4 50.8 84.9 75.6 107.1
ICSG 2009 Statistical Yearbook- July 2010
- 33 -

TABLE 11B. EXPORTS OF COPPER ORES AND CONCENTRATES 1/
Thousand metric tonnes, gross weight and copper content
COUNTRY UNIT 2000 2001 2002 2003 2004 2005 2006 2007 2008 2009p/
United States Gross Wt. 356.7 154.3 76.8 32.8 60.4 208.2 412.0 349.0 1,035.0 502.7Cu Cont. 107.0 46.3 23.0 9.9 23.7 62.4 123.6 104.7 301.2 150.8
Zambia Gross Wt. 2.0 3.7 6.8 17.9 55.9 163.8 364.2 154.4 349.9 Cu Cont. 0.6 1.1 2.0 5.4 16.8 49.1 109.3 46.3 72.5
Others Cu Cont. 14.7 12.5 7.4 7.2 2.7 18.5 38.6 124.4 128.7 5.4
TOTAL EXPORTS, Copper content 4,154.7 4,275.4 4,304.8 4,349.4 4,875.1 5,292.2 5,512.6 5,586.1 6,025.3 5,521.4
EU-15 2/ Gross Wt. 141.6 196.1 103.1 27.2 46.9 27.9 39.5 3.2 33.8 179.5Cu Cont. 42.5 58.9 30.9 8.2 14.1 8.5 11.9 0.9 10.1 53.8
EU-25 3/ Gross Wt. 46.6 27.8 40.1 Cu Cont. 14.0 8.3 12.0
EU-27 4/ Gross Wt. 136.8 144.5 255.6Cu Cont. 40.6 43.4 76.7
Source: Official country trade statistics.p/ Preliminary. For some countries incomplete.1/ Conversion from Gross to Net, or vice versa, is based on 30% Cu grade, if no specific information available.2/ Includes only Extra EU-15 trade. 3/ Includes only Extra EU-25 trade. 4/ Includes only Extra EU-27 trade.
TABLE 12A. IMPORTS OF COPPER BLISTER AND ANODEThousand metric tonnes, copper in blister and anode
COUNTRY 2000 2001 2002 2003 2004 2005 2006 2007 2008 2009p/
Austria 5.4 11.7 3.0 8.1 14.8 20.1 26.5 26.7 39.7 24.5
Australia 16.8 27.7 4.1 1.1 1.7 0.1 0.9 20.8 47.4 70.3
Belgium 215.1 150.0 207.9 291.2 291.1 237.6 267.5 224.1 220.8 212.1
Brazil 2.1 6.6 0.1 1.1 0.1 1.4 0.2 0.0 2.0 0.0
Canada 14.5 30.6 58.5 127.4 148.4 159.0 93.5 101.7 95.7 83.2
China 124.7 91.3 105.5 123.4 114.4 129.2 88.4 172.7 197.6 228.0
France 0.0 0.2 0.3 0.1 0.2 0.3 0.3 0.3 0.1 0.0
Germany 32.4 26.5 38.5 17.3 11.6 36.7 42.1 31.8 24.7 43.8
India 6.6 2.9 2.8 0.4 1.4 4.4 4.7 6.0 13.5 3.0
Italy 2.9 1.5 0.6 0.3 0.2 1.0 0.3 0.8 0.4 0.4
Japan 19.4 7.2 9.4 4.1 6.4 2.4 9.5 20.7 31.8 19.4
Korean Rep. 48.0 59.0 68.8 51.0 53.5 32.7 87.2 100.1 58.4 40.2
Malaysia 0.3 4.3 1.2 0.2 5.2 1.5 0.7 0.3 0.5 0.1
Mexico 81.8 119.1 74.6 63.2 70.0 64.2 77.7 75.2 66.5 37.5
Netherlands 0.1 0.0 0.0 2.9 10.2 39.8 83.1 74.8 64.3 51.1
Pakistan 0.0 0.0 0.0 4.1 12.4 4.5 0.0 0.0 0.0
Philippines 2.3 0.3 14.4 0.2 1.5 1.9 4.2 3.2 1.4 0.6
Romania 0.0 11.3 1.6 1.7 1.8 5.0 5.6 0.1 0.0 0.1
Singapore 1.1 0.8 1.3 1.1 1.0 1.2 0.8 0.4 0.6 2.0
Spain 17.6 16.0 9.2 15.3 2.5 0.3 3.1 1.0 1.7 3.0
Sweden 0.1 0.0 0.0 0.0 0.0 15.5 35.5 10.5 23.4 22.1
Taiwan 1.7 1.9 1.9 2.1 0.7 1.6 1.8 0.3 1.3 1.7
Thailand 0.3 0.3 0.3 0.8 5.8 1.2 33.5 11.4 2.0 1.3
Turkey 10.3 12.8 7.1 0.1 29.6 53.2 54.8 34.4 38.1 4.9
United Kingdom 1.1 0.4 0.1 0.0 0.1 2.0 0.2 7.4 6.3 3.0
United States 1/ 194.7 270.9 148.4 156.9 148.9 133.5 172.3 153.4 123.6 69.0
Others 4.5 4.7 1.7 1.8 2.3 8.5 43.0 33.5 39.2 46.0
TOTAL IMPORTS 803.7 857.9 761.3 875.9 935.8 958.7 1,137.6 1,111.7 1,101.1 967.3
EU-15 2/ 259.6 174.9 198.6 251.3 232.0 239.4 271.4 263.4 247.7 256.7
EU-25 3/ 234.6 226.2 267.7
EU-27 4/ 147.2 116.9 158.8Source: Official country trade statistics.p/ Preliminary. For some countries incomplete. 1/ Imports for consumption.2/ Includes only Extra EU-15 trade. 3/ Includes only Extra EU-25 trade. 4/ Includes only Extra EU-27 trade.
ICSG 2009 Statistical Yearbook- July 2010
- 34 -

TABLE 12 B. EXPORTS OF COPPER BLISTER AND ANODEThousand metric tonnes, copper in blister and anode
COUNTRY 2000 2001 2002 2003 2004 2005 2006 2007 2008 2009p/
Armenia 7.1 6.9 6.7 6.0 9.5 9.2 8.8 7.0 6.2 6.9
Australia 0.0 2.5 2.3 6.1 0.1 0.0 0.0 0.0 0.0 0.0
Belgium 17.7 12.3 3.5 10.5 19.9 4.5 8.8 10.8 11.1 12.0
Botswana 1/ 0.0 0.0 0.0 0.0 0.0 0.0 0.0
Bulgaria 147.5 119.1 128.9 173.0 170.0 177.4 168.5 139.3 151.5 73.4
Canada 53.9 80.0 84.2 84.2 76.0 87.1 88.3 95.9 85.2 62.1
Chile 174.6 154.9 182.3 275.9 336.1 321.4 457.1 415.4 407.8 395.8
China 2.4 2.4 3.4 1.5 1.3 3.7 2.8 0.0 6.1 0.0
Finland 41.5 51.8 43.2 33.1 25.6 29.7 35.0 10.5 27.6 37.1
France 0.9 1.1 0.6 5.7 6.2 3.4 1.6 0.4 0.5 0.9
Germany 0.0 5.0 2.2 1.6 0.1 1.4 3.2 0.1 0.2 0.1
Hong Kong 3.1 1.7 0.9 0.9 0.9 1.8 0.2 0.0 0.0 0.3
India 0.5 0.0 0.2 4.4 1.9 7.6 7.9 0.8 0.3 0.0
Indonesia 13.9 5.4 14.5 17.2 1.0 0.0 0.0 5.0 0.1 7.8
Italy 9.9 25.9 4.4 0.7 6.7 2.8 3.9 11.1 6.4 2.8
Japan 42.8 45.1 50.4 10.4 8.1 11.8 9.3 9.8 12.5 1.9
Kazakhstan 1.0 9.4 7.3 5.7 10.0 7.1 2.5 0.0 0.0 5.8
Mexico 22.2 23.9 18.4 16.1 21.3 17.8 19.8 24.0 13.7 8.5
Namibia 10.2 5.7 21.4 22.0 26.9 25.7 21.0 35.7 103.7
Netherlands 0.0 0.0 0.0 0.0 19.7 2.2 0.4 78.4 64.5 50.4
Peru 26.5 32.6 34.0 25.4 28.2 49.7 20.0 23.5 10.0 23.2
Philippines 0.0 0.0 0.0 0.0 0.2 0.0 0.5 0.0 16.4 0.1
Poland 0.0 0.0 17.3 0.0 0.0 0.0 0.0 0.0 0.0 18.4
Romania 5.0 6.7 4.9 0.2 0.0 0.0 0.0 0.0 0.0 0.3
Russian Fed. 3.7 6.5 6.9 0.0 0.0 0.0 6.7 0.0 0.0
Singapore 0.4 0.3 0.4 1.3 1.0 0.5 0.7 0.3 0.6 0.2
South Africa 0.9 32.6 25.6 16.2 3.0 7.0 11.0 9.3 3.8 5.8
Spain 27.1 35.1 21.1 37.4 50.9 62.3 44.4 37.2 41.7 38.8
Sweden 0.0 3.6 0.0 0.9 0.1 0.1 0.0 0.3 0.0 0.0
Taipei, China 2.4 3.9 2.5 0.6 0.9 1.9 0.3 0.0 0.1 0.5
Turkey 4.2 17.5 16.9 15.5 5.4 11.3 7.4 5.9 34.7 4.2
Ukraine 18.0 21.5 8.7 2.9
United Kingdom 0.4 0.1 0.3 0.9 0.8 0.3 0.2 0.8 2.7 0.2
United States 23.4 27.0 34.5 26.1 46.5 41.7 18.9 15.7 23.5 26.0
Others 0.6 1.2 2.7 9.3 16.9 34.9 43.2 54.7 34.6 27.1
TOTAL EXPORTS 661.8 741.9 750.7 811.5 895.3 924.4 992.3 991.9 1,065.6 810.5
EU-15 2/ 23.3 32.7 1.5 19.8 40.2 14.9 13.9 18.5 14.1 35.1
EU-25 3/ 40.3 14.1 2.3
EU-27 4/ 47.6 33.1 26.3
Source: Official country trade statistics.p/ Preliminary. For some countries it represents partial year.1/ Copper content of copper/nickel matte.2/ Includes only Extra EU-15 trade. 3/ Includes only Extra EU-25 trade. 4/ Includes only Extra EU-27 trade.
ICSG 2009 Statistical Yearbook- July 2010
- 35 -

TABLE 13A. IMPORTS OF REFINED COPPERThousand metric tonnes, refined copper
COUNTRY 2000 2001 2002 2003 2004 2005 2006 2007 2008 2009p/
Argentina 33.0 27.6 4.7 12.0 17.1 17.6 14.4 14.6 14.5 11.4Australia 4.6 1.6 7.3 23.3 0.4 1.9 1.3 0.9 7.5 0.2Austria 36.4 35.7 24.5 28.1 17.6 21.2 29.3 20.6 0.2 0.3Belgium 40.7 44.1 37.2 58.3 17.3 9.5 21.8 27.9 54.2 80.0Brazil 157.8 141.0 103.2 151.2 154.2 167.7 175.4 218.0 251.9 208.7Bulgaria 7.7 15.5 7.8 3.1 8.1 18.4 17.5 24.9 29.4 7.7Canada 11.9 8.0 11.7 21.7 53.3 64.6 58.7 11.7 11.2 10.2China 687.4 835.0 1,181.0 1,357.3 1,200.1 1,222.2 826.9 1,553.0 1,504.0 3,184.9Colombia 3.7 4.7 5.6 5.2 8.6 12.8 12.4 9.7 6.4 6.2Czech Rep. 14.2 18.2 11.9 6.1 4.3 4.0 4.7 12.7 10.3 21.3Egypt 8.5 33.4 40.6 66.5 67.4 149.3 158.9 104.9 180.1 Finland 9.6 5.5 0.3 0.1 0.0 0.0 0.1 2.1 2.4 16.3France 585.8 564.4 576.4 578.5 590.3 516.9 506.7 431.9 433.9 265.2Germany 689.7 527.7 459.2 516.6 584.9 703.7 902.8 843.7 833.2 658.7Greece 135.6 129.8 126.0 108.7 120.1 90.6 106.4 105.7 75.8 57.4Hong Kong, China 54.0 59.7 48.9 65.3 46.7 47.1 37.2 33.3 16.8 73.6Hungary 19.7 18.5 17.0 11.8 8.6 1.3 0.7 1.1 1.4 0.6India 8.1 6.2 12.1 45.9 31.1 36.8 12.8 12.5 15.7 15.5Indonesia 32.7 56.3 50.5 15.9 15.8 21.1 17.7 8.1 64.8 45.5Iran 0.5 2.5 11.1 27.8 23.6 22.3 Italy 604.3 649.7 643.4 650.8 700.8 654.4 772.2 743.4 617.4 544.2Japan 202.9 156.1 114.4 78.7 88.2 74.1 75.2 102.3 90.8 42.3Kazakhstan 3.2 11.8 3.0 0.1 0.1 0.1 0.8 5.1 1.3 0.1Korean Rep. 418.9 379.9 427.2 437.8 487.7 428.1 380.3 419.8 406.5 488.1Malaysia 166.7 161.4 173.2 134.2 150.0 171.1 198.3 199.0 178.8 171.3Mexico 143.0 126.0 66.8 64.6 56.9 52.3 46.1 23.1 41.3 56.6Netherlands 154.9 123.7 156.1 120.9 125.3 135.0 319.5 307.4 291.2 227.9New Zealand 2.6 7.5 0.8 0.2 0.1 0.0 0.0 0.0 0.0 Pakistan 10.0 13.0 16.9 14.8 17.4 18.7 23.8 15.6 10.1 Philippines 13.4 12.1 11.5 12.6 10.7 9.7 6.9 8.1 8.6 6.8Poland 0.5 0.4 0.2 0.4 1.0 0.7 12.6 7.0 6.5 12.9Portugal 0.1 0.1 0.1 2.4 1.7 0.1 0.1 0.7 1.1 3.7Romania 14.5 23.7 10.9 1.4 4.1 3.4 5.9 23.6 20.5 9.3Russian Fed. 8.4 3.3 0.2 0.8 0.0 0.4 2.2 0.1 9.5 1.5Saudi Arabia 79.3 66.5 72.0 79.2 81.8 91.8 159.8 152.2 Singapore 53.7 66.8 40.2 34.1 48.1 41.3 124.1 62.5 44.8 76.3Slovakia 1.1 6.9 11.3 3.6 1.1 1.5 1.5 0.8 7.6 2.8Slovenia 0.9 1.1 1.2 1.2 1.2 1.1 1.4 1.2 1.4 South Africa 3.2 3.9 6.2 1.3 14.3 10.1 5.6 5.9 5.6 8.0Spain 31.4 42.5 26.7 33.7 74.3 69.1 65.8 56.1 79.1 80.9Sweden 82.4 49.1 37.0 48.5 34.9 40.1 41.0 31.5 21.2 23.0Switzerland 7.6 8.6 5.9 5.1 6.7 4.7 4.8 5.9 5.9 3.5Taipei, China 629.0 540.7 655.7 621.6 692.4 640.2 646.6 614.8 585.0 498.4Thailand 150.6 166.5 186.2 204.4 224.1 234.5 267.6 244.2 265.0 213.9Tunisia 3.5 5.0 3.8 3.2 3.2 3.9 3.0 2.2 1.2 Turkey 184.2 137.1 206.0 229.1 217.3 232.5 144.5 288.1 287.7 291.2Ukraine 5.8 12.6 4.9 9.6 13.4 10.4 7.4 8.8 2.6 1.2United Kingdom 338.6 311.4 316.0 246.5 214.1 181.8 184.2 46.8 48.1 43.5United Arab Emirates 1.1 1.1 3.7 37.0 United States 1/ 1,055.6 990.8 926.8 882.2 703.9 977.1 1,076.4 831.7 723.6 663.6Vietnam 17.3 25.2 21.6 43.5 50.1 68.0 170.6 96.1 59.0 Venezuela 1.0 2.4 0.7 0.3 2.8 2.7 3.0 3.7 8.1 Serbia 1.4 1.7 5.3 16.7 38.7 34.1 14.1 21.9 23.9 20.9Zimbabwe 15.6 10.2 1.7 0.7 Others 3.1 8.9 4.6 2.2 12.4 24.2 31.0 46.4 10.6 0.1TOTAL IMPORTS 6,935.1 6,651.6 6,894.0 7,088.9 7,063.9 7,357.1 7,704.9 7,817.7 7,414.5 8,155.9EU-15 2/ 2,299.6 2,149.1 1,933.1 1,910.9 2,044.1 1,789.8 2,159.5 1,954.8 1,719.9 1,443.9EU-25 3/ 1,843.9 1,608.9 1,926.2
EU-27 4/ 1,810.5 1,550.5 1,215.5
Source: Official country trade statistics.p/ Preliminary. For some countries incomplete.1/ Imports for consumption.2/ Includes only Extra EU-15 trade. 3/ Includes only Extra EU-25 trade. 4/ Includes only Extra EU-27 trade.
ICSG 2009 Statistical Yearbook- July 2010
- 36 -

TABLE 13 B. EXPORTS OF REFINED COPPERThousand metric tonnes, refined copper
COUNTRY 2000 2001 2002 2003 2004 2005 2006 2007 2008 2009p/
Australia 323.4 397.0 363.5 324.0 322.9 315.5 286.6 294.9 358.3 316.2Austria 90.1 70.1 61.4 68.1 57.5 83.3 84.1 82.7 8.0 15.0Belgium 199.1 241.0 199.4 336.6 169.6 241.4 236.8 199.4 260.3 235.1Brazil 13.5 15.0 51.3 24.0 21.9 32.9 56.0 102.0 93.1 88.6Bulgaria 27.4 30.7 40.9 42.6 48.2 40.4 37.1 36.4 97.5 152.7Canada 288.9 309.7 238.1 218.9 279.8 297.0 279.9 297.7 290.0 221.8Chile 2,549.2 2,742.0 2,770.2 2,565.5 2,950.3 2,782.1 2,605.7 2,909.8 2,983.3 3,179.2China 116.3 51.0 76.6 64.4 123.9 140.2 243.0 125.9 96.1 73.0Cyprus 5.1 5.0 3.7 2.6 1.3 0.0 0.9 3.0 3.0 2.4Czech Rep. 4.9 1.5 1.6 0.9 7.2 3.4 9.5 6.8 4.0 10.6Finland 16.7 20.0 38.9 34.3 27.6 40.2 55.2 33.0 66.9 40.8France 11.6 26.8 15.1 27.3 54.5 44.7 46.3 95.3 54.9 50.4Germany 94.0 108.2 91.0 117.6 137.2 162.1 150.3 117.4 125.0 194.0Greece 1.0 0.1 0.3 1.5 1.9 1.2 2.5 1.9 0.4 0.8Hong Kong, China 49.8 48.2 43.7 53.8 37.0 34.0 20.7 18.4 7.9 40.3India 30.9 50.0 89.3 105.4 132.8 162.8 254.7 215.4 169.5 185.4Indonesia 134.7 158.8 134.2 196.0 243.3 280.1 110.9 168.8 143.3 196.9Iran 43.5 56.8 32.9 46.9 54.7 31.8 91.7 Italy 2.1 2.2 3.1 12.8 17.8 4.5 10.6 11.5 7.0 27.8Japan 299.3 415.5 377.8 289.9 194.6 247.7 319.8 428.1 423.5 626.7Kazakhstan 392.5 398.9 391.4 375.7 391.0 401.2 357.2 348.5 343.5 308.7Korean Rep. 27.1 8.1 14.7 41.9 46.7 86.6 143.9 139.8 127.5 86.9Mexico 76.2 129.1 55.2 20.5 24.1 37.6 62.0 57.0 33.1 33.3Mongolia 0.5 0.5 1.5 1.3 2.5 2.3 2.4 3.0 Myanmar 24.0 25.9 26.6 Netherlands 0.7 3.0 4.1 10.6 9.3 34.4 313.7 303.2 280.6 228.2Norway 26.1 24.5 32.2 35.4 35.6 37.7 38.2 33.6 36.7 30.3Oman 24.4 24.8 24.0 17.0 15.1 16.9 20.7 9.4 9.4 6.1Peru 408.0 427.2 458.0 461.3 447.4 469.2 441.7 334.8 390.5 365.9Philippines 128.8 156.9 144.5 161.3 160.0 113.7 183.3 181.5 181.5 151.8Poland 240.3 226.9 262.4 276.6 275.1 290.5 287.7 239.6 296.7 305.7Romania 12.8 14.2 3.1 0.4 0.0 0.1 0.7 0.0 0.0 0.0Russian Fed. 631.3 588.0 505.7 395.4 331.5 300.7 261.8 277.8 221.5 482.6Singapore 74.6 60.8 59.2 37.9 39.3 34.4 97.7 68.6 42.1 46.8Saudi Arabia 2.9 5.2 6.4 3.6 2.4 1.4 2.4 1.6 South Africa 31.4 38.3 21.1 18.4 10.2 20.2 29.9 17.6 12.2 11.1Spain 57.5 24.0 24.0 47.2 32.7 48.6 44.5 50.6 78.6 105.2Sri Lanka 0.0 0.4 22.3 40.5 37.3 33.1 0.0 0.0 Sweden 12.2 70.7 91.9 77.2 81.9 99.8 86.7 66.0 71.6 77.8Taipei, China 0.6 0.7 1.1 2.1 2.2 2.0 6.6 11.8 2.7 4.8Ukraine 49.5 32.5 2.5 3.3 5.1 5.4 4.6 3.2 5.5United Kingdom 10.2 10.4 33.7 2.2 6.6 16.0 6.7 8.5 4.7 14.0United States 93.6 22.8 26.6 93.3 127.1 51.1 123.6 51.7 38.3 85.7Uzbekistan 21.4 48.8 38.2 64.0 66.8 79.4 58.5 65.7 49.3 Serbia 38.8 54.7 43.6 8.2 4.9 21.9 13.7 10.3 3.4 3.7Zambia 200.0 296.4 328.8 353.4 393.1 405.4 475.7 490.9 585.2 675.4Others 7.0 4.1 6.4 3.4 15.7 36.4 57.2 78.5 39.1 2.8TOTAL EXPORTS 6,844.7 7,464.4 7,292.3 7,084.3 7,445.9 7,590.8 8,024.1 8,003.0 8,043.5 8,689.9EU-15 1/ 46.9 39.1 69.4 78.8 79.9 110.5 138.9 144.9 135.8 492.0EU-25 2/ 123.2 157.9 104.7
EU-27 3/ 119.0 257.7 543.8
Source: Official country trade statistics.
p/ Preliminary. For some countries incomplete.1/ Includes only Extra EU-15 trade. 2/ Includes only Extra EU-25 trade. 3/ Includes only Extra EU-27 trade.
ICSG 2009 Statistical Yearbook- July 2010
- 37 -

TABLE 14A. IMPORTS OF COPPER ALLOY INGOTSThousand metric tonnes, gross weight metal
COUNTRY Ingot 2000 2001 2002 2003 2004 2005 2006 2007 2008 2009Type p/
Cu Alloy 2.608 3.488 3.880 3.348 2.839 2.466 3.698 3.890 2.394 Australia Master 1.578 0.492 0.511 0.780 1.085 0.447 0.363 0.573 0.246 2.553
Total 4.186 3.980 4.391 4.128 3.924 2.913 4.061 4.463 2.640 2.553Cu Alloy 4.086 2.705 1.995 2.590 2.004 1.808 2.378 2.080 1.637 1.237
Austria Master 0.263 0.331 0.331 0.457 0.435 0.453 0.502 0.426 0.513 0.469 Total 4.349 3.036 2.326 3.047 2.439 2.261 2.880 2.506 2.150 1.706Cu Alloy 1.588 2.053 1.827 3.040 2.620 2.006 2.041 2.323 2.654
Belarus Master 0.001 0.010 0.008 0.008 0.012 0.012 0.065 0.079 0.081 Total 1.589 2.063 1.835 3.048 2.632 2.018 2.106 2.402 2.735 Cu Alloy 3.372 2.976 1.511 1.440 1.329 1.740 1.034 2.463 1.603 2.510
Belgium Master 0.311 0.735 0.155 0.184 0.181 0.165 0.049 0.240 0.107 0.037 Total 3.683 3.711 1.666 1.624 1.510 1.905 1.083 2.703 1.710 2.547Cu Alloy 11.989 8.479 7.255 6.528 14.369 14.084 12.002 10.098 12.044 4.840
Canada Master 0.293 0.308 0.485 0.531 0.574 0.373 0.418 0.401 0.223 0.101 Total 12.282 8.788 7.740 7.059 14.943 14.457 12.420 10.499 12.267 4.941Cu Alloy 19.705 27.853 43.285 81.560 65.975 61.481 54.232 59.057 47.774 52.695
China Master 0.102 0.089 0.156 0.425 0.580 2.137 0.533 0.748 0.384 Total 19.806 27.942 43.441 81.985 66.555 63.618 54.765 59.805 48.158 52.695Cu Alloy 2.456 2.484 2.485 2.180 1.967 1.523 4.029 3.161 3.389
Denmark Master 0.031 0.016 0.008 0.008 0.069 0.002 0.001 0.001 0.001 Total 2.487 2.500 2.493 2.188 2.036 1.525 4.030 3.162 3.390 Cu Alloy 4.119 3.553 3.500 3.942 2.446 2.841 3.782 3.814 2.967 2.158
Finland Master 0.354 0.345 0.264 0.388 0.332 0.388 0.214 0.364 0.211 Total 4.473 3.898 3.764 4.330 2.778 3.229 3.996 4.178 3.178 2.158Cu Alloy 14.837 7.933 10.532 6.220 5.545 8.000 9.228 13.076 7.840 7.062
France Master 6.207 5.070 3.124 2.094 2.029 2.133 1.804 1.203 1.083 0.886 Total 21.044 13.003 13.656 8.314 7.574 10.133 11.032 14.279 8.923 7.948Cu Alloy 37.800 29.200 21.100 32.047 18.483 23.365 30.947 39.014 31.423 32.307
Germany Master 6.464 6.600 5.720 6.365 5.587 5.431 7.903 8.669 8.652 6.127 Total 44.264 35.800 26.820 38.412 24.070 28.796 38.850 47.683 40.075 38.434Cu Alloy 0.349 0.398 0.447 0.550 0.343 0.242 4.316 6.639 9.181 0.142
Greece Master 0.275 0.190 0.250 0.290 0.208 0.246 0.123 0.220 0.211 0.161 Total 0.624 0.588 0.697 0.840 0.551 0.488 4.439 6.859 9.392 0.303Cu Alloy 4.267 5.719 6.908 7.164 10.458 7.323 7.274 4.398 2.511 2.739
Hong Kong Master 0.017 0.011 0.016 0.016 0.033 0.306 0.413 0.221 0.020 0.033 Total 4.284 5.730 6.924 7.180 10.491 7.629 7.687 4.619 2.531 2.772Cu Alloy 1.843 1.457 1.908 2.449 2.575 1.767 1.367 1.270 1.166 1.097
Hungary Master 0.130 0.074 0.071 0.110 0.169 0.228 0.108 0.091 0.072 0.020 Total 1.973 1.531 1.979 2.559 2.744 1.995 1.475 1.361 1.238 1.117Cu Alloy 0.815 1.441 1.329 3.700 6.641 6.177 3.073 3.449 4.260 2.952
India Master 0.001 0.027 0.021 0.048 0.051 0.079 0.085 0.131 0.064 Total 0.816 1.468 1.350 3.748 6.692 6.256 3.158 3.580 4.324 2.952Cu Alloy 2.844 3.436 1.557 2.600 1.505 1.294 1.414 1.654 6.870 2.040
Indonesia Master 0.008 0.126 0.000 0.015 0.073 0.008 0.006 0.027 0.050 Total 2.852 3.562 1.557 2.615 1.578 1.302 1.420 1.681 6.920 2.040Cu Alloy 18.229 19.275 18.290 20.780 15.540 7.055 14.216 23.915 17.619 7.488
Italy Master 2.231 2.299 1.516 1.187 1.207 1.011 0.991 1.159 0.913 0.678 Total 20.460 21.574 19.806 21.967 16.747 8.066 15.207 25.074 18.532 8.166Cu Alloy 3.906 2.814 2.116 1.281 1.966 2.967 2.216 2.247 2.240 0.616
Japan Master 1.661 1.176 1.523 1.067 1.094 0.825 0.982 0.740 0.676 0.457 Total 5.567 3.990 3.639 2.348 3.060 3.792 3.198 2.986 2.916 1.073Cu Alloy 0.378 0.776 0.196 4.905 2.276 0.545 3.762 12.654 26.564 21.173
Korean Rep. Master 0.477 0.450 0.453 0.430 0.443 0.364 0.519 0.362 0.232 0.183 Total 0.855 1.226 0.649 5.335 2.719 0.909 4.281 13.016 26.796 21.356Cu Alloy 0.764 3.303 2.180 2.500 0.000 0.000 0.000
Malaysia Master 0.061 0.050 0.130 0.094 0.000 0.171 0.192 0.874 0.285 Total 0.825 3.353 2.310 2.594 0.000 0.171 0.192 0.874 0.285 Cu Alloy 5.462 3.946 6.100 6.048 6.163 5.651 6.019 5.923 7.231 6.240
Mexico Master 1.514 2.316 2.990 3.490 0.708 0.622 0.746 0.657 0.983 Total 6.976 6.262 9.090 9.538 6.871 6.273 6.765 6.580 8.214 6.240
ICSG 2009 Statistical Yearbook- July 2010
- 38 -

TABLE 14A. IMPORTS OF COPPER ALLOY INGOTSThousand metric tonnes, gross weight metal
COUNTRY Ingot 2000 2001 2002 2003 2004 2005 2006 2007 2008 2009Type p/
Cu Alloy 1.217 1.523 1.536 1.356 2.066 1.735 2.083 3.334 2.089 2.683Netherlands Master 0.087 0.102 0.191 0.123 0.104 0.168 0.131 0.045 0.195 0.108
Total 1.304 1.625 1.727 1.479 2.170 1.903 2.214 3.379 2.284 2.791Cu Alloy 0.657 0.103 0.396 0.427 0.328 0.504 0.374 0.615 0.564
New Zealand Master 0.046 0.030 0.022 0.006 0.008 0.009 0.012 0.018 0.007 Total 0.703 0.133 0.418 0.433 0.336 0.513 0.386 0.633 0.571 Cu Alloy 3.221 3.234 3.403 0.980 2.198 2.064 1.505 2.418 1.551 0.939
Norway Master 0.063 0.037 0.009 0.102 0.024 0.037 0.088 0.005 0.005 0.105 Total 3.284 3.271 3.412 1.082 2.222 2.101 1.593 2.423 1.556 1.044Cu Alloy 7.580 1.610 1.115 1.750 1.981 3.141 3.660 3.911 2.710 2.002
Poland Master 0.010 0.033 0.089 0.089 0.116 0.080 0.409 0.185 0.498 0.294 Total 7.590 1.643 1.204 1.839 2.097 3.221 4.069 4.096 3.208 2.296Cu Alloy 3.303 3.480 4.350 5.220 6.009 4.360 5.591 3.788 4.034 3.498
Portugal Master 0.004 0.011 0.014 0.018 0.031 0.124 0.086 0.321 0.306 0.330 Total 3.307 3.491 4.364 5.238 6.040 4.484 5.677 4.109 4.340 3.828Cu Alloy 1.195 1.861 1.300 0.853 1.292 1.288 1.229 1.391 1.381 1.372
Romania Master 0.000 0.013 0.001 0.001 0.017 0.003 0.003 0.048 0.173 0.164 Total 1.195 1.874 1.301 0.854 1.309 1.291 1.232 1.439 1.554 1.536Cu Alloy 0.567 0.076 0.327 0.555 0.195 0.037 0.004 0.100 0.018
Russian Fed. Master 0.006 0.076 0.327 0.559 0.195 0.054 0.062 0.100 0.078 Total 0.573 0.152 0.654 1.114 0.390 0.091 0.066 0.200 0.096 Cu Alloy 5.037 3.041 5.370 5.700 22.469 9.641 12.060 7.740 4.525 3.330
Singapore Master 0.051 0.029 0.014 0.114 0.236 0.331 0.049 0.070 0.070 Total 5.088 3.070 5.384 5.814 22.705 9.972 12.109 7.810 4.595 3.330Cu Alloy 2.473 1.925 2.633 2.504 1.555 1.503 1.590 1.431 1.098
Slovenia Master 0.076 0.139 0.116 0.132 0.132 0.122 0.138 0.138 0.111 Total 2.549 2.064 2.749 2.636 1.687 1.625 1.728 1.569 1.209 Cu Alloy 9.996 5.985 6.887 3.470 2.386 4.122 5.558 4.964 3.888 2.593
Spain Master 0.308 0.514 0.413 0.704 3.386 0.250 0.403 0.371 0.377 0.534 Total 10.304 6.499 7.300 4.174 5.772 4.372 5.961 5.335 4.265 3.127Cu Alloy 3.634 3.572 4.361 2.555 2.574 2.763 3.719 6.893 4.823 2.020
Sweden Master 0.330 0.241 0.262 0.386 0.208 0.194 0.288 0.310 0.423 0.114 Total 3.964 3.813 4.623 2.941 2.782 2.957 4.007 7.203 5.246 2.134Cu Alloy 2.929 3.012 2.947 3.056 3.858 3.429 8.010 3.540 3.518 3.000
Switzerland Master 0.634 0.741 0.353 0.439 0.623 0.468 0.331 0.464 0.406 Total 3.563 3.753 3.300 3.495 4.481 3.897 8.341 4.004 3.924 3.000Cu Alloy 12.812 11.930 10.738 19.197 12.488 9.543 13.862 11.460 14.380 9.379
Taipei, China Master 0.444 0.334 0.500 0.378 0.486 0.440 0.464 0.443 0.443 0.381 Total 13.256 12.264 11.238 19.575 12.974 9.983 14.326 11.903 14.823 9.760Cu Alloy 8.133 8.461 8.750 11.748 11.618 10.443 9.644 9.940 6.729 6.060
Thailand Master 0.070 0.085 0.081 0.081 0.117 0.121 0.117 0.085 0.152 Total 8.203 8.546 8.831 11.829 11.735 10.564 9.761 10.025 6.881 6.060Cu Alloy 1.333 0.301 1.074 3.690 4.525 3.708 2.760 0.060 2.904 2.910
Turkey Master 0.044 0.015 0.033 0.074 0.160 0.096 0.015 0.107 0.157 Total 1.377 0.316 1.107 3.764 4.685 3.804 2.775 0.167 3.061 2.910Cu Alloy 4.783 5.884 4.056 4.430 6.478 5.371 5.478 5.140 5.555 3.731
United Kingdom Master 0.839 1.025 1.081 1.761 1.592 0.820 0.921 0.714 0.500 0.234 Total 5.622 6.909 5.137 6.191 8.070 6.191 6.399 5.854 6.055 3.965Cu Alloy 9.394 6.514 5.010 3.953 5.320 5.209 9.254 8.259 7.566 4.166
United States Master 0.234 0.468 0.330 0.080 0.676 0.597 0.968 0.908 1.407 0.385 Total 9.628 6.982 5.340 4.033 5.996 5.806 10.222 9.167 8.973 4.551Cu Alloy 7.169 6.380 2.926 7.988 10.303 11.926 19.627 24.926 23.161 13.771
Others Master 0.628 0.810 0.599 2.134 1.623 2.576 1.702 1.545 1.397 0.074 Total 7.797 7.190 3.525 10.122 11.926 14.502 21.329 26.470 24.558 13.845
Cu Alloy 226.850 202.182 205.581 274.305 262.687 233.122 273.036 301.034 281.861 208.749
TOTAL IMPORTS, Master 25.852 25.418 22.165 25.165 24.604 21.891 22.203 23.063 21.712 14.428by Ingot Type Total 252.702 227.600 227.745 299.469 287.291 255.013 295.239 324.096 303.573 223.177
Source: Official country trade statistics.p/ Preliminary. For some countries incomplete.
ICSG 2009 Statistical Yearbook- July 2010
- 39 -

TABLE 14B. EXPORTS OF COPPER ALLOY INGOTSThousand metric tonnes, gross weight metal
COUNTRY Ingot 2000 2001 2002 2003 2004 2005 2006 2007 2008 2009Type p/
Cu Alloy 2.711 5.910 3.222 6.557 4.097 4.614 4.992 4.849 5.194 4.212
Australia Master 0.007 0.002 0.000 0.000 0.043 0.002 0.011 0.003 0.005
Total 2.718 5.912 3.222 6.557 4.140 4.616 5.003 4.852 5.199 4.212
Cu Alloy 1.506 1.117 0.921 0.850 0.531 0.563 2.491 1.183 0.896 1.094
Austria Master 0.002 0.001 0.028 0.001 0.051 0.042 0.020 0.061 0.039 0.019
Total 1.508 1.118 0.949 0.851 0.582 0.605 2.511 1.244 0.935 1.113
Cu Alloy 14.495 9.225 5.146 10.997 1.373 2.614 1.050 2.527 1.681 1.070
Belgium Master 10.361 11.040 9.980 10.604 12.183 11.849 12.369 12.231 11.046 8.441
Total 24.856 20.265 15.126 21.601 13.556 14.463 13.419 14.758 12.727 9.511
Bulgaria Cu Alloy 2.550 1.800 4.000 2.900 1.200 1.196 5.002 9.369 10.811 0.149
Cu Alloy 3.148 2.743 3.082 2.581 3.523 3.456 7.380 6.229 4.580 1.728
Canada Master 0.006 0.310 0.004 0.010 0.004 0.000 0.104 0.026 0.048 0.060
Total 3.154 3.053 3.086 2.591 3.527 3.456 7.484 6.255 4.628 1.788
Cu Alloy 1.323 0.327 0.487 0.652 0.577 0.364 0.281 0.285 0.285 0.141
China Master 0.638 0.451 0.840 0.594 0.617 0.482 0.697 0.378 0.178
Total 1.961 0.779 1.327 1.245 1.194 0.846 0.978 0.663 0.463 0.141
Cu Alloy 0.398 0.385 0.090 0.396 0.619 0.865 3.115 3.517 4.239 3.979
Czech Rep. Master 0.010 0.020 0.006 0.001 0.005 0.006 0.021 0.030 0.039 0.015
Total 0.407 0.405 0.096 0.397 0.624 0.871 3.136 3.547 4.278 3.994
Cu Alloy 0.189 0.059 0.020 0.051 0.028 0.023 0.033 0.066 0.442
Denmark Master 0.001 0.001 0.008 0.002 0.029 0.112 0.072 0.001 0.009
Total 0.190 0.060 0.028 0.053 0.057 0.135 0.105 0.067 0.451
Cu Alloy 0.847 1.330 1.037 0.730 0.903 0.944 1.870 0.587 0.422 0.270
Finland Master 0.000 0.052 0.008 0.000 0.000 0.000 0.096 0.000
Total 0.847 1.382 1.045 0.730 0.903 0.944 1.966 0.587 0.422 0.270
Cu Alloy 8.821 6.362 6.300 6.520 11.455 9.796 9.614 13.066 12.990 9.315
France Master 4.964 5.108 3.037 0.065 0.491 0.063 0.070 0.074 0.064 0.055
Total 13.785 11.470 9.337 6.585 11.946 9.859 9.684 13.140 13.054 9.370
Cu Alloy 32.300 24.300 23.800 19.150 18.275 18.082 20.603 18.283 14.476 8.493
Germany Master 3.387 3.039 3.100 2.300 2.767 2.947 2.834 2.645 2.011 1.285
Total 35.687 27.339 26.900 21.450 21.042 21.029 23.437 20.928 16.487 9.778
Cu Alloy 5.069 6.468 7.473 8.826 13.049 11.097 10.759 8.804 3.072 2.538
Hong Kong Master 0.008 0.007 0.004 0.001 0.010 0.011 0.265 0.211 0.146 0.043
Total 5.077 6.475 7.477 8.827 13.059 11.108 11.024 9.015 3.218 2.581
Cu Alloy 1.524 1.878 0.764 7.030 9.536 12.357 10.490 11.104 6.867 3.393
India Master 0.004 0.001 0.049 0.047 0.033 0.050 0.127 0.098 0.262
Total 1.528 1.879 0.813 7.077 9.569 12.407 10.617 11.202 7.129 3.393
Cu Alloy 0.150 0.331 0.111 0.127 1.028 3.649 2.699 1.749 0.930 0.330
Indonesia Master 0.013 0.002 0.304 0.003 0.000 0.000 0.018
Total 0.150 0.344 0.113 0.431 1.031 3.649 2.699 1.767 0.930 0.330
Cu Alloy 2.966 9.072 0.205 7.933 2.341 2.465 5.960
Iran Master 0.051 0.000 0.000 0.000 0.022
Total 2.966 9.123 0.205 7.933 2.341 2.465 5.982
Cu Alloy 21.521 16.799 12.541 12.083 16.953 14.115 14.534 20.796 15.077 12.659
Italy Master 0.034 0.052 0.085 0.074 0.084 0.071 0.754 0.252 0.190 0.127
Total 21.555 16.851 12.626 12.157 17.037 14.186 15.288 21.048 15.267 12.786
Cu Alloy 27.959 22.970 28.061 30.831 24.511 29.412 33.328 32.237 32.166 31.229
Japan Master 0.748 0.168 0.181 0.259 0.525 0.445 0.591 0.901 0.588 0.592
Total 28.707 23.138 28.242 31.090 25.036 29.857 33.919 33.138 32.754 31.821
Cu Alloy 8.755 7.705 8.967 13.332 17.960 19.266 19.308 16.085 15.524 12.971
Korean Rep. Master 0.442 0.402 0.399 0.430 1.250 0.983 1.330 1.567 1.612 2.244
Total 9.197 8.107 9.366 13.762 19.210 20.249 20.638 17.652 17.136 15.215
Cu Alloy 0.156 0.144 2.860 0.042 3.792 0.139 0.047 0.035 0.638 0.030
Malaysia Master 0.018 0.001 0.026 0.008 0.000 0.037 0.035
Total 0.174 0.145 2.860 0.068 3.800 0.139 0.084 0.070 0.638 0.030
Cu Alloy 0.979 2.181 1.000 3.570 3.459 15.492 17.436 18.107 18.745 16.020
Mexico Master 0.732 0.884 5.114 1.608 0.142 0.021 0.000 0.067 0.059
Total 1.711 3.065 6.114 5.178 3.601 15.513 17.436 18.174 18.804 16.020
ICSG 2009 Statistical Yearbook- July 2010
- 40 -

TABLE 14B. EXPORTS OF COPPER ALLOY INGOTSThousand metric tonnes, gross weight metal
COUNTRY Ingot 2000 2001 2002 2003 2004 2005 2006 2007 2008 2009Type p/
Cu Alloy 5.567 2.445 5.945 5.286 3.519 2.994 5.504 5.499 6.250 3.968
Netherlands Master 0.018 0.102 0.009 0.017 0.081 0.032 0.174 0.181 0.116 0.034
Total 5.585 2.547 5.954 5.303 3.600 3.026 5.678 5.680 6.366 4.002
Cu Alloy 0.066 0.180 0.471 0.630 1.730 1.868 2.885 2.244 2.012
New Zealand Master 0.012 0.035 0.015 0.015
Total 0.066 0.180 0.471 0.642 1.765 1.883 2.900 2.244 2.012
Norway Cu Alloy 1.659 1.631 1.422 1.203 0.988 1.707 1.140 1.126 0.754 0.302
Philippines Cu Alloy 2.600 3.047 0.066 8.571 0.527 0.157 0.065 0.152 0.017 0.030
Cu Alloy 6.117 4.488 4.986 5.300 5.005 6.178 6.120 6.388 4.315 2.365
Poland Master 0.003 0.113 0.089 0.026 0.002 0.004 0.081 0.009 0.554 0.005
Total 6.120 4.601 5.075 5.326 5.007 6.182 6.201 6.397 4.869 2.370
Romania Cu Alloy 0.537 0.498 0.716 0.547 0.761 0.540 0.071 0.119 0.066 0.033
Cu Alloy 12.830 12.896 12.814 12.273 6.386 7.733 7.156 5.398 4.608 6.750
Russian Fed. Master 0.142 0.026 0.038 0.068 0.053 0.063 0.021 0.021 0.024
Total 12.972 12.922 12.852 12.341 6.439 7.796 7.177 5.419 4.632 6.750
Cu Alloy 2.974 2.766 2.358 4.350 5.309 7.940 7.477 6.727 7.466 7.230
Singapore Master 0.227 0.116 0.132 0.034 0.227 0.137 0.031 0.129 0.206
Total 3.201 2.882 2.490 4.384 5.536 8.077 7.508 6.856 7.672 7.230
Cu Alloy 6.829 7.100 8.298 4.347 5.754 4.965 4.431 26.677 1.575 1.140
South Africa Master 0.002 0.079 0.084 0.218 0.271 0.027 0.017 0.305 0.888
Total 6.831 7.179 8.382 4.564 6.025 4.992 4.448 26.982 2.463 1.140
Cu Alloy 7.507 7.448 7.124 9.800 11.699 9.803 10.729 12.550 11.548 12.097
Spain Master 0.162 0.018 0.002 0.000 0.000 0.005 0.000 0.094 0.342
Total 7.669 7.466 7.126 9.800 11.699 9.808 10.729 12.644 11.890 12.097
Cu Alloy 8.672 8.459 6.458 7.070 5.032 5.236 6.372 8.780 5.545 3.290
Sweden Master 0.031 0.352 0.027 0.031 0.005 0.014 0.076 0.058 0.067 0.001
Total 8.703 8.811 6.485 7.101 5.037 5.250 6.448 8.838 5.612 3.291
Cu Alloy 4.266 1.240 0.749 1.020 0.837 0.841 0.838 0.806 1.124 0.510
Switzerland Master 0.001 0.000 0.002 0.012 0.013 0.066 0.050 0.018 0.015
Total 4.267 1.240 0.751 1.032 0.850 0.907 0.888 0.824 1.139 0.510
Cu Alloy 3.128 4.285 5.034 6.649 9.676 7.265 10.093 7.893 5.987 6.737
Taipei, China Master 0.043 0.000 0.003 0.021 0.118 0.041 0.020 0.001 0.002 0.005
Total 3.171 4.285 5.036 6.670 9.794 7.306 10.113 7.894 5.989 6.742
Cu Alloy 1.200 1.926 2.734 2.890 7.257 2.165 0.006 5.589 6.863 2.280
Turkey Master 0.009 0.000 0.007 0.011 0.017 0.007 0.006 0.005 0.006
Total 1.209 1.926 2.741 2.901 7.274 2.172 0.012 5.594 6.869 2.280
Ukraine Cu Alloy 12.111 26.440 2.393 2.963 4.704 7.777 12.415 19.800 11.219 6.990
Cu Alloy 17.766 19.984 22.279 20.800 18.543 12.682 13.585 12.533 11.504 7.437
United Kingdom Master 3.545 4.050 3.959 3.263 3.492 2.332 3.590 5.609 6.219 3.882
Total 21.311 24.034 26.238 24.063 22.035 15.014 17.175 18.142 17.723 11.319
Cu Alloy 24.103 30.807 25.901 25.564 31.560 31.479 35.423 36.304 35.877 24.800
United States Master 1.725 1.562 1.736 1.908 2.141 3.886 4.634 4.058 3.058 2.847
Total 25.828 32.369 27.637 27.472 33.701 35.365 40.057 40.362 38.935 27.647
Cu Alloy 0.079 0.022 1.358 4.264 1.914 0.076
Venezuela Master 0.046 0.000 0.000 0.000 0.000
Total 0.079 0.046 0.022 1.358 4.264 1.914 0.076
Serbia Cu Alloy 3.822 2.199 1.981 1.040 1.980 1.612 1.410 2.194 1.048 0.630
Cu Alloy 7.340 5.524 7.375 9.107 17.367 27.989 36.070 50.795 52.821 25.056
Others Master 3.203 1.726 0.884 2.951 0.443 1.656 2.772 4.306 1.804 0.440Total 10.543 7.251 8.259 12.058 17.811 29.645 38.842 55.101 54.625 25.496
Cu Alloy 266.539 264.469 229.213 265.925 278.108 293.354 332.858 380.452 319.634 221.266
TOTAL EXPORTS, Master 30.473 29.794 29.816 24.897 25.144 25.369 30.907 33.392 29.597 20.095by Ingot Type Total 297.012 294.263 259.029 290.822 303.252 318.723 363.765 413.844 349.231 241.361
Source: Official country trade statistics.p/ Preliminary. For some countries incomplete.
ICSG 2009 Statistical Yearbook- July 2010
- 41 -

TABLE 15A. COPPER AND COPPER ALLOY SEMIFABRICATE IMPORTSThousand metric tonnes, gross weight metal
COUNTRY Semis 2000 2001 2002 2003 2004 2005 2006 2007 2008 2009Type 1/ p/
Copper 10.3 18.2 16.7 17.1 20.6 17.5 17.7 21.5 Algeria Cu Alloy 2.9 4.9 2.4 2.8 4.2 3.5 4.5
Total 13.2 23.1 16.7 19.5 23.4 21.6 21.1 25.9 Copper 14.8 13.7 4.1 8.1 13.4 14.8 15.8 18.2 20.7
Argentina Cu Alloy 2.7 3.2 1.1 4.8 5.2 4.5 4.4 3.7 3.6 Total 17.5 16.9 5.3 12.9 23.8 19.3 20.1 21.9 24.3 20.3Copper 8.7 19.3 7.8 8.7 10.3 12.4 15.5 17.0 13.9 12.0
Australia Cu Alloy 12.1 14.2 11.4 9.0 16.2 16.0 23.5 17.5 21.0 15.6 Total 20.8 33.5 19.2 17.7 26.6 28.4 39.0 34.4 35.0 27.6Copper 88.3 72.5 72.1 74.9 90.7 87.8 95.1 92.6 103.7 88.2
Austria Cu Alloy 20.6 21.5 12.1 14.3 12.8 16.5 17.8 23.6 24.0 20.1 Total 108.8 94.0 84.2 89.2 103.5 104.3 112.9 116.2 127.7 108.3Copper 75.3 74.2 65.1 63.0 64.4 64.6 81.0 70.3 80.1 69.9
Belgium Cu Alloy 24.5 19.9 17.1 17.8 16.8 15.6 16.2 16.1 16.6 10.6 Total 99.8 94.1 82.2 80.8 81.3 80.2 97.1 86.3 96.7 80.6Copper 15.7 19.5 18.3 25.5 30.0 34.4 43.5 37.8 43.3
Brazil Cu Alloy 1.9 2.7 2.9 2.9 5.0 4.8 6.1 7.0 8.4 Total 17.6 22.2 21.2 28.4 35.0 39.2 49.6 44.8 51.7 39.6Copper 72.2 53.1 46.1 37.4 56.2 71.6 63.6 81.0 78.7 57.1
Canada Cu Alloy 69.4 61.8 57.1 54.2 58.7 55.0 60.9 49.1 38.5 27.9 Total 141.7 114.9 103.2 91.5 114.9 126.6 124.6 130.1 117.1 85.0Copper 1.3 1.8 3.7 2.4 1.9 1.5
Chile Cu Alloy 0.5 0.6 0.6 0.8 0.9 0.7 Total 1.9 2.4 2.0 2.5 4.3 3.2 2.8 2.2 2.3 2.1Copper 452.9 473.6 563.3 615.9 658.8 568.4 528.2 509.1 466.4
China Cu Alloy 162.7 161.9 203.8 247.2 300.0 325.8 332.4 316.6 273.1 Total 615.6 635.5 767.0 863.1 958.8 894.3 860.5 825.7 739.6 817.9Copper 25.5 28.7 27.1 25.9 27.5 33.4 33.4 38.6 36.8
Colombia Cu Alloy 1.2 1.7 1.4 1.3 2.3 1.8 2.1 2.3 2.8 Total 26.7 30.4 28.5 27.2 29.8 35.3 35.5 40.9 39.6 36.9Copper 16.0 10.8 11.5 12.6 13.8 10.8 18.4 15.2 17.6
Costa Rica Cu Alloy 0.6 0.7 0.5 0.6 0.6 0.8 0.7 1.0 0.8 Total 16.6 11.4 12.0 13.1 14.3 11.6 19.2 16.2 18.4 Copper 10.9 12.6 11.4 13.0 13.0 13.7 14.1 12.9 12.1
Croatia Cu Alloy 1.5 2.1 2.1 2.2 2.0 2.2 2.0 2.0 2.0 Total 12.4 14.7 13.4 15.2 15.1 15.9 16.1 14.8 14.1 Copper 1.6 1.7 1.9 1.8 2.2 2.5 1.9 2.3 2.0 1.3
Cyprus Cu Alloy 0.3 0.3 0.4 0.8 0.6 0.4 0.3 0.2 0.4 Total 1.9 2.0 2.3 2.5 2.7 2.9 2.2 2.5 2.4 1.3Copper 63.4 66.0 74.1 80.9 111.9 100.5 111.8 120.1 104.8 101.1
Czech Rep. Cu Alloy 14.1 17.2 16.0 17.8 30.6 20.4 25.0 26.3 24.1 14.0 Total 77.5 83.2 90.1 98.7 142.6 120.8 136.8 146.5 128.9 115.2Copper 18.3 19.0 19.9 20.2 21.2 21.0 32.9 24.0 26.3
Denmark Cu Alloy 34.1 32.9 26.6 26.1 30.2 27.2 31.1 23.8 24.3 Total 52.4 51.8 46.5 46.3 51.3 48.2 63.9 47.8 50.6 Copper 1.7 2.3 2.9 2.8 2.4 4.4 4.0 3.4 4.2
Ecuador Cu Alloy 0.8 1.1 1.1 0.9 1.0 1.0 1.0 1.1 1.2 Total 2.4 3.4 4.0 3.7 3.5 5.4 4.9 4.4 5.4 Copper 35.3 44.2 2.4 2.6 3.7 3.3 5.8 24.6
Egypt Cu Alloy 3.4 4.5 4.8 7.0 5.2 5.7 5.8 20.1 Total 38.7 48.7 7.2 9.7 8.9 9.0 11.6 44.7 Copper 35.9 35.7 35.2 42.1 36.1 43.6 44.6 44.9 47.1
Finland Cu Alloy 7.5 6.3 5.6 5.8 7.5 7.1 6.0 6.7 5.6 Total 43.5 42.0 40.8 47.9 43.5 50.7 50.6 51.6 52.7 35.4Copper 216.0 189.2 176.6 176.4 197.5 177.2 223.6 214.4 206.8 166.5
France Cu Alloy 94.2 89.7 78.4 75.3 86.6 71.5 73.1 96.1 81.9 53.4 Total 310.1 278.9 255.0 251.7 284.0 248.7 296.6 310.4 288.7 220.0Copper 245.2 226.9 234.2 277.2 273.9 267.3 274.0 264.8 235.0 152.0
Germany Cu Alloy 124.9 105.4 84.6 91.0 101.5 96.7 111.2 125.5 105.7 70.4 Total 370.1 332.3 318.8 368.2 375.4 364.1 385.2 390.3 340.7 222.4Copper 10.8 8.2 10.6 15.6 28.7 38.3 33.5 21.0 20.5 12.7
Greece Cu Alloy 2.9 3.5 2.9 2.4 7.1 7.5 2.7 7.1 3.0 2.4 Total 13.7 11.7 13.6 18.0 35.8 45.8 36.2 28.1 23.5 18.1Copper 167.9 143.1 130.3 139.0 134.4 125.6 120.8 118.6 88.2
Hong Kong, China Cu Alloy 114.9 97.4 120.7 121.4 135.1 130.7 132.3 108.8 90.4 Total 282.8 240.5 251.0 260.4 269.4 256.2 253.0 227.4 178.5 239.7
ICSG 2009 Statistical Yearbook- July 2010
- 42 -

TABLE 15A. COPPER AND COPPER ALLOY SEMIFABRICATE IMPORTSThousand metric tonnes, gross weight metal
COUNTRY Semis 2000 2001 2002 2003 2004 2005 2006 2007 2008 2009Type 1/ p/
Copper 30.0 31.1 31.5 35.6 39.1 38.7 45.7 21.0 54.8 46.2Hungary Cu Alloy 10.4 10.1 10.7 15.3 16.7 13.2 13.9 13.5 11.5 8.6
Total 40.4 41.2 42.2 50.9 55.8 52.0 59.6 34.5 66.3 54.8Copper 23.2 38.5 20.7 17.7 28.8 52.6 39.3 54.0 51.2
India Cu Alloy 6.3 7.5 7.4 14.3 15.1 14.7 15.2 18.0 27.6 Total 29.5 46.0 28.1 32.0 43.9 67.4 54.5 72.0 78.8 85.8Copper 11.4 9.8 11.8 13.6 11.7 12.1 10.5 19.5 28.4
Indonesia Cu Alloy 11.2 9.2 8.7 10.5 14.7 21.0 10.8 11.0 23.9 Total 22.6 18.9 20.5 24.1 26.4 33.0 21.3 30.5 52.3 35.8Copper 29.1 30.8 33.1 32.8 33.5 30.0 22.9 24.6 19.7
Ireland Cu Alloy 4.5 4.3 4.0 4.4 5.6 6.9 8.4 8.2 5.2 Total 33.7 35.1 37.1 37.2 39.0 36.9 31.4 32.8 24.9 Copper 30.1 34.4 10.8 3.3 36.2 64.2 31.0 30.1
Israel Cu Alloy 0.1 4.5 3.6 3.5 5.5 4.2 3.5 Total 30.2 38.9 10.8 6.9 39.6 69.6 35.1 33.6 Copper 285.5 292.3 267.9 279.2 286.3 257.3 271.7 251.5 268.3 178.7
Italy Cu Alloy 87.8 72.5 79.7 78.5 91.2 90.8 120.8 113.4 106.5 76.7 Total 373.3 364.8 347.6 357.7 377.5 348.1 392.4 364.9 374.7 255.4Copper 22.9 27.5 26.4 25.6 33.3 32.3 34.9 28.7 25.4 17.9
Japan Cu Alloy 14.1 10.8 28.5 30.5 27.3 33.0 43.2 42.4 43.3 27.1 Total 37.0 38.3 54.9 56.1 60.6 65.3 78.1 71.2 68.7 45.0Copper 5.1 6.5 5.4 8.1 11.5 12.0 12.4 17.2 24.8
Jordan Cu Alloy 0.4 0.5 0.7 0.6 0.9 1.5 1.7 2.2 1.9 Total 5.5 7.0 6.1 8.7 12.4 13.5 14.0 19.4 26.7 Copper 0.7 0.5 1.0 0.5 0.5 0.9 1.2 1.5 1.8 1.1
Kazakhstan Cu Alloy 0.5 0.6 0.5 0.6 0.4 0.6 0.9 1.4 1.5 1.4 Total 1.3 1.1 1.6 1.1 1.0 1.5 2.0 2.9 3.3 2.5Copper 34.6 25.4 32.1 23.6 46.2 45.8 44.9 38.3
Korean Rep. Cu Alloy 17.8 21.2 20.2 45.6 25.2 38.0 40.8 36.6 Total 52.4 46.6 52.3 69.2 71.3 83.8 85.7 74.9 92.8 90.0Copper 105.3 87.4 85.3 86.0 133.0 196.3
Malaysia Cu Alloy 37.6 15.8 12.3 15.0 59.7 49.9 Total 142.9 103.2 97.6 101.0 192.7 246.1 101.3Copper 87.8 125.5 172.2 138.0 178.3 176.5 177.4 170.1 145.6
Mexico Cu Alloy 24.9 29.0 47.0 38.3 35.3 27.2 33.1 27.3 27.8 Total 112.7 154.4 219.2 176.3 213.6 203.7 210.5 197.4 173.4 130.8Copper 16.3 10.3 14.6 18.2 17.7 19.0 22.0 27.6
Morocco Cu Alloy 5.4 6.3 5.9 6.5 6.9 6.6 4.0 3.6 Total 21.7 16.6 20.6 24.6 24.6 25.6 26.0 31.1 30.6 39.2Copper 89.1 73.5 71.0 78.6 78.8 78.6 73.7 79.2 62.5 51.5
Netherlands Cu Alloy 26.0 15.1 16.4 17.5 27.4 30.8 31.8 26.7 23.0 20.2 Total 115.1 88.6 87.5 96.1 106.2 109.3 105.6 105.9 85.5 71.7Copper 9.2 3.7 13.2 17.2 18.1 18.3 18.5 14.4 15.5
New Zealand Cu Alloy 6.4 2.3 5.1 6.0 3.9 3.7 3.7 3.4 2.2 Total 15.6 6.1 18.3 23.3 22.0 22.0 22.2 17.7 17.7 Copper 19.8 7.9 15.0 16.8 17.4 18.2 16.7 21.3 19.7 12.7
Norway Cu Alloy 6.9 5.9 4.7 5.6 4.6 6.3 7.3 11.5 7.4 2.6 Total 26.7 13.8 19.8 22.4 22.0 24.5 24.0 32.8 27.1 15.3Copper 11.1 5.3 15.5 21.8 26.9 28.7 31.8 50.4
Oman Cu Alloy 0.1 0.1 0.2 0.2 0.2 0.3 2.5 0.4 Total 11.2 5.4 15.7 22.0 27.1 29.1 34.2 50.8 Copper 0.8 1.1 2.0 2.1 2.4 3.1 3.2 2.8
Peru Cu Alloy 0.2 0.3 0.4 0.6 0.3 0.4 0.4 0.4 Total 1.0 1.4 2.4 2.7 2.7 3.5 3.6 3.2 2.2 1.2Copper 36.6 38.3 35.1 33.8 36.5 37.1 40.4 32.0 31.7
Philippines Cu Alloy 18.7 23.8 28.9 37.5 27.5 18.5 10.9 10.7 11.0 Total 55.3 62.1 64.0 71.2 64.1 55.5 51.3 42.6 42.7 35.6Copper 22.7 23.4 30.5 39.7 58.9 71.6 164.4 90.1 78.7 53.9
Poland Cu Alloy 10.5 11.7 11.8 15.0 16.6 19.8 30.2 23.4 18.5 18.5 Total 33.1 35.1 42.3 54.7 75.4 91.4 194.6 113.5 97.2 72.5Copper 59.5 65.2 70.9 71.2 76.2 69.5 79.4 82.2 76.0 60.4
Portugal Cu Alloy 20.7 19.9 16.4 13.9 13.9 14.1 14.9 13.6 10.1 6.0 Total 80.1 85.1 87.3 85.0 90.1 83.6 94.3 95.8 86.1 66.4Copper 5.9 8.2 9.8 11.2 9.6 11.4 23.7 30.1 37.1 39.6
Romania Cu Alloy 2.0 2.6 2.8 4.0 4.4 6.1 7.4 7.3 7.9 6.2 Total 7.8 10.8 12.5 15.2 14.0 17.4 31.1 37.4 45.0 45.7
ICSG 2009 Statistical Yearbook- July 2010
- 43 -

TABLE 15A. COPPER AND COPPER ALLOY SEMIFABRICATE IMPORTSThousand metric tonnes, gross weight metal
COUNTRY Semis 2000 2001 2002 2003 2004 2005 2006 2007 2008 2009Type 1/ p/
Copper 7.6 7.3 8.8 10.4 12.3 8.6 11.8 15.9 21.0 Russian Fed. Cu Alloy 8.1 8.2 5.6 8.4 11.7 11.8 13.1 15.3 12.9
Total 15.7 15.4 14.4 18.8 24.0 20.5 24.9 31.2 34.0 21.6Copper 57.7 66.4 86.4 73.5 107.3 106.2 68.8 73.9
Saudi Arabia Cu Alloy 5.0 9.3 9.8 10.1 12.7 12.2 14.8 20.9 Total 62.7 75.7 96.2 83.6 120.1 118.4 83.6 94.8 Copper 69.0 59.1 60.8 44.3 57.1 96.2 50.4 54.3 59.2
Singapore Cu Alloy 43.4 24.8 32.0 37.7 66.7 43.4 53.8 49.7 51.8 Total 112.4 83.9 92.8 82.0 123.8 139.6 104.2 104.0 111.0 86.8Copper 13.0 8.1 7.4 14.5 17.5 17.4 20.8 13.7 15.3 14.4
Slovakia Cu Alloy 2.7 3.4 2.6 2.9 4.6 4.6 7.6 3.2 2.5 3.3 Total 15.7 11.5 9.9 17.4 22.1 22.0 28.5 16.9 17.7 17.6Copper 11.4 11.3 11.3 11.2 13.4 12.7 13.1 12.1 10.4
Slovenia Cu Alloy 5.1 5.5 5.6 5.7 6.4 6.4 8.0 7.5 8.0 Total 16.5 16.8 16.9 16.9 19.7 19.1 21.2 19.7 18.4 Copper 6.2 8.4 9.0 5.4 15.7 17.5 25.3 21.8 21.3
South Africa Cu Alloy 2.5 1.7 1.2 2.5 2.5 2.4 2.5 3.2 3.1 Total 8.6 10.0 10.2 7.9 18.2 19.9 27.8 25.0 24.3 20.1Copper 152.3 149.0 116.4 137.6 169.7 147.5 158.8 167.3 127.8 69.3
Spain Cu Alloy 71.1 70.2 67.0 65.1 58.3 57.4 59.1 59.4 43.3 29.3 Total 223.4 219.2 183.5 202.7 228.1 204.9 217.9 226.8 171.1 98.6Copper 3.9 19.8 26.4 20.3 13.4 9.6
Sri Lanka Cu Alloy 0.3 10.1 2.9 1.2 1.2 1.2 Total 4.3 29.8 29.3 21.5 14.6 10.9 Copper 1.8 5.8 6.5 6.9 5.9 9.3 13.2 10.9
Serbia Cu Alloy 1.0 0.9 1.8 1.0 1.0 1.1 0.5 0.5 Total 2.8 6.7 8.3 9.6 7.8 6.9 10.3 13.6 11.4 9.5Copper 35.8 33.4 26.7 28.0 36.0 38.0 42.6 42.6 42.8 37.3
Sweden Cu Alloy 14.4 13.2 12.2 10.4 13.2 10.7 16.0 21.8 12.0 7.4 Total 50.2 46.6 38.9 38.3 49.1 48.7 58.6 64.5 54.8 44.7Copper 77.9 72.7 66.0 69.2 74.3 74.5 86.8 87.1 81.5
Switzerland Cu Alloy 32.8 27.7 21.9 23.3 27.6 27.8 32.0 34.8 38.2 Total 110.8 100.5 87.9 92.5 101.8 102.3 118.9 121.8 119.7 94.9Copper 64.4 50.6 53.7
Taipei, China Cu Alloy 46.7 29.8 39.5 Total 111.1 80.4 93.2 81.2 81.1 69.2 79.2 90.2 87.0 68.1Copper 41.0 41.3 50.8 61.2 72.9 63.1 65.8 65.9 67.6
Thailand Cu Alloy 25.5 23.5 32.8 37.9 40.4 43.8 51.6 50.1 57.2 Total 66.6 64.8 83.6 99.1 113.3 106.9 117.4 116.0 124.8 91.1Copper 15.2 17.6 20.4 21.7 23.9 27.0 28.3 33.8 38.6
Tunisia Cu Alloy 2.1 2.5 2.5 2.4 2.5 2.4 2.5 2.8 3.3 Total 17.3 20.1 22.9 24.2 26.4 29.4 30.8 36.6 41.9 Copper 21.9 19.4 19.6 21.7 44.3 53.1 30.0 70.5 84.3
Turkey Cu Alloy 3.9 3.2 6.2 8.8 11.3 15.5 10.5 14.8 12.3 Total 25.8 22.6 25.8 30.5 55.6 68.6 40.5 85.3 96.6 70.8Copper 18.6 13.4 13.3 10.4 19.9 23.2 20.9 18.1
Ukraine Cu Alloy 0.9 1.9 2.4 3.1 2.5 2.5 1.6 1.9 2.3 Total 0.9 20.5 15.8 16.3 12.9 22.4 24.9 22.7 20.4 11.1Copper 150.5 164.8 142.6 162.3 141.1 129.6 144.3 245.6 237.8 157.1
United Kingdom Cu Alloy 70.3 58.5 52.2 55.5 60.3 51.7 54.4 59.8 54.8 36.6 Total 220.8 223.3 194.9 217.7 201.4 181.3 198.7 305.4 292.6 193.7Copper 462.3 411.0 407.1 377.8 423.6 555.5 562.0 409.4 340.1 250.2
United States Cu Alloy 196.3 138.0 128.7 122.2 146.6 118.2 114.6 98.1 99.8 63.6 Total 658.7 549.0 535.8 500.0 570.1 673.7 676.6 507.5 439.9 313.9Copper 20.2 18.0 16.7 14.5 16.2 17.7 16.3 19.1 26.7
Venezuela Cu Alloy 2.3 2.0 1.0 1.2 1.3 1.7 1.4 1.4 1.7 Total 22.5 20.0 17.7 15.6 17.5 19.4 17.7 20.5 28.4 Copper 71.0 87.2 84.6 125.6 148.7 228.7 174.5 265.3 239.2 6.3
Others Cu Alloy 25.0 23.1 23.7 33.8 37.2 53.7 39.5 204.1 58.8 6.0 Total 96.0 110.3 108.3 159.4 185.9 282.4 214.1 469.4 298.0 23.4
TOTAL IMPORTS, Copper 3,803.0 3,715.5 3,707.5 3,847.1 4,361.6 4,573.3 4,485.1 4,431.8 4,036.3 1,656.4
by Semifabricate Cu Alloy 1,567.9 1,372.6 1,414.1 1,493.4 1,736.5 1,687.8 1,747.5 1,870.6 1,540.3 526.6
Type Not Specif. 2.0 93.3 86.3 69.2 79.2 90.2 214.8 2,188.5
Total 5,370.8 5,088.1 5,123.5 5,433.8 6,184.4 6,330.3 6,311.8 6,392.7 5,791.3 4,371.5Source: Official country trade statistics. 1/ Semifabricates include brass and wire mill products only.p/ Preliminary. For some countries incomplete. Foundry and chemical plant products are excluded.
ICSG 2009 Statistical Yearbook- July 2010
- 44 -

TABLE 15B. COPPER AND COPPER ALLOY SEMIFABRICATE EXPORTSThousand metric tonnes, gross weight metal
COUNTRY Semis 2000 2001 2002 2003 2004 2005 2006 2007 2008 2009Type 1/ p/
Copper 8.4 4.6 0.5 0.4 1.0 0.4 0.3 0.5 0.4
Argentina Cu Alloy 1.8 2.8 0.6 0.2 0.3 0.3 0.4 0.5 0.9
Total 10.2 7.4 1.1 0.7 1.2 0.8 0.7 1.0 1.3 0.8
Copper 101.5 82.5 94.1 90.8 71.3 60.2 54.3 62.4 68.1 61.8
Australia Cu Alloy 17.0 11.6 9.6 9.9 9.5 7.8 2.7 2.7 3.1 2.1
Total 118.5 94.1 103.7 100.7 80.8 68.0 57.0 65.1 71.2 63.9
Copper 37.6 35.2 29.3 29.2 39.0 44.0 45.0 37.2 42.5 31.8
Austria Cu Alloy 7.6 8.3 7.4 8.8 8.2 8.7 10.0 12.4 11.9 9.0
Total 45.3 43.4 36.7 38.0 47.2 52.6 55.0 49.6 54.4 40.8
Copper 331.6 311.5 264.6 171.6 215.9 178.2 201.4 228.8 216.0 188.4
Belgium Cu Alloy 11.7 10.9 7.1 8.2 5.8 6.4 5.1 5.3 5.8 5.1
Total 343.3 322.4 271.7 179.8 221.7 184.6 206.5 234.1 221.8 193.5
Copper 45.8 43.9 47.1 50.3 70.6 77.9 64.9 40.8 30.2
Brazil Cu Alloy 4.5 2.5 1.7 3.6 5.1 4.4 5.5 4.7 5.5
Total 50.3 46.4 48.7 53.9 75.8 82.3 70.3 45.5 35.6 29.0
Copper 153.2 139.3 150.6 133.1 189.0 203.0 208.4 148.6 141.8 107.0
Canada Cu Alloy 20.2 18.3 13.5 10.6 10.8 9.3 11.8 3.9 4.3 3.2
Total 173.5 157.6 164.1 143.7 199.8 212.3 220.2 152.4 146.2 110.2
Copper 45.5 58.3 65.2 66.1 76.6 74.0
Chile Cu Alloy 2.1 2.5 4.9 4.5 6.0 5.7
Total 47.6 60.8 57.0 64.7 70.1 70.6 82.6 79.7 78.5 68.6
Copper 22.0 27.2 42.4 72.2 124.1 151.6 190.0 187.0 196.2
China Cu Alloy 46.5 34.1 46.1 53.4 76.5 93.7 105.7 88.1 102.8
Total 68.6 61.3 88.5 125.5 200.6 245.4 295.6 275.1 299.0 389.4
Copper 2.5 3.1 3.2 2.6 6.5 9.2 9.8 7.5 6.2 3.6
Czech Rep. Cu Alloy 9.6 7.6 7.4 10.3 11.6 12.2 10.8 11.0 12.2 9.9
Total 12.1 10.7 10.6 12.8 18.1 21.4 20.5 18.5 18.5 13.5
Copper 2.7 3.7 3.4 3.5 2.0 2.3 2.6 2.1 2.1
Denmark Cu Alloy 2.0 3.9 1.3 1.0 0.9 1.7 1.3 1.3 1.1
Total 4.7 7.7 4.6 4.5 2.9 3.9 3.9 3.3 3.2
Copper 98.2 90.1 88.1 90.6 93.7 84.1 73.3 67.0 60.5
Finland Cu Alloy 3.9 7.5 7.3 5.4 4.4 3.4 3.2 3.0 2.5
Total 102.2 97.6 95.4 96.0 98.1 87.4 76.5 70.0 63.0 44.7
Copper 413.2 423.5 436.5 414.1 420.0 369.9 377.5 321.2 310.3 217.1
France Cu Alloy 109.9 80.0 74.1 72.4 76.8 69.1 77.8 75.9 61.0 41.3
Total 523.1 503.5 510.6 486.5 496.8 439.0 455.2 397.1 371.3 258.4
Copper 558.3 527.4 471.8 542.8 624.8 630.9 732.5 743.7 749.3 560.7
Germany Cu Alloy 367.4 317.8 318.8 309.7 350.0 310.7 359.9 366.7 333.8 253.4
Total 925.7 845.2 790.6 852.5 974.8 941.6 1,092.4 1,110.4 1,083.0 814.2
Copper 69.6 75.9 67.2 66.0 68.6 60.7 65.0 66.5 72.0 40.4
Greece Cu Alloy 6.5 7.7 8.2 7.4 6.0 5.7 8.6 17.1 23.0 7.8
Total 76.0 83.6 75.4 73.4 74.6 66.4 73.7 83.7 94.9 48.3
Copper 174.2 143.2 125.6 137.5 128.7 124.3 121.2 109.5 79.5
Hong Kong, China Cu Alloy 79.8 70.3 85.3 88.5 102.2 108.3 111.0 91.2 77.3
Total 254.0 213.5 210.9 226.0 230.8 232.6 232.2 200.7 156.8 230.4
Copper 1.7 8.0 7.2 5.3 6.1 2.2 1.5 0.5 0.3 0.2
Hungary Cu Alloy 19.2 14.5 14.5 2.2 2.8 2.1 2.4 1.2 0.4 0.1
Total 20.9 22.5 21.7 7.4 8.9 4.4 3.9 1.8 0.7 0.3
Copper 3.7 9.9 29.1 69.7 78.0 101.8 108.2 113.8 88.5
India Cu Alloy 2.7 6.8 24.0 18.4 18.2 19.7 23.2 19.8 18.3
Total 6.4 16.7 53.0 88.1 96.2 121.5 131.4 133.5 106.8 53.0
ICSG 2009 Statistical Yearbook- July 2010
- 45 -

TABLE 15B. COPPER AND COPPER ALLOY SEMIFABRICATE EXPORTSThousand metric tonnes, gross weight metal
COUNTRY Semis 2000 2001 2002 2003 2004 2005 2006 2007 2008 2009Type 1/ p/
Copper 22.5 22.4 23.7 101.5 118.9 128.9 112.3 91.4 88.0
Indonesia Cu Alloy 9.4 4.6 7.6 10.1 12.1 11.6 10.0 5.6 4.7
Total 31.9 27.0 31.3 111.6 131.0 140.4 122.3 97.1 92.7 83.0
Copper 137.2 127.5 122.0 103.3 159.4 150.0 196.1 200.3 182.9 166.3
Italy Cu Alloy 124.1 124.2 116.2 111.4 116.0 104.2 114.5 132.5 119.5 78.8
Total 261.3 251.7 238.2 214.7 275.4 254.2 310.6 332.8 302.5 245.1
Copper 206.1 170.7 172.1 165.2 173.2 144.3 148.1 144.4 131.2 93.8
Japan Cu Alloy 103.7 83.6 109.3 117.7 114.1 114.3 138.8 157.6 141.7 99.5
Total 309.7 254.3 281.4 282.9 287.2 258.6 286.9 302.0 272.8 193.3
Copper 2.7 37.5 63.6 54.2 45.6 3.9 24.1 27.8 42.5 1.8
Kazakhstan Cu Alloy 2.8 2.4 2.4 3.7 2.8 3.4 3.6 5.0 5.2 3.2
Total 5.6 39.8 66.0 57.8 48.4 7.4 27.6 32.7 47.7 5.0
Copper 259.2 225.6 250.5 272.4 275.5 221.3 191.2 183.4
Korean Rep. Cu Alloy 82.5 75.7 87.2 99.4 128.6 131.0 137.4 138.0
Total 341.7 301.3 337.7 371.8 404.1 352.3 328.6 321.4 341.8 358.3
Copper 90.4 60.0 56.1 20.2 109.5 106.2
Malaysia Cu Alloy 12.3 14.0 13.3 26.0 7.2 9.4
Total 102.7 74.0 69.4 46.2 116.7 115.6 102.4
Copper 136.1 126.2 79.9 67.9 137.6 141.4 84.2 78.6 55.6
Mexico Cu Alloy 21.2 17.8 16.3 17.0 27.5 20.6 22.2 23.9 26.2
Total 157.2 144.0 96.2 84.9 165.0 162.0 106.4 102.6 81.9 53.8
Copper 10.3 14.2 6.7 15.9 12.8 10.1 4.5 5.3 4.1 2.8
Netherlands Cu Alloy 64.1 64.9 69.2 70.9 80.4 73.3 63.2 54.8 45.5 38.0
Total 74.4 79.1 75.9 86.8 93.2 83.4 67.7 60.1 49.6 40.9
Copper 3.0 1.7 1.4 0.2 0.2 0.1 0.1 0.0 0.0
New Zealand Cu Alloy 8.3 3.8 5.7 2.6 2.1 2.3 2.2 2.3 2.8
Total 11.4 5.5 7.1 2.8 2.3 2.4 2.3 2.4 2.9
Copper 32.2 27.6 32.7 31.1 36.2 39.0 43.4 45.4 46.5
Peru Cu Alloy 4.7 3.2 4.6 5.8 5.4 7.6 6.5 5.1 6.2
Total 36.9 30.8 37.3 36.9 41.6 46.6 49.9 50.5 52.6 38.0
Copper 3.2 5.2 7.2 6.9 2.4 2.5 2.7 2.5 2.4
Philippines Cu Alloy 0.0 0.1 0.1 0.1 0.2 0.2 0.1 0.1 0.2
Total 3.3 5.2 7.3 7.0 2.6 2.7 2.8 2.6 2.6 2.3
Copper 83.5 92.0 81.3 92.7 112.6 111.4 229.8 117.9 100.1 93.8
Poland Cu Alloy 57.1 41.3 26.2 34.3 42.5 36.7 64.7 30.9 19.2 11.7
Total 140.6 133.3 107.5 127.0 155.1 148.1 294.4 148.7 119.4 105.4
Copper 2.9 2.8 3.3 4.3 4.8 4.5 4.7 3.4 3.2 5.9
Portugal Cu Alloy 0.8 0.9 1.7 5.8 6.6 5.9 7.6 8.6 12.7 8.6
Total 3.7 3.8 4.9 10.1 11.5 10.4 12.3 12.0 15.9 14.6
Copper 6.3 10.7 5.6 1.5 5.7 3.9 5.5 13.8 8.8 0.3
Romania Cu Alloy 0.1 0.2 0.2 0.3 0.6 1.3 0.9 0.5 0.6 0.3
Total 6.4 10.9 5.8 1.8 6.4 5.1 6.4 14.3 9.4 0.6
Copper 26.5 44.8 113.1 162.8 295.7 340.6 394.9 364.7 402.5
Russian Fed. Cu Alloy 22.0 13.7 13.4 21.9 11.4 11.0 15.1 13.3 12.3
Total 48.5 58.5 126.5 184.7 307.1 351.6 410.0 378.0 414.8 210.9
Copper 3.0 11.1 8.5 11.0 5.0 8.5 7.5 1.7
Saudi Arabia Cu Alloy 2.8 3.3 6.7 10.3 12.6 7.2 8.0 9.4
Total 5.8 14.4 15.2 21.3 17.6 15.7 15.5 11.1
Copper 19.7 12.1 16.3 16.8 15.2 17.5 13.7 18.5 23.5
Singapore Cu Alloy 9.8 8.2 10.8 13.9 20.2 22.7 29.0 23.8 28.3
Total 29.5 20.2 27.1 30.7 35.4 40.2 42.7 42.3 51.8 40.8
ICSG 2009 Statistical Yearbook- July 2010
- 46 -

TABLE 15B. COPPER AND COPPER ALLOY SEMIFABRICATE EXPORTSThousand metric tonnes, gross weight metal
COUNTRY Semis 2000 2001 2002 2003 2004 2005 2006 2007 2008 2009Type 1/ p/
Copper 0.9 10.3 10.6 2.3 0.7 1.1 1.4 2.1 3.0 5.5
Slovakia Cu Alloy 4.6 4.7 5.2 6.8 7.6 7.7 7.7 5.9 3.3 0.1
Total 5.5 15.0 15.9 9.1 8.3 8.8 9.1 8.0 6.3 5.6
Copper 0.2 0.4 0.2 0.2 0.4 0.7 1.6 1.2 1.3
Slovenia Cu Alloy 5.6 5.4 4.9 4.0 2.6 3.1 2.8 2.8 2.8
Total 5.8 5.8 5.1 4.2 3.0 3.8 4.4 3.9 4.1
Copper 115.7 126.2 111.1 113.6 116.2 85.5 99.8 105.7 120.7 128.2
Spain Cu Alloy 35.6 32.6 27.0 35.1 28.6 28.9 33.2 33.8 32.5 23.9
Total 151.3 158.8 138.2 148.7 144.8 114.4 133.0 139.6 153.2 152.1
Copper 151.9 127.5 124.2 125.8 123.9 105.5 109.4 115.0 112.7 111.6
Sweden Cu Alloy 19.0 19.0 20.4 20.3 17.9 17.7 17.8 11.2 12.1 8.6
Total 170.9 146.5 144.6 146.1 141.7 123.2 127.2 126.2 124.8 120.2
Copper 4.7 5.0 4.6 4.1 5.8 5.0 6.2 8.6 7.4
Switzerland Cu Alloy 27.3 20.2 15.4 16.2 18.1 15.9 14.3 14.1 11.0
Total 32.0 25.2 20.1 20.3 23.9 20.8 20.5 22.7 18.4 15.2
Copper 191.5 178.5 199.7
Taipei, China Cu Alloy 51.5 63.5 86.5
Total 243.0 241.9 286.2 315.5 238.2 286.4 300.3 423.8 369.0 325.3
Copper 20.2 22.8 21.4 20.0 21.7 26.1 30.0 39.8 38.0
Thailand Cu Alloy 9.1 11.2 11.5 35.8 18.8 16.6 22.4 38.9 19.3
Total 29.3 34.0 32.9 55.8 40.4 42.7 52.4 78.7 57.3 50.7
Copper 52.5 69.6 36.5 40.1 44.6 44.9 11.5 46.2 46.0
Turkey Cu Alloy 11.5 9.9 10.2 9.9 13.1 10.8 0.8 12.7 13.1
Total 64.0 79.5 46.7 50.1 57.6 55.7 12.3 58.9 59.0 52.4
Copper 0.6 2.0 9.2 11.7 21.7 17.5 15.2 15.3
Ukraine Cu Alloy 5.1 3.6 17.4 23.3 18.8 20.0 16.6 15.7
Total 5.8 5.6 26.7 35.0 40.4 37.5 31.8 31.0 29.9
Copper 136.0 106.3 99.7 109.5 83.6 71.9 71.6 30.6 35.2 23.2
United Kingdom Cu Alloy 45.9 43.8 35.8 39.5 35.0 26.8 26.3 25.8 27.8 21.3
Total 181.9 150.1 135.4 149.0 118.6 98.6 97.8 56.4 63.0 44.5
Copper 184.6 133.5 162.7 160.7 205.5 221.8 233.8 224.1 200.4 170.9
United States Cu Alloy 88.0 80.2 69.6 78.6 91.6 104.3 99.9 90.7 82.4 57.9
Total 272.6 213.7 232.3 239.3 297.2 326.2 333.8 314.8 282.8 228.7
Copper 26.9 10.8 19.5 19.3 25.6 31.0 32.8 39.4
Serbia Cu Alloy 6.8 4.9 7.6 10.4 10.1 9.1 6.9 7.5
Total 33.7 15.7 27.0 28.4 29.7 35.7 40.1 39.7 46.9 45.2
Copper 112.6 107.4 125.5 106.1 124.5 153.6 164.5 164.2 228.9 68.2
Others Cu Alloy 75.7 48.2 48.6 52.5 51.6 58.3 73.0 79.0 67.8 11.8
Total 188.2 155.7 174.0 158.6 176.2 211.9 237.5 243.2 296.8 125.0
TOTAL EXPORTS, Copper 4,042.8 3,801.6 3,752.8 3,623.9 4,392.1 4,281.7 4,490.8 4,214.0 3,916.1 2,042.9
by Semifabricate Cu Alloy 1,612.3 1,404.8 1,452.2 1,452.2 1,573.5 1,525.0 1,667.6 1,626.3 1,345.7 688.0
Type Not Specif. 0.0 57.0 408.6 238.3 286.3 300.3 423.8 789.4 2,238.9
Total 5,655.2 5,206.4 5,262.1 5,484.7 6,203.8 6,093.0 6,458.7 6,264.2 6,051.2 4,969.7
Source: Official country trade statistics.
p/ Preliminary. For some countries incomplete.1/ Semifabricates include brass and wire mill products. Foundry and chemical plant products are excluded.
ICSG 2009 Statistical Yearbook- July 2010
- 47 -

TABLE 16A. IMPORTS OF COPPER AND COPPER ALLOY SCRAPThousand metric tonnes, gross weight metal
COUNTRY Scrap 2000 2001 2002 2003 2004 2005 2006 2007 2008 2009Type 1/ p/
Australia Total 4.1 2.5 3.2 2.7 3.9 2.3 2.0 7.5 2.9 1.3
Copper 72.7 50.9 66.1 58.3 70.3 62.3 63.6 64.5 84.4 107.0
Austria Cu Alloy 8.8 8.3 16.9 16.0 21.4 21.4 25.9 24.0 29.8 25.4
Total 81.5 59.2 83.1 74.3 91.7 83.7 89.5 88.4 114.2 132.4
Copper 83.1 71.7 121.3 79.9 87.9 98.5 108.4 139.6 81.8 77.1
Belgium Cu Alloy 182.2 172.4 141.3 145.7 166.0 182.6 189.4 179.9 171.3 140.0
Total 265.2 244.0 262.6 225.5 253.9 281.1 297.8 319.5 253.1 217.2
Brazil Total 4.1 3.5 0.9 0.2 0.2 1.6 0.7 2.9 4.3 0.5
Canada Total 89.3 91.1 41.5 37.1 55.2 47.9 56.2 143.8 51.8 41.7
China 2/ Total 2,501.2 3,334.6 3,080.1 3,161.8 3,957.6 4,821.2 4,942.9 5,584.6 5,577.0 3,998.0
Czech Rep. Total 3.1 2.8 1.7 2.1 5.6 6.2 8.4 8.8 8.4 9.5
Denmark Total 10.1 15.0 11.4 16.0 15.4 11.2 8.3 9.0 16.5
Finland Total 7.6 3.4 3.0 2.5 1.7 2.4 1.3 2.6 4.1 7.0
Copper 21.8 15.9 12.1 26.9 34.1 28.8 36.6 50.7 43.9 33.6
France Cu Alloy 65.2 55.2 53.3 43.7 45.3 46.9 61.2 37.7 34.3 16.7
Total 87.1 71.1 65.4 70.5 79.4 75.6 97.9 88.3 78.3 50.3
Copper 245.5 147.8 186.5 165.2 235.9 205.7 248.8 241.9 254.3 206.7
Germany Cu Alloy 245.4 243.1 279.8 228.3 264.8 280.4 336.4 353.9 309.3 248.0
Total 490.9 390.9 466.3 393.6 500.8 486.1 585.1 595.7 563.6 454.8
Greece Total 7.5 2.6 2.7 2.0 1.9 0.9 2.1 10.2 18.6 11.2
Hong Kong, China Total 106.4 92.2 73.5 111.1 106.8 123.4 146.9 189.6 210.4 190.4
Hungary Total 8.3 5.4 3.5 0.5 0.5 0.4 0.6 0.4 3.1 3.9
India Total 85.0 111.3 92.5 92.3 109.7 150.3 103.9 105.2 103.3 78.5
Indonesia Total 4.0 3.9 3.0 3.3 2.9 13.4 2.3 4.0 9.7 6.6
Ireland Total 1.4 1.1 1.1 0.5 0.0 0.0 0.1 0.2 0.1
Copper 58.5 58.1 60.0 54.8 35.6 41.6 76.7 62.6 64.1 31.6
Italy Cu Alloy 120.5 110.4 133.3 115.3 95.5 83.7 139.0 115.0 103.1 59.9
Total 179.0 168.5 193.3 170.1 131.1 125.3 215.7 177.5 167.2 91.5
Copper 109.2 82.4 65.0 60.5 66.1 46.7 57.2 65.9 71.9 55.0
Japan Cu Alloy 81.0 60.2 60.8 61.0 79.0 56.2 63.6 69.7 66.8 42.2
Total 190.2 142.6 125.8 121.5 145.1 102.9 120.8 135.7 138.7 97.1
Kazakhstan Total 1.6 3.6 3.6 0.3 0.1 0.1 0.0 0.1 0.0 0.0
Korean Rep. Total 203.6 177.1 196.2 153.1 205.4 205.9 205.3 221.1 216.8 163.1
Malaysia Total 16.0 32.3 10.2 21.8 25.7 23.6 12.5 26.3 13.2 8.9
Mexico Total 21.0 6.7 0.0 9.0 20.0 14.1 17.7 16.8 28.6 32.7
Morocco Total 0.1 0.1 0.0 0.1 0.1 0.1 0.1 0.1 0.1
Copper 39.6 23.6 22.7 26.9 35.4 19.7 20.6 17.4 16.9 35.1
Netherlands Cu Alloy 41.7 41.4 48.0 53.4 54.3 57.1 90.1 90.6 99.9 92.5
Total 81.3 65.1 70.7 80.3 89.6 76.7 110.8 108.0 116.8 127.7
New Zealand Total 3.4 2.7 1.2 0.2 0.1 0.5 0.4 0.6 0.9
Norway Total 5.9 7.6 8.3 10.9 11.3 12.4 12.8 13.5 11.2 7.1
Philippines Total 1.0 0.9 12.1 31.2 19.5 4.2 3.1 2.1 3.9 4.2
Poland Total 6.2 3.5 5.2 6.0 15.0 5.7 14.6 16.8 18.1 21.9
Portugal Total 0.5 1.3 0.8 2.2 1.9 3.3 6.0 7.9 8.8 6.8
Russian Fed. Total 0.2 0.3 0.0 0.0 0.2 0.5 0.5 0.7 3.5 11.0
ICSG 2009 Statistical Yearbook- July 2010
- 48 -

TABLE 16A. IMPORTS OF COPPER AND COPPER ALLOY SCRAPThousand metric tonnes, gross weight metal
COUNTRY Scrap 2000 2001 2002 2003 2004 2005 2006 2007 2008 2009Type 1/ p/
Singapore Total 21.6 17.8 26.6 18.5 21.0 15.9 18.0 7.9 4.4 2.3
Slovakia Total 0.4 5.5 5.6 8.4 20.2 20.0 18.0 17.5 18.0 29.1
Slovenia Total 3.8 3.3 3.2 3.8 3.7 5.8 8.8 10.4 7.5
South Africa Total 5.1 5.3 4.0 2.9 2.7 2.1 2.1 2.6 2.5 1.3
Copper 29.3 27.4 20.7 15.2 71.7 37.9 36.6 18.3 26.0 22.7
Spain Cu Alloy 55.9 58.1 63.0 43.2 43.3 46.9 50.0 37.7 37.2 45.4
Total 85.2 85.5 83.6 58.4 115.0 84.8 86.5 56.1 63.2 68.1
Sri Lanka Total 27.8 40.8 42.1 37.1 1.8
Sweden Total 34.5 30.7 43.5 52.1 76.7 51.0 55.8 80.9 92.1 97.0
Switzerland Total 16.6 13.8 8.4 9.5 11.9 9.9 7.6 8.0 5.3 2.7
Taipei, China Total 44.3 60.5 92.0 81.0 121.0 112.3 145.9 130.9 106.6 70.2
Thailand Total 4.4 4.2 4.2 4.8 5.7 5.0 6.4 7.6 9.2 9.4
Turkey Total 21.7 5.5 7.1 29.8 35.0 10.1 1.8 3.0 1.3 0.9
Copper 4.2 1.3 0.9 1.3 1.1 1.5 2.2 5.9 7.2 6.7
United Kingdom Cu Alloy 18.5 19.1 18.5 16.8 13.7 39.6 17.5 17.8 14.8 11.3
Total 22.6 20.4 19.4 18.1 14.8 41.1 19.6 23.7 22.0 18.0
Copper 30.9 30.3 29.3 19.6 23.4 30.1 24.9
United States Cu Alloy 112.8 84.4 70.9 71.0 78.3 84.0 92.6
Total 143.7 114.7 100.1 90.6 101.7 114.0 117.5 132.9 106.3 71.8
Serbia Total 0.3 0.5 0.5 0.1 2.5 0.0 0.2 0.2 0.4 0.2
Others Total 25.1 23.5 56.9 49.6 26.6 32.5 26.9 61.0 57.8 23.2
Copper 782.6 570.7 622.3 559.9 707.3 628.0 731.0 772.5 775.8 699.0
TOTAL IMPORTS, Cu Alloy 1,007.1 932.0 946.6 879.5 961.1 983.1 1,165.3 1,106.9 1,054.8 852.1
by Scrap Type Not Specif. 3,106.6 3,935.2 3,736.8 3,831.7 4,784.4 5,613.5 5,684.7 6,551.1 6,414.9 4,618.6
Total 4,896.2 5,437.9 5,305.7 5,271.0 6,452.8 7,224.7 7,581.0 8,430.6 8,245.4 6,169.6
EU-15 3/ Total 447.2 324.2 383.4 347.6 354.8 326.5 496.2 471.6 452.6 382.0
EU-25 4/ Total 272.6 241.4 382.3
EU-27 5/ Total 347.9 334.8 282.3
Souce: Official country trade statistics
p/ Preliminary. For some countries incomplete.1/ Scrap type does not include low-grade copper containing scrap, such as ashes and residues.2/ Total may include some low-grade material.3/ Includes only Extra EU-15 trade. 4/ Includes only Extra EU-25 trade. 5/ Includes only Extra EU-27 trade.
ICSG 2009 Statistical Yearbook- July 2010
- 49 -

TABLE 16B. EXPORTS OF COPPER AND COPPER ALLOY SCRAPThousand metric tonnes, gross weight metal
COUNTRY Scrap 2000 2001 2002 2003 2004 2005 2006 2007 2008 2009Type 1/ p/
Algeria Total 7.8 8.0 13.3 16.3 12.6 20.9 24.9 17.5 18.1 Argentina Total 11.3 10.1 19.3 4.5 1.5 1.3 Australia Total 35.2 32.4 57.0 59.1 53.8 87.4 50.4 49.3 50.5 62.4Austria Total 19.8 16.7 26.2 27.5 40.3 34.2 40.0 40.3 41.8 53.6
Copper 12.0 13.2 20.5 18.6 29.8 25.0 34.4 74.6 70.5 30.4Belgium Cu Alloy 141.0 123.4 107.3 133.5 137.7 15.0 127.9 114.8 82.9 77.2
Total 152.9 136.6 127.8 152.1 167.5 40.0 162.3 189.4 153.5 107.6Brazil Total 6.0 5.8 6.2 3.4 2.0 2.6 10.6 5.0 2.0 3.3Bulgaria Total 8.6 8.7 9.5 9.5 9.5 8.1 13.2 11.4 10.5 10.6Canada Total 73.1 70.3 71.2 69.6 80.8 120.1 164.7 165.4 152.1 147.3Chile Total 4.4 7.8 18.0 24.5 38.1 36.9 54.9 102.1 72.0 68.7China Total 10.1 9.9 7.8 7.6 8.7 6.4 6.7 5.0 3.3 2.2Colombia Total 8.4 9.2 8.8 13.2 15.0 23.5 46.2 49.7 35.9 35.2Croatia Total 7.3 6.5 7.0 7.5 9.6 10.8 12.1 12.4 10.9 Czech Rep. Total 37.4 39.5 38.2 36.9 53.1 54.2 57.4 58.2 59.8 105.2
Copper 5.7 5.9 9.2 Denmark Cu Alloy 33.3 33.7 21.7
Total 39.0 39.6 37.1 42.3 37.5 26.3 31.1 30.9 35.8 Estonia Total 8.8 8.0 7.3 6.9 6.5 6.7 12.1 7.8 8.2 Finland Total 16.5 13.8 15.9 19.7 23.5 30.6 31.2 32.9 32.5 32.7
Copper 59.6 71.4 78.8 84.6 113.6 131.6 144.6 139.9 121.6 100.6France Cu Alloy 143.7 118.7 108.9 97.8 131.2 132.6 149.2 140.1 141.4 128.8
Total 203.3 190.1 187.7 182.4 244.7 264.2 293.7 279.9 263.0 229.4Georgia Total 7.2 9.4 10.4 8.5 6.7 8.7 8.7 6.0
Copper 88.7 74.7 103.4 131.3 107.2 111.3 128.6 123.8 133.0 131.3Germany Cu Alloy 200.9 186.5 236.3 263.8 300.6 364.3 370.3 356.9 345.7 318.7
Total 289.6 261.2 339.7 395.2 407.8 475.6 498.9 480.7 478.6 450.0Greece Total 6.3 6.6 6.5 9.5 8.5 15.1 16.9 14.6 12.3 15.7Hong Kong, China Total 148.6 130.3 98.8 336.5 340.1 120.8 129.9 153.4 116.4 70.0Hungary Total 20.6 20.0 17.9 27.4 31.7 34.8 27.1 22.5 20.0 18.1India Total 0.4 2.6 4.5 4.1 2.8 3.4 4.2 0.8 1.1 1.9Indonesia Total 7.8 10.1 19.0 22.0 17.6 31.9 51.4 54.8 40.6 34.8Ireland Total 11.8 8.9 9.0 17.8 16.1 13.2 16.2 10.3 15.2 Israel Total 10.4 9.1 84.6 47.1 31.3 10.0 12.5
Copper 34.0 28.0 30.7 27.0 57.6 45.5 41.5 50.3 75.0 74.1Italy Cu Alloy 32.0 27.9 16.5 27.3 41.0 67.1 62.8 69.9 73.9 84.0
Total 66.0 55.9 47.1 54.4 98.6 112.6 104.3 120.2 148.9 158.1Japan Total 110.9 156.5 237.5 307.1 329.4 424.1 411.7 424.7 395.5 359.5Kazakhstan Total 59.1 15.9 3.4 1.8 1.7 1.5 5.8 9.0 11.7 16.0Korean Rep. Total 33.9 29.9 34.6 93.9 167.2 160.9 201.7 216.2 191.5 186.9Latvia Total 9.2 8.2 7.8 6.3 7.2 9.2 7.2 7.3 6.9 Lithuania Total 12.1 10.0 8.4 7.6 5.8 4.9 4.8 4.7 Malaysia Total 30.9 19.7 31.6 47.2 75.2 36.1 29.2 58.1 28.5Mexico Total 71.5 70.6 59.7 76.3 173.1 105.0 125.9 122.3 128.9 108.5Morocco Total 12.8 10.1 10.7 13.2 15.0 17.7 16.5 12.6 12.5
Copper 31.0 13.2 19.1 21.6 30.2 37.9 80.1 77.6 61.0 83.4Netherlands Cu Alloy 109.2 87.3 87.7 105.7 129.6 170.3 229.9 159.0 164.4 184.8
Total 140.2 100.5 106.8 127.3 159.8 208.2 310.0 236.6 225.3 268.2New Zealand Total 3.0 1.7 3.6 6.4 7.1 8.0 8.2 9.0 9.6
ICSG 2009 Statistical Yearbook- July 2010
- 50 -

TABLE 16B. EXPORTS OF COPPER AND COPPER ALLOY SCRAPThousand metric tonnes, gross weight metal
COUNTRY Scrap 2000 2001 2002 2003 2004 2005 2006 2007 2008 2009Type 1/ p/
Norway Total 17.2 17.3 15.8 16.9 21.3 22.8 24.2 24.1 22.5 15.2Oman Total 2.2 0.2 0.1 0.2 0.3 Peru Total 2.0 1.5 1.6 2.2 2.4 1.6 5.2 7.1 5.5 6.0Philippines Total 29.1 22.1 24.0 20.4 20.8 15.2 25.8 20.3 18.5 22.5Poland Total 26.2 22.4 22.3 40.5 42.8 47.5 55.1 68.8 86.9 68.1
Copper 4.5 2.6 3.4 6.5 7.3 9.3 6.3 4.9 5.1 1.5Portugal Cu Alloy 15.5 11.8 15.4 18.7 28.6 25.7 23.5 16.3 14.1 18.4
Total 20.0 14.4 18.8 25.2 35.9 35.0 29.8 21.2 19.2 19.9Romania Total 41.6 9.4 19.4 16.7 16.0 22.7 41.9 35.9 31.7 42.1Russian Fed. Total 19.0 9.6 5.3 1.6 2.0 2.0 3.5 0.4 2.5 1.3Saudi Arabia Total 23.3 25.7 24.1 26.8 40.1 59.8 126.6 105.0 Serbia Total 1.9 4.6 4.9 4.8 2.2 2.6 3.6 7.2 7.7 7.9Singapore Total 60.2 55.7 66.1 56.2 49.8 42.7 35.1 27.7 19.5 8.7Slovakia Total 7.8 5.5 7.7 8.9 12.1 14.8 19.1 22.3 20.8 14.7Slovenia Total 7.9 8.0 8.6 10.6 12.6 12.6 15.8 17.8 12.8 South Africa Total 57.5 81.6 75.4 39.8 36.4 51.3 75.1 79.4 82.4 71.3
Copper 21.9 22.7 31.4 25.6 25.0 25.1 16.9 18.6 26.0 11.8Spain Cu Alloy 33.1 33.0 40.7 38.3 53.6 74.5 69.0 65.8 56.1 63.1
Total 55.1 55.7 72.2 63.9 78.7 99.6 85.9 84.4 82.1 74.9Sweden Total 31.1 29.2 34.7 36.0 44.4 44.4 45.5 54.8 60.8 57.0Switzerland Total 61.8 58.4 55.1 56.4 69.2 74.9 74.1 75.6 82.7 71.2Taipei, China Total 74.5 50.0 44.7 75.5 61.4 106.7 124.5 127.5 130.1 110.1Thailand Total 18.4 26.9 22.4 54.9 46.1 51.2 60.3 106.9 76.4 69.7Tunisia Total 5.8 5.5 6.7 7.4 9.7 8.3 6.0 8.3 Turkey Total 1.1 7.5 9.9 18.5 4.5 15.1 5.9 8.9 9.7 17.0
Copper 66.4 58.3 60.4 83.0 132.1 134.2 190.8 189.7 179.9 238.9United Kingdom Cu Alloy 152.9 98.0 104.6 127.4 110.5 100.3 118.9 148.9 176.8 190.0
Total 219.3 156.3 165.0 210.4 242.6 234.5 309.7 338.6 356.7 428.9Copper 231.0 261.7 213.2 315.6 320.0 362.0 399.8
United States Cu Alloy 257.8 272.1 297.7 373.4 388.6 302.8 403.8 Total 488.8 533.8 510.9 689.0 708.6 664.8 803.6 945.2 937.1 877.0
Venezuela Total 10.6 9.2 13.9 18.5 16.8 6.4 Zambia Total 7.4 4.9 9.5 13.3 2.2 1.2 1.2 0.3 1.0 Others Total 94.6 62.4 87.5 136.7 127.5 163.4 147.6 231.3 224.8 3.4
Copper 917.9 906.0 869.4 1,063.6 1,209.7 934.6 1,082.5 801.0 782.0 838.3
TOTAL EXPORTS, Cu Alloy 1,347.2 1,206.7 1,219.0 1,518.7 1,655.4 1,364.4 1,691.3 1,459.6 1,359.7 1,316.4
by Scrap Type Not Specif. 858.4 704.9 933.5 1,314.6 1,528.4 2,150.0 2,374.8 3,164.9 3,004.2 2,419.2
Total 3,123.5 2,817.6 3,022.0 3,896.9 4,393.5 4,449.0 5,148.7 5,425.6 5,145.9 4,573.9
EU-15 2/ Total 456.5 397.8 377.3 537.1 699.2 869.5 910.3 982.7 1,006.2 1,150.1EU-25 3/ Total 716.5 881.9 935.0 EU-27 4/ Total 1,010.0 1,021.0 1,174.2
Source: Official country trade statistics
p/ Preliminary. For some countries incomplete.1/ Scrap type does not include low-grade copper containing scrap, such as ashes and residues.2/ Includes only Extra EU-15 trade. 3/ Includes only Extra EU-25 trade. 4/ Includes only Extra EU-27 trade.
ICSG 2009 Statistical Yearbook- July 2010
- 51 -

TABLE 17 - COPPER STATISTICS OF SELECT COUNTRIESThousand metric tonnes, copper
2000 2002 2004 2006 2008 2009 2000 2002 2004 2006 2008 2009 2000 2002 2004 2006 2008 2009MINE PRODUCTIONConcentrates 145.2 203.7 176.4 180.1 156.9 143.1 732.1 790.7 795.8 806.4 830.5 830.6 Mine SX-EW 96.9 77.1 58.3 52.4 53.0 23.4 Mine Total 145.2 203.7 176.4 180.1 156.9 143.1 829.0 867.8 854.1 858.8 883.5 854.0
Ores & Concentrates (Cu Ct.)Imports 0.5 0.1 0.0 1.6 0.7 0.0 0.0 0.0 0.0 0.0 0.0 0.0 0.0 0.3 5.2 3.6 4.9Exports 141.3 202.4 190.5 178.0 163.5 142.0 319.3 346.1 355.2 490.4 542.0 575.8 0.1 0.3 0.5 0.6 1.4
SMELTER PRODUCTIONSmelter Primary 393.0 455.9 443.2 377.0 446.9 422.0 Smelter Secondary 144.7 125.9 107.7 114.6 124.5 114.4Low Grade Electrowon Smelter Total 393.0 455.9 443.2 377.0 446.9 422.0 144.7 125.9 107.7 114.6 124.5 114.4
Blister and AnodeImports 0.0 0.0 0.0 16.8 4.1 1.7 0.9 47.4 70.3 215.1 207.9 291.1 267.5 220.8 212.1Exports 0.0 0.0 0.0 2.3 0.1 0.0 0.0 0.0 17.7 3.5 19.9 8.8 11.1 12.0
REFINERY PRODUCTIONRefinery Primary 390.4 465.5 431.8 376.5 448.6 422.1 237.0 201.7 220.6 237.9 233.1 220.6Refinery Secondary 16.0 16.0 16.0 16.0 16.0 16.0 186.0 225.2 172.3 152.8 162.7 153.1Refinery SX-EW 96.9 77.1 58.3 52.4 53.0 23.4 Refinery Total 16.0 16.0 16.0 16.0 16.0 16.0 487.3 542.6 490.0 428.9 501.5 445.5 423.0 426.9 392.8 390.7 395.8 373.7
Refined CopperImports 33.0 4.7 17.1 14.4 14.5 11.4 4.6 7.3 0.4 1.3 7.5 0.2 40.7 37.2 17.3 21.8 54.2 80.0Exports 0.1 0.1 0.3 323.4 363.5 322.9 286.6 358.3 316.2 199.1 199.4 169.6 236.8 260.3 235.1
USAGEReported 48.9 20.6 33.1 30.0 30.5 27.4 168.5 186.3 167.0 143.4 150.7 129.5 347.0 304.4 299.9 290.5 284.7 234.1Apparent Usage 1/ 48.9 20.6 33.1 30.0 30.5 27.4 168.5 186.3 167.5 143.6 150.7 129.5 264.6 264.7 240.6 175.7 189.8 218.6
COUNTRY STOCKSProducers 4.9 5.0 5.0 5.0 5.0 5.0 Merchants Consumers Total 4.9 5.0 5.0 5.0 5.0 5.0
1/ Not including Exchange stock changes.
ARGENTINA AUSTRALIA BELGIUM
ICSG 2009 Statistical Yearbook- July 2010
- 52 -
ICSG
2009 Statistical Yearbook- July 2010
- 52 -

TABLE 17 - COPPER STATISTICS OF SELECT COUNTRIESThousand metric tonnes, copper
2000 2002 2004 2006 2008 2009 2000 2002 2004 2006 2008 2009 2000 2002 2004 2006 2008 2009MINE PRODUCTIONConcentrates 31.0 30.6 98.7 143.6 216.8 206.7 633.9 603.5 562.8 603.3 605.4 489.8 3,229.8 2,978.6 3,776.2 3,669.0 3,356.6 3,276.9Mine SX-EW 3.8 9.5 1.6 0.8 1,372.6 1,602.0 1,636.3 1,691.8 1,971.0 2,112.4Mine Total 31.0 30.6 98.7 143.6 220.6 216.2 633.9 603.5 562.8 603.3 607.0 490.6 4,602.4 4,580.6 5,412.5 5,360.8 5,327.6 5,389.3
Ores & Concentrates (Cu Ct.)Imports 156.8 141.9 162.3 160.8 142.2 126.9 211.3 129.9 65.9 104.3 73.8 51.6 0.0 6.3 17.4 37.9 37.2 15.8Exports 0.0 0.0 66.5 109.2 191.4 179.2 205.4 148.4 158.9 268.3 311.8 257.3 1,749.2 1,552.7 2,278.8 2,171.5 2,133.4 1,845.1
SMELTER PRODUCTIONSmelter Primary 170.0 173.8 181.7 179.6 184.4 176.4 543.6 513.9 446.2 484.7 443.8 316.5 1,460.4 1,438.7 1,517.6 1,565.4 1,369.2 1,522.3Smelter Secondary 15.0 16.9 23.0 40.0 39.1 30.6 60.1 24.8 30.0 35.8 41.8 29.7 Low Grade Electrowon Smelter Total 185.0 190.7 204.7 219.6 223.5 206.9 603.7 538.7 476.2 520.5 485.6 346.2 1,460.4 1,438.7 1,517.6 1,565.4 1,369.2 1,522.3
Blister and AnodeImports 2.1 0.1 0.1 0.2 2.0 0.0 14.5 58.5 148.4 93.5 95.7 83.2 0.0 0.0 0.0 Exports 1.5 3.0 53.9 84.2 76.0 88.3 85.2 62.1 174.6 182.3 336.1 457.1 407.8 395.8
REFINERY PRODUCTIONRefinery Primary 169.6 170.7 185.0 179.7 183.7 176.4 490.1 468.8 495.9 463.6 398.1 304.5 1,295.7 1,248.1 1,200.4 1,119.5 1,086.6 1,159.1Refinery Secondary 15.0 16.9 23.0 40.0 39.3 30.6 61.3 25.7 31.1 36.9 42.4 30.6 Refinery SX-EW 3.8 9.5 1.6 0.8 1,372.6 1,602.0 1,636.3 1,691.8 1,971.0 2,112.4Refinery Total 184.6 187.6 208.0 219.7 226.8 216.5 551.4 494.5 527.0 500.5 442.1 335.9 2,668.3 2,850.1 2,836.7 2,811.3 3,057.6 3,271.5
Refined CopperImports 157.8 103.2 154.2 175.4 251.9 208.7 11.9 11.7 53.3 58.7 11.2 10.2 0.0 0.0 Exports 13.5 51.3 21.9 56.0 93.1 88.6 288.9 238.1 279.8 279.9 290.0 221.8 2,549.2 2,770.2 2,950.3 2,605.7 2,983.3 3,179.2
USAGEReported 330.5 242.0 332.4 339.2 372.2 319.3 272.1 276.4 297.2 300.6 196.9 142.1 83.0 81.5 100.4 110.7 103.3 91.3Apparent Usage 1/ 330.5 242.0 332.4 339.2 372.2 319.3 274.7 276.4 302.5 276.6 166.7 131.3 83.1 81.5 45.7 111.5 100.5 91.3
COUNTRY STOCKSProducers 4.1 3.6 11.8 10.6 27.5 44.7 12.0 10.0 8.4 13.8 8.7 1.7 212.0 260.6 343.0 359.2 254.3 255.3Merchants Consumers Total 4.1 3.6 11.8 10.6 27.5 44.7 12.0 10.0 8.4 13.8 8.7 1.7 212.0 260.6 343.0 359.2 254.3 255.3
1/ Not including Exchange stock changes.
Brazil Canada Chile
ICSG 2009 Statistical Yearbook- July 2010
- 53 -
ICSG
2009 Statistical Yearbook- July 2010
- 53 -

TABLE 17 - COPPER STATISTICS OF SELECT COUNTRIESThousand metric tonnes, copper
2000 2002 2004 2006 2008 2009 2000 2002 2004 2006 2008 2009 2000 2002 2004 2006 2008 2009MINE PRODUCTIONConcentrates 592.6 568.0 742.2 872.9 1,076.1 1,009.0 11.5 14.4 15.5 13.0 13.3 14.6 Mine SX-EW 5.0 10.0 12.0 16.1 16.6 20.0 Mine Total 597.6 578.0 754.2 889.0 1,092.7 1,029.0 11.5 14.4 15.5 13.0 13.3 14.6
Ores & Concentrates (Cu Ct.)Imports 544.0 619.6 860.8 1,083.5 1,479.0 1,655.7 140.6 150.8 158.7 163.2 161.0 103.2 0.0 0.0 0.1 0.0 0.0Exports 9.7 10.7 4.3 0.0 0.6 0.1 0.0 0.0 2.0 1.1 0.0
SMELTER PRODUCTIONSmelter Primary 1,013.9 1,179.9 1,502.9 1,917.5 2,453.4 2,648.3 152.1 155.9 164.0 160.3 150.0 114.2 Smelter Secondary 173.8 330.0 415.0 600.0 860.3 800.0 3.3 5.0 5.0 4.0 3.0 4.0 Low Grade Electrowon Smelter Total 1,187.7 1,509.9 1,917.9 2,517.5 3,313.7 3,448.3 155.4 160.9 169.0 164.3 153.0 118.2
Blister and AnodeImports 124.7 105.5 114.4 88.4 197.6 228.0 0.0 0.0 0.0 0.0 0.3 0.2 0.3 0.1 0.0Exports 2.4 3.4 1.3 2.8 6.1 0.0 41.5 43.2 25.6 35.0 27.6 37.1 0.9 0.6 6.2 1.6 0.5 0.9
REFINERY PRODUCTIONRefinery Primary 1,003.0 1,202.2 1,616.7 1,988.1 2,581.9 2,721.4 110.8 121.9 131.1 133.8 128.2 101.4 Refinery Secondary 347.7 400.3 570.0 999.1 1,196.0 1,380.0 3.3 5.0 5.0 4.0 3.0 4.0 Refinery SX-EW 5.0 10.0 12.0 16.1 16.6 20.0 Refinery Total 1,355.7 1,612.5 2,198.7 3,003.3 3,794.6 4,121.4 114.1 126.9 136.1 137.8 131.2 105.4
Refined CopperImports 687.4 1,181.0 1,200.1 826.9 1,504.0 3,184.9 9.6 0.3 0.0 0.1 2.4 16.3 585.8 576.4 590.3 506.7 433.9 265.2Exports 116.3 76.6 123.9 243.0 96.1 73.0 16.7 38.9 27.6 55.2 66.9 40.8 11.6 15.1 54.5 46.3 54.9 50.4
USAGEReported 1,876.5 2,774.5 3,380.7 3,604.2 5,202.1 7,189.1 99.0 96.0 108.8 82.6 67.0 80.9 574.0 545.0 550.0 540.1 410.0 310.0Apparent Usage 1/ 1,876.5 2,774.5 3,380.7 3,604.2 5,202.1 7,189.1 103.6 88.9 108.6 82.6 67.0 80.9 558.0 547.8 535.7 457.5 371.1 221.8
COUNTRY STOCKSProducers 110.0 39.0 30.0 73.0 80.0 80.0 4.3 1.2 1.2 1.2 1.2 1.2 Merchants Consumers 42.8 57.8 35.4 20.2 28.0 21.0Total 110.0 39.0 30.0 73.0 80.0 80.0 4.3 1.2 1.2 1.2 1.2 1.2 42.8 57.8 35.4 20.2 28.0 21.0
1/ Not including Exchange stock changes.
China Finland France
ICSG 2009 Statistical Yearbook- July 2010
- 54 -
ICSG
2009 Statistical Yearbook- July 2010
- 54 -

TABLE 17 - COPPER STATISTICS OF SELECT COUNTRIESThousand metric tonnes, copper
2000 2002 2004 2006 2008 2009 2000 2002 2004 2006 2008 2009 2000 2002 2004 2006 2008 2009MINE PRODUCTIONConcentrates 33.8 30.8 30.0 29.0 28.0 29.5Mine SX-EW Mine Total 33.8 30.8 30.0 29.0 28.0 29.5
Ores & Concentrates (Cu Ct.)Imports 212.6 311.2 342.6 344.6 326.5 375.7 0.0 0.0 0.0 0.0 197.5 300.0 232.2 812.2 621.3 631.2Exports 7.8 4.7 14.7 17.3 14.5 17.7 22.3 31.8 5.7 13.4 8.0 0.2
SMELTER PRODUCTIONSmelter Primary 211.2 295.1 278.6 273.8 295.0 251.1 256.0 374.9 399.6 609.6 651.0 705.1Smelter Secondary 360.4 283.1 262.6 266.3 293.3 282.7 5.0 15.0 11.0 10.0Low Grade Electrowon Smelter Total 571.6 578.2 541.1 540.0 588.3 533.8 256.0 374.9 404.6 624.6 662.0 715.1
Blister and AnodeImports 32.4 38.5 11.6 42.1 24.7 43.8 0.0 0.0 0.0 0.0 0.0 0.0 6.6 2.8 1.4 4.7 13.5 3.0Exports 0.0 2.2 0.1 3.2 0.2 0.1 0.0 0.2 0.3 0.1 0.5 0.2 1.9 7.9 0.3 0.0
REFINERY PRODUCTIONRefinery Primary 245.0 327.0 283.7 312.1 300.5 290.2 260.0 374.0 400.3 609.6 650.6 705.1Refinery Secondary 464.4 368.8 369.0 350.2 389.3 378.7 5.0 15.0 11.0 10.0Refinery SX-EW Refinery Total 709.4 695.8 652.6 662.3 689.8 668.9 260.0 374.0 405.3 624.6 661.6 715.1
Refined CopperImports 689.7 459.2 584.9 902.8 833.2 658.7 135.6 126.0 120.1 106.4 75.8 57.4 8.1 12.1 31.1 12.8 15.7 15.5Exports 94.0 91.0 137.2 150.3 125.0 194.0 1.0 0.3 1.9 2.5 0.4 0.8 30.9 89.3 132.8 254.7 169.5 185.4
USAGEReported 1,309.7 1,075.0 1,120.8 1,397.7 1,398.0 1,133.6 134.6 125.9 118.4 103.9 75.5 56.6 265.0 296.9 350.0 450.0 570.0 610.0Apparent Usage 1/ 1,300.4 1,075.2 1,110.3 1,414.9 1,398.0 1,133.6 134.6 125.7 118.2 103.9 75.5 56.6 237.2 296.9 303.5 382.7 507.8 545.2
COUNTRY STOCKSProducers 57.1 60.1 70.0 70.0 70.0 70.0 5.7 6.0 6.0 6.0 6.0 6.0Merchants 2.9 4.5 Consumers 32.8 28.7 Total 92.8 93.3 70.0 70.0 70.0 70.0 5.7 6.0 6.0 6.0 6.0 6.0
1/ Not including Exchange stock changes.
Germany Greece India
ICSG 2009 Statistical Yearbook- July 2010
- 55 -
ICSG
2009 Statistical Yearbook- July 2010
- 55 -

TABLE 17 - COPPER STATISTICS OF SELECT COUNTRIESThousand metric tonnes, copper
2000 2002 2004 2006 2008 2009 2000 2002 2004 2006 2008 2009 2000 2002 2004 2006 2008 2009MINE PRODUCTIONConcentrates 1,004.6 1,162.9 843.2 816.2 650.6 994.5 120.0 119.2 135.5 207.2 240.8 255.7 1.0 Mine SX-EW 1.1 9.0 8.8 10.8 9.0 7.3 6.8 Mine Total 1,004.6 1,162.9 843.2 816.2 650.6 995.6 129.0 128.0 146.3 216.2 248.1 262.5 1.0
Ores & Concentrates (Cu Ct.)Imports 0.1 0.1 0.0 7.5 0.0 3.0 55.4 0.2 0.1 0.0 0.1 0.1 0.1Exports 812.7 920.0 578.2 699.2 488.1 699.1 10.8 2.5 0.1 18.0 0.0 1.5 0.0 0.0 0.0
SMELTER PRODUCTIONSmelter Primary 173.8 211.2 211.6 201.2 253.3 295.9 128.0 119.9 134.1 177.5 179.8 192.7 Smelter Secondary 45.0 51.7 51.0 66.6 67.7 69.1 Low Grade Electrowon Smelter Total 173.8 211.2 211.6 201.2 253.3 295.9 173.0 171.6 185.1 244.1 247.5 261.8
Blister and AnodeImports 0.1 0.0 0.0 0.1 0.8 0.0 0.0 0.0 0.0 0.0 2.9 0.6 0.2 0.3 0.4 0.4Exports 13.9 14.5 1.0 0.0 0.1 7.8 9.9 4.4 6.7 3.9 6.4 2.8
REFINERY PRODUCTIONRefinery Primary 158.4 192.3 210.5 217.6 254.0 288.1 136.9 94.1 102.8 139.5 140.4 149.8 Refinery Secondary 10.0 40.6 38.9 52.4 53.0 53.7 32.8 32.4 33.6 36.4 24.2 6.5Refinery SX-EW 1.1 9.0 8.8 10.8 9.0 7.3 6.8 Refinery Total 158.4 192.3 210.5 217.6 254.0 289.2 155.9 143.5 152.5 200.9 200.6 210.3 32.8 32.4 33.6 36.4 24.2 6.5
Refined CopperImports 32.7 50.5 15.8 17.7 64.8 45.5 0.5 11.1 23.6 604.3 643.4 700.8 772.2 617.4 544.2Exports 134.7 134.2 243.3 110.9 143.3 196.9 43.5 32.9 54.7 91.7 2.1 3.1 17.8 10.6 7.0 27.8
USAGEReported 70.0 125.0 190.0 220.0 195.0 165.0 95.0 110.1 120.0 130.0 135.0 133.3 624.9 672.7 719.3 801.0 635.0 522.9Apparent Usage 1/ 56.4 108.5 -17.0 124.3 175.5 137.8 112.9 121.7 121.3 109.2 200.6 210.3 624.9 672.7 720.0 798.5 635.0 522.9
COUNTRY STOCKSProducers Merchants Consumers 14.9 15.0 11.6 12.0 11.2 11.2Total 14.9 15.0 11.6 12.0 11.2 11.2
1/ Not including Exchange stock changes.
Indonesia Iran Italy
ICSG 2009 Statistical Yearbook- July 2010
- 56 -
ICSG
2009 Statistical Yearbook- July 2010
- 56 -

TABLE 17 - COPPER STATISTICS OF SELECT COUNTRIESThousand metric tonnes, copper
JAPAN KAZAKHSTAN KOREAN REP.2000 2002 2004 2006 2008 2009 2000 2002 2004 2006 2008 2009 2000 2002 2004 2006 2008 2009
MINE PRODUCTIONConcentrates 1.2 1.0 1.0 0.3 430.2 473.8 461.8 434.1 419.9 388.9 Mine SX-EW Mine Total 1.2 1.0 1.0 0.3 430.2 473.8 461.8 434.1 419.9 388.9
Ores & Concentrates (Cu Ct.)Imports 1,347.9 1,281.0 1,292.5 1,390.0 1,482.4 1,243.5 0.0 0.0 17.8 1.3 0.0 377.0 381.4 392.4 437.4 445.2 479.6Exports 35.2 48.2 77.9 24.6 92.5 154.9 0.0 0.3 1.1
SMELTER PRODUCTIONSmelter Primary 1,332.4 1,317.3 1,270.5 1,409.1 1,366.3 1,297.9 396.0 459.6 452.2 426.2 430.0 369.0 369.7 380.0 392.5 449.2 502.0 455.4Smelter Secondary 148.3 182.1 194.9 219.2 259.1 243.9 54.4 50.0 50.0 34.8 42.0 43.8Low Grade Electrowon Smelter Total 1,480.6 1,499.4 1,465.4 1,628.3 1,625.4 1,541.8 396.0 459.6 452.2 426.2 430.0 369.0 424.1 430.0 442.5 484.0 544.0 499.2
Blister and AnodeImports 19.4 9.4 6.4 9.5 31.8 19.4 0.0 0.5 0.0 0.0 0.0 48.0 68.8 53.5 87.2 58.4 40.2Exports 42.8 50.4 8.1 9.3 12.5 1.9 1.0 7.3 10.0 2.5 0.0 5.8 0.0 0.0 0.2 0.1 0.1 0.6
REFINERY PRODUCTIONRefinery Primary 1,289.9 1,211.1 1,188.0 1,342.3 1,328.2 1,238.0 394.7 453.0 445.3 427.7 398.4 368.0 415.5 455.3 451.0 541.1 489.0 495.2Refinery Secondary 147.5 190.0 192.0 189.7 211.7 201.8 52.5 45.0 45.0 34.4 42.0 43.8Refinery SX-EW Refinery Total 1,437.4 1,401.1 1,380.0 1,532.1 1,539.8 1,439.8 394.7 453.0 445.3 427.7 398.4 368.0 468.0 500.3 496.0 575.5 531.0 539.0
Refined CopperImports 202.9 114.4 88.2 75.2 90.8 42.3 3.2 3.0 0.1 0.8 1.3 0.1 418.9 427.2 487.7 380.3 406.5 488.1Exports 299.3 377.8 194.6 319.8 423.5 626.7 392.5 391.4 391.0 357.2 343.5 308.7 27.1 14.7 46.7 143.9 127.5 86.9
USAGEReported 1,347.6 1,167.4 1,279.0 1,282.3 1,184.7 876.0 16.0 64.6 54.4 71.4 56.1 59.5 861.2 911.1 937.0 811.8 780.0 901.0Apparent Usage 1/ 1,347.6 1,167.4 1,279.0 1,282.3 1,184.7 876.0 5.5 64.6 54.4 71.4 56.1 59.4 861.2 911.1 937.0 811.8 811.0 955.3
COUNTRY STOCKSProducers 69.5 49.6 68.7 76.0 71.9 75.2 5.7 4.0 4.0 45.0 10.0 5.0Merchants 12.9 8.5 8.7 6.3 14.5 9.9 2.0 2.0 2.0 10.0 5.0Consumers 21.3 35.3 27.6 20.5 37.9 18.7 8.0 8.0 8.0 10.0 5.0Total 103.7 93.5 105.1 102.8 124.4 103.9 28.8 48.0 48.0 45.0 40.0 25.0
1/ Not including Exchange stock changes.
ICSG 2009 Statistical Yearbook- July 2010
- 57 -
ICSG
2009 Statistical Yearbook- July 2010
- 57 -

TABLE 17 - COPPER STATISTICS OF SELECT COUNTRIESThousand metric tonnes, copper
PERU POLAND2000 2002 2004 2006 2008 2009 2000 2002 2004 2006 2008 2009 2000 2002 2004 2006 2008 2009
MINE PRODUCTIONConcentrates 309.0 260.6 327.5 248.0 172.4 172.7 426.8 688.1 868.6 875.4 1,107.7 1,112.0 454.1 502.8 531.0 497.2 429.4 439.0Mine SX-EW 55.6 69.3 78.1 86.0 74.5 65.7 127.2 156.5 167.0 173.8 160.1 162.8 Mine Total 364.6 329.9 405.6 334.0 246.8 238.4 554.0 844.6 1,035.6 1,049.1 1,267.8 1,274.7 454.1 502.8 531.0 497.2 429.4 439.0
Ores & Concentrates (Cu Ct.)Imports 91.8 8.8 0.0 27.5 46.5 4.1 0.5 0.3 0.2 0.5 0.2 0.0 1.6 0.0 33.8 18.7 23.4Exports 79.4 35.1 71.9 33.5 59.7 72.5 97.9 380.0 482.1 528.3 872.9 866.9 0.0 6.1 0.0 2.7 0.0 0.0
SMELTER PRODUCTIONSmelter Primary 321.8 258.4 268.6 257.6 190.9 160.0 366.7 379.6 377.8 381.3 360.4 341.5 462.8 510.7 547.2 445.1 438.6 408.2Smelter Secondary 5.0 5.0 5.0 5.0 5.0 5.0 19.7 29.4 33.3 80.0 43.8 68.8Low Grade Electrowon Smelter Total 326.8 263.4 273.6 262.6 195.9 165.0 366.7 379.6 377.8 381.3 360.4 341.5 482.5 540.1 580.5 525.1 482.4 477.0
Blister and AnodeImports 81.8 74.6 70.0 77.7 66.5 37.5 0.0 0.0 0.0 0.0 0.0 0.0 0.0 0.0 0.0 31.6 31.9 39.0Exports 22.2 18.4 21.3 19.8 13.7 8.5 26.5 34.0 28.2 20.0 10.0 23.2 0.0 17.3 0.0 0.0 0.0 18.4
REFINERY PRODUCTIONRefinery Primary 364.1 279.9 290.1 278.0 215.5 190.0 324.4 346.3 338.3 333.8 303.9 260.5 466.0 478.7 520.1 476.1 483.0 433.6Refinery Secondary 5.0 5.0 5.0 5.0 5.0 5.0 20.0 30.0 30.0 80.5 43.8 68.8Refinery SX-EW 55.6 69.3 78.1 86.0 74.5 65.7 127.2 156.5 167.0 173.8 160.1 162.8 Refinery Total 424.7 354.2 373.2 369.0 295.0 260.7 451.6 502.7 505.3 507.6 463.9 423.3 486.0 508.7 550.1 556.6 526.8 502.5
Refined CopperImports 143.0 66.8 56.9 46.1 41.3 56.6 0.0 2.8 0.0 0.0 0.5 0.2 1.0 12.6 6.5 12.9Exports 76.2 55.2 24.1 62.0 33.1 33.3 408.0 458.0 447.4 441.7 390.5 365.9 240.3 262.4 275.1 287.7 296.7 305.7
USAGEReported 491.5 365.8 406.1 360.0 325.0 277.3 45.3 44.7 57.9 52.9 54.8 53.0 247.2 246.6 267.0 275.0 246.9 213.6Apparent Usage 1/ 491.5 365.8 406.1 353.1 303.2 284.0 45.3 44.7 57.7 68.7 73.4 57.4 247.2 246.6 267.0 275.0 246.9 213.6
COUNTRY STOCKSProducers 4.8 4.8 5.0 5.0 5.0 5.0 6.0 6.0 15.0 17.1 10.7 6.8Merchants Consumers Total 4.8 4.8 5.0 5.0 5.0 5.0 6.0 6.0 15.0 17.1 10.7 6.8
1/ Not including Exchange stock changes.
MEXICO
ICSG 2009 Statistical Yearbook- July 2010
- 58 -
ICSG
2009 Statistical Yearbook- July 2010
- 58 -

TABLE 17 - COPPER STATISTICS OF SELECT COUNTRIESThousand metric tonnes, copper
RUSSIAN FED. SPAIN2000 2002 2004 2006 2008 2009 2000 2002 2004 2006 2008 2009 2000 2002 2004 2006 2008 2009
MINE PRODUCTIONConcentrates 76.3 77.2 95.7 78.6 89.6 86.9 530.0 662.1 630.0 670.2 695.0 665.7 23.3 1.2 1.4 6.6 7.1 15.4Mine SX-EW 4.8 10.0 10.0 5.6Mine Total 76.3 77.2 95.7 78.6 89.6 86.9 530.0 662.1 630.0 675.0 705.0 675.7 23.3 1.2 1.4 6.6 7.1 21.0
Ores & Concentrates (Cu Ct.)Imports 0.0 0.0 39.1 43.2 35.1 23.0 37.5 41.5 269.2 284.6 233.1 330.1 336.6 355.3Exports 76.9 77.7 83.2 98.5 92.1 90.8 7.6 3.5 21.3 0.5 2.4 4.9 5.6 1.2 0.8 1.9 0.1 33.2
SMELTER PRODUCTIONSmelter Primary 550.0 660.3 661.9 635.0 602.0 579.6 258.6 281.3 210.2 263.1 256.9 261.0Smelter Secondary 295.0 201.7 257.0 312.0 250.0 218.2 31.3 16.7 14.1 0.6 3.0 3.9Low Grade Electrowon Smelter Total 845.0 862.0 918.9 947.0 852.0 797.8 289.9 298.0 224.3 263.7 259.9 264.9
Blister and AnodeImports 0.0 0.0 0.0 0.1 0.2 0.0 0.0 0.0 0.0 6.2 17.6 9.2 2.5 3.1 1.7 3.0Exports 0.0 0.0 0.0 0.0 3.7 6.9 0.0 6.7 0.0 27.1 21.1 50.9 44.4 41.7 38.8
REFINERY PRODUCTIONRefinery Primary 547.0 653.4 682.1 634.7 602.0 646.0 245.3 271.5 194.1 235.3 257.0 262.5Refinery Secondary 295.0 201.7 237.0 311.9 250.0 218.1 80.0 67.5 64.3 64.0 62.0 67.0Refinery SX-EW 4.8 10.0 10.0 5.6Refinery Total 842.0 855.1 919.1 951.4 862.0 874.1 325.3 339.0 258.4 299.3 319.0 335.1
Refined CopperImports 0.1 0.1 1.7 0.1 1.1 3.7 8.4 0.2 0.0 2.2 9.5 1.5 31.4 26.7 74.3 65.8 79.1 80.9Exports 0.0 0.2 0.2 0.1 0.8 631.3 505.7 331.5 261.8 221.5 482.6 57.5 24.0 32.7 44.5 78.6 105.2
USAGEReported 0.1 0.1 1.6 1.5 1.5 1.5 219.1 349.6 587.6 691.7 649.9 393.0 275.0 307.0 331.0 319.1 385.0 338.1Apparent Usage 1/ 0.1 0.1 1.5 -0.1 1.0 2.9 219.1 349.6 587.7 691.7 649.9 393.0 299.3 341.7 300.0 320.5 319.6 310.7
COUNTRY STOCKSProducers Merchants Consumers Total
1/ Not including Exchange stock changes.
PORTUGAL
ICSG 2009 Statistical Yearbook- July 2010
- 59 -
ICSG
2009 Statistical Yearbook- July 2010
- 59 -

TABLE 17 - COPPER STATISTICS OF SELECT COUNTRIESThousand metric tonnes, copper
UNITED KINGDOM2000 2002 2004 2006 2008 2009 2000 2002 2004 2006 2008 2009 2000 2002 2004 2006 2008 2009
MINE PRODUCTIONConcentrates 77.9 72.1 82.3 86.8 56.9 54.6 Mine SX-EW Mine Total 77.9 72.1 82.3 86.8 56.9 54.6
Ores & Concentrates (Cu Ct.)Imports 45.4 114.1 101.7 78.4 118.1 111.2 0.2 0.1 0.2 0.4 0.1 0.8 0.2 0.2Exports 12.0 0.0 0.0 1.4 0.0 0.0 0.1 0.0 0.0 0.0 0.1 0.0 0.0
SMELTER PRODUCTIONSmelter Primary 103.0 179.7 181.2 140.8 150.9 145.9 Smelter Secondary 30.2 47.1 53.0 53.0 52.8 37.6 3.0 Low Grade Electrowon Smelter Total 133.1 226.8 234.2 193.8 203.7 183.4 3.0
Blister and AnodeImports 0.1 0.0 0.0 35.5 23.4 22.1 1.7 1.9 0.7 1.8 1.3 1.7 1.1 0.1 0.1 0.2 6.3 3.0Exports 0.0 0.0 0.1 0.0 0.0 0.0 2.4 2.5 0.9 0.3 0.1 0.5 0.4 0.3 0.8 0.2 2.7 0.2
REFINERY PRODUCTIONRefinery Primary 103.0 177.3 181.0 176.0 177.8 166.4 Refinery Secondary 30.2 47.1 54.7 53.2 50.1 39.3 3.0 Refinery SX-EW Refinery Total 133.2 224.4 235.6 229.3 227.9 205.7 3.0
Refined CopperImports 82.4 37.0 34.9 41.0 21.2 23.0 629.0 655.7 692.4 646.6 585.0 498.4 338.6 316.0 214.1 184.2 48.1 43.5Exports 12.2 91.9 81.9 86.7 71.6 77.8 0.6 1.1 2.2 6.6 2.7 4.8 10.2 33.7 6.6 6.7 4.7 14.0
USAGEReported 203.4 169.5 183.7 183.6 179.4 150.9 628.4 654.6 690.1 640.0 582.3 493.6 322.8 250.0 242.0 180.0 54.0 49.0Apparent Usage 1/ 203.4 169.5 183.7 183.6 179.4 150.9 628.4 654.6 690.1 640.0 582.3 493.6 328.3 282.6 207.5 177.5 43.4 29.5
COUNTRY STOCKSProducers 5.0 5.0 7.0 7.0 Merchants Consumers 10.4 7.0 7.0 7.0 7.0 7.0Total 5.0 5.0 7.0 7.0 10.4 7.0 7.0 7.0 7.0 7.0
1/ Not including Exchange stock changes.
SWEDEN TAIPEI, CHINA
ICSG 2009 Statistical Yearbook- July 2010
- 60 -
ICSG
2009 Statistical Yearbook- July 2010
- 60 -

TABLE 17 - COPPER STATISTICS OF SELECT COUNTRIESThousand metric tonnes, copper
SERBIA ZAMBIA2000 2002 2004 2006 2008 2009 2000 2002 2004 2006 2008 2009 2000 2002 2004 2006 2008 2009
MINE PRODUCTIONConcentrates 909.6 556.9 590.0 691.4 827.0 728.6 46.0 30.7 12.2 12.0 18.8 19.0 184.1 258.0 319.5 350.0 383.6 447.7Mine SX-EW 557.1 600.5 584.0 530.4 508.0 475.4 65.0 83.0 82.6 124.1 163.0 140.5Mine Total 1,466.7 1,157.4 1,174.0 1,221.8 1,335.0 1,204.0 46.0 30.7 12.2 12.0 18.8 19.0 249.1 341.0 402.1 474.1 546.6 588.2
Ores & Concentrates (Cu Ct.)Imports 0.1 71.9 6.9 0.1 0.0 19.1 11.3 2.4 37.7 16.8 10.1 1.1 0.9 18.3 51.3 85.9 Exports 107.0 23.0 23.7 123.6 301.2 150.8 0.4 0.5 1.0 0.5 0.6 2.0 16.8 109.3 72.5
SMELTER PRODUCTIONSmelter Primary 861.7 683.3 542.1 501.3 571.7 597.2 33.8 36.1 13.9 40.0 31.9 32.0 180.0 245.0 280.1 289.7 232.0 334.0Smelter Secondary 140.0 13.6 6.7 1.1 1.0 1.0 1.0 Low Grade Electrowon Smelter Total 1,001.7 683.3 542.1 501.3 571.7 597.2 47.4 42.7 15.0 41.0 32.9 33.0 180.0 245.0 280.1 289.7 232.0 334.0
Blister and AnodeImports 194.7 148.4 148.9 172.3 123.6 69.0 0.0 0.0 0.0 0.0 0.8 0.0 0.0 0.1 0.2 Exports 23.4 34.5 46.5 18.9 23.5 26.0 0.0 0.0 0.5 0.0 0.2 0.4 14.0 1.9
REFINERY PRODUCTIONRefinery Primary 1,038.0 841.4 671.3 675.2 718.0 639.4 31.4 29.2 10.9 40.0 32.8 33.0 162.4 247.8 285.6 240.0 241.9 269.0Refinery Secondary 198.5 70.0 50.8 44.8 54.3 46.4 14.2 6.7 1.1 1.0 1.0 1.0 Refinery SX-EW 557.1 600.5 584.0 530.4 508.0 475.4 65.0 89.0 124.0 177.6 175.0 145.4Refinery Total 1,793.6 1,511.9 1,306.0 1,250.3 1,280.3 1,161.2 45.6 35.9 12.0 41.0 33.8 34.0 227.4 336.8 409.6 417.6 416.9 414.4
Refined CopperImports 1,055.6 926.8 703.9 1,076.4 723.6 663.6 1.4 5.3 38.7 14.1 23.9 20.9 0.1 0.0 0.1 0.1 Exports 93.6 26.6 127.1 123.6 38.3 85.7 38.8 43.6 4.9 13.7 3.4 3.7 200.0 328.8 393.1 475.7 585.2 675.4
USAGEReported 3,027.0 2,363.6 2,414.8 2,130.3 2,020.0 1,628.5 25.0 20.0 20.0 36.3 37.0 36.0 6.7 8.4 18.0 27.0 29.0 28.1Apparent Usage 1/ 2,754.3 2,440.2 1,892.7 2,172.3 1,999.5 1,734.8 8.3 -2.4 45.8 41.4 54.3 51.2 29.6 8.0 16.5 -58.0 -168.2 -260.9
COUNTRY STOCKSProducers 14.8 11.7 10.3 28.1 15.7 16.0 12.8 12.0 12.0 12.0 12.0 12.0Merchants Consumers 57.3 55.3 45.3 61.7 34.2 38.2 Total 72.1 67.0 55.7 89.8 49.9 54.2 12.8 12.0 12.0 12.0 12.0 12.0
1/ Not including Exchange stock changes.
UNITED STATES
ICSG 2009 Statistical Yearbook- July 2010
- 61 -
ICSG
2009 Statistical Yearbook- July 2010
- 61 -

Arge
ntin
a
Aust
ralia
Braz
il
Bulg
aria
Cana
da
Chile
Chin
a
Cong
o
Geo
rgia
Indo
nesia
Iran
Japa
n
Kaza
khst
an
Laos
Mau
ritan
ia
Mac
edon
ia
Mex
ico
Mon
golia
Mor
occo
Om
an
Papu
a ne
w G
uine
a
Peru
Philip
pine
s
Portu
gal
Rom
ania
Russ
ian
Fed.
Sout
h Af
rica
Thai
land
Turk
ey
Unite
d St
ates
Viet
nam
Zam
bia
Oth
ers
Wor
ld
Bulgaria 64.6 189.7 0.8 141.6 41.3 130.6 15.2 21.1 0.0 605
Brazil 446.1 0.0 27.6 0.0 474
Canada 4.2 29.1 40.6 0.1 96.4 75.6 246
Chile 0.0 0.0 120.7 0.0 3.5 124
China 19.2 550.4 37.2 2.7 129.3 1,518 129.4 13.2 48.0 131.0 26.6 159.3 221.3 532.7 0.3 26.3 29 939.7 44.9 3.5 8.9 85.3 18.1 133.8 257.8 23.3 52.4 50.6 5,192
Finland 10.4 25.1 141.8 23.0 7.9 139.4 158.8 0.1 1.4 21.6 7.3 537
Germany 144.2 0.4 95.6 124.3 374.2 0.0 2.3 5.5 0.0 44.3 268.4 12.1 6.5 6.1 0.0 0.5 3.8 1,088
India 20.6 520.0 143.6 27 634 9.9 77.6 134.7 114.0 0.0 89.5 162.2 47.2 15.1 51.0 23.8 2,071
Indonesia 0.0 0.0 0.1 0
Japan 79.0 391.2 21.5 401.0 2,045 0 10.0 740.9 28.6 0.0 240.8 768.3 77.3 6.2 131.1 4,941
Korean rep. 125.4 184.4 72.6 67.1 501.1 218.4 0.1 11.0 26.5 64.6 159.8 10.1 11.0 20.0 0.0 11.8 1,484
Mexico 0.5 144.5 9.8 155
Oman 0.1 17.5 2.7 20
Philippines 46.6 116.8 16.5 13.5 94.9 11.2 122.6 130.5 11.0 21.7 36.4 622
Poland 53.8 3.0 5.6 0.0 62
Russian Fed. 0.0 124.8 0.0 125
South Africa 0.0 0.0 1.5 0.0 33.4 0.1 35
Spain 74.9 92.4 0.0 37.0 215 11.8 324 15.7 191.6 119.9 29.6 11.0 1,122
Sweden 56.2 12.6 110 57.9 90.9 20.3 45.4 394
Thailand 0.0 0
Serbia 50.0 5.1 0.1 55
Zambia 0.0 259 1.1 260
Others 0.0 1.4 1.1 0.1 0.3 0 0 0.0 3 0.0 0.5 0.0 0.6 1.0 0.6 0.2 0.0 0.1 0.1 0.2
World 520 1,763 602 58 838 6,353 21 484 159 1,553 180 3 279 38 159 41 277 533 30 27 599 2,991 133 410 24 9 169 29 248 650 23 137
REPORTER
ORIGIN
TA
BL
E 18 A
- IMP
OR
TS O
F C
OP
PE
R C
ON
CE
NT
RA
TE
BY
DE
STIN
AT
ION
IN 2008
Thousand m
etric tonnes of copper concentrates
ICSG 2009 Statistical Yearbook- July 2010
- 62 -
ICSG
2009 Statistical Yearbook- July 2010
- 62 -

Belg
ium
Braz
il
Bulg
aria
Cana
da
Chile
Chin
a
Finl
and
Ger
man
y
Hong
Kon
g
Indi
a
Iran
Japa
n
kore
an re
p.
Mex
ico
Nam
ibia
Neth
erla
nds
North
Kor
ea
Peru
Philip
pine
s
Pola
nd
Russ
ian
fed.
Serb
ia
Sout
h Af
rica
Spai
n
Swed
en
Switz
erla
nd
Thai
land
Taiw
an
Unite
d kin
gdom
Unite
d St
ates
Uzbe
kista
n
Zim
babw
e
Oth
ers
Wor
ld
Argentina 29.8 155.1 19.1 70.4 140.0 103.0 110.8 0.0 628
Armenia 36.0 0.3 0.0 6 25.1 1.8 69
Australia 602.4 531.4 369.4 193.6 109.7 0.0 1,807
Brazil 1.3 89.6 33 119 135 47 63.7 7 16.5 80 43.6 1 0.0 638
Botswana 64.1 0.7 1.9 5.9 0.0 73
Bulgaria 9 0 2 31.1 11 51 1.7 106
Canada 37 76 5 215 29 300 65 0 43 0 42 76 150 1.4 1,039
Chile 466 214.6 33 1,446 135.5 340 792 10.9 1,943 518.5 10 130.1 84 239 102.8 0.0 6,465
Georgia 73.3 5.5 5.8 10.2 0.0 95
Germany 1.1 0 0 0 46.5 0 0.4 48
India 10.5 16.0 0.0 0.0 0.2 27
Indonesia 13 135 750 300.7 143.8 285 0.2 1,627
Kazakhstan 147.3 130.1 22.8 7.8 0.0 308
Mauritania 0.1 150 0.0 150
Mexico 162.5 0.0 1.0 17.1 17.2 0.0 1.4 0.0 0 199
Mongolia 523.4 523
Papua New Guinea 532.3 532
Peru 0.9 0 89.1 53 128.0 905 149.4 274 121 717 58.0 24.2 96.8 29.7 2.2 175 74.9 11 0.0 2,909
Philippines 0.1 0.4 18.4 2.0 71.7 11.0 3.9 0.2 1.7 0.1 0.8 110
Portugal 27.2 30 0 129.1 31 79 78.5 1.5 377
Romania 24.1 4.6 4.6 0.0 33
South Africa 190.0 142 4 0.6 11 0.0 0 0.0 7 1 6.2 361
Turkey 14.7 147.2 21.6 16.5 23.4 28.5 0.1 252
United States 2.0 197 295 0 0.2 0 145 24.5 354 0.2 11.8 0.8 1 0.1 3.0 1,035
Zambia 37.9 0.0 0.3 0.0 0.5 118.2 191.0 1.9 350
Others 0.0 2.8 3.4 47 9.4 1 0.6 6 0.0 2.8 7 0 4 0.0 0 0.0 19 14 0.3 2.3 0
World 223 496 581 292 131 4,181 450 1,164 5 1,797 11 4,413 1,395 361 56 0 97 53 576 84 130 55 121 1,066 462 239 1 154 38 161 8 6
REPORTER
DESTINATION
TA
BL
E 18 B
- EX
PO
RT
S OF
CO
PP
ER
CO
NC
EN
TR
AT
E B
Y D
EST
INA
TIO
N IN
2008T
housand metric tonnes of copper concentrates
ICSG 2009 Statistical Yearbook- July 2010
- 63 -
ICSG
2009 Statistical Yearbook- July 2010
- 63 -

Arm
enia
Belg
ium
Bulg
aria
Cana
da
Chile
Chin
a
Cong
o
Ger
man
y
Finl
and
Italy
Japa
n
Mex
ico
Nam
ibia
Neth
erla
nds
Pakis
tan
Peru
Philip
pine
s
Russ
ian
Fed.
Slov
akia
Sout
h Af
rica
Spai
n
Taiw
an
Turk
ey
Unite
d St
ates
Zam
bia
Oth
ers
Wor
ld
Australia 47.08 0.00 0.00 0.32 0.00 47.4
Austria 6.25 0.15 0.12 0.01 0.07 0.01 32.76 0.28 39.7
Belgium 107.73 1.21 3.34 0.00 75.06 6.49 8.80 0.10 18.08 220.8
Brazil 0.03 2.01 2.0
Canada 0.50 88.31 0.00 5.39 1.45 95.7
China 5.05 0.01 67.59 2.43 57.54 0.09 4.42 0.33 7.78 0.00 6.45 11.35 4.78 3.02 0.49 20.75 5.52 197.6
Germany 6.71 0.20 0.56 0.06 0.13 1.03 1.28 0.00 0.86 0.04 9.39 0.04 0.02 4.39 24.7
India 1.01 2.51 0.00 5.50 0.01 0.00 0.01 4.00 0.38 0.06 13.5
Japan 7.50 0.00 1.08 6.94 15.98 0.33 31.8
Korean Rep. 4.04 28.70 2.01 8.39 1.84 10.33 0.08 2.00 0.97 58.4
Malaysia 0.20 0.15 0.01 0.01 0.09 0.5
Mexico 66.35 0.00 0.00 0.10 0.00 66.5
Netherlands 0.00 0.00 64.33 64.3
Philippines 0.26 1.01 0.02 0.09 0.01 1.4
Poland 6.06 12.06 2.00 7.83 0.01 1.38 2.01 0.60 31.9
Singapore 0.05 0.00 0.00 0.04 0.25 0.02 0.27 0.6
Spain 1.10 0.03 0.07 0.03 0.00 0.20 0.10 0.19 1.7
Sweden 23.40 0.02 23.4
Thailand 0.12 0.01 0.01 0.10 0.32 0.09 1.36 2.0
Turkey 15.16 0.00 0.00 22.95 38.1
United Kingdom 4.72 0.01 0.00 0.15 1.45 6.3
United States 85.22 33.26 0.00 1.08 0.01 3.99 0.00 0.01 123.6
Others 0.01 0.04 0.00 0.52 0.95 2.74 0.02 0.81 0.05 0.02 0.04 0.24 0.01 0.17 0.03 0.25 0.06
World 7 8 151 85 345 3 72 11 26 6 3 13 12.3 75 17 9 16 7 33 22 9 6 9 8 21
REPORTER
ORIGIN
REPORTER
TA
BL
E 19 A
- IMP
OR
TS O
F B
LIST
ER
/AN
OD
E B
Y O
RIG
IN IN
2008T
housand metric tonnes
ICSG 2009 Statistical Yearbook- July 2010
- 64 -
ICSG
2009 Statistical Yearbook- July 2010
- 64 -

Aust
ria
Belg
ium
Braz
il
Cana
da
Chin
a
Ger
man
y
Hong
Kon
g
Indi
a
Japa
n
Kore
an R
ep.
Mex
ico
Neth
erla
nds
Philip
pine
s
pola
nd
Rom
ania
Sout
h Af
rica
Spai
n
Swed
en
Taiw
an
Thai
land
Turk
ey
Unite
d Ar
ab
Emira
tes
Unite
d St
ates
Oth
ers
Wor
ld
Armenia 6.20 0.02 6.2
Belgium 0.50 2.95 0.06 7.11 0.08 0.36 11.1
Bulgaria 6.90 106.87 3.03 6.07 3.03 11.40 14.17 0.00 151.5
Canada 0.00 0.00 85.22 0.00 85.2
Chile 31.60 86.63 24.00 5.00 1.00 5.50 14.55 64.04 29.86 5.51 42.80 97.31 407.8
China 0.50 5.64 6.1
Finland 2.33 1.08 24.12 0.06 27.6
Germany 0.00 0.18 0.2
India 0.02 0.00 0.00 0.12 0.00 0.00 0.00 0.07 0.02 0.07 0.3
Italy 1.55 0.12 3.92 0.10 0.00 0.00 0.01 0.00 0.72 6.4
Japan 3.90 0.93 3.70 0.63 2.22 0.65 0.48 12.5
Kazakhstan 0.00 0.0
Mexico 1.91 0.46 6.74 4.19 0.5 13.7
Namibia 10.58 1.58 0.92 90.41 0.04 0.17 103.7
Netherlands 0.02 0.00 0.00 0.02 0.00 0.00 0.01 0.01 64.48 64.5
Peru 10.00 0.0 10.0
Philippines 16.45 0.00 16.4
Slovakia 28.39 28.4
South Africa 0.91 2.79 0.06 0.03 0.00 3.8
Turkey 3.00 5.00 2.00 24.72 34.7
United States 0.07 0.07 4.15 0.26 1.21 2.45 0.47 1.50 1.17 0.07 0.00 0.40 0.40 0.37 0.60 0.12 0.01 0.00 10.15 23.5
Zambia 0.00 0.29 0.84 0.77 1.9
Others 41.96 0.00 0.02 0.25 5.85 0.14 0.49 0.00 0.08 0.19 0.01 0.00 0.04 0.19 0.00 0.00 0.02 0.03 0.67 0.03
World 8.45 194.9 0.07 91.3 50.2 26.2 3.5 13.0 24.5 32.9 64.1 120.6 1.0 18.5 0.0 0.9 0.6 24.5 8.3 0.8 14.2 0.7 132.3
REPORTER
DESTINATION
TA
BL
E 19 B
- EX
PO
RT
S OF
BL
ISTE
R/A
NO
DE
BY
DE
STIN
AT
ION
IN 2008
Thousand m
etric tonnes
ICSG 2009 Statistical Yearbook- July 2010
- 65 -
ICSG
2009 Statistical Yearbook- July 2010
- 65 -

TABLE 20 A - IMPORTS OF REFINED COPPER BY ORIGIN, 2008Thousand metric tonnes, refined copper
Aust
ralia
Aust
ria
Belg
ium
Braz
il
Bulg
aria
Cana
da
Chile
Chin
a
Cong
o
Finl
and
Fran
ce
Ger
man
y
Indi
a
Indo
nesia
Iran
Japa
n
Kaza
khst
an
Kore
an R
ep.
Laos
Mex
ico
Argentina 14.41
Austria 0.00
Belgium 1.07 0.23 0.78 7.71 0.00 1.80 6.20 0.20 1.76
Brazil 206.73 0.29 0.01
Bulgaria 0.00 0.72
Canada 0.03 0.30 0.00 0.23 0.02
China 60.92 9.95 4.60 7.00 2.62 744.40 4.13 2.02 0.02 15.23 24.37 11.84 213.34 130.27 70.41 3.39 7.79
Colombia 3.36 0.02 0.78
Czech Rep. 0.34 0.03 0.05 0.00 0.05 0.00 3.99
Egypt 3.48 7.81 0.01 1.51 0.71 9.81 0.42
France 11.24 34.13 0.30 0.01 0.00 246.45 0.00 0.11 0.22 29.24 0.03 0.00 0.06
Germany 30.16 75.54 42.26 0.04 2.70 196.66 0.00 0.01 64.76 35.61 0.06 1.20 2.06 0.00 0.92
Greece 0.16 0.00 0.08 0.80 2.31 13.70 0.08 5.36 0.24 28.62
Hong Kong 0.53 0.10 0.81 2.20 1.90 0.04 2.17 1.00
India 2.31 0.61 0.08 0.20 0.00 0.82 0.05 0.15 0.15 0.03 2.41 0.10 0.15
Indonesia 19.26 0.34 0.02 1.47 7.78 24.71 8.63
Italy 47.78 12.86 17.90 0.41 17.85 341.63 0.04 0.01 2.03 18.13 4.63 0.66 10.43 0.00
Japan 14.51 50.39 3.04 1.49 1.56
Korean Rep. 23.24 0.41 199.61 5.21 0.20 0.07 0.80 36.13 5.72 4.01
Malaysia 43.88 4.31 0.14 42.02 7.36 5.13 0.40
Mexico 0.04 0.20 26.04 0.38 0.02 0.02 0.28
Netherlands 0.22 2.07 0.08 12.34 0.03 2.08 0.02
Pakistan 0.20 0.05 0.00 0.02 0.08 0.20
Philippines 5.33 0.47 0.02 0.13 0.09 0.14 2.10
Serbia 0.05 1.95 19.85 0.12 0.05 0.05 0.13
Singapore 13.14 15.01 0.43 0.18 0.01 7.01 1.34 0.24 1.50
South Africa 0.07 0.00 0.11 0.08
Spain 0.04 0.00 0.45 67.01 0.40 0.03 1.01 0.63 0.40 0.00
Sweden 0.10 0.10 6.36 0.01
Taiwan
Thailand 40.61 0.00 9.21 1.85 0.07 0.00 22.82 44.01 30.30 17.96 49.22
Turkey 0.75 1.31 17.43 4.06 36.97 0.11 0.23 0.01 40.36 118.18 0.14
Ukraine 0.74
United Arab Emirates 2.02 0.00 2.06 0.03 0.15 0.01 0.02 19.27 0.42
United Kingdom 0.17 2.36 1.30 0.13 0.05 29.60 1.62 0.01 0.02
United States 0.60 242.26 331.80 0.06 0.03 3.23 0.00 4.68 0.00 0.00 19.51
Vietnam 14.19 7.38 0.01 0.01 2.58 1.73 3.07 7.97 13.78
Others 5.95 1.38 0.05 3.07 0.05 11.61 0.94 19.59 0.01 1.21 12.88 1.01 0.03 0.11 19.83 0.08 0.00
World 244 100 137 72 48 273 2,550 17 30 71 73 97 135 62 53 325 325 117 71 31
REPORTER
ORIGIN
ICSG 2009 Statistical Yearbook- July 2010
- 66 -
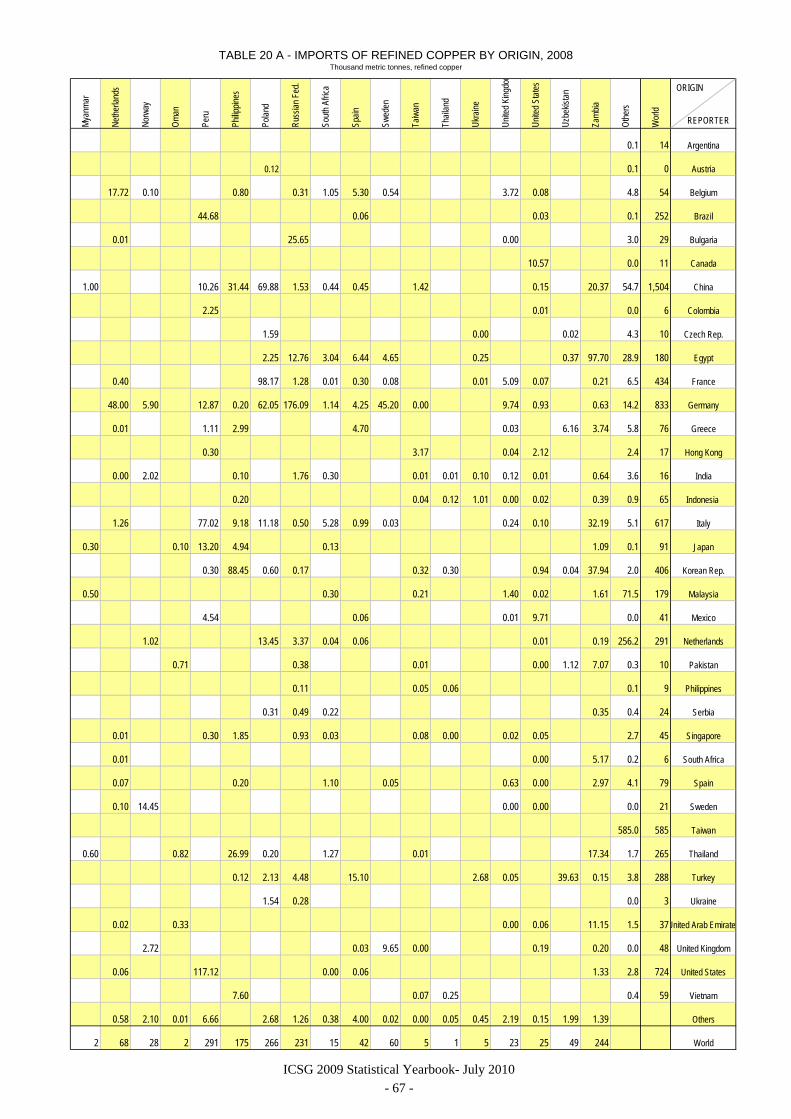
TABLE 20 A - IMPORTS OF REFINED COPPER BY ORIGIN, 2008Thousand metric tonnes, refined copper
Mya
nmar
Neth
erla
nds
Norw
ay
Om
an
Peru
Philip
pine
s
Pola
nd
Russ
ian
Fed.
Sout
h Af
rica
Spai
n
Swed
en
Taiw
an
Thai
land
Ukra
ine
Unite
d Ki
ngdo
m
Unite
d St
ates
Uzbe
kista
n
Zam
bia
Oth
ers
Wor
ld
0.1 14 Argentina
0.12 0.1 0 Austria
17.72 0.10 0.80 0.31 1.05 5.30 0.54 3.72 0.08 4.8 54 Belgium
44.68 0.06 0.03 0.1 252 Brazil
0.01 25.65 0.00 3.0 29 Bulgaria
10.57 0.0 11 Canada
1.00 10.26 31.44 69.88 1.53 0.44 0.45 1.42 0.15 20.37 54.7 1,504 China
2.25 0.01 0.0 6 Colombia
1.59 0.00 0.02 4.3 10 Czech Rep.
2.25 12.76 3.04 6.44 4.65 0.25 0.37 97.70 28.9 180 Egypt
0.40 98.17 1.28 0.01 0.30 0.08 0.01 5.09 0.07 0.21 6.5 434 France
48.00 5.90 12.87 0.20 62.05 176.09 1.14 4.25 45.20 0.00 9.74 0.93 0.63 14.2 833 Germany
0.01 1.11 2.99 4.70 0.03 6.16 3.74 5.8 76 Greece
0.30 3.17 0.04 2.12 2.4 17 Hong Kong
0.00 2.02 0.10 1.76 0.30 0.01 0.01 0.10 0.12 0.01 0.64 3.6 16 India
0.20 0.04 0.12 1.01 0.00 0.02 0.39 0.9 65 Indonesia
1.26 77.02 9.18 11.18 0.50 5.28 0.99 0.03 0.24 0.10 32.19 5.1 617 Italy
0.30 0.10 13.20 4.94 0.13 1.09 0.1 91 Japan
0.30 88.45 0.60 0.17 0.32 0.30 0.94 0.04 37.94 2.0 406 Korean Rep.
0.50 0.30 0.21 1.40 0.02 1.61 71.5 179 Malaysia
4.54 0.06 0.01 9.71 0.0 41 Mexico
1.02 13.45 3.37 0.04 0.06 0.01 0.19 256.2 291 Netherlands
0.71 0.38 0.01 0.00 1.12 7.07 0.3 10 Pakistan
0.11 0.05 0.06 0.1 9 Philippines
0.31 0.49 0.22 0.35 0.4 24 Serbia
0.01 0.30 1.85 0.93 0.03 0.08 0.00 0.02 0.05 2.7 45 Singapore
0.01 0.00 5.17 0.2 6 South Africa
0.07 0.20 1.10 0.05 0.63 0.00 2.97 4.1 79 Spain
0.10 14.45 0.00 0.00 0.0 21 Sweden
585.0 585 Taiwan
0.60 0.82 26.99 0.20 1.27 0.01 17.34 1.7 265 Thailand
0.12 2.13 4.48 15.10 2.68 0.05 39.63 0.15 3.8 288 Turkey
1.54 0.28 0.0 3 Ukraine
0.02 0.33 0.00 0.06 11.15 1.5 37United Arab Emirates
2.72 0.03 9.65 0.00 0.19 0.20 0.0 48 United Kingdom
0.06 117.12 0.00 0.06 1.33 2.8 724 United States
7.60 0.07 0.25 0.4 59 Vietnam
0.58 2.10 0.01 6.66 2.68 1.26 0.38 4.00 0.02 0.00 0.05 0.45 2.19 0.15 1.99 1.39 Others
2 68 28 2 291 175 266 231 15 42 60 5 1 5 23 25 49 244 World
REPORTER
ORIGIN
ICSG 2009 Statistical Yearbook- July 2010
- 67 -

TABLE 20 B - EXPORTS OF REFINED COPPER BY DESTINATION, 2008Thousand metric tonnes, refined copper
Aust
ralia
Arge
ntin
a
Aust
ria
Belg
ium
Braz
il
Cana
da
Chin
a
Colo
mbi
a
Ecua
dor
Egyp
t
Fran
ce
Ger
man
y
Gre
ece
Hong
Kon
g
Indi
a
Indo
nesia
Italy
Japa
n
Kore
an R
ep.
Australia 63.6 8.6 1.0 0.5 22.7 11.4 36.4
Austria 0.1 0.0
Belgium 0.8 0.0 34.5 0.0 0.5 41.1 122.5 1.0 12.6
Brazil 7.6 24.5 22.8
Bulgaria 0.6 6.2 12.6 0.9 33.4 3.3
Canada 0.0 4.9 0.0 41.4
Chile 7.4 14.7 0.3 214.5 721.6 2.6 257.8 47.9 0.2 395.9 57.3 235.6
China 1.9 0.1 0.5 3.8 63.3
Finland 0.0 0.0 63.0 0.0 0.0
France 0.1 2.2 0.3 0.0 0.1 0.0 9.4 0.0 0.0 0.2 2.8 0.0
Germany 0.1 1.5 6.3 0.0 25.9 1.2 24.0 0.0 0.0 0.3 13.9 0.1 0.0
Hong Kong 7.2 0.1 0.0 0.3
India 0.0 0.2 17.4 0.2 0.0 0.0 2.8 6.9 4.0
Indonesia 15.0 1.9 2.6 0.9
Italy 0.0 0.1 0.0 0.6 3.7 1.2 0.0 0.0 0.0 0.0
Japan 219.1 0.0 1.5 0.1 23.8 0.6 31.0
Kazakhstan 123.8 2.0 59.7 6.4
Korean Rep. 69.9 0.4 0.2 10.7 1.6
Mexico 11.5 0.9 0.6 0.2
Mongolia
Netherlands 0.0 0.3 0.0 0.3 25.0 0.0 0.0
Norway 11.6 0.5
Oman 0.2
Peru 44.2 20.1 3.0 4.2 4.3 0.2 85.4 13.7 2.3
Philippines 1.2 15.8 0.2 0.1 10.0 1.2 96.4
Poland 5.7 67.0 3.3 74.2 57.0 5.5 0.0 11.7
Russian Fed. 0.4 29.2
Serbia 0.0 1.9 0.0
Singapore 11.6 1.4 0.9 0.3 0.8 3.5
Slovakia
South Africa 0.8 0.2 0.5 0.1 0.0 2.4 1.0
Spain 0.3 8.2 0.1 0.8 0.0 5.8 1.6 10.2 1.6 0.4
Sweden 0.2 26.2
United Kingdom 0.6 2.3 0.0 0.8 0.0
United States 0.0 0.0 10.0 5.0 0.0 0.0 0.0 0.1 0.1 0.0 0.0 0.0 0.0 0.0
Zambia 13.5 35.7 0.2 0.4 2.9
Others 0.0 3.1 2.8 0.0 0.4 1.5 0.4 4.7 0.0 3.3 0.0 2.5
World 8 15 9 30 259 10 1,467 7 4 59 403 443 43 12 7 66 666 96 483
REPORTER
DESTINATION
ICSG 2009 Statistical Yearbook- July 2010
- 68 -

TABLE 20 B - EXPORTS OF REFINED COPPER BY DESTINATION, 2008Thousand metric tonnes, refined copper
Mal
aysia
Mex
ico
Neth
erla
nds
Rom
ania
Saud
i Ara
bia
Serb
ia
Sing
apor
e
Spai
n
Swed
en
Switz
erla
nd
Taiw
an
Turk
ey
Thai
land
UAE
Unite
d Ki
ngdo
m
Unite
d St
ates
vietn
am
Oth
ers
Wor
ld
44.9 0.1 14.1 93.0 36.6 4.4 20.5 0.4 358 Australia
7.9 8 Austria
20.7 7.7 0.0 0.1 0.7 0.0 7.1 10.9 260 Belgium
34.8 1.1 2.0 0.4 0.0 93 Brazil
2.7 18.7 18.6 0.4 98 Bulgaria
0.2 0.8 0.0 242.3 0.3 290 Canada
7.1 25.4 283.7 11.0 88.8 218.0 30.0 6.1 348.3 6.8 2.2 2,983 Chile
0.2 0.6 1.7 3.0 0.6 14.3 0.1 4.9 0.7 0.6 96 China
0.0 3.9 0.0 0.0 67 Finland
0.0 0.0 0.9 0.0 0.0 0.0 0.7 0.0 0.1 0.2 0.1 0.0 31.7 0.0 6.0 55 France
0.0 0.2 4.3 0.2 0.8 0.0 2.8 5.6 0.2 0.0 0.1 0.4 0.1 8.3 3.8 24.9 125 Germany
0.0 0.1 0.0 0.1 0.0 8 Hong Kong
40.9 0.0 42.4 3.7 0.4 5.6 21.7 18.0 0.0 0.2 1.7 3.4 170 India
62.8 1.0 10.8 42.7 5.5 0.1 143 Indonesia
0.0 0.0 0.2 0.0 0.4 0.0 0.1 0.0 0.0 0.0 0.7 7 Italy
7.9 1.2 102.6 26.6 4.6 3.4 1.1 423 Japan
0.0 0.4 11.8 130.1 9.1 344 Kazakhstan
5.3 5.4 1.2 0.6 20.1 0.4 8.4 3.6 128 Korean Rep.
1.0 0.6 18.0 0.4 33 Mexico
Mongolia
0.1 0.2 0.0 254.8 281 Netherlands
0.1 14.6 8.0 0.0 1.9 37 Norway
0.3 0.2 0.8 0.0 4.6 6 Oman
4.5 21.4 64.8 0.1 117.9 4.3 391 Peru
3.9 0.4 0.2 10.8 31.3 10.0 0.0 182 Philippines
17.6 0.3 0.3 0.3 0.5 1.4 0.7 2.0 0.7 9.0 39.5 297 Poland
50.7 0.5 106.0 10.5 24.2 222 Russian Fed.
0.1 0.7 0.6 3.4 Serbia
13.1 1.0 8.6 1.0 42 Singapore
4.8 1.0 5.8 Slovakia
2.0 1.9 0.0 2.5 0.2 0.6 12 South Africa
0.0 0.2 0.2 12.0 37.0 0.3 78.6 Spain
33.8 9.7 1.7 72 Sweden
0.4 0.4 0.0 0.0 0.0 0.1 4.7 United Kingdom
9.5 0.0 0.0 0.0 0.0 0.0 0.0 0.0 13.4 38 United States
0.3 6.3 4.1 215.4 4.4 2.2 14.4 285.4 585 Zambia
8.4 0.2 0.2 0.3 0.4 0.0 5.0 2.7 1.5 0.0 1.0 0.3 0.2 5.7 Others
195 40 480 8 57 20 35 102 25 331 526 88 197.0 29 256 736 71 World
REPORTER
DESTINATION
ICSG 2009 Statistical Yearbook- July 2010
- 69 -

TABLE 21 A - IMPORTS OF COPPER SCRAP BY ORIGIN 2008Thousand metric tonnes, gross weight metal
Alge
ria
Aust
ralia
Aust
ria
Belg
ium
Bulg
aria
Cana
da
Chile
Chin
a
Croa
tia
Czec
h Re
p.
Denm
ark
Egyp
t
Finl
and
Fran
ce
Geo
rgia
Ger
man
y
Gre
ece
Hong
Kon
g
Hung
ary
indo
nesia
Iran
Isra
el
Italy
Japa
n
Kore
an R
ep.
Kuwa
it
Kyrg
yzst
an
Austria 0.4 0.1 0.1 0.0 0.8 4.3 0.0 0.4 0.0 5.7 60.3 0.0 0.8 0.0 15.7
Belgium 2.5 0.4 0.1 2.7 0.3 0.2 1.4 2.4 0.1 0.9 59.8 36.7 0.0 0.1 0.5 0.2 0.3 3.2 0.2
Brazil 0.1 0.4 0.0
Canada 0.0 0.0 0.0 0.0 0.1
China 0.1 392.5 84.2 3.1 50.4 3.6 0.3 0.4 7.2 0.1 6.3 129.2 0.6 94.3 5.7 271.6 1.1 0.4 0.2 1.2 66.3 2,060 150.4 0.5 4.8
Czech Rep. 0.2 0.0 0.0 1.0 0.2 0.1
Denmark 0.0 0.0 0.1 5.7
Finland 1.1 0.2 0.1
France 11.6 0.1 9.8 0.1 2.0 4.2 10.0 0.1 1.4 0.6 6.8 0.1 0.2
Germany 2.3 0.6 23.8 12.4 1.2 0.2 0.6 4.6 3.7 28.3 31.2 0.3 3.6 51.2 0.0 0.1 0.0 7.8 0.0 0.2 1.4 38.7 0.0 1.2
Hong Kong 2.2 0.9 0.5 2.7 0.7 37.1 0.0 0.3 1.0 0.0 0.6 0.3 12.0 0.0 2.1 0.1 0.5 2.2 5.5 3.0 0.2
India 0.8 0.1 1.2 0.2 1.9 0.3 0.3 0.1 1.3 0.2 0.3 1.4 0.3 9.0 0.6 0.0 0.0 0.0 0.1 0.0 0.2 1.2
Indonesia 0.0 0.0 1.0
Italy 1.0 3.0 1.6 2.3 0.2 0.1 0.4 2.1 0.9 2.1 0.6 0.0 55.5 0.1 27.7 2.2 3.1 0.0 1.4 0.8
Japan 1.4 0.0 0.3 0.5 14.8 0.0 0.3 0.0 0.2 0.1 1.0 1.2 0.2 2.3 2.7 0.5
Korean Rep. 0.1 7.1 0.0 0.2 0.0 1.1 1.8 14.8 0.0 1.2 0.1 2.3 0.5 10.5 0.1 12.4 5.6 0.0 4.0 0.3 12.0 0.9
Malaysia 0.6 0.1 0.2 0.5 0.0 0.5 0.9 0.3 0.4 0.4
Mexico 18.2 0.0 0.0
Netherlands 0.0 0.3 0.8 12.1 0.0 0.0 0.5 0.1 0.1 0.5 0.1 0.1 3.4 0.1 70.7 0.0 0.2 0.4 1.9
Norway 0.1 0.8 4.0
Philippines 0.0 1.0 0.3 0.0 0.0 0.3 0.1
Poland 0.1 0.0 2.4 0.7 3.6 0.3 3.8
Russian Fed.
Singapore 0.1 0.2 0.0 0.2 0.0 0.9 0.0 0.3
Slovakia 3.3 0.5 0.0 4.6 4.0 0.7
Slovenia 1.1 2.8 0.5 0.3 0.2
Spain 1.4 0.1 0.1 0.5 0.0 8.9 8.6 0.1 0.1 0.1 7.1
Sweden 0.0 0.1 0.2 1.4 4.4 2.4 54.5 0.3 0.2 1.0
Switzerland 0.1 1.7 2.2 0.1 0.9
Taiwan
Thailand 0.0 0.0 0.0 0.0 0.3 0.1 0.0 0.0 0.5 0.1 0.1 0.1 0.1
United Arab Emirates 0.0 0.0 0.2 0.0 0.1 0.0 0.4 0.8 0.1 0.0 0.0
United Kingdom 0.1 0.3 0.1 0.7 0.0 0.0 0.0 0.0 1.1 1.3 0.1 0.1 0.1 0.0 0.4 0.1 0.1 0.1
United States 42.3 9.5
Others 1 0 1 1 3 0 0 0 2 0 0 4 0 5 2 0 1 0 0 3 0 0 0 0
World 20 406 34 126 11 102 38 75 10 46 47 5 16 332 3 423 11 287 18 10 2 13 153 2,079 157 5 6
REPORTER
ORIGIN
ICSG 2009 Statistical Yearbook- July 2010
- 70 -

TABLE 21 A - IMPORTS OF COPPER SCRAP BY ORIGIN 2008Thousand metric tonnes, gross weight metal
Mal
aysia
Mex
ico
Mor
occo
Neth
erla
nds
New
Zeal
and
Norw
ay
Peru
Philip
pine
s
Pola
nd
Portu
gal
Rom
ania
Russ
ian
fed.
Saud
i Ara
bia
Sing
apor
e
slova
kia
Slov
enia
Sout
h Af
rica
Spai
n
Swed
en
Switz
erla
nd
Taiw
an
Thai
land
Tuni
siaUn
ited
Arab
Em
irate
s
Unite
d Ki
ngdo
m
Unite
d St
ates
Oth
ers
Wor
ld
0.7 4.9 1.7 0.1 0.5 0.7 0.0 0.4 0.0 11.0 0.0 0.5 0.0 0.8 3.3 1 114 Austria
0.0 0.1 1.1 50.4 0.1 0.2 0.0 0.1 0.0 0.3 0.2 0.6 0.2 0.0 2.5 34.0 2.6 2.8 0.0 2.0 0.4 27.5 3.6 12 253 Belgium
0.3 0.1 0.1 0.1 0.1 3 4 Brazil
0.1 0.0 0.0 0.0 0.0 50.2 1 52 Canada
143.5 6.4 1.9 231.5 5.6 10.1 1.6 83.2 2.3 0.4 8.3 1.5 4.4 0.8 0.2 0.2 5.8 889.3 11.6 0.1 1.4 0.1 0.1 8.4 118.1 632.1 74 5,577 China
0.0 1.5 0.1 5.0 0.1 0.0 0.1 0.0 0 8 Czech Rep.
0.1 0.1 9.2 0.0 1 17 Denmark
0.0 0.0 0.0 0.2 1.3 1.2 0.0 0 4 Finland
0.0 1.4 2.2 0.1 0.3 3.1 0.3 0.0 2.6 2.9 0.7 0.2 13.3 0.1 4 78 France
0.1 0.2 0.7 66.8 2.5 0.3 33.0 2.2 2.9 18.4 0.7 0.9 6.5 2.9 2.1 38.0 15.5 49.7 0.0 0.0 2.7 0.5 55.6 11.3 37 564 Germany
2.7 1.3 0.5 4.8 0.7 0.1 3.7 0.1 0.3 0.1 2.6 1.7 0.1 2.9 1.0 0.1 1.6 1.6 0.3 1.2 13.9 86.1 11 210 Hong Kong
1.8 0.2 0.6 2.7 0.2 0.0 0.2 0.1 0.3 0.0 12.6 0.7 0.5 0.9 2.5 1.7 0.1 0.1 11.9 17.9 22.2 7 103 India
2.9 1.0 0.0 0.0 0.5 0.8 1.0 0.8 0.1 1.4 0 10 Indonesia
0.0 1.2 1.6 5.1 0.3 3.9 0.0 3.4 1.9 5.4 0.1 6.7 10.2 1.6 1.4 7.2 0.1 12 167 Italy
13.1 1.3 0.5 0.5 0.1 21.1 0.0 4.4 16.7 0.7 0.2 0.0 0.0 5.0 17.0 0.0 1.7 1.1 25.2 4 139 Japan
2.3 7.0 1.6 1.9 0.2 0.1 0.1 8.6 0.0 0.0 0.7 5.7 2.9 0.0 0.1 24.4 0.2 1.0 0.4 2.1 1.6 0.1 5.3 15.3 45.9 14 217 Korean Rep.
0.0 0.0 1.8 0.6 0.0 0.1 0.6 0.5 4.5 0.8 0.2 0 13 Malaysia
0.1 9.7 1 29 Mexico
0.3 0.1 0.0 1.4 0.0 0.4 0.9 0.1 0.0 0.0 0.1 0.8 0.9 0.0 0.1 6.5 1.4 12 117 Netherlands
0.6 1.3 3.6 0.8 0.0 0 11 Norway
0.0 0.0 0.0 0.2 0.3 1.4 0.1 0.1 0 4 Philippines
0.9 0.0 3.4 1.5 0.0 0.0 1 18 Poland
4 4 Russian Fed.
0.4 0.2 0.5 0.5 0.0 0.5 0.0 0 4 Singapore
0.0 2.8 0.1 0.0 2.1 0 18 Slovakia
3 8 Slovenia
0.3 4.3 0.0 0.0 0.5 15.7 0.1 0.0 0.2 0.0 0.1 0.0 3.5 0.1 5.4 1.4 5 63 Spain
0.0 3.2 8.5 0.3 0.2 0.0 0.1 0.1 0.1 5.3 2.2 5.1 2 92 Sweden
0.0 0.0 0.2 0.0 0 5 Switzerland
107 107 Taiwan
1.5 0.2 0.0 0.1 0.8 1.3 0.0 0.0 0.4 2.0 1 9 Thailand
0.0 0.4 0.0 0.1 0.0 0.0 0.1 0.2 10 12 United Arab Emirates
0.4 0.5 0.0 0.0 0.0 0.3 0.0 0.1 0.9 0.0 0.0 0.7 0.0 1.2 13 22 United Kingdom
37.6 17 106 United States
0 1 0 0 0 0 0 1 11 4 1 0 4 1 0 7 0 0 0 0 4 2 9 Others
168 58 14 369 8 22 3 118 53 19 35 25 41 25 22 10 40 983 48 85 12 23 13 42 290 914 World
REPORTER
ORIGIN
ICSG 2009 Statistical Yearbook- July 2010
- 71 -
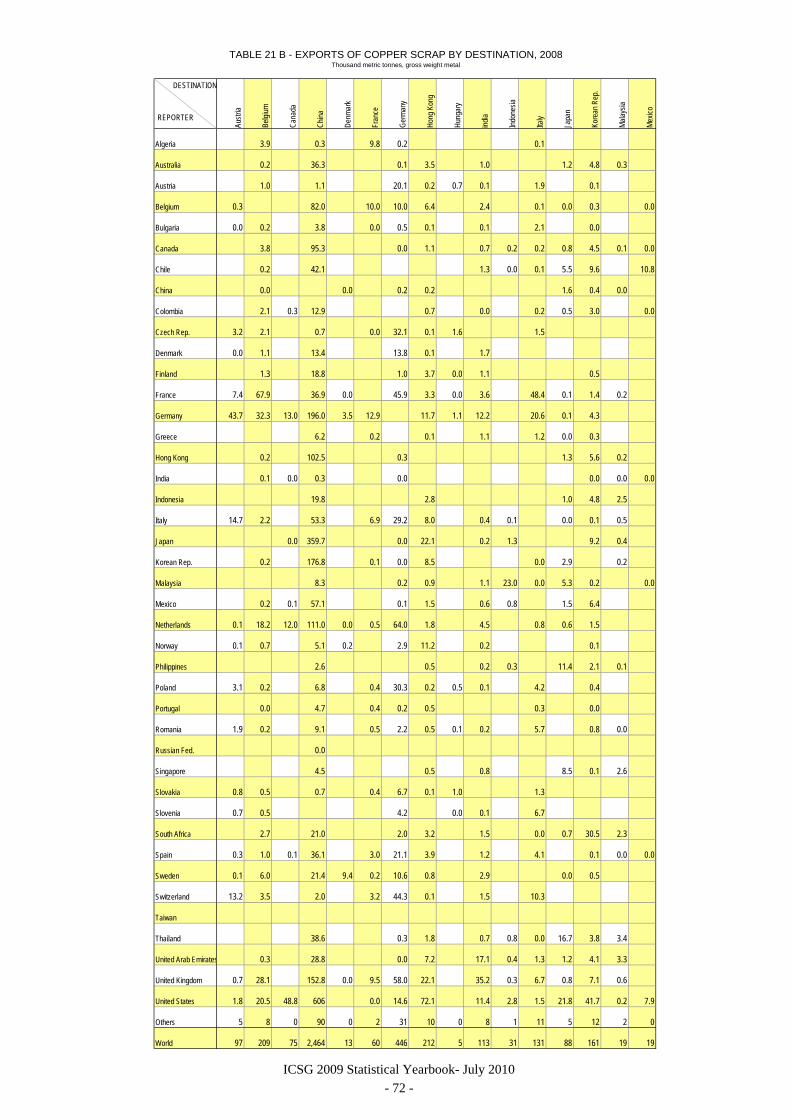
TABLE 21 B - EXPORTS OF COPPER SCRAP BY DESTINATION, 2008Thousand metric tonnes, gross weight metal
Aust
ria
Belg
ium
Cana
da
Chin
a
Denm
ark
Fran
ce
Ger
man
y
Hong
Kon
g
Hung
ary
indi
a
Indo
nesia
Italy
Japa
n
Kore
an R
ep.
Mal
aysia
Mex
ico
Algeria 3.9 0.3 9.8 0.2 0.1
Australia 0.2 36.3 0.1 3.5 1.0 1.2 4.8 0.3
Austria 1.0 1.1 20.1 0.2 0.7 0.1 1.9 0.1
Belgium 0.3 82.0 10.0 10.0 6.4 2.4 0.1 0.0 0.3 0.0
Bulgaria 0.0 0.2 3.8 0.0 0.5 0.1 0.1 2.1 0.0
Canada 3.8 95.3 0.0 1.1 0.7 0.2 0.2 0.8 4.5 0.1 0.0
Chile 0.2 42.1 1.3 0.0 0.1 5.5 9.6 10.8
China 0.0 0.0 0.2 0.2 1.6 0.4 0.0
Colombia 2.1 0.3 12.9 0.7 0.0 0.2 0.5 3.0 0.0
Czech Rep. 3.2 2.1 0.7 0.0 32.1 0.1 1.6 1.5
Denmark 0.0 1.1 13.4 13.8 0.1 1.7
Finland 1.3 18.8 1.0 3.7 0.0 1.1 0.5
France 7.4 67.9 36.9 0.0 45.9 3.3 0.0 3.6 48.4 0.1 1.4 0.2
Germany 43.7 32.3 13.0 196.0 3.5 12.9 11.7 1.1 12.2 20.6 0.1 4.3
Greece 6.2 0.2 0.1 1.1 1.2 0.0 0.3
Hong Kong 0.2 102.5 0.3 1.3 5.6 0.2
India 0.1 0.0 0.3 0.0 0.0 0.0 0.0
Indonesia 19.8 2.8 1.0 4.8 2.5
Italy 14.7 2.2 53.3 6.9 29.2 8.0 0.4 0.1 0.0 0.1 0.5
Japan 0.0 359.7 0.0 22.1 0.2 1.3 9.2 0.4
Korean Rep. 0.2 176.8 0.1 0.0 8.5 0.0 2.9 0.2
Malaysia 8.3 0.2 0.9 1.1 23.0 0.0 5.3 0.2 0.0
Mexico 0.2 0.1 57.1 0.1 1.5 0.6 0.8 1.5 6.4
Netherlands 0.1 18.2 12.0 111.0 0.0 0.5 64.0 1.8 4.5 0.8 0.6 1.5
Norway 0.1 0.7 5.1 0.2 2.9 11.2 0.2 0.1
Philippines 2.6 0.5 0.2 0.3 11.4 2.1 0.1
Poland 3.1 0.2 6.8 0.4 30.3 0.2 0.5 0.1 4.2 0.4
Portugal 0.0 4.7 0.4 0.2 0.5 0.3 0.0
Romania 1.9 0.2 9.1 0.5 2.2 0.5 0.1 0.2 5.7 0.8 0.0
Russian Fed. 0.0
Singapore 4.5 0.5 0.8 8.5 0.1 2.6
Slovakia 0.8 0.5 0.7 0.4 6.7 0.1 1.0 1.3
Slovenia 0.7 0.5 4.2 0.0 0.1 6.7
South Africa 2.7 21.0 2.0 3.2 1.5 0.0 0.7 30.5 2.3
Spain 0.3 1.0 0.1 36.1 3.0 21.1 3.9 1.2 4.1 0.1 0.0 0.0
Sweden 0.1 6.0 21.4 9.4 0.2 10.6 0.8 2.9 0.0 0.5
Switzerland 13.2 3.5 2.0 3.2 44.3 0.1 1.5 10.3
Taiwan
Thailand 38.6 0.3 1.8 0.7 0.8 0.0 16.7 3.8 3.4
United Arab Emirates 0.3 28.8 0.0 7.2 17.1 0.4 1.3 1.2 4.1 3.3
United Kingdom 0.7 28.1 152.8 0.0 9.5 58.0 22.1 35.2 0.3 6.7 0.8 7.1 0.6
United States 1.8 20.5 48.8 606 0.0 14.6 72.1 11.4 2.8 1.5 21.8 41.7 0.2 7.9
Others 5 8 0 90 0 2 31 10 0 8 1 11 5 12 2 0
World 97 209 75 2,464 13 60 446 212 5 113 31 131 88 161 19 19
REPORTER
DESTINATION
ICSG 2009 Statistical Yearbook- July 2010
- 72 -

TABLE 21 B - EXPORTS OF COPPER SCRAP BY DESTINATION, 2008Thousand metric tonnes, gross weight metal
Neth
erla
nds
Norw
ay
Philip
pine
s
Pola
nd
portu
gal
Sing
apor
e
Slov
akia
Spai
n
Swed
en
Switz
erla
nd
Taiw
an
Thai
land
Unite
d Ki
ngdo
m
Unite
d St
ates
Oth
ers
Wor
ld
0.1 0.0 2.9 1 18 Algeria
0.1 0.0 0.7 1.6 0.2 0.0 0 51 Australia
1.8 0.1 0.1 6.1 0.0 0.2 0.0 8 42 Austria
30.9 0.0 8.6 0.0 0.4 0.1 0.8 0.1 1 153 Belgium
0.1 0.0 0.0 0.1 3 11 Bulgaria
0.1 0.2 0.0 0.7 0.0 1.9 0.6 0.0 42.0 0 152 Canada
0.0 0.1 0.0 0.8 0.2 1 72 Chile
0.0 0.1 0.2 0.0 0.4 0.0 0 3 China
0.0 1.3 0.2 0.1 0.0 12.3 2 36 Colombia
1.1 2.7 13.6 0.1 0.1 0.0 0.9 60 Czech Rep.
0.4 0.4 5.2 0 36 Denmark
0.6 4.5 0.0 0.1 0.2 0.1 1 33 Finland
15.3 0.7 0.0 0.3 0.0 15.8 1.3 1.6 0.9 5.4 0.7 6 263 France
83.6 3.7 2.7 2.4 0.1 3.1 5.0 12.3 2.2 1.0 1.5 0.9 0.4 8 479 Germany
0.2 3 12 Greece
0.6 0.3 0.1 4.4 0.4 0.1 0.1 1 116 Hong Kong
0.0 0.1 0.0 0.0 0.3 0.0 0.0 0.0 0 1 India
0.0 4.8 4.6 0.1 0 41 Indonesia
3.2 4.3 0.3 0.0 9.7 8.3 0.8 0.5 3.1 0.0 3 149 Italy
0.2 0.1 1.1 0.8 0.0 0 396 Japan
0.2 0.1 1.7 0.5 0.1 0.0 0.0 0 191 Korean Rep.
0.1 0.1 12.0 0.1 1.7 0.0 0.8 4 58 Malaysia
0.2 0.2 1.9 0.0 1.8 0.0 55.6 1 129 Mexico
0.3 0.8 0.3 2.5 0.0 0.4 6.0 0 225 Netherlands
0.1 1.9 0.0 0 23 Norway
0.9 0.2 0.1 0.0 0 18 Philippines
2.5 9.7 0.0 0.1 0.0 28 87 Poland
0.0 12.0 0.0 0.1 1 19 Portugal
0.1 1.2 0.0 0.8 8 32 Romania
0.1 2 2 Russian Fed.
1.5 0.0 0.0 1 20 Singapore
0.0 3.5 0.1 0.1 6 21 Slovakia
0.0 0.4 0 13 Slovenia
0.3 0.0 0.0 0.7 0.0 14.6 0.2 0.1 3 82 South Africa
1.0 4.6 0.0 0.2 0.4 0.3 4.6 0.3 0 82 Spain
0.6 3.8 0.2 0.0 0.0 4 61 Sweden
4.1 0.0 0.3 0.0 0.0 0 83 Switzerland
130 130 Taiwan
0.1 2.1 3.0 4.4 0.0 0.1 1 76 Thailand
1.4 0.4 0.0 0.7 0.2 0.0 5.2 0.1 0.0 6 77 United Arab Emirates
6.3 0.8 0.0 0.3 0.7 9.4 0.9 0.0 2.9 0.3 2.4 11 357 United Kingdom
4.8 0.0 0.6 0.2 2.4 11.5 1.0 1.0 9.0 2.5 0.4 53 937 United States
6 0 0 3 4 6 2 4 1 0 6 0 13 12 Others
164 10 4 19 11 29 38 83 41 10 64 8 35 127 World
REPORTER
DESTINATION
ICSG 2009 Statistical Yearbook- July 2010
- 73 -

TABLE 22. COPPER ALLOY FOUNDRY PRODUCTIONThousand Metric Tonnes Gross
COUNTRY 1999 2000 2001 2002 2003 2004 2005 2006 2007 2008Argentina 2.9 3.4 3.9 Austria 3.3 3.4 3.2 3.3 3.4 3.3 5.5 2.7 Belarus 1.8 1.6 2.0 1.8 3.0 2.6 Belgium 0.7 0.6 0.5 0.5 0.5 0.5 0.5 1.0 Brazil 15.7 15.3 14.1 13.7 15.8 19.5 19.0 20.3 19.8 19.9Canada 12.0 18.6 18.6 18.6 18.6 17.7China 107.9 119.9 125.0 137.2 157.0 327.6 416.1 470.2 571.3 600.0Croatia 0.7 0.6 0.7 0.6 0.7 0.7 1.1 0.8 0.7 0.5Czech Rep. 2.9 2.0 1.5 1.8 1.5 1.1 1.7 1.8 1.8 2.7Denmark 1.5 1.3 1.1 1.3 1.6 1.3 1.1 0.8 0.8 1.4Finland 4.3 3.8 3.8 3.9 3.8 4.0 4.0 4.3 3.5 4.6France 24.1 25.3 25.9 29.4 28.3 27.2 26.3 25.5 25.4 24.7Germany 84.5 91.2 88.5 90.0 91.3 88.5 84.4 98.1 96.6 94.6Greece 0.4 0.2 0.2 0.2 0.4 0.3 0.3 Hungary 2.9 3.1 2.7 2.3 1.9 2.1 2.1 4.3 1.8 1.4Iran 25.0 27.0 Ireland 0.5 0.4 0.3 0.3 0.2 0.2 0.2 Italy 124.5 123.7 114.5 110.0 106.1 97.8 83.0 92.0 86.7 81.0Japan 82.7 87.1 86.6 86.7 100.6 105.5 97.8 105.9 106.9 98.8Korean Rep. 18.5 19.6 20.8 21.6 22.2 22.9 23.2 23.6 23.9 24.1Mexico 124.8 135.0 80.0 175.0 175.0 180.0 180.0 202.4Netherlands 2.5 2.4 2.8 2.7 2.5 2.4 1.9 Norway 3.0 3.4 3.4 3.5 2.6 2.7 4.7 5.3 5.0 3.3Poland 21.0 20.5 17.2 16.8 6.3 7.4 6.3 7.3 7.0 8.2Portugal 4.0 4.7 6.0 6.6 6.0 7.8 8.7 10.8 11.1 11.4Romania 9.6 9.7 10.0 10.0 10.0 4.1 2.7 3.4 3.8 3.5Russian Fed. 160.0 160.0 200.0 200.0Slovakia 2.2 2.2 2.2 2.2Slovenia 3.4 3.4 3.4 3.5 3.0 6.7 7.8 South Africa 4.0 5.0 14.5 14.9 14.9 3.0 3.0 3.0Spain 13.5 16.1 13.1 13.0 6.3 7.9 7.9 9.1 9.3 9.5Sweden 10.3 10.1 10.6 10.0 10.9 12.0 11.2 11.9 12.5 12.5Switzerland 2.8 2.9 2.5 2.3 2.4 3.0 2.7 3.1 3.1 2.3Taiwan 48.0 50.0 50.0 49.0 46.4 41.8 42.0 40.9 41.2 35.6Thailand 28.6 28.6 28.6 28.6Turkey 0.9 1.3 2.8 2.1 2.8 8.5 16.0 17.5 19.0 16.0Ukraine 8.0 10.0 21.0 11.0 11.0 11.0 11.0 11.0 11.0 11.0United Kingdom 29.6 25.0 25.5 20.5 15.0 15.7 15.0 13.0 13.0 12.0United States 268.5 278.5 255.8 252.2 252.2 285.8 292.1 288.5 283.0 274.9Others 1/ 0.001 0.004 0.005 0.002 0.005 World 1,042.7 1,077.0 1,020.6 1,085.8 1,135.9 1,332.6 1,599.3 1,485.4 1,628.5 1,822.5Source: Country survey, Committee of Associations of European Foundries (CAEF), Duesseldorf Notes: 1/ Others include Egypt, Lithuania
TABLE 23. COPPER ALLOY INGOT PRODUCTION 1/
Thousand Metric Tonnes Gross
COUNTRY 1999 2000 2001 2002 2003 2004 2005 2006 2007 2008Austria 3.2 3.3 2.5 1.8 2.0 2.2 2.5 2.6 2.0 2.0Denmark 0.2 France 12.4 13.3 13.0 12.5 12.3 13.0 11.4 12.5 11.0 9.9Germany 56.1 62.6 63.4 56.1 43.7 44.1 53.6 57.2 53.6 51.4Italy 116.4 116.1 112.0 103.3 96.5 95.0 89.0 91.8 83.4 76.9Japan 83.9 86.4 87.9 86.6 90.0 86.2 85.4 89.7 90.5 94.2Kazakhstan 2.3 1.0 0.8 1.1 1.6 Mexico 61.4 56.9 50.9 52.0 52.8 Netherlands 2.6 2.6 2.4 2.3 2.4 2.4 2.6 2.7 2.1 2.7Poland 24.1 21.5 13.6 14.4 13.4 12.1 11.2 11.3 10.5Portugal 1.9 1.5 3.1 4.5 5.3 6.0 6.7 6.8 7.0 7.4Romania 2.9 3.7 2.7 2.2 Scandinavia 11.5 11.7 10.8 10.2 9.3 9.0 8.7 8.7 6.4 6.3Spain 12.5 14.0 13.8 13.3 15.5 16.8 15.6 16.7 14.1 15.2Switzerland 5.6 1.7 0.0 0.0 0.0 0.0 0.0 0.0 0.0 Turkey 11.4 18.5 17.5 16.6 17.1United Kingdom 38.1 34.0 37.5 34.5 32.5 31.5 27.0 22.8 22.1 23.7United States 144.8 161.1 145.9 123.1 113.2 122.1 122.3 120.4 118.3 119.1World 577.0 587.7 543.8 517.9 495.3 455.8 457.6 460.6 438.4 436.3Source: Country survey, Organisation of European Copper Alloy Ingot Makers (OECAM), DuesseldorfNotes: 1/ Master alloys not included
ICSG 2009 Statistical Yearbook- July 2010
- 74 -

Chart 3, WORLD COPPER BALANCE/PRICE
-300
-150
0
150
300
450
600
750
900
1,050
1,200
1,350
1,500
1,650
1,800
1,950
2,100
2,250
2,400
Jan00
Jul Jan01
Jul Jan02
Jul Jan03
Jul Jan04
Jul Jan05
Jul Jan06
Jul Jan07
Jul Jan08
Jul Jan09
Jul
'000MT
0
500
1,000
1,500
2,000
2,500
3,000
3,500
4,000
4,500
5,000
5,500
6,000
6,500
7,000
7,500
8,000
8,500
9,000
US$/MT
Stocks Exchanges (Total) Other Reported StocksLME Cash, $/mt BalanceWorld Refinery Production World Refined Usage
Series except stocks and prices based on 3-months moving averages
ICSG 2009 Statistical Yearbook- July 2010
- 75 -

Chart 4, WORLD COPPER PRODUCTION
0
100
200
300
400
500
600
700
800
900
1,000
1,100
1,200
1,300
1,400
1,500
1,600
Jan00
Jul Jan01
Jul Jan02
Jul Jan03
Jul Jan04
Jul Jan05
Jul Jan06
Jul Jan07
Jul Jan08
Jul Jan09
Jul
'000MT
0
5
10
15
20
25
30
35
40
45
50
55
60
65
70
75
80%
Total Refined Output
Series based on 3-months moving averages
Concentrate Output
Secondary Refined % of Total
SX-EW output
Primary Refined output excl. SX-EW
ICSG 2009 Statistical Yearbook- July 2010
- 76 -

Chart 5, REGIONAL MINE PRODUCTION
0
50
100
150
200
250
300
350
400
450
500
550
600
650
700
Jan00
Jul Jan01
Jul Jan02
Jul Jan03
Jul Jan04
Jul Jan05
Jul Jan06
Jul Jan07
Jul Jan08
Jul Jan09
Jul
'000MT
Europe Africa Asia
Oceania North & Central America South America
Series based on 3-months moving averages
ICSG 2009 Statistical Yearbook- July 2010
- 77 -

Chart 6, REGIONAL REFINERY PRODUCTION
0
50
100
150
200
250
300
350
400
450
500
550
600
650
700
750
Jan00
Jul Jan01
Jul Jan02
Jul Jan03
Jul Jan04
Jul Jan05
Jul Jan06
Jul Jan07
Jul Jan08
Jul Jan09
Jul
'000MT
Europe Africa Asia
Oceania North & Central America South America
Series based on 3-months moving averages
ICSG 2009 Statistical Yearbook- July 2010
- 78 -

Chart 7, REGIONAL COPPER USAGE
0
50
100
150
200
250
300
350
400
450
500
550
600
650
700
750
800
850
900
950
1,000
1,050
Jan00
Jul Jan01
Jul Jan02
Jul Jan03
Jul Jan04
Jul Jan05
Jul Jan06
Jul Jan07
Jul Jan08
Jul Jan09
Jul
'000MT
Europe Africa Asia
Oceania North & Central America South America
Series based on 3-months moving averages
ICSG 2009 Statistical Yearbook- July 2010
- 79 -

International Copper Study Group Order Form Prices are quoted in Euros. For US dollars payments contact ICSG at [email protected] or
tel: 351-21-351-3870 fax: 351-21-352-4035.
PUBLICATION
Member Country
Non-Member Country
Total
The ICSG monthly publication COPPER BULLETIN o One year’s subscription (13 issues including the Yearbook)
starting ________ 20___ o ___ additional subscriptions per year o Single Issue ______(month) ________ (year)
€500 €335 €100
€750 €540 €150
______€ ______€ ______€
The ICSG STATISTICAL YEARBOOK – 2010 (single issue) €200 €300 ______€
The ICSG DIRECTORY OF COPPER PLANTS AND MINES o One year’s subscription (2 issues) starting ________ 20___ o Single issue
€500 €400
€750 €600
______€ ______€
The 2009 ICSG DIRECTORY OF COPPER AND COPPER ALLOY FABRICATORS (single issue)
€400
€600
______€
Copper Scrap Market and International Trade in Japan (2009) China’s Scrap Usage Survey (2009) Domestic Copper Scrap Generation in China, 2010-2015 (2009) o 10% discount for purchase of TWO Scrap Studies o 20% discount for purchase of THREE Scrap Studies o 20% discount for current ICSG Copper Bulletin subscribers
€400 €400 €400
€600 €600 €600
______€ ______€ ______€ -_____€ -_____€ -_____€
Framework for Analyzing the Impacts of Investment Legislation and Tax Regimes on Global Copper Supply Coming On Stream o 20% discount for current ICSG Copper Bulletin subscribers
€400
€600
______€ -_____€
The CHINESE COPPER SCRAP MARKET (2009) The COPPER SCRAP MARKET IN INDIA (2009) o 20% discount for purchase of both Scrap Studies o 20% discount for current ICSG Copper Bulletin subscribers
€500 €500
€750 €500
______€ ______€ -_____€ -_____€
OTHER:______________________________________________ ______€
TOTAL ORDER ______€
NOTE: ICSG Members refers to orders originating from institutions based in ICSG member countries. ICSG member countries are: Belgium, Chile, China, Finland, France, Germany, Greece, India, Italy, Japan, Luxembourg, Mexico, Netherlands, Peru, Poland, Portugal, Russian Fed., Serbia, Spain, Sweden, and the U.S.A.
Name___________________________________________ Title ______________________________________
Company___________________________________________________________________________________
Address____________________________________________________________________________________
City _______________________ Postal Code_________________ Country___________________________
Tel ___________________ Fax__________________ E-mail______________________________________
Date _______________________________ Signed____________________________________________
METHOD OF PAYMENT ? I enclose a cheque payable to the International Copper Study Group of _____________ Euros addressed to:
International Copper Study Group R. Almirante Barroso, nº 38, 6th Floor
1000-013 Lisbon, Portugal
? Please debit my VISA/Master Card for ________________ Euros
Card number
C.V.V. (Card Value Verification - last three digits of the number on the back of the card) Cardholders Name _______________________________________ Expiry date ____________________ Signature ______________________________________________ Date: ________________________ Cardholders Address _______________________________________________________________________
ICSG 2009 Statistical Yearbook- July 2010
- 80 -
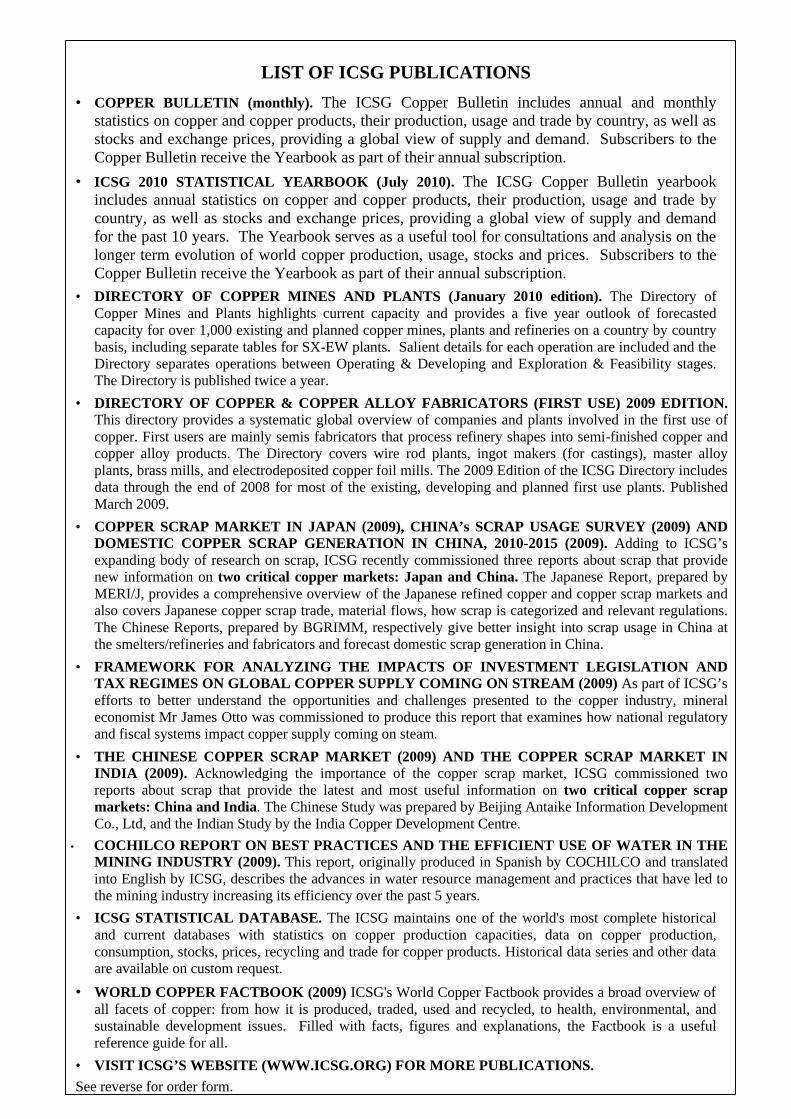
LIST OF ICSG PUBLICATIONS
• COPPER BULLETIN (monthly). The ICSG Copper Bulletin includes annual and monthly statistics on copper and copper products, their production, usage and trade by country, as well as stocks and exchange prices, providing a global view of supply and demand. Subscribers to the Copper Bulletin receive the Yearbook as part of their annual subscription.
• ICSG 2010 STATISTICAL YEARBOOK (July 2010). The ICSG Copper Bulletin yearbook includes annual statistics on copper and copper products, their production, usage and trade by country, as well as stocks and exchange prices, providing a global view of supply and demand for the past 10 years. The Yearbook serves as a useful tool for consultations and analysis on the longer term evolution of world copper production, usage, stocks and prices. Subscribers to the Copper Bulletin receive the Yearbook as part of their annual subscription.
• DIRECTORY OF COPPER MINES AND PLANTS (January 2010 edition). The Directory of Copper Mines and Plants highlights current capacity and provides a five year outlook of forecasted capacity for over 1,000 existing and planned copper mines, plants and refineries on a country by country basis, including separate tables for SX-EW plants. Salient details for each operation are included and the Directory separates operations between Operating & Developing and Exploration & Feasibility stages. The Directory is published twice a year.
• DIRECTORY OF COPPER & COPPER ALLOY FABRICATORS (FIRST USE) 2009 EDITION. This directory provides a systematic global overview of companies and plants involved in the first use of copper. First users are mainly semis fabricators that process refinery shapes into semi-finished copper and copper alloy products. The Directory covers wire rod plants, ingot makers (for castings), master alloy plants, brass mills, and electrodeposited copper foil mills. The 2009 Edition of the ICSG Directory includes data through the end of 2008 for most of the existing, developing and planned first use plants. Published March 2009.
• COPPER SCRAP MARKET IN JAPAN (2009), CHINA’s SCRAP USAGE SURVEY (2009) AND DOMESTIC COPPER SCRAP GENERATION IN CHINA, 2010-2015 (2009). Adding to ICSG’s expanding body of research on scrap, ICSG recently commissioned three reports about scrap that provide new information on two critical copper markets: Japan and China. The Japanese Report, prepared by MERI/J, provides a comprehensive overview of the Japanese refined copper and copper scrap markets and also covers Japanese copper scrap trade, material flows, how scrap is categorized and relevant regulations. The Chinese Reports, prepared by BGRIMM, respectively give better insight into scrap usage in China at the smelters/refineries and fabricators and forecast domestic scrap generation in China.
• FRAMEWORK FOR ANALYZING THE IMPACTS OF INVESTMENT LEGISLATION AND TAX REGIMES ON GLOBAL COPPER SUPPLY COMING ON STREAM (2009) As part of ICSG’s efforts to better understand the opportunities and challenges presented to the copper industry, mineral economist Mr James Otto was commissioned to produce this report that examines how national regulatory and fiscal systems impact copper supply coming on steam.
• THE CHINESE COPPER SCRAP MARKET (2009) AND THE COPPER SCRAP MARKET IN INDIA (2009). Acknowledging the importance of the copper scrap market, ICSG commissioned two reports about scrap that provide the latest and most useful information on two critical copper scrap markets: China and India. The Chinese Study was prepared by Beijing Antaike Information Development Co., Ltd, and the Indian Study by the India Copper Development Centre.
• COCHILCO REPORT ON BEST PRACTICES AND THE EFFICIENT USE OF WATER IN THE MINING INDUSTRY (2009). This report, originally produced in Spanish by COCHILCO and translated into English by ICSG, describes the advances in water resource management and practices that have led to the mining industry increasing its efficiency over the past 5 years.
• ICSG STATISTICAL DATABASE. The ICSG maintains one of the world's most complete historical and current databases with statistics on copper production capacities, data on copper production, consumption, stocks, prices, recycling and trade for copper products. Historical data series and other data are available on custom request.
• WORLD COPPER FACTBOOK (2009) ICSG's World Copper Factbook provides a broad overview of all facets of copper: from how it is produced, traded, used and recycled, to health, environmental, and sustainable development issues. Filled with facts, figures and explanations, the Factbook is a useful reference guide for all.
• VISIT ICSG’S WEBSITE (WWW.ICSG.ORG) FOR MORE PUBLICATIONS.
See reverse for order form.