id-aib oevclopwiats d imhhdhh omhhmn oheee7m
TRANSCRIPT

ID-Aib If ARMY TRAINING OEVCLOPWIATS INST FORT NONRC( VA F/6* 5/9AN EVALUATION OF ALTERNATIVE METHODS OF DEVELOPING THE OASIC TY-ETC(U)MCLASSIFIE D JL 82 6 L WILREASON
7: =,S5PJITDI-Tt-8a-4 LiImhhDhh
omhhMN hhMI0 ohEEE7m
WM3RT TDI-TR-2-4
0
AN EVAL ITIX OF ALTEUTIVE VERB* OF IEVELOPING THE BASIC TYPING OMAW SKILLS
OF ADMINISTRATIVE SPECIALISTS, MOS 7110
FIfNAL WEORT
BY: = L. WIMEMCN, Ed.D.
I JULY 198
Approved for public release:' ~Distributioa unlimited- -
O CT1 3 1982
' APW&AD FOR: US AAmy TA.ining and oetk ine CommandFot Monroe, VA 23651
82 10 1 o 01 7
lowI

r
NOTICES
This report has been reviewed and is approved.
FRANK E. GIUNTI F. A. NERONEChief, Instructional Colonel, InfantryDevelopment Division Director, Training Developments
Institute
(DISCLAIMER
The contents of this report are not to be construed as anofficial Department of the Army position unless so designatedby other authorized documents.
DISPOSITION
Destroy this report when it is no longer needed. Do notreturn it to the originator.
Accssilt2 Fcr
ari 7'.
. .. . .. J
''. - . ----
C00"$ * -r

SECURITY CLASSIFICATION OF THIS PAGE (Ihen Date Entered)REPORT DOCUMENTATION PAGE READ INSTRUCTIONSREPORT__ DOCUMENTATIONPAGE_ BEFORE COMPLETING FORM
I. REPORT NUMBER 2. GOVT ACCESSION NO. 3. RECIPIENT'S CATALOG NUMBER
TDI-TR-82-4 4
4 T title) 5, TYPE FF REPORT & PERIOD COVEREDvAnrvaton of Alternative Methods of Developing Special Report
the Basic Typing Keyboard Skills of Administrative Sep 1980 - Feb 1982Specialists, MOS 71L10 6. PERFORMING ORG. REPORT NUMBER
7. AUTHOR(*) 8. CONTRACT OR GRANT NUMBER()Battelle Columbus Laboratbrie.
Gene L. Wilkerson Delivery Order No. 1696
9. PERFORMING ORGANIZATION NAME AND ADDRESS 10. PROGRAM ELEMENT, PROJECT. TASKBattelle Memorial Institute Columbus Laboratories AREA& WORK UNIT NUMBERS500 Kng AenueScientific Services Program500 King Avenue
Columbus, Ohio 43201
II. CONTROLLING OFFICE NAME AND ADDRESS 22. REPQRT DATEDirector 1 Jul 2US Army Training Developments Institute 13. NUMBER OF PAGES
ATTN: ATTG-DID Ft Monroe, VA 23651
14. MONITORING AGENCY NAME & ADDRESS(II different from ControlUn Office) IS. SECURITY CLASS. (of ths report)CommanderUS Army Soldier Support Center UnclassifiedATTN : ATZI-TD-EA 13a. DECLASSI FICATION/OOWNGRADING
Ft Benjamin Harrison, In 46216 SCHEDULE
16. DISTRIBUTION STATEMENT (of thue Report)
Approved for Public Release. Distribution Unlimited
17. DISTRIBUTION STATEMENT (of the abstract entered in Block 20, if dififetnt from Report)
II. SUPPLEMENTARY NOTES
19. KEY WORDS (Contlnue an reverse aide if necesar'y mid Identity by block number)Typing, Typing Training, Keyboard Skills,71l1 Administrative Specialist,Training, Delivery System, Microprocessor, Standard - Large Group, Standard -Small Group
A1TNRACT (Wm0 - vvoma M 18 I8 N 18041101 MN ty TbF block .,inber)This is the Final Report on a project to operationally test and evaluate methods
of developing the basic keyboard skills of the Administrative Specialist,MOS 71L10, at the Army Training Center (ATC), Ft Jackson, SC. The methodsevaluated in the test include: (1) the standard method with normal size classes(50 students), (2) the standard method with small classes (25 students), (3) th
C TAUT 2000 Trainer, and (4) a microprocessor based system. The project wasimplemented by the Training Developments Institute (TDI), Ft Monroe, VA, inresponse to Soldier Support Center and ATC (Administration School) request.
DO 103 am"ow oFI IMov 65iSOwfTE Unclassified
SCU1VUTY CLASSMFICATION OF THIS pAG1 (b'l Data EniteredI. - _ _ _ _ - ~ -~ -t
AN EVALUATION OF ALTERNATIVE METHODSOF DEVELOPING THE BASIC TYPING KEYBOARD SKILLS
OF ADMINISTRATIVE SPECIALISTS, MOS 711.1
FINAL REPORT
Gene L. Wilkinson, EDD
The U.S. Army Training Developments InstituteFort Monroe, Virginia 23651
C April 30, 1982

Disclaimer
The contents of this report are not to be construed as an official Department
of the Army position unless so designated by other authorized documents.
(

EXECUTIVE SUMMARY
This project was Implemented by the Training Developments Institute(TDI), In response to requests from the Soldier Support Center and the ArmyTraining Center (ATC), Fort Jackson, South Carolina, In order to test andevaluate alternative methods of developing the basic typing keyboard skills ofthe Administrative Specialist, MOS 71010, at the ATC.
Tyning training is given to individual soldiers during AdvancedIndividual Training (AIT) at the Administration School, 4th CST Brigade, ATC,Fort Jackson. The Administrative Specialist training program is not just atyping training program but also includes associated academic skills requiredof an Administrative Specialist. In order to graduate, the student mustcomplete the academic units as well as obtain a minimal typing speed of 25 NetWords Per Minute (NWPI4) over a three-day period. Students who enter the AITwith a typing skill level of 15 NWPH are placed in Advanced classes. Studentswith lower entry typing levels are placed in Basic classes.
The objectives of the test and evaluation were to determine if analternative method of teaching basic keyboard typing skills would (1) enableaverage trainees to reach or exceed minimum graduation typing standards In ashorter period of time and (2) produce Administrative Specialists who have ahigher level of typing proficiency.
Four methods were tested and evaluated. These were: (1) the currentmethod- -platform, classroom instruction In groups of 50 students, referred toas Larqe Group, (2) a variation of the current method- -platform, classroominstruction in groups of 25 students, referred to as Small Group, (3) theTraining Associates Universal Trainer system, which utilizes a modifiedBeseler Cue See and an electronic keyboard console, referred to as TAUT 2000,and (14) the Kee, Inc., microprocesser -based delivery system, referred to asMicro.
The test was conducted from September of 1980 through February of1982. Three cycles of both Basic and Advanced classes were assigned to theLarge Group treatment. Three cycles Of Basic and two cycles of Advancedclasses were assigned to the Small Group treatment. Three cycles of Basicclasses were assigned to the TAUT 2000 and three cycles of both Basic andAdvanced classes were assigned to the Micro treatments. A total of 778students were Included In the final analysis.
The test Was carried out under normal operating procedures at the ATC.It was not a controlled experiment. As a result, a number of problems wereencountered In the test due to the real world nature of the test environment.Students completed the course on a self-paced basis, causing problems due todifferences in the total number of training days and the effects of practiceon typing speed. Problems also arose due to turn over of personnel and toprocurement of the experimental Systems. To the extent possible, the problemshave been delt with In the report.
Entry measures on each student were taken of educational level,reading level, and typing level In order to determine the equivalancy of thedifferent groups under each of the treatments. Analysis demonstrated that
there was no Statistically significant differences, except that the advanced 0
- -- ---- - --- A

* students under the Micro treatment scored nirnificantly higher on entrytyping, causing difficulties with interpretation of results for the Advanced
Outcome measures were taken which were related to four broadareas--effectiveness, efficiency, acceptance, and cost. In regard to measuresof effectiveness, End-of-Course test scores indicate that the Small Grouptreatment is better than either of the two electronic-based systems, but it isnot better than the Large Group treatment for the basic students. Oncedifferences in entry levels are accounted for, there is no difference betweenthe groups at the advanced level. On measures of efficiency, once differencesin training time are allowed for, there is no difference between the groups.There is a slight gain in training time from reduction of class size, but thecost savings from reduced student time in training would be more than offsetby the increase in costs for instructurs and facilities. On measures of cost,both of the electronic systems represent added cost since they are in additionto, and do not represent a displacement of, the cost of the current system.On measures of acceptance, the instructors were negative toward the newsystems, but the strongly positive responses of the students would more thancounter such reactions.
On the basis of the evidence presented, it is possible to make thestatement that each of the systems examined is capable of developing the basickeyboard typing skills of the students. However, it is not possible to saythat any one system Is the "better" system In all cases. Sin- the currentsystem of typing instruction appears to be working as well as any of thealternatives evaluated, the recoummendation of the report is that none of theexperimental treatments be adopted for wide use at the Administration School,Fort 3ackson, at this time, and that the current system of typing training bemaintained.
The recommendL-ion from 'ohis evaluation does not preclude furtherexperimentation or testing of electronic-based delivery systems for use inkeyboard training. The recommendation is for the present time only, and isbased on the specific systems examined in this test. It may well be thatother systems, employing the same, or variations of the tested, deliveryformats might well produce a different conclusion.
V44
o._, ...., ... . .. .= I IIl .. -.d m i
• , -_ I=,•I

CONTENTS
Chapter Page
1. INTRODUCTION. .. .... ........ ....... ......
Background. .. .... ....... ........ .....
Purpose .. .. .... ....... ........ ....... 2
Evaluation Design. .. .. ...... ........ ...... 2
Population Description and Treatment. .. .... ........ 3
2. DISCUSSION. .. .... ....... ........ ........ 7
Conduct of Test. .. .. ...... ........ ....... 7
Findings .. .. ....... ........ .... ....... 9
Measures of Effectiveness .. .. ....... ....... 9
Measures of Efficiency .. .. .... ....... .... I]
Rate of Skill Acquisition .... .. ...... .... ... 4
Effect of Reading Level. .. ..... ....... ... 19
Measures of Cost and Reliability. .. .. ...... ... 20)
Measures of Acceptance. .. .. .......... .. .. ....22
3. CONCLUSIONS AND RECOMMENDATIONS .. .. .... ....... .... 25
APPENDICES
Student Data Form .. .. ... ....... ........ ...... A-1
Student Opinion Form .. .. ...... ........ ........ A-2
Instructor/Staff Interview Schedule. .. .. ...... ........ 3
ANOVA Tables. .. .... ....... ........ ........ A-5
IV

!. INTRODUCTION
This is the final report on a project to operationally test andevaluate methods of developing the basic typing keyboard skills of theAdministrative Specialist, MOS 71L10, at the Army Training Center (ATC), FortJackson, South Carolina. The methods evaluated in the test include: (1) thestandard method with normal size classes (50 students), (2) the standardmethod with small classes (25 students), (3) the TAUT 2000 trainer, and (4) amicroprocessor based system. The project was implemented by the TrainingDevelopments Institute (TDI), Fort Monroe, Virginia, in response to SoldierSupport Center and ATC (Administration School) request.
Background
Typing training is given to Individual soldiers during AdvancedIndividual Training (AIT) for Military Occupational Specialty (MOS) 71L10,Administrative Specialist, at the Administration School, 4th CST Brigade, ATC,Fort Jackson. The Administrative Specialist training program is not just atyping training program but also Includes associated academic skills requiredof an MOS 71L10 Administrative Specialist. In order to graduate, the studentmust complete the academic units as well as obtain a minimal typing speed of25 Net Words Per Minute (NWP) over a three-day period.
At present, incoming students are given a typing test on the firstday. Those scoring 0-15 NWPM are placed on a first come, first served basis,
( in a Basic Class. As soon as 50 students arrive, fundamental keyboardtraining begins. Keyboard training, practice, and timed writing exercises areconducted for three hours during the mornings of the training period. Work onthe academic modules is undertaken in the afternoon. Initially, basicstudents complete academic module assignments in longhand. When studentsreach 15 NWPM on timed typing exercises, all assignments must be typed.Academic modules are self-paced. As soon as the modules are satisfaitorilycompleted, and the required 25 NWPM for three days is attained, the studentpasses on to End-of-Course Testing and graduation.
If Incoming students score over 15 NWPM on the entry typing test, theyare placed on a first come, first served basis in an Advanced Class. Herethey are given self-paced modules containing the academic portion of thetraining and one hour of timed writings in the afternoon. As soon as themodules are satisfactorily completed and the required 25 NWPM for three daysis attained, the student passes on to End-of-Course Testing and graduation.
Evaluation of the alternative instructional strategies were conductedseparately for both the Basic and Advanced classes. The methods ofinstruction evaluated during the test were:
1. The current method: platform, classroom Instruction In groups of 50students (referred to In this report as either Standard--Large Group orControl).
( 2. A variation of the current method: platform, classroom instruction, ingroups of 25 students (referred to as Standard--Small Group).
- 1-

3. The Training Associates Universal Trainer (TAUT 2000) system, whichutilizes a modified Beseler Cue See and an electronic keyboard console,provides an Instant feedback instructional program, In classes of 50 students(referred to as TAUT 2000).
4. The Kee, Inc., microprocesser based delivery system, which also providesinstant feedback during instruction and simultaneous scoring of typing testsby means of a microprocessor, In classes of 50 students (referred to as
At the recommendation of the manufacturer's representative, the TAUT 2000system was not employed with the Advanced Classes because of the relativelyslow response time of the equipment. Although It Is Intended as a primarykeyboard instruction system, the Micro system was employed with the AdvancedClasses because it was felt that practice on the system might lead to greateraccuracy in production typing.
Purpose
This operational test and evaluation was undertaken in order todetermine if an alternative method of teaching basic keyboard typing skillswould:
1. Enable average AIT trainees to reach or exceed minimum graduation typingstandards In a shorter period of time.
2. Produce Administrative Specialists who have a higher level of typing
In order to achieve the general purposes of the test and evaluation, a numberof specific questions were asked in regard to such measures as days to reach25 Net Words Per Minute (NWPM), days from 15 to 25 NWPM, rate of skillacquisition, etc. These questions have been grouped under such headings asmeasures of effectiveness, measures of efficiency, etc., and are discussed indetail In the findings section.
This project is important to the Army because 71LI0 Is a high densityMOS, with 23,000 personnel in Skill Levels 1-5. Greater typing trainingeffectiveness means substantial time and money to the Army.
Evaluationi Design
The evaluation plan Was designed to retain simplicity and clarity ofprocedure In Implementation, data collection, and evaluation, so that the testmight be conducted with a minimum of disturbance of normal routines of theAIC. A test monitor and data collector was assigned to the project to work atFort Jackson. In addition to monitoring the test, the data collector wasresponsible for gathering student entry, progress, and completion data ascalled for on the Student Data Form, Form A at Appendix A-i and A-2. Theevaluator was responsible for the collection of instructor opinion data as)
-2-77 7

I
called for on the Instructor/Staff Interview Schedule, Form B at Appendix A-3and A-4.
Class Formats--Basic Students
The basic student schedule, for all treatments, was as follows:
Day 1 ........ all students begin keyboard trainingDay 1-3 ...... students may pass to Advanced trainingDay 1-10 ..... keyboard instructionDay 11-35+...practice and timed writings
When students attained 15 NWPM, they began production typing. When all
academic modules were completed and 25 NWPM for three days had been achieved,they proceeded to End-of-Course testing. Three cycles of Basic Classes were
completed for each of the treatment formats presented in Table 1 on thefollowing page.
Class Formats--Advanced Students
The advanced student schedule, for all treatments, was as follows:
Day 1...all students begin academic, self-paced modules
Day 1.. .all students begin one hour of timed writings each day
This schedule was maintained until students satisfactorily completedall academic modules and attained a speed of 25 NWPM for three days. At thattime, students proceeded to End-or-Course Testing and graduation. The amountof time spent on typing practice and timed writings for students under theMicro treatment had to be increased to one and a half hours (half on Micro,half on standard keyboard) to allow time for classroom housekeeping details as
well as practice and timed writing. Three cycles of Advanced Classes were
completed on the Standard--Large Group and the Micro treatments presented inTable 2 on page 5. Two cycles were completed on the Standard--Small Grouptreatment.
Population Description and Treatment
Basic Students
Three cycles of classes were assigned on a first come, first served
basis to the Standard--Large Group treatment. Of the 150 subjects assigned,21 were dropped from the analysis because they were either transferred to an
Advanced Class, recalled to their unit, AWOL, etc., leaving 129 subjects inthe Standard--Large Group treatment. Four cycles of the Standard--Small Grouptreatment were completed, with 92 of the original 100 subjects left in theanalysis. Four cycles of the TAUT 2000 treatment were completed. However,the first cycle had to be discarded due to start-up problems with the system.O 127 of the assigned 150 subjects who were in the final three cycles were leftin the final analysis. Three cycles of the Micro treatment were completed,with 122 subjects left in the analysis.
-3-

Table 1. Treatment Formats for Basic Students
Method/Treatment Format
Standard--Large Group 50 students50 standard typewriters
Method: platform instructionstandard (manual) typing practice
Instructors: I typing instructor (3 hours)I academic instructor (Of hours)
Standard--Small Group 25 students25 standard typewriters
Method: platform instructionstandard (manual) typing practice
Instructors: I typing Instructor (3 hours)I academic instructor (4 hours)
TAUT 2000 50 students50 standard typewriters25 TAUT trainers (in separate room)
Method: one-half of class (25) trains on thedevices for approximately 1 hour;practices on manual typewriters for2 hours
Instructors: 1 typing instructor (in dlass)1 typing Instructor (with TAUT)I academic instructor (4 hours)
Microprocessor 50 students50 standard typewriters50 microprocessors (in separate room)
Method: one-half of class (25) trains on thedevices for approximately Ij hours;practices on manual typewriters forIj hours
Instructors: I typing Instructor (in class)I typing Instructor (with Micro)
1 academic instructor (4 hours)
40

Table 2. Treatment Formats for Advanced Students
Method/Treatment Format
Standard--Large Group 50 students50 standard typewritersMethod: self-paced academic modules
I hour manual practice per day
Instructors: 1 typing instructor (2 hours)I academic instructor (5j hours)
Standard--Small Group 25 students25 standard typewriters
Method: self-paced academic modulesI hour manual practice per day
Instructors: I typing instructor (2 hours)1 academic instructor (5j hours)
Microprocessor 50 students50 standard typewriters25 microprocessors (in separate room)
Method: one-half of class (25) trains on thedevices for approximately 45 minutes oftyping period; on manual typewriters forremaining 45 minutes.
Instructors: I typing instructor (with Micro)I academic instructor (in class)
In order to determine the equivalence of the four groups of students,entry level measures were obtained for educational level in grades completed,reading level in grade equivalents, and entry level typing skill in net wordsper minute. The mean values for each of the groups is presented in Table 3 onthe following page. Analysis of variance procedures were employed in order todetermine I.f the obtained differences between the four groups werestatistically significant. The probability of statistical difference islisted for each of the entry level factors in the right-hand column of Table3. The analysis of variance tables are presented in Tables Al, A2, and A3 atAppendix A-5. A probability level of .05, or less, was set in the test planas the level at which the differences between the groups would be consideredstatistically greater than the differences within the groups. On this basis,it was determined that the four groups were not statistically different.
(-5

Table 3. Comparison of Mean Entry Level Variablesfor Basic Students
Large Group Small Group TAUT 2000 Micro
Entry Variables n Mean n Mean n Mean n Mean p
Educational level 129 11.98 92 11.75 127 11.75 120 11.93 'C.4338(grade)
Reading level 120 9.04 87 9.70 125 9.44 96 9.24 <.1334(grade)
Typing level 129 6.95 92 6.65 126 7.19 121 7.93 '.0917(NWPM)
Advanced Students
Three cycles of Advanced Classes were assigned on a first come, firstserved basis to the Standard--Large Group treatment. Of the 146 subjectsassigned, four were dropped from this analysis for reasons similar to thosestated above for basic student drops. Only two cycles of classes wereassigned to the Standard--Small Group treatment. Of the 50 subjects assigned,49 are included in this analysis. The relatively small sample size, incomparison to the other two treatments, causes reservations concerning anyconclusions that might be drawn from the evaluation in regard to advancedstudents. Three cycles of the Micro treatment were completed, with 125 of theassigned 135 subjects included In this analysis.
Entry level measures of educational level, reading level, and entrytyping skill were also taken for advanced students In order to determine the
equivalency of the three treatment groups. The mean values obtained for eachof the groups are presented in Table 4 on the following page. The probabilityof a significant difference between the three groups is presented in theright-hand column. The analysis of variance tables from which theprobabilities were obtained are presented In Tables A4, AS, and A6 at AppendixA-6. The groups were found to be statistically different on two of the entryvariables--educational level and entry level typing. Multiple range tests,applied to the differences between the groups, determined that thesignificance on educational level was caused by the gap between theStandard--Large Group and Standard--Small Group subjects. The Micro subjectswere not significantly different from either of the other two groups oneducational level. On entry level typing, the significance was caused by anapproximate 8 NWPM gap between the Micro group and the other two groups. TheStandard--Large Group and Standard--Small Groups were not significantlydifferent. This obvious, as well as statistically significant, differencecauses problems with Interpretation of the results of this evaluation andrdlses doubts as to the conclusions which can be drawn from the test in regardto the Advanced Classes.
-6-

Table 4. Comparison of Mean Entry Level Variablesfor Advanced Students
Large Group Small Group Micro
Entry Variables n Mean n Mean n Mean p
Educational level 140 12.05 49 12.45 121 12.29 <.0403*(grade)
Reading level 92 9.91 44 10.43 82 9.92 1.2876(grade)
Typing level 142 21.65 32 20.00 125 28.39 (.0000*
*statistically significant
2. DISCUSSION
Conduct of Test
The f ield test was conducted f rom September of 1980 through FebruaryIof 1982. The first cycles of basic and advanced students in theStandard--Large Group treatments were initiated in September of 1980. Thefirst of the TAUT 2000 classes was initiated in October 1980. The data fromthis first class had to be discarded due to problems with the Super Sun filmcourseware. This caused a fourth cycle of the TAUT 2000 classes which was notcompleted until July of 1981. The first cycle of the Micro treatment classeswas initiated in June of 1981 and the final cycle of advanced students in theMicro treatment classes was initiated in October of 1981. All classes hadcompleted basic instruction prior to December of 1981. However, because ofthe self-paced nature of the academic modules, the final student data sheetswere not completed until February of 1982.
The test exhibited a number of problems due to the long time periodand to the "real world" nature of the test environment. There was a high rateof change in personnel assigned to the test. For example, three differentData Collectors worked on the evaluation. Problems with procurement anddelivery of the microprocessor system delayed the start of the Micro classesand caused an extension of the original time-line for the evaluation. Changesfrom self-paced to group-paced Instruction during the time period of the testhad a greater impact on the Micro treatment than on the other treatmentsbecause of the delay in starting the Micro Classes. These problems are a partof the cost of doing an evaluation in a field setting rather than in acontrolled, laboratory environment; however, they need to be watched for, andif possible prevented, In any further field evaluations.
C wasAs the data was received from the Data Collector at Fort Jackson, itwschecked for accuracy against copies of the student's AIT Training Record
-7-

(Typing) and any necessary corrections made on the Student Data Form. Thenthe data was coded for entry into the computer and data entry cards werepunched. The data was summarized and analyzed with the SPSS analysis packageto determine the nature as well as the degree of significance of anydifferences which were Identified. Data on instructor acceptance of the TAUT2000 and Micro systems was obtained by the Evaluator by means of personalinterviews at Fort Jackson. Data on equipment reliability was obtained fromequipment logs maintained by the instructors at Fort Jackson. Data on systemcosts were obtained from the Director, Administration School, Fort Jackson forthe Standard treatments; from Training Associates, Standardsville, Virginia,for the TAUT 2000 system; and from Kee, Inc., Seminole, Florida, for the Microsystem.
To help determine the equivalancy of treatments between the four basictreatments and three advanced treatments, the average number of days absentwas determined for each of the treatments at the different levels. The meannumber of days absent for each is presented in Table 5 below. Analysis ofvariance, shown in the right-hand column, indicates that the differences weresignificant for the basic students but not for the advanced students (seeANOVA Tables A7 and A8 at Appendix A-7). Multiple range tests Indicate thatthe significance was caused by the Micro students having a significantlylarger number of days absent than the other treatments. This might beconsidered a reflection of attitude or motivation due to the treatment;however, it appears to have been caused by both a longer period of trainingand a few students who were AWOL for several days prior to being dropped fromthe course.
Table 5. Comparison of Mean Days Absent
Student Level Large Group Small Group TAUT 2000 Micro p
Basic 6.26 5.83 5.65 8.22 (.0009*
Advanced 4.75 4.31 NA 5.13 <.3917
*statistically significan
Numerous problems were encountered in the collection of the data dueto the self-paced nature of the MOS 711_10 course which produced staggeredgraduation dates and, therefore, a number of missing data entries,particularily in the later days of the training period. These problems willbe covered in more detail under the discussion of findings.
-8-

Findings
Because of the operational nature of this test and evaluation, thefindings of the evaluation present a mixed picture and, depending on theW eight placed on the various measures, a variety of conclusions can be derivedfrom the results. The measures obtained from the evaluation can be placed infour major categories- -measures of effectiveness, measures of efficiency,measures of acceptance, and measures of cost--and will be discussed in detailunder each of these headings.
Measures of Effectiveness
Effectiveness measures are those measures which relate to the overalllevels of skill developed by students. Measures which relate to effectivenessthat were obtained during the evaluation Include High Score Obtained (thehighest score on timed writing tests achieved by each student during any pointof the training period), End-of-Course Test Score, and Graduation Rate (thepercent of students reaching graduation, dropped for typing, etc., for each ofthe four treatments) for both the basic and advanced students.
The mean High Score In t4WPI obtained by both basic and advancedstudents under each of the treatments examined in the evaluation is presentedin Table 6 below. Analysis of variance, results are presented in Tables A9and A10 at Appendix A-7 and A-8, determined that there was no statisticaldifference between the four treatments for the basic students. There was a( highly significant difference for the advanced students, with multiple rangetests showing that the Micro treatment was significantly higher than eitherLarge Group or Small Group treatments. There was no difference Statisticallybetween either of the Standard treatments. The difference between theadvanced treatment groups is approximately the same as, and Is probably dueto, the initial difference between the groups at entry into training.
Table 6. Comparison of Mean High Score In NWPM
Student Level Large Group Small Group TAUT 2000 Micro p
Basic 28.60 27.83 28.89 27.78 4.5831
Advanced 37.48 34.92 NA 42 26 <C.0000*
*statistically significant
The mean End-of-Course Test scores in NWP4 for both the basic and theadvanced students under each of the treatments examined in the evaluation Ispresented in Table 7 on the following page. Analysis of variance, presentedin Tables All and A12 at Appendix A-8, indicates that the differences betweenthe groups are statistically significant for both the basic and advancedstudents. Multiple range tests indicate that the significance on the basic
-9-

students is due to the difference between the Small Group and both the TAUT2000 and Micro treatments--the Small Group score being significantly lower.There Is no difference statistically between the Large Group score and thescores of any of the other treatments. The lower score for the Small Groupappears to be due to the fact that students spent considerably less time (26.5days) in the course under the Small Group treatment than did either the TAUT2000 (32.3 days) or the Micro (30.6 days) students. For the Advancedstudents, multiple range tests indicate that the significance Is caused by thehigher score for students in the Micro treatment. There Is no significantdifference between Large and Small Group students. The gap appears to be dueto two factors- -the initial gap between the groups at the point of entry(approximately 8 NWP4) and the longer period in training (23.2 days as opposedto 16.1 and 16.7 days). In fact, the gap between the Micro and other groupsis less on the End-of-Course test than it was at entry.
Table 7. Comparison of Mean End-of-Course Test Scores In NWPM
Student Level Large Group Small Group TAUT 2000 Micro p
Basic 29.31 28.39 30.08 29.60 '.0327*
Advanced 34..12 32.29 NA 38.99 -..000*
*statistical y significan
An analysis of the reasons for basic students leaving the course ispresented in Table 8 on the following page. Students who left the course fornon-academic reasons, recalled to unit, discharged, etc., were not included Inthe population for the test. An application of Chi Square frequency analysistechniques Indicates that the differences between the treatments aresignificant at the <.04191 level of probability. The statistical significanceappears to be due to (1) the high percentage of students graduating under theSmall Group treatment, (2) the higher than expected number of academic dropsunder the Micro treatment, and (3) the low number of academic drops combinedwith a higher than expected number of combined academic/typing drops under theLarge Group treatment. No evidence was gathered to address the reasons foracademic drops.
A comparison of the mean NWP4 achieved by students at the time theywere dropped from the course due to either typing or a combination of academicand typing performance and of the mean number of days completed by suchstudents Is presented in Table 9 on the following page. The considerablylonger period of time that students were allowed to remain in the course underthe Micro treatment before they were dropped due to poor typing may have beenresponsible for the poor performance of the Micro students In the Rate ofSkill Attainment comparison which Is discussed at a later point in this
report.
-10-

Table 8. Comparison of Course Completions and Attritionfor Basic Students
Large Group Small Group TAUT 2000 Micro
Completion/Attrition n % n % n % n
Graduation 81 62.8 68 73.9 76 60.4 75 61.5
DROP: Academic 8 6.2 8 8.8 17 13.5 18 14.8
DROP: Academic/Typing 21 16.3 5 5.4 11 8.7 9 7.4
DROP: Typing 6 4.6 7 7.6 9 7.1 12 9.8
DROP: Attitude/ 13 10.1 4 4.3 13 10.3 8 6.5Motivation
TOTAL 129 100.0 92 100.0 126 100.0 122 100.0
Table 9. Comparison of NWPM and Training Days for Typing Dropsof Basic Students
Large Group Small Group TAUT 2000 Micro
n NWPM Days n NWPM Days n NWPM Days n NWPM Days
26 16.8 26.85 7 16.0 28.14 25 13.8 27.12 21 17.5 34.38
The graduation rate for the advanced students is presented in Table 10on the following page. The differences between the three advanced groups werealso found to be statistically significant at the <.0405 level of probabilitythrough the use of Chi Square analysis. In the case of the advanced students,the significance appears to be due to the number of academic drops under theMicro treatment compared to the other treatments.
Measures of Efficiency
Efficiency measures are those measures which relate to the speed atwhich different levels of skill are obtained. Measures which relate to theefficiency of the different methods being evaluated In this report include,for the basic students, Days to Reach 15 NWP, Days to Reach 25 NWPM, Days toMove from 15 to 25 NWPM, Day of High Score, and Total Training Days, as wellas Rate of Skill Acquisition which Is treated In this report as a separateItem and will be discussed in the following section. The same measures, withthe addition of Days to Move from 15 to 35 NWPM and Days to Move from 15 to 45NWPM, were taken for the advanced students.
- 11 -
. _ l ll l I i i - I I I '

Table 10. Comparison of Course Completions and Attritionfor Advanced Students
Large Group Small Group MicroCompletion/Attrition n n In
Graduation 134 95.7 46 93.9 115 92.0
DROP: Academic 5 3.6 1 2.0 10 8.0
DROP: Attitute/Motivation 1 .7 2 4.1 0 .0
TOTAL 140 100.0 49 100.0 125 i00.0
The mean values for efficiency measures obtained for basic studentsunder each of the four treatments evaluated in the test are presented in Table11 below. Only two of the measures were found to be statistically differentwhen analysis of variance techniques were applied--Day of High Score and TotalTraining Days. The probabilities obtained from the analysis of variance,taken from Tables A13 through A17 at Appendix A-9 and A-10, are listed in theright-hand column. The two statistically significant differences appear to beInterrelated. Typing speed is largely a factor of practice after the basickeyboard has been mastered. The longer the student practices, the higher theNWP obtained. Since students spent significantly less time in training, as )
Table 11. Comparison of Mean Efficiency Measuresfor Basic Students
Large Group Small Group TAUT 2000 Micro
Measure n Mean n Mean n Mean n Mean p
Days to Reach15 NWPM 124 8.72 82 9.85 113 8.95 115 10.13 .1736
Days to Reach25 NWPM 105 18.27 73 19.13 96 17.85 91 20.34 .3834
Days from 15to 25 NWPM 105 9.88 73 9.49 96 9.32 91 11.01 .5093
Day of HighScore 129 24.67 89 23.56 127 27.56 122 26.85 .0158*
Total TrainingDays 129 29,51 88 26.45 127 32.31 122 30.55 .0006*
*statistically significant
- 12 -
mmI

determined by multiple range tests, under the Small Group treatment than underany of the other three treatments (there was no statistical difference betweenthe Large Group, TAUT 2000, and Micro treatments on total training days) the
4,d ate of their high score would come earlier in the training period. This wasfound to be the case, the signiificant difference on Day of High Score beingprimarily due to the gap between the Small Group and TAUT 2000 treatments.
* The findings in regard to total training days might have implications for theorganization of the 71LI0 course, since students seem to complete the course
* more rapidly if they are organized in smaller sections. However, there is noway to determine if this is a factor of the self-paced academic modules or ofkeyboard training.
The mean values for efficiency measures obtained for the dtdvancedstudents under each of the three treatments evaluated in the test arepresented in Table 12 below. As can be seen in the right-hand column, anumber of the differences between the groups were found to be statisticallysignificant through the use of analysis of variance techniques (see Tables A18through A24 at Appendix A-10 to A-12). The Statistical significance on Daysto Reach 25 NNWPM and Days from 15 to 25 NWPM reflects the entry level typingskills of the students under the Micro treatment rather than any inherentcharacteristics of the Micro system. When entry level scores have a meanvalue of 28.39 NWPM, it would be surprising if they did not scoresignificantly better than the other groups on measures dealing with 25 NWP4.The other statistically significant differences, Day of High Score and TotalTraining Days, also seem to reflect something other than characteristics ofthe training systems being evaluated. As with the basic students, the date ofthe high score reflects practice time. If more time is spent in practice, ahigher score will be obtained at a later point in the training period. Sincethe Micro students, due to group-pacing, put in approximately seven more days
Table 12. Comparison of Mean Efficiency Measuresfor Advanced Students
Large Group Small Group Micro
Measure n Mean n Mean n Mean p
Days to Reach 15 NWPM 142 1.08 49 1.14 125 1.09 .6003
Days to Re.±ch 25 NWPMI 140 3.19 49 4.67 124 2.31 .0002*
Days from 15 to 25 NWPM 140 2.11 49 3.52 124 1.23 .0002*
Days from 15 to 35 NWPM 85 5.85 24 6.13 99 5.94 .9813
Days from 15 to 45 NWPM 24 6.62 4 7.25 44 7.20 .9430
Day of High Score 141 12.48 49 12.94 125 17.09 .0000*
Total Training Days 141 16.09 49 15.69 125 23.19 .0000*
*statistically significant
13-__F

In training, their Day of High Score was significantly later. The TotalTraining Days appears to be due to the fact that students were held in theclass longer after they had reached graduation typing levels than In the othertwo treatments, reflecting a change from self-paced to group-paced instructionwithin the 71110 course.
Rate of Skill Acquisition
The self -paced nature of the AIT produced a major problem in thecomparison of the rates of skill acquisition for the various treatments Underconsideration in the test. AS students completed and graduated from thecourse, empty data cells were created in the analysis. For example, theaverage NWPM on training day 40 would be based on 27.7 percent of the TAUT2000 students while only 6.46 percent of the Small Group students would beleft to form the average for the Small Group treatment (see Table 13 on thefollowing page). Learning curves derived from such averages would not reflectthe effects of the training methods as much as it would reflect the differentrates of student attrition under the various treatments. For example, apreliminary analysis (see Figure Al at Appendix A-13) showed little or no gainIn NO"H for students In the Small Group treatment between the 30th and 40thdays Of the training, in spite of 10 additional days of practice, while theother treatments showed a steady gain of skill acquisition over the sametraining period. An examination of the attrition rates for the varioustreatments indicated that the problem was due to the fact that students werereaching graduation sooner under the Small Group treatment and therefore thehigher student scores were being removed from the averages.
In order to compare the treatments, It was necessary to develop amethod of compensation for missing data. This was done by determining theaverage gain from one test date to the following test date for all studentsunder each of the treatments who were tested on both dates. This gain scorewas determined separately for each of the four basic student treatments andeach of the three advanced student treatments. The appropriate gain score wasthen added to the preceding test score to determine a predicted test score foreach case Of Missing data. The adjusted mean NWP4 derived by means of thisprocedure for basic students under each of the four treatments is presented InTable 13. Analysis Of variance techniques were applied to the adjusted scoresto determine if the differences between the groups were greater than thedifferences within the groups. The probability values obtained from theanalysis Of variance are listed in the right-hand column of Table 13. Thedifferences between the groups were found to be statistically significant onlyon training day 35, with the Small Group treatment being significantly betterthan the other three treatments at the <.0053 level of probability. Multiplerange tests indicated that there was also a significant gap between the SmallGroup treatment and the other treatments on the 30th and 40th training days;however, It was not of sufficient degree to make the total analysis ofvariance statistically sic-nficant.
In order to graphically compare the rates of skill acquisition,learning curves for each of the four treatments were developed on the basis ofthe adjusted mean NWPM obtained on each of the training days on which typingscores were recorded. The learning curves for the basic students arepresented In Figure 1 on page 16. The learning curves for each of the four
treatments exhibit the same basic pattern. There was a rapid increase in N"P1
-14-

0 0 - 0 0G 0 T -T -zt M P'.
0. Oa - L^ CW% m~ '0 c - 0 0 'a CW m ~ ' m 0 '0 00 -T - 0 0 -
'V V V V ~V V7VI)
a - 00 UlA C- %0 O% P- C4 ON Ln
L. ale LA C4 O; 4 0 C4 \0 A -:
o ON 0r ON co co Go 00 0 - L% "N 4N U
a 0 0 N 00 0 O0 00 Go '0 -
M- 00 %D)
M Go c 0 N C" !- \0 -4 - LA Ln
CC
4. 0 0 0 N4 '0 .V a -Pe a a r LA CA A - 40 -- i-.a% ON 0 0~ 00 00 1-- N. -Cr N-
00
o2 C4 C. ('.4 LA. M % %0 on m. -T m
CC
oGV. 0. Go m _:.
m &e LA _0 Z0 CA O'i 0. - rV L NX . a-- - - - - - - - - - - -- - - - - - - - - - - -ON ON m N 0% c (%Lf
00
V. LA -T 0 rWN m -41 LA\ 04N -
4.1 1 'D0 N. 00 O 07 CA 0 N 4N
U)~~~~ Z------------------------- N9 N N %9
CM W
CL0
(L. to Ch OAN .r*' L LA 00 LA 0 m0 -fu'. c. 04 f4 C4 01 N - 4o \0 C0 04V Z - - - - N N N- Nf
'-: 00 0; N -W4 '0 600 L 0 L
4.5 co 0-Tc.0 L
0(5 ai C4 Ca m m a aTa
-15-

% CL m
% 4 4M
% \J%. a.A
%t l "a -0V
00 "a
L. c c -r'Eu 6)
0 0
-~O c J 4.
5 0
LM Lr
C4~ C
161

over the first two weeks of the training period, followed by a dip in the
curve between training days 12 and 16, followed by a slow but steady increasein typing speed during the remaining training period. The dip in skillacquisition between the 12th and 16th day of training corresponds to the point
at which students reach the necessary NWPM to convert from hand written totyped assignments on the academic modules and, therefore, represents a periodof adjustment to the demands of production typing.
The mean NWPM obtained for the advanced students on each of thetesting days was adjusted in the same manner as the scores obtained for thebasic students. The adjusted mean NWPM and the student attrition over timeunder each of the three advanced student treatments is presented in Table 14below. The differences In student attrition are even more marked in theadvanced classes than they were in the basic classes. On the 20th day oftraining 91.2 percent of the Micro treatment students were still in trainingwhile only 22 percent of the students in the other two treatment groups werestill in the class. This is because the Micro students were held back fromgraduation until they had completed the Micro instructional units. On the30th and 35th days of training there were not enough students left in theclasses to even project a mean NWPM. The probability of statistical difference
Table 14. Adjusted Mean NWPM and Attritionof Advanced Students Over Time
Standard-- Standard--Large Group Small Group Microprocessor
Day ofTesting NWPM n % NWPM n % NWPM n % p
Entry 21.7 142 100.0 20.0 49 100.0 28.4 125 100.0 .0O000*
Day 1 25.2 142 100.0 22.7 49 i00.0 28.3 125 100.0 <.0003*
Day 4 28.8 142 100.0 27.8 49 100.0 31.6 125 100.0 <.0087*
Day 7 31.2 141 99.3 28.1 49 100.0 32.9 125 100.0 <.0053*
Day 10 32.0 131 93.0 30.7 49 100.0 34.5 123 98.4 <.0118*
Day 13 32.4 114 80.9 31.0 41 83.6 35.0 121 96.8 <.0105*
Day 16 34.6 76 54.0 31.2 23 46.9 35.6 121 96.8 <.0093*
Day 20 34.7 39 22.0 34.2 11 22.4 36.1 114 91.2 <.3153
Day 25 37.7 10 7.1 37.2 5 10.2 38.0 54 43.2 <.8376
Day 30 ---- .7 -- 0 .0 39.0 10 8.0
Day 35 0 .0 0 .0 ---- 0 .0
*statistically significant
-17 -
_ ----- -~-~-.--.- - _______

between the adjusted mean NWPM for each of the groups at each testing point,as determined by analysis of variance, is listed in the right-hand column ofTable 14. In most cases, the statistically significant differences can beattributed to the initially higher NWPM of the Micro students at entry intoAIT, rather than to any differences between the treatments.
The learning curves that were developed under each of the threetreatments of advanced students are presented graphically in Figure 2 below.The statistically significant gaps between the three treatments appear toreflect the initial difference between the groups (training days 1, 4, 10, and16). The significant gaps between the Large Group and Small Group treatmentson the 7th and 16th training days appear to be primarily due to day-to-dayfluctuations In student performance rather than to a steady trend. The trendfor all of the treatments, with the advanced students, is a slow and steadyImprovement In NWPM converging on a common level of production.
40-
3S_
S35
KEY
,...I ........ .... i cro* .. -I-.rs.
S.r
~ 20 Standard--Small Group
Standard--Large Group
*Significant Gap
I •
1 4 7 10 13 16 20 25 30 35Training Day
Figure 2. Comparison of Learning Curves for Advanced Students
0
- 'I8-

Effect of Reading Level
In order to determine if the student's reading ability affected thestudent's performance, Pearson product-moment procedures were employed todetermine the degree and significance of any correlation between either thenumber of days needed to reach the 25 NWPM required for graduation or theEnd-of-Course Test score. The correlations (r values) obtained for the basicstudents--total population and for each of the four treatments--are presentedin Table 15 below. The obtained correlations for the advanced studenttreatments are presented in Table 16 below.
Table 15. Correlation of Mean Reading Level with Mean Days to 25NWPM and Mean End-of-Course Test Score for Basic Students
Large Small TAUTFactor Considered Group Group 2000 Micro Total
Days to Reach 25 NWPM: r = -.0650 -.2194 -.1062 -.2904 -.1330
p = <.525 <.066 <.306 <.016* <.015*
End-of-Course Test Score: r - -.1008 .0923 -.0666 -.1415 .0223
P - <. 399 <.745 <.567 <.298 <.716
*statistically significant
Table 16. Correlation of Mean Reading Level with Mean Days to 25NWPM and Mean End-of-Course Test Score for Advanced Students
Large SmallFactor Considered Group Group Micro Total
Days to Reach 25 NWPM: r - -.1821 -.1433 -.2433 -.0009
p - <.084 '.353 <.029* C.990
End-of-Course Test Score: r - -.0677 .0072 .0906 -.0065
p W <.545 <.964 <.449 <.928
*statistically significant
For both the basic and the advanced students, there was a slightlynegative correlation between reading level and days to reach 25 NWPM--the
> higher the reading level, the less time required to reach 25 NWPM. Theprobability that this correlation was not zero was statistically significant
- 19 -
.. ~ -- . .., - - - - -- -.- x - - ~

for the total population of basic students and for the students in the Microtreatment at both the basic and advanced levels. However, the degree ofcorrelation found was so slight for each of these groups that it appears tohave had little or no effect on the results of this test. Reading level wouldaccount for only 2% of the variance within the basic student population.Within the Micro treatment, reading level accounted for 8% of the variance forbasic students and 7% for advanced students. The higher correlation for theMicro treatment than for the other treatments does, however, indicate thatreading might be associated with student performance under the Microtreatment.
Measures of Cost and Reliability
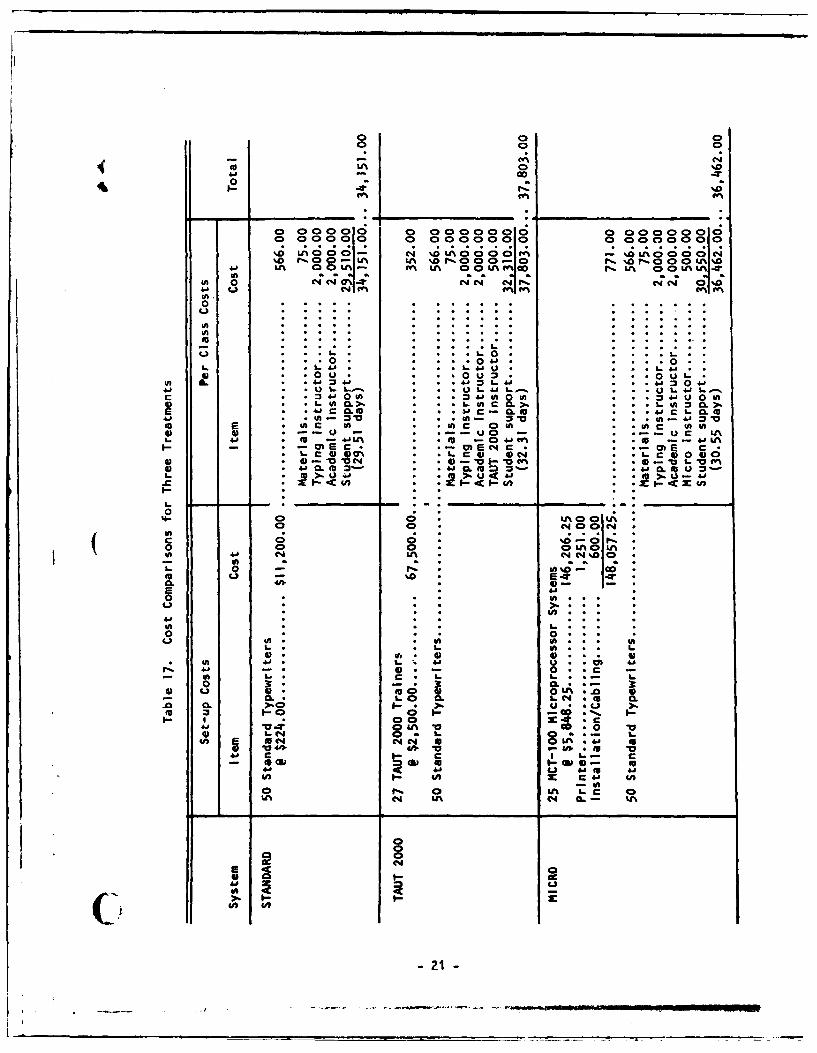
A comparison of the cost estimates for three of thetreatments- -Standard, TAUT 2000, and Micro- -is presented in Table 17 on thefollowing page. The equipment and staff needs for each of the treatments isbased on the format descriptions provided in the section on evaluation design.
All equipment and system set-up costs are based on figures reported bythe appropriate distributor or by the Administration School, Fort Jackson. Inorder to allocate set-up costs on a per class basis, equipment is depreciatedover an eight year period. Assuming that 12 classes per year would make useof the typewriters, the typewriter cost would be divided by 96 (12 X 8) todetermine the per class cost. The electronic instructional equipment could beused by four classes each day, so the cost of such equipment would be dividedby 192 (6 sessions X 4 classes X 8 years) to obtain the per class costs. TheTAUT 2000 system lists 27 rather than the 25 minimal number of devices Inorder to provide back-up for equipment problems which were encountered In thetest. It the microprocessor system were used for other purposes in addition tobasic keyboard instruction, such as the delivery of academic modules, the costf igures upon which the comparisons are based would be changed due to areduction in the portion of the Initial cost that would be depreciated againstthe keyboard instruction component of the course.
An instructor (both typing and academic) is paid approximately $20,000per year. Assuming that the instructor would be assigned to 10 classes duringa year, the salary charge for a regular instructor against a class would be$2,000. Instructors working in the TAUT 2000 and Micro rooms could handlefour classes a day, so the charge against each class would be $500.00.
Student support (housing, food, allowances, etc.) is based on a figureof $400.00 per student per month, or approximately S20.00 per student per dayof training. Student cost is variable between the three treatments because ofthe differences in time required for students to complete the self-pacedacademic modules. Cost estimates for student support In Table 17 is based onthe average total training days as listed on page 12 of this report for eachof the three treatments.
In order to determine the reliability uf the equipment under fieldtest conditions, maintenance records were maintained by the Instructors. TheMicro treatments recorded no down time due to equipment failure. Thiscompares favorably to the distributor's report that of 112 units that he hasout in the field, only 8 have had to be brought In for repair during the past
one and a half years. Over 90% of the Micro maintenance problems can be
- 20-
or 00o 0 0
1.0- N
%0 L 0 - C4 % A 0 4 %0 0 4
4A 0 al l ' zc; C g0.
I. L. AI.L.4410 341f 0- t-nf :3 4a.oo- U- ' % 0 0 U
~L U, 5~ ~U,.U, c 4A0 Uo .o
U, V O ..C 0 Nr
2- " .12,..4j0 * .. 4J
0 L J .. .. 4. L .
in I ctt~.. .*a
CL e
IA)40 .L 4) 4N L1O)
W L.0 0L U OO00 t* 0-0
V. L. 4)4. 0 4 L-
o1 0.4 ..
o) cw 4a Le L
ai AJ 44a 4a
Ut~U z- UtZ 4,
E cc

repaired by a low level electronic technician. The TAUT 2000 system hadconsiderably more reliability problems. This was In large part due to thedecision to adapt the TAUT 2000 keyboard to existing Beseler Cue See devicesthat the Army had on hand. In many cases the existing Beselers were 10 to 12years old and not the model for which the keyboard had been developed. As aresult, the Beselers needea constant attention and adjustment in order tomaintain calibration of the control mirrors. For example, of the 150breakdowns recorded for the first class to use the TAUT 2000 system, all butfour were for the adjustment of the mirrors. These problems were, to a largepart, cleared up for the three classes that were included in the test. Thesecond class to use the TAUT 2000 system averaged under one breakdown per dayand half of these were for burned out light bulbs. The distributor for theTAUT 2000 indicates that over 95% of the problems encountered In the testcould have been eliminated by use of machines that had been calibrated in thefactory prior to delivery. However, this would not take advantage of theexisting Beseler Cue See units in the Army inventory.
Measures of Acceptance
Interviews were conducted, using an attitudinal survey instrument,with the four typing instructors who worked with the TAUT 2000 System and withthe three basic and three advanced instructors who worked with the Microsystem. This sample was too small to do valid statistical analysis; however,the instructors' responses in regard to each of the two electronic-basedtreatmenti are sunmarized in Table 18 on the following page.
In general, the Instructors were positive about such factors of thee lectronic -based systems as the physical arrangement, ease of repair,operation of the equipment, and attitude of students. They were generallynegative, however, to such factors as the ease of adjusting to using both thedevice and the standard typewriter, the degree of interaction between studentsand instructors, and equality of benefit for students, leading them to bestrongly negative to the idea of general adoption of either system by the Armyfor basic keyboard Instruction.
The Instructors'I criticisms of the TAUT 2000 system focused onproblems with transfer to the manual typewriter (e.g., no shift key, no upperand lower Case), physical problems with machine calibration and programorganization, and the development of poor typing practices (e.g., viewing thescreen rather than the text).
The Micro system instructors felt that the best use for the systemwould be for remedial instruction and review of basic keyboard skills ratherthan for general Instruction. A number of Instructors comsented on thenegative effect on student attitude toward instructors. As with the TAUT 2000system, instructors noted a number of differences between the Micro system andthe standard keyboard that created problems when students transferred to themanual system.
Students on the TAUT 2000 and Micro systems completed an attitudinalsurvey upon leaving the course. Without data on the Standard, 'treatment withwhich to make comparisons, it Is not Possible to draw any general conclusionsor recommendations from student attitudes. It is Possible, however, to make a
comparison Of student reactions to the two electronic- based treatments. The 0-22-

Table 18. Summary of Instructor Reactions4 to TAUT 2000 and Micro Systems
MicroTAUT
Question 2000 Basic Advanced
Did use of this device encourage Interactionbetween students and Instructors? mixed mixed NEGATIVE
Did use of the device assist the Instructorin the teaching process? POSITIVE POSITIVE mixed
Was instructor training In the use of thedevice adequate? POSITIVE mixed POSITIVE
Was the physical arrangement of the roomand equipment satisfactory? POSITIVE POSITIVE POSITIVE
Did the students easily adjust to usingthe device and the standard typewriter atthe same time? NEGATIVE NEGATIVE POSITIVE
Was the operation of the device simple andeasily understood? POSITIVE POSITIVE POSITIVE
Were repairs easy to arrange for andpromptly received? mixed POSITIVE POSITIVE
Was the device mechanically reliable? NEGATIVE POSITIVE mixed
Did you enjoy having the device available? POSITIVE mixed NEGATIVE
Was the program well written; that is didIt teach keyboard skill effectively? POSITIVE mixed POSITIVE
Were the systems generally problem-freefor students? mixed mixed POSITIVE
Did the students show or express approval,positive interest or enjoyment regardinguse of the system? POSITIVE POSITIVE mixed
In your view, did the students benefit fromthe use of the system? mixed mixed mixed
Did all students benefit equally from usingthe system? NEGATIVE NEGATIVE NEGATIVE
Do you believe the system Is worth adaptingfor use In Army typing classes? NEGATIVE mixed NEGATIVE
-23-

student attitudinal responses are summarized in Table 19 below. For questionsone through nine, student responses had a Possible range of from 1.0 to 4I.0.For these items, the closer to a mean value of 1.0, the more positive thestudents' response to the item. For question 10 and 11, the range was from1.0 to 2.0. Analysis of variance was applied to the student responses todetermine if there were any statistically significant differences between themeans obtained for the groups on any of the items. The probabilities ofstatistical difference from this analysis are listed in the right-hand columnof Table 19.
Table 19. Summary of Mean Student Reactionsto TAUT 2000 and Micro Systems
TAUTQuestion 2000 Micro
1. Were the physical arrangements comfortable? 1.43 1.45 (47664
2. Did you enjoy using the machine? 1.45 1.43 <.8569
3. Were the directions given by the machineeasy to understand? 1.11 1.10 .8839
4. Did you have trouble moving from the machineto the manual typewriter? 1.95 1.86 <.4002
5. Did the machine break down while you were)using It? 2.0 1.08 (.0000*
6. Did the viewing screen bother your eyes? 1.68 1.20 <.0000*
7. Did you receive help from the Instructor? 1.93 1.56 (.0011*
8. Did you need more help than you received? 1.38 1.30 <.3812
9. Did your outside duties Interfere with class? 2.11 2.19 <.2014
10. Have you ever used a machine like thisbefore, for any reason? 1.93 1.88 <.2334
11. Would you recommend this machine for use Inall typing classes? 1.21 1.09 (.0154*
*statistically significant
In general, students were favorable to both of the devices. Theirmost negative reactions were to breakdown problems with the TAUT 2000 Systemand to problems with transfer to the manual typewriter under both Systems.Students under the Micro treatment were more In favor of its adoption, at astatistically significant level, than were the TAUT 2000 students. Students
with the TAUT 2000 system had more problems with the viewing screen and
-2'i

machine breakdown, at a significant level, and did not feel they were gettingas much instructor help as the Micro students.
4
3. CONCLUSIONS AND RECOMMENDATIONS
In reviewing the results of this test, It Is Important to keep in mindthat the test was not a controlled experiment. All efforts were made tomaintain the normal operational procedures of the Administration School. As aresult, a number of problems were encountered In the test due to the realworld nature of the test environment. Also, the distinction between thestatistical significance and the practical importance of any reporteddifferences must be kept clear when interpreting the results reported in thisevaluation. With the large number of subjects examined in the test, It isrelatively easy to find statistical differences between groups. For example,on the comparison of the End-of-Course test scores for the four basic studenttreatments, a range of 1.69 NWP4 from the high to the low mean scores for thedifferent treatments was statistically significant at the <.0327 level ofprobability. Such a small degree of difference is of relatively lowimportance in selecting the mode of training to be employed.
On the basis of the evidence presented In this paper it is possible tomake the statement that each of the systems examined Is capable of developingthe basic keyboard typing skills of the students. However, it is not possible4 to say that any one system is the "better" system In all cases.
In regard to measures of effectiveness, End-of-Course test scoresindicate that the Small Group treatment is better than either of the twoelectronic-based systems, but It is not better than the Large Group treatmentfor the basic students. Once differences In entry levels are accounted for,there is no difference between the groups at the advanced level.
On measures of efficiency, once differences in training time areallowed for, there is no difference between the groups. There Is a slightgain in training time from reduction of class size, but the cost savings fromreduced student time In training would be more than offset by the increase inCosts for instructors and facilities.
On measures of cost, both of the electronic systems represent addedcost since they are in addition to, and do not represent a displacement of,the cost of the current System.
On measures of acceptance, the instructors were negative toward thenew systems, but the strongly positive responses of the students would morethan counter such reactions.
Since the current system of typing instruction appears to be workingas well as any of the alternatives evaluated In this test, the recoammendationof this report is that none of the experimental treatments be adopted for wide() use at the Administration School, Fort 3ackson, at this time, and that thecurrent system of typing training be maintained.
-25-

The major recommendation from this test and evaluation does notpreclude further experimentation or testing of electronic-based deliverySystems for use In keyboard training. The recommendation is for the presenttime only, and is based on the two specific systems examined In this test. Itmay well be that other systems, employing variations of the tested deliveryformats, might well produce educationally important as well as statisticallysignif icant dif ferences. If the keyboard of the Instructional devices hadbeen modified to have the same pitch and stroking characteristics as themanual keyboards employed in testing, or if the testing had been carried outon an electronic keyboard, the results Of the evaluation might well have beendifferent. Also, the recomnmendation Is in the context of the AdministrationSchool. If training were to move toward a totally self -instructional format,outside of the formal school setting, the results Of this evaluation could beused in support of either of the electronic-based systems as an Independentmeans of developing basic keyboard skills at duty stations since there was nodifference between the experimental and standard Systems in regard toeffectiveness or efficiency of skill acquisition.
-26-

1. I.D. NO.
FORM A: STUDENT DATA FORM 2. DATE ASSIGNED
3. BASIC ADVANCED
INSTRUCTOR
4. NAME SSANLast First MI
5. UNIT GRADE
6. EDUCATION LEVEL (Circle year completed): 8 9 10 11 12 (H.S.); 13 14 15 16 (College)Service School(s)
7. READING SCORE NAME OF TEST
B. ENTRY TYPING TEST SCORE: Gross Errors NET WPH
J. TYPING TEST RECORD:A. BASIC STUDENT: Manual Typewtiter Training System
Training Day 8 (NWPM)Training Day TOTraining Day 12
Training Day 14Training Day 16
Training Day 18Training Day 20
Training Day 25Training Day 30
Training Day 35
Training Day 40
B. ADVANCED STUDENT:Training Day ITraining Day 4
Training Day 7Training Day IO
Iraining Day 13
Training Day 16Training Day 20
25 __ 30 35____
C. ALL STUDENTS: Trailnng Day on which following NWPM Attained:
15 NWPM -- 25 14WPM -- 30 NWPM 35 NWPM 40 NWPM
45 NWPM _ 50 IIWPN__ 55 NWPM 60 "WPM High Score .
I4. END-OF-COURSE TESTING SCORE ). . DATE OF GPADUATION
12. DAYS PRESENT IN CLASS . 13. DAYS ABSENT FROM CLASS -
14 REASON FOR LEAVING CLASS: Gradu.ation O Other (state)Reasvignment . Location
0 A-1
.1!:I

STUDENT OPINION FORM: Reverse of Student Data Form
1. Were the physical arrangements comfortable?Good _ All Right Poor Uncomfortable
Explain
2. Did you enjoy using the machine?Very Much Somewhat Little Not At All
Why, or why not? _ _ _-- __-
3. Were the directions given by the machine easy to-understand?Very Easy _ All Right Difficult Impossible
Explain the good orbad features
4. Did you have trouble moving from the machine to the manual typewriter?No Trouble Somt. iurh Couldn't ou It
txplain
5. Did Lne machine break down while you-were. using it?Never Sometimes Often Most or the Time
What went wrong, t anything?"----
6. Did the viewing screen bother your eyes?Never Sometime _ Often - Always
Explain
7. Did you receive help from the Instructor?Much Some Little None
What was helpful?
8. Did you need more help than you received.?Much , Some _ Little None
Explain
9. Did your outside duties Interfere with class?Much Sonlt. Little None
Give examples _
10. Have you ever used a machine like thl. before., for any reason? __YES 110Explain
11. Would you recommend this machine for use In all typing classes? YES NOWhy, or why not? _ _ _ ___ _
12. Explain In your own words: what are the good aid bad points of this methodof teachinn typing! How could it be imptuved 1
A-2

FORM B: INSTRUCTOR/STAFF INTERVIEW SCHEDULE
NAME JOB TITLE (Role)
SYSTEM ASSESSED CLASS STARTING DATE
1. Did use of this device encourage interaction between studentsand instructors? YES NOExplain
2. Did use of the device assist the Instructor In the teachingprocess? YES NOIn what way?
3. Was Instructor training in the use of the device adequate? YES NOCotments
4. Was the physical arrangement of room and equipment satisfactory? YES _ NO
Explain
5. Did the students easily adjust to using the device and thestandard typewriter at the same time? YES___ NO
Observations
6. Was the operation of the device simple and easily understood? YES _ NOWhy, or why not?
7. Were repairs easy to arrange for and promptly received? YES NOExplain
8. Was the device mechanically reliable? YES NOObservations
9. Did you enjoy having the device available? YES NOWhy, or why not ?__
10. Was-the program well written; that Is, did It teach keyboardskill effectively? YES _ NOPlease comment on: Was the material In logical order?
Was It consistent with good teaching practice?Were the Items taught valid?Were the units of the right length?
Observations and suggestions:
A-3
....... R

1,. were the systewns enerally problem-free for students? YLS NO
12. Did the students show or express approval, positive Interestor enjoyment rtqarding use of the system? YES.__NOGive examples
13. in your view, did the students benefit from the use of theSystem? YES NOrxplain
14. Did all students benefit equally from using the system? __YES NOPlease explain if some students benefited more or less, andwhy they did so
15. Do you believe the system is worth adopting for use in Armytyping classes? .YES NOWhy, or why not?
16. In your own words, explain what you believe to be the meritsor limitations of this system:
17. What elements of the system, or the program, could be Improvedto help you as an Instructor?
18. If you were able completely to reorganize typing Instructionfor the Army, In the light of the experience you have had withthis device ( .) what would you do?
A-40

Table Al. ANOVA of Educational Level for Four Treatments--Basic Students
Source of Degrees of Sum of Meanvariance freedom squares squares F p
BetweenGroups 3 5.13 1.71 .91 <.14338
WithinGroups 464 868.11 1.87
Total 467 873.25
Table A2. ANOVA of Reading Level for Four Treatments--Basic Students
Source of Degrees of Sum of Meanvariance freedom squares squares F p
BetweenGroups 3 2,423.76 807.92 1.87 '<.1334
WithinGroups 424 182,866.05 431.29
Total 427 185,289.81
Table A3. ANOVA of Entry Typing for Four Treatments--Basic Students
Source of Degrees of Sum of Meanvariance freedom squares squares F p
BetweenGroups 3 101.09 33.70 2.16 < .0917
WithinGroups 464 7,230.34 15.38
Total 467 7,331.43
C ; A-5
"i" - -- ' - -n J m • - : = " bd l~b w • " . . . . ...

Table A. ANOVA of Educational Level for Three Treatments--Advanced Students
Source of Degrees of Sum of Meanvariance freedom squares squares F p
BetweenGroups 2 7.14 3.57 3.25 <.0403*
WithinGroups 307 337.65 1.10
Total 346 344.78
Table A5. ANOVA of Reading Level for Three Treatments--Advanced Students
Source of Degrees of Sum of Meanvariance freedom squares squares F p
BetweenGroups 2 963.16 481.58 1.25 .2876
WithinGroups 215 82,616.04 384.26
Total 217 83,579.19
Table A6. ANOVA of Entry Typing for Three Treatments--Advanced Students
Source of Degrees of Sum of Meanvariance freedom squares squares F p
BetweenGroups 2 3,678.21 1.839.10 37.74 <.0000*
WithinGroups 296 14,425.66 48.74
Total 298 18,103.87
*statistically significant
A-6
-""Room___________________

Table A7. ANOVA of Day Absent for Four Treatments--Basic Students
Source of Degrees of Sum of Meanvariance freedom squares squares F p
BetweenGroups 3 500.63 166.88 5.61 <.0009*
WithinGroups 462 13,743.51 29.75
Total 465 14,244.14
Table A8. ANOVA of Days Absent for Three Treatments--Advanced Students
Source of Degrees of Sum of Meanvariance freedom squares squares F p
BetweenGroups 2 25.41 12.71 .94 <.3917
WithinGroups 312 4,216.64 13.51
Total 314 4,242.05
Table A9. ANOVA of High Score in NWPM for Four Treatments--Basic Students
Source of Degrees of Sum of Meanvariance freedom squares squares F p
BetweenGroups 3 108.11 36.04 .65 <.5831
WithinGroups 463 25,660.67 55.42
Total 466 25,768.77
*statistically significant
(A-
• . . .. ,... .... ... . " I - IM IN

Table AID. ANOVA of High Score in NWPM for Three Treatments--Advanced Students
Source of Degrees of Sum of Meanvariance freedom squares squares F p
BetweenGroups 2 2,466.26 1,233.13 17.29 < .0000*
WithinGroups 312 22,246.37 71.30
Total 3.4 24,712.62
Table All. ANOVA of End-of-Course Test Scores for Four Treatments--Basic
Source of Degrees of Sum of Meanvariance freedom squares squares F p
BetweenGroups 3 106.96 35.65 2.96 <.0327*
WithinGroups 289 3,483.42 12.05
Total 292 3,590.38
Table A12. ANOVA of End-of-Course Test Scores for Three Treatments--Advanced
Source of Degrees Sum of Meanvariance freedom squares squares F p
BetweenGroups 2 2,081.03 1,040.51 19.04 <.0000*
WithinGroups 285 15,575.29 54.65
Total 287 17,656.31
*statistically significant 0A-8

Table A13. ANOVA of Days to Reach 15 NWPM for Four Treatments--Basic Students
Source of Degrees of Sum of Meanvariance freedom squares squares F
BetweenGroups 3 155.41 51.80 1.67 <.1736
WithinGroups 430 13,368.17 31.09
Total 433 13,523.58
Table A14. ANOVA of Days to Reach 25 NWPM for Four Treatments--Basic Students
Source of Degrees of Sum of Meanvariance freedom squares squares F p
BetweenGroups 3 341.13 113.71 1.02 <.3834
WithinGroups 361 40,215.91 111.40
Total 364 40,557.05
Table A15. ANOVA of Days from 15 to 25 NWPM for Four Treatments--Basic Students
Source of Degrees of Sum of Meanvariance freedom squares squares F p
BetweenGroups 3 155.93 51.98 .77 < .5093
WithinGroups 361 24,253.39 67.18
Total 364 24,409.32
(9i A-9
_____-_r
_______.. .. . . .. ___" _______ bAA, ml

Table A16. ANOVA of Day of High Score for Four Treatments--Basic Students
Source of Degrees of Sum of Meanvariance freedom squares squares F p
BetweenGroups 3 1,139.62 379.87 3.49 (.0158*
WithinGroups 463 50,434.72 108.93
Total 466 51,574.34
Table A17. ANOVA of Total Training Days for Four Treatments--Basic Students
Source of Degrees of Sum of Meanvariance freedom squares squares F p
BetweenGroups 3 1,849.31 616.44 5.87 <.0006*
WithinGroups 462 48,490.75 104.96
Total 465 50,340.06
Table A18. ANOVA of Days to Reach 15 NWPM--Advanced Students
Source of Degrees of Sum of Meanvariance freedom squares squares F p
BetweenGroups 2 .13 .07 .51 <.6003
WithinGroups 313 41.02 .13
Total 315 41.15
*statistically significant
A-l0
- -- - -I I
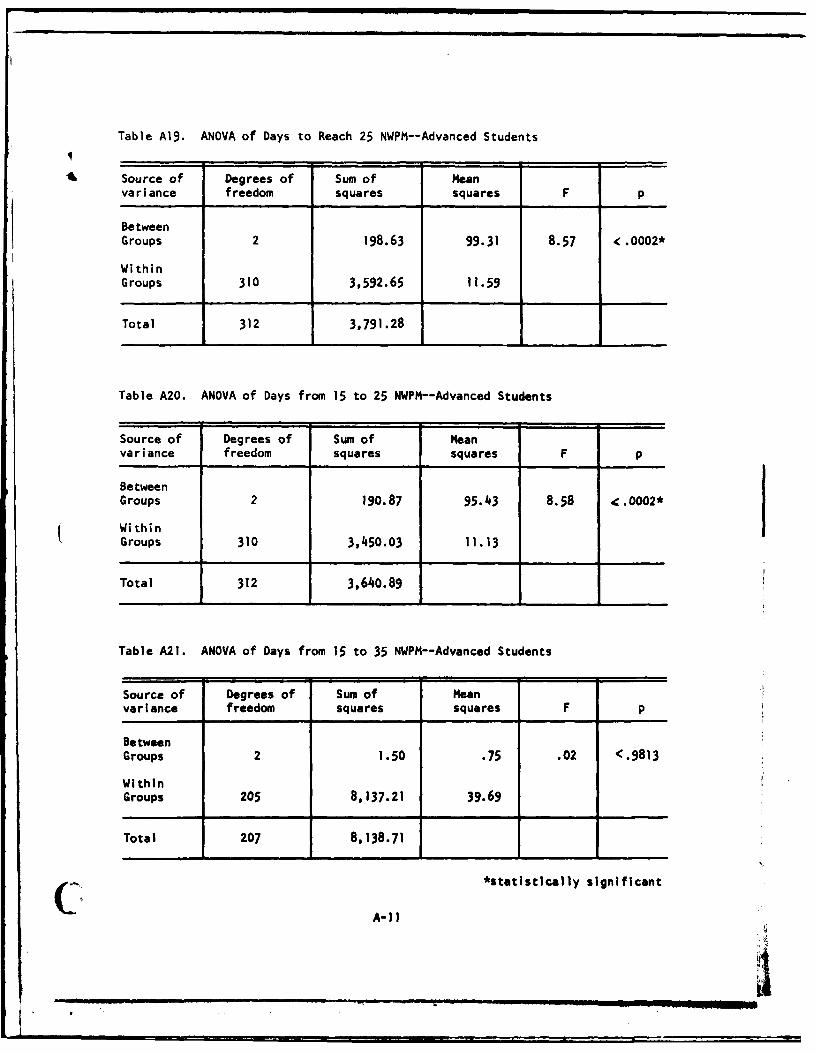
Table A19. ANOVA of Days to Reach 25 NWPM--Advanced Students
, Source of Degrees of Sum of Meanvariance freedom squares squares F p
BetweenGroups 2 198.63 99.31 8.57 < .0002*
WithinGroups 310 3,592.65 11.59
Total 312 3,791.28
Table A20. ANOVA of Days from 15 to 25 NWPM--Advanced Students
Source of Degrees of Sum of Meanvariance freedom squares squares F p
BetweenGroups 2 190.87 95.43 8.58 < .0002*
WithinGroups 310 3,450.03 11.13
Total 312 3,640.89
Table A21. ANOVA of Days from 15 to 35 NWPM--Advanced Students
Source of Degrees of Sum of Meanvariance freedom squares squares F p
BetweenGroups 2 1.50 .75 .02 <.9813
WithinGroups 205 8,137.21 39.69
Total 207 8,138.71
*statistically significant
A-)l

Table A22. ANOVA of Days from 15 to 45 NWPM--Advanced Students
Source of Degrees of Sum of Meanvariance freedom squares squares F p
BetweenGroups 2 5.45 2.73 .06 <.9430
WithinGroups 69 3,201.53 46.40
Total 71 3,206.98
Table A23. ANOVA of Day of High Score--Advanced Students
Source of Degrees of Sum of Meanvariance freedom squares squares F p
BetweenGroups 2 1,493.91 746.95 22.93 <.0000*
WithinGroups 312 10,162.74 32.57
Total 314 11,656.64
Table A24. ANOVA of Total Training Days--Advanced Students
Source of Degrees Sum of Meanvariance freedom squares squares F p
BetweenGroups 2 3,922.59 1,961.29 89.53 <.0000*
WithinGroups 312 6,834.74 21.91
Total 314 10,757.33
*statistically significant 0A-12

0 0
4 IA
c
0 0
E -oL. I-6
* 0 0 I
a, m
~ I-
C4 C4
olul -a spio 3* I-od udi Sj
Cl A-13
. ....... o

1k