id eleci - defense technical information center report 80-4 energy mane jverability display for the...
TRANSCRIPT
Special Report 80-4
ENERGY MANE JVERABILITY DISPLAY
FOR THE AIR COMBAT MANEUVERING
RAN7 W/ACTICAL TRAINING SYSTEM
(ACMR/TACTS)
V. R. Pruitt, W. F. Moroney, sad C. Lmu
DTICS1O ELECI r l
DEC 118iD
I'IE -
,J E. _N S,,ý'
Approved for public release; distribution ul-dimited.
.80 12 17 001

Approved for public release; distribution unlimited.
ENERGY MANEUVERABILITY DISPLAY FOR THE AIR COMBAT
MANEUVERING RANGE/TACTICAL TRAINING SYSTEM
t( .MR/TACTS)
V. R. Pruit*. W. F. Moroney, and C. Lau
Accos iorn For
NTIS GRA&IDTIC TABUnannouncedJustification
, Naval AivSvstjms Command Distribution/Availability Codes
¶Avail and/or
' tDist Special
I4Approved by Released by
Ashton Graybiel, M.D. Commander W. M. Houk, MC, USNAssistant for Scientific Prograrms Commanding Officer
i1
August 1980
Prepared for:
"* Naval Aerospace Medical T search LaboratoryNaval Air Staion
Pensacola, Florida 32508!
LrL

SUMMARY PAGE
THE PROBLEM
Over the past decarie, amphasis has been placed on designing fighter aircraftto energy manouverability criteria. These criteria have indeed increased fighterperformance, but they have also presented analysts and pilots with new tasks infully utilizing this improved capability. In the development of tactics, the energymaneuverability capability of a potential adversary's aircraft must be comparedwith the maneuvering capability of one's own aircraft. A major factor which deter-nmines the outcome of aerial combat is the pilot's ability to maximize the maneuveringcapability of his aircraft. >This report describes the development of an integratedanalog display (turn rate vs calibrated airspeed) for use as a debriefing aid on theAir Combat Maneuvering Range (ACMR).
FINDINGS
The ACMR gathers in-flight data from aircraft while they are engaged in aircombat maneuvLring. Upon returning from the ACMR, aircrew are presented withi) a pictorial display of the engagement, and 2) a digital printout of selected encoun-ter parameters (e.g., velocity, ,g' t , altitude of each aircraft, range between aircra/t).The display integrates the3se i elevant energy manbuverability data into an analogformat, thus providing an immediate comparison of the performance of each aircraftwith respect to the maneuvering envelope of that ait:,raft and that of the opponent.The display also allows the aircrew to recognize very rapidly whether they are gain-ing or loosing energy and the rate of gain or loss. The maneuvering envelopes ofthe F-14, F-4. A-4, and F-5 aircraft can be diiplayed in this dynamic format. It isexpected that this new format 1) will provide a better means for pilots to determinehow well they have maxir-.ed the performance of their aircraft, and 2) may serve asan aid in tactics development.
A brief discuss;on of the nature of energy maneuverability is contained in anAppendix.
RECOMMENDATIONS
It is proposed that the effectiveness of the energy maneuverability (EM) display
and the companion instructional video tape should be evaluated. The potential ineor-poration of the display into other ACMRs/ACMIs and ACM simulators should also be
4 considered.
ACKNOWLEDGMENTS
The valuable assistance provided by Mr. Bill Dollard, Fleet Analysis C( nter,'I Miramar, and Lieutenant Commanders Nathmvan atnd Ernst of the Navy Fighter Wea-
ii -
ii [
.oons School. Naval Air Station, Miramar, is gratefully acknowledged. The detailedsoftware was implemented by Mr. R. Fullford of D2S Associated of San Diego undersubcontract from McDonnell Aircraft Company (MCAIR).
I'
The authors' addresses are as follows:
V. R. Pruitt. McDonnell Douglas Corporation, P. 0. Box 516, Saint Louis,Missouri 63166; W. F. Moroney, Operations Research Department (55Mp). NavalPostgraduate School, Monterey, California 93940; and C. Lau, Human FactorsEngineering Branch, Pacific Missile Test 1enter (1226), Pt. Mugu, California 93040.
. iii
S!
-f~'

TABLE OF CONTENTS
Page
I. INTRODUCTION ............... ....................... 1
II. DEVELOPMENT OF THE EM DISPLAY ....... ............. 4
2.1 Turn Rate-Veloctty Profile .......... ............... 5
2.2 The Maneuver Triano'le ..... ................. .... 10
2.3 V-N Diagram ........... ..................... .... 14
2.4 ACMR EM Display ........ ................... .... 25 4
2.5 Video Tape Presentation ............ ................ 34
II. CONCLUSIONS ............. ....................... .... 34
IV. RECOMMENDATIONS ......... ..................... .... 34
V. REFERENCES .............. ....................... .... 36
APPENDIX A. Energy Maneuverability and Display ConceptBackground
APPENDIX B. Present Position Indicator
APPENDIX C. Corrections for C snges in Gross Weight
APPENDFI D. Conditioning of ACMR Data
iv
I\II
LIST OF TABLES
Table
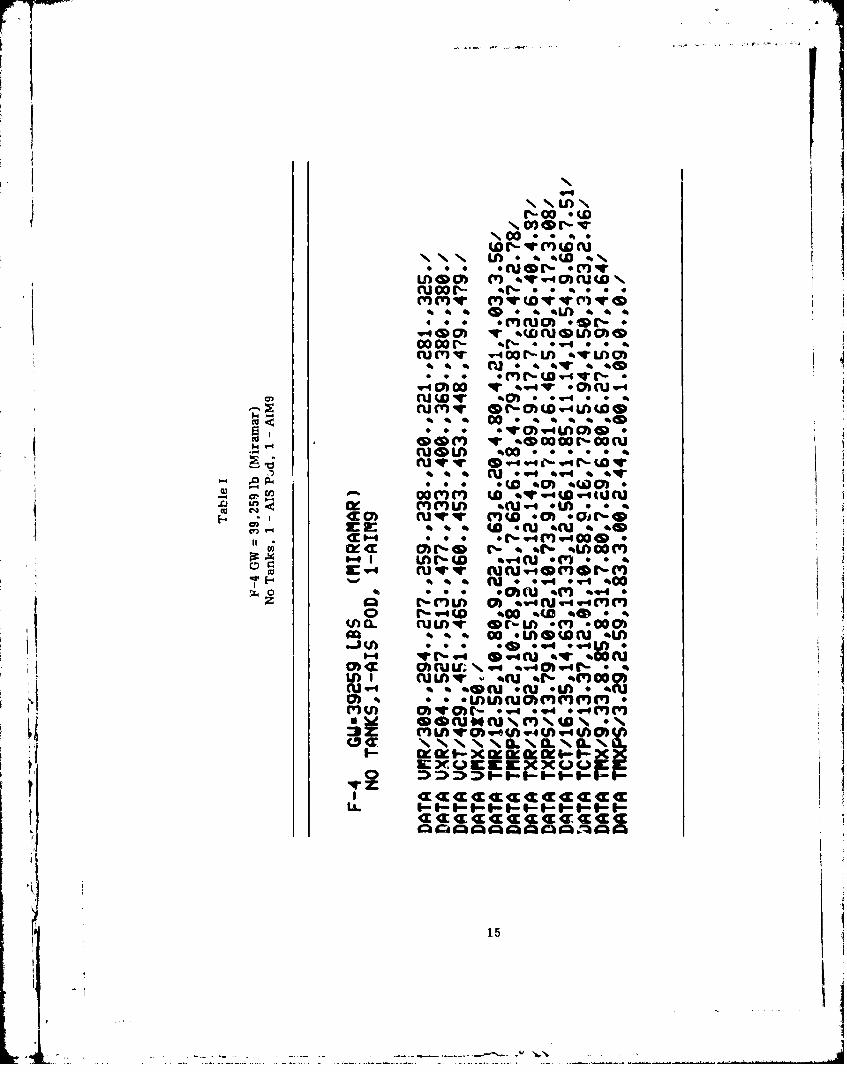
I. F-4 GW=39, 259 lbs (MIRAMAR) ........ .............. ... 15
HI. F-4 GW-39, 754 lbs (YUMA) ........... ............... 16
NI. F-4 GW=41, 063 lbs (MIRAMAR) .......... .............. 17
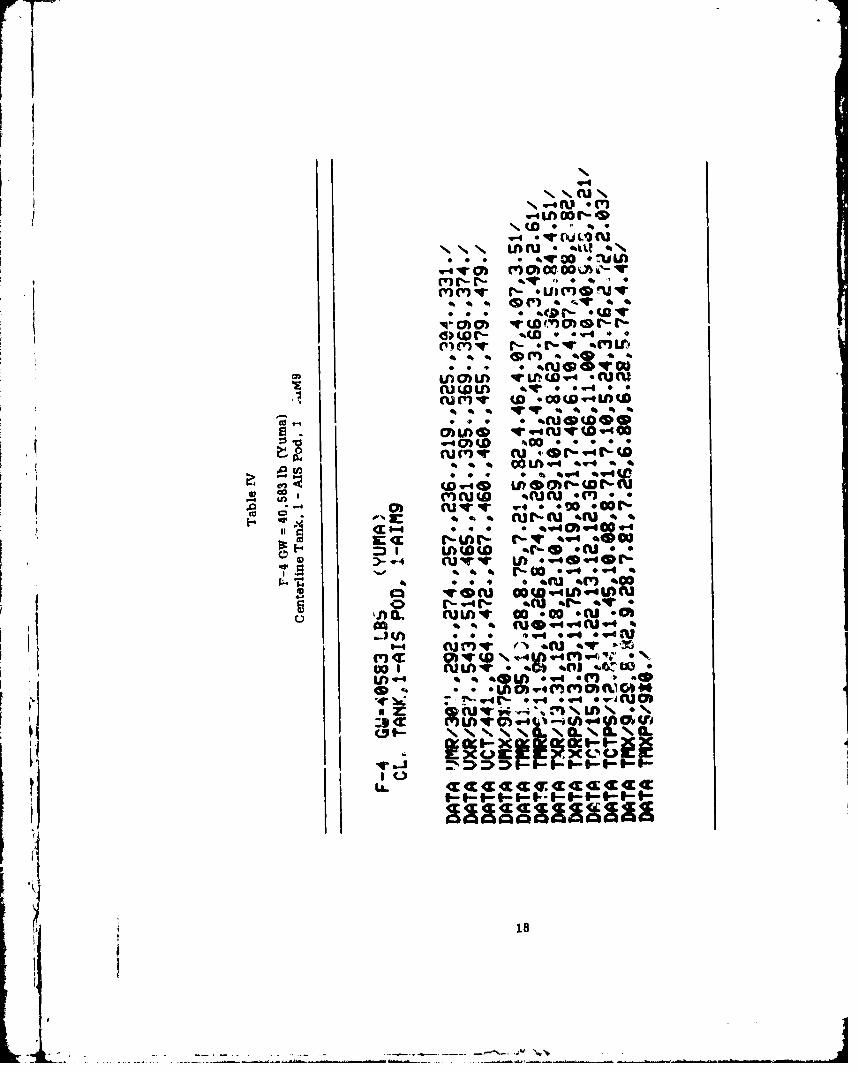
IV. F-4 GW=40, 583 lbs (YUMA) ...... ............... .... 18
C-! P-4 Weight Data .......... ..................... ... C-4
D-I Data Specifications .......... .................... ... D-2
SIi
ITV
i

LIST OF ILLUSTRATIONS
u page
1 Rate-Velocity Profile ........ ... ................... 6
2 Turn Rate vs Velocity (F-4 Altitude = 10,000 ft) ......... 7
3 Turn Rate vs Velocity (Threat A vs F-4. Altitude =10.000 ft) ....... ..... ... ....................... 8
4 Key Turning Conditions on Rate-Velocity Diagram ........ 9
5 Maneuver Triangle (Sea Level to 40,000 ft) ..... ........ 11
6 DDS Graphics - Maneuver Triangle Format ..... ........ 12
7 Display Data Point Definition, Maneuver Triangle ... ..... 13
8 Display Data Point Definition, V-N Diagram .......... ... 20
9 V-N Liagram F-4 (Vertical Scale = 260, Horizontal Scale =300) ...... ..... ....... ......................... 21
10 V-N Diagram F-4 (Vertical Scale = 200, Horizontal Scale =300) ...... ..... ....... ......................... 22
11 V-N Diagram F-4 (Vertical Scale = 15C, Horizontal Scale =300) ...... ..... ....... ......................... 23
12 DDS Graphics - V-N Format ..... ............... ... 24
13 (r) Display Format Verification (Sea Level) ..... ........ 26
(b) Display Format Verification (10,000 ft) .......... ... 27
(c) Display Format Verification (20,000 ft) ......... 28
(d) Display Format Verification (30,000 ft) .......... ... 29
(e) Display Format Verification (40,000 ft) ........... ... 30
14 DDS Graphics - EM Display Format .... ............ 22
15 DDS Graphics - EM Display Format (Alternate) .... ...... 33
A-I Basic V-N Diagram, ...... ................... ... A-5
"" A-2 V-N Diagram ......... ... ...................... A-B
A-3 Typical Rate iladlus Profile ....... ................ A-8
vi

Figure Page
j,-4 Key Maneuver Conditions ..... ................ .... A-10
A-5 Maneuver Triangle ...... ................... .... A-11
A-6 Maneuver Triangle Trends ....... ................ A-12
C-1 EMD Comparison for Three Fuel States ............... C-3
C-2 Display Turn Rate Error ........ ................. C-6
vii
'I
'4 -- ~vii

I. INTRODUCTION
Over the past decade, emphasis has been placed on designing fighter aircraftto energy maneuverability criteria. While this emphasis has resulted !n fighteraircraft with improved performance capability, it has presented analysts and pilotswith new tasks in fully utilizing this improved capability. In the development oftactics, the energy maneuverability capability of a potential adversary's aircraftmust be compared with the maneuvering capability of one's own aircraft. A majorfactor which determines the outcome of aerial combat is the pilot's ability to maxi-mJ ze the maneuv'.ring capability of his aircraft.
Before discussing energy maneuverability (EM) the distinction betweenenergy management and energy maneuverability must be considered. Pruitt (1)r.akes the following distinction:
Energy Management - relates to the use of potential and kinetic energy,and stored energy from fuel, to maximize or optimize the total weaponsystem to achieve the desired task.
Energy Maneuverability - is the analysis of maneuverability (the abilityto perform a change, or a combination of changes, in direction, altitude,and airspeed) expressed in terms of energy and energy rate.
Thus, energy mahieuverability is not directly concerned with fuel consumption.Indeed, within the framework of these definitions, it would be possible for a pilotto perform poorly on energy management by exhausting his fuel supply, while using
appropriate or inappropriate energy maneuverability tactics. Howeo.er, as weshall see. use of appropriate energy maneuverability tactics cen result in reducedfuel coneumption.
During the 1975 Advanced Aircrew Display Symposium (2) RADM J. S.Christiansen, USN (Rat.), then the Assistant Deputy Chief of Naval Operations,Aft Warfare, addressed the needs of fighter pilots. He stated, "As a fighter pilot1 . .I want to know how much (aircraft performance) I've got left and I need it(the information) where I can see it." The need for !nformation on how well theai craft's maneuvering capability has been utilized was a topic of considerablediscussion at the 1976 Navy Fighter Weapons Symposium (3).
Some specific requirements for EM data include:
1) Flight Safety. The Commending Officer of the Naval Safety Center reported(4) that during the period from. Aly 1969 to Ipril 1974, forty-two naval aircraft weredestroyed, 8 aircraft were damaged, and 27 deaths were attributable to the lackof integrated V-N (velocity-"g") envelope Information. A review (5) of USAF andNavy accidents involving unrecoverable loss of control revealed that between April1972 and March 1078, 92 aircraft were lost due to stall/spii departures. Forty ofthe 92 aircraft lost were F-4s. These losses did not include any loss due tomechanical failure. The accidert umimary usually listed the pilot as the primarycause and contained a statement such as "Pilot allowed himself to get into a positionfrom which he could not recover."
'•NO,11
-

The quality fighter/attack pilot is an individual who is one with his machine,i.e., he integrates altitude, "g", airspeed, angle of attack with the Zeel and soundsof the aircraft. He creates, in his head, the V-N diagram (which describes theperformance capability of an aircraft In terms of load factor "g" and velocity) or partsof the V-N diagram and, as accurately as possible, locates his aircraft in thrt diagram.!Efforts have been made to present V-N information to pilots but, in most cases, thedisplays did not progress beyond the simulator stage or, if they were flown, theywere flown only experimentally. At present, no integrated V-N information isdisplayed to the pilot aboard operational USAF or Navy aircraft, nor is any integratedinformation displayed for use during debriefings on the Air Combat ManeuveringRange (ACMR). Techniques for displaying energy maneuverability data In flightwill not be discussed in this report, interested readers are directed to Stanley (6) Iand Moroney and Barnette (5).
2) Differences in Present and New Generation Fighters. Because of the highthrust to weight ratios and the low wing loadings of the new generation of fighters,in particuldr the F-16 and the F-18, tomorrow's fighter/attack pilot can gain or loseenergy at a much faster rate thar. he could with present operstitvld aircraft. Pilotsof this new generation of aircraft will need to learn that, at high speeds, keeping thethrottle full forward during air combat maneuvering (ACM) will prevent them fromachieving their tightest turn. The evolution of strakes, slots, and lifting bodyfuselages provides much more subtle cues of aircraft performance than are availablewith today's aircraft. Because of the nubtle nature of these cues, we can expect thenew generation of fighter/attack aircraft to be inadvertently over-stressed and/ortheir capability not maximtmized in ACM.
3) Differences in Aircrews. In ACM the requirement is eyes-out-of-thecoelkpit with a rare glance inside until the target is off the nose. The F-4 pilot hasa Radar Intercept Officer (RIO) or Guy-in-7iack (GIB) to provide altitude/airspeedand weapon status information when needed. However, pilots of future fighters willbe flying single seat aircraft. Thus, the pilot's need for performance information isincreasing while the sources of such information are decreasing.
4) Limited Training Opportunities. Increased fuel/maintenance costs haveincreased training cost; thus, today's fighter/attack pilot can expect less "seat-of-the-pants" experience in ACM and weapon delivery. For ACMR to be truly cost-effective maximum utilization must be made of the data collected in flight.
5) Lack of Energy Maneuverability Training During Pilot Training. Whileacknowledging the Importance of energy maneuverability (EM), most pilot trainingdoes not address it for a variety of reasons, including the technical nature of thetopir, other sllabus requirements, and the inability of many instructor pilots todefine the envelope for themselves, much less for students. An exception to thisdeficiency is the EM course taught at the Naval Fighter Weapons School. Theselectures provide a basis for tactics development and are followed up with in-flightdemonstrations to reinforce the lectures. Additionally, EM is routinely discussedduring the debrief.
2

I'
6) Tactics Development. While an actual air combat encounter lasts only afew minutes, considerable preparation must precede the encounter. A prerequisitefor a successful or at least neutral encounter Is knowledge of the maneuvering cap-ability of both the friendly and adversary aircraft. Prioz to any encounter a pilot mustcompare his energy maneuverability with that of a potential adversary. Armed withthis knowledge the pilot can then develop tactics which favor his aircraft and which inayforce his adversary to fly in a regime where the adversary aircraft has less capability.
For the above reasons an effort was undertaken to develop an EM display foruse on the ACMR. Such a display could use data presently down-linked andreformat it so as to allow aircrew to view thair EM performance and compare it withthat of their adversary. Prior to describing the development of such a display itwould be appropriate to discuss how EM Is utilized in ACM. Air combat ischaracterized by a highly dynamic manouvering environment agahist a nonpredic-table aggressive adversary. Thha arena involves three prime combat situations forone vs one combat: defensive, neutral, and offensive.
a. Defensive
The prime objective for the pilot on the defensive is that of remaining out of
the adversary's cone of fire. The pilot can accomplish this either by turningfaster or by turning ins'de of his opponent. This is where the pilot's knowledge
of his maneuvering capability relative to his adversary is required. If the defensivepilot has too much energy, his maneuvering capability is seriously hampered, both
in terms of altitude and airspeed. On the other hand, if the defensive piot remainsat too low an energy level maneuvering performance is again hampered and, evenworse, the pilot will probably not be given an opportunity to regain lost energy.The defensive combat role is generally characterized by a series of energy lossmaneuve*-s, because maximum maneuvering performance occurs at corner velocity,
the point of maximum onergy loss.
While gaining energy would be useful for increasing maneuvering potential.the adversary would mcbt certainly welcome the defensive pilot's mistake of unload-ing just for the sake of energy gain. On defense the pilot will either force an over-shoot by losing energy faster than the adversary, or increase the adversary'sbearing angle to a point where an energy gain maneuver might be accomplished.
As one would expect, during ;lose-in combat the energy levels of both air-craft are reasonably close together, with the defender setting the pace. If the
atiacker possesses too much energy, he is leaving himself open to a disastrous over-shoot. If the attacker does not possess enough energy, the target will soon out-turnthe attacker. Today's pilot must account for these factors by relating visual inputsto his training and experience. With the advent of aircraft having greater thrustto weight ratios and lower wing loading, these airplanes are able to gain and loseenergy at faster rates than ever before. The area of maneuver ,lisplay technologyis lagging behind these greater maneuvering capabli!itles. In urder for the pilot to
exploit the aircraft's performance to the maximum. he must at all times be aware ofhis relative maneuver conditions and capabilities, and know where his bestcapabilities can be realized.
3.';

b. Neutral
The neutral situation ts a near standoff where neitner airplane can easily gaina positiozil advantage. To break the stalewate one pilot must either capitalize enthe other's mistake or utilize his maneuvering capability te change the situation. Inthis situation discretion may be the better part of valor, and the pilot may chuose tounload and gain energy for separation. On the other hand. ne pilot may choase toexercise a vertical plane maneuver (trading airspeed for altitude). like a yo-yo, toreduce bearing by decreasing his effective turn radius in his adversary', turningplane. As was the case for the defensive airplane, the pilot can be provided valuableinformation about the energy consequences of eacb maneuver to assist In his decisionmaking.
Ce. Offensive
To perform offensive, aggressive combat, positional advantage must beachieved and maintained. The pilot must manasge his energy If he is to maintain hispositional advantage. On the offensive, the chief objective of anargy managementis to maintain the proper use of energy gain-euergy 10s maneuvers relative to theadversary. In an offensive engagement (other than a hit and run) with excessiveenergy, the adversary will attempt to force an overshoot or force the attacked to losetoo much energy. So, for the pilot on the offensive. energy management is necessaryfor achieving and maintaining good positional advantage for subseqaent tracking tasks.
Ul. DEVELOPMENT OF THE EM DISPLAY
Traditionally, V-N diagrams ("g" vs velocity) have been used to describe anaircraft's capabilities and limitations and/or to compare the peformance capabilityof two aircraft. Another method which has been used for theme purposes is turnrate vs velocity. This rate-velocity format provides a simple method for developingtactics that can be explained in terms of the sinple parameter: velecity. An additionalmethod is through Altitude-Mach (H-M) diagrams. These diagrams usually indicatewhere one aircraft has a specific oxcess energy (P.) or "a" advantage with respect tothe other. However. the data, while useful in designing aircraft. are difficult tointerp:et and even more eifficult to evaluate in nonengineering applications. Someof the difficulties associated with the H-M diagrams were documented by Pruitt (7).
0 tnie the H-M diagram was considered inapprupriate. the other two energy man-agement displays were developed with the intention of comparing their suitability foruse with the Display and Debrief Subsystem (DDS) of the ACMR. The DDS of the ACMEprovides the means to review flight data a:nd analyze individual maneuvers or engage-ments. The addition of EM displays to the DDS provides the pilots with informationthat can be used to qualitatively evaluate individual performance. McDonnell AircraftCompany (MCAIR) was awarded a contract in September 1978 to develop these displayconcepts for possible incorporetion into the ACMR. Eventually, a variant on the turnrate va veAocity profile - the maneuver triangle - was selected for incorporation into theACMR. rhe turn-rate vs velocity profile will be discussed first followed by the maneu-ver triangle, the V-N profile, and finally the ACME EM Display. Readers who maynot be familiar with some of the underlying concepts of EM may wish to refer to"Appendix A.
4
I _______ ________A

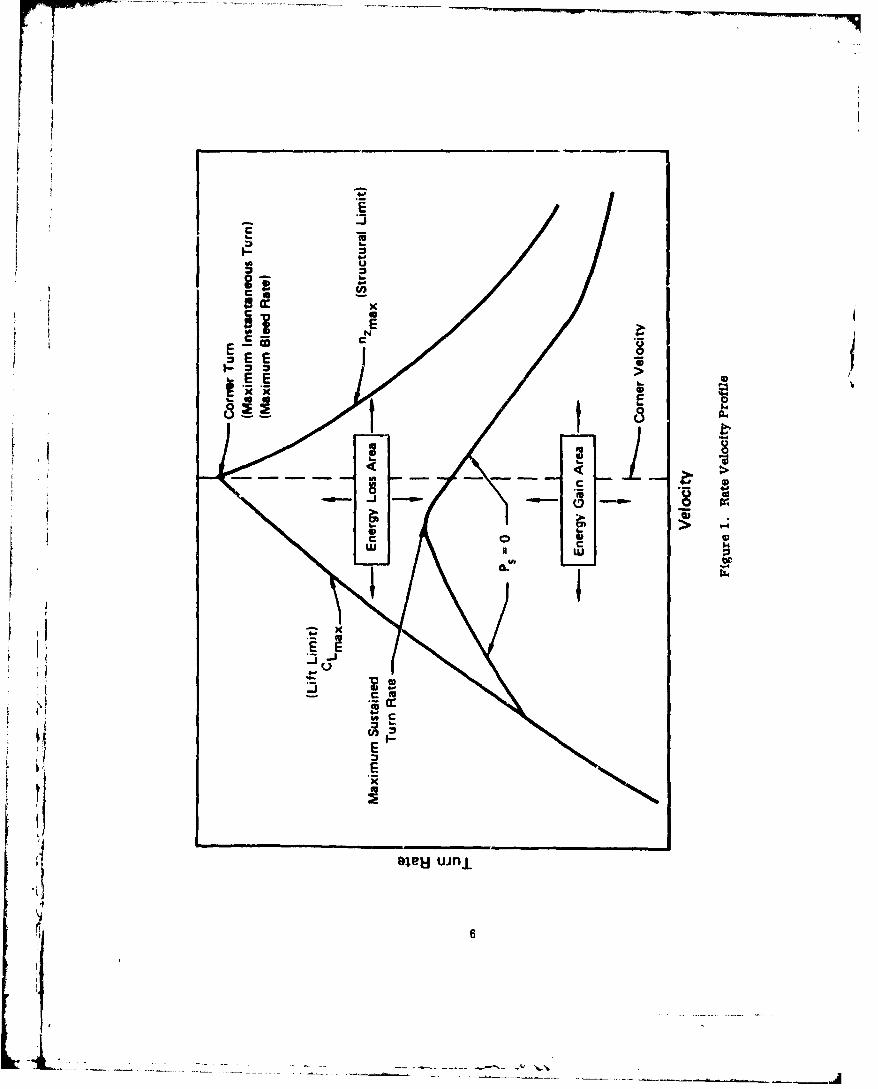
2.1 TURN RATE-VELOCITY PROFIL3
The turn rate-velocity proflie is shown in Figure 1. The left side of the largecone shape represents the aircraft maximum lift limit. or CLm x. The right silerepresents the aircraft structural limit, or specified maximum load facLor. For anygiven v,,locity, these bnundaries represent the maximum turn rate available."Corner turn" is defined as the point where the maximum lift ilmit intersects tihestructural limit. The corner turn point exhibits the highest turn rate possible.The corner velocity, that., is the speed at which the corner turn exists.
Below the maximum limit boundarias, lines of constant Ps (in ft/sec) can be
bhowr, indicatin -- the specific energy loss and gain rates for the aircraft. ThePs = line reprobents the seistaincd turn rate. The point where the sustained turnrate line peaks represents the velocity for the aircraft's maximum sustained turn.
The ares above the sustElned turn rate line represents an area of energy loss,or areas where bleed rates (deceleration) build to a maximum. The maximum loss
occurs at the corner turn. Maximum acceleration occurs where Ps is a maximum.along the base at zero turn rate.
Figure 2 shows the rate-velocity profile for anJ F-4J weighing 39,259 pounds at10,000 feet. The velocity band for maximum bleed rates (negative Ps) and maximumaccelerations (positive Ps) can be easily determined.
These data are valuable for examining individual aircraft performance, butare of little valua in determining how to use the aircraft against a specific threat.This information is obtained by overlaying the rate-velocity profiles for both aircraft.
Figure 3 is a p :ofile of an F-4J and Threat A. When the F-4 is slower than450 FCAS, the th:-at aircraft has a clear turn rate advantage. However, 'he F-4 canout-accelerate the threat and the best F-4 acceleration advantage eccurs 1 .stween375-575 KCAS. Also, if the F-4 and the threat fly sustained turns abo-,;j 500 KCAS,
the threat will be in an energy loss region if the threat tries to turn with the F-4. Thepilot of the F-4 must therefore be careful not to let his airspeed decrease below .,50
KCAS. Since the F-4 has a higher P. at the lower turn rates, it has a superior climbratr advantage over the threat. (P. is also a measure of steady state rate of climb.)This would imply that a useful Lactic is to climb if the threat becomes slow, since theF-4 has the capability to gain energy faster. The turn rate-velocity is thus a valuable
I 'too". When properly used, it can be valuable in developing ACM tactics to exploitstrength.; md weaknesses.
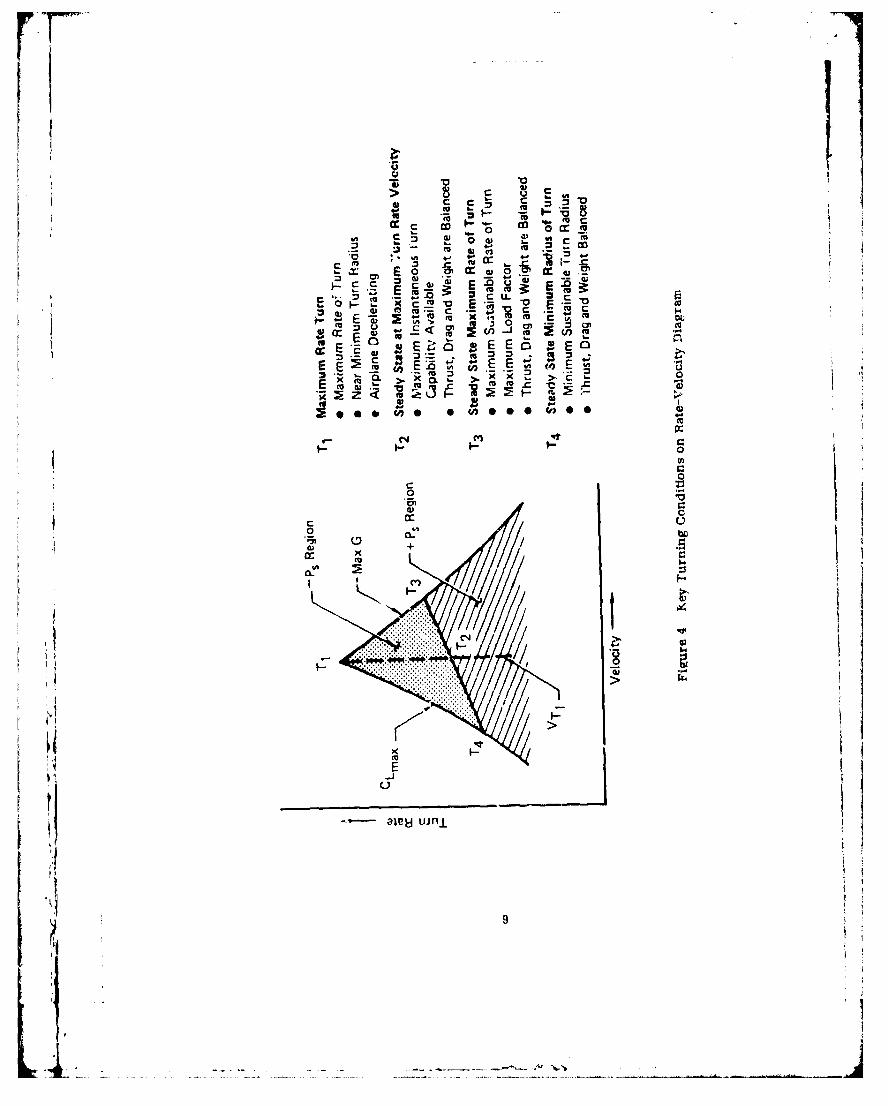
The significant points in the turn rate-velocity plot are shown in Figure 4.The displays are designed to relate maximum maneuvering performance. Therefore,all data represent maximum power giettings. For P. = 0 calculations, drag due tolift ("g") is increased until the drag is squal to the thrust.
5
Ii
II=
-Em
4-.4
(4r
6 a:
E
aCe - Nj

r00
o at
(.0c Cd00 N U
~oes/Bp -19 O)Iuj.ll

-400
12 __________
10 ___ ____ _ __Z10
-200-200
P 00
-j10
0 100 200 300 40 +00 5060 0 0
Alitd 21,00 ft 0 .- 0
IY,
6a
4 N
>1\9200
F0
14E r- 0'
c U
CC - 4ý4,
E Z M(U~ 0
~E2~ ~ EE~ cECc< A
iE.oe*i,. 4
E E EE V(
N
0
00
0r00
0
;14j j) e* I ~m
ajeH uan

Point T, represents the quickest-tightest turn (corner turn) and asstated previously. occurs at the in tersection of the maximum structurallimit boundary.
Point T 2 represents the steady stale turn at the corner velocity. This is
a thrust=drag condition and speed where the quickest-tightest turn isavailable if needed.
Point T 3 represents the maximum steaoy state turn.
Point T4 represents the minimum sustained turn radius. Depending uponthe aircraft's thrust-to-weight ratio turns mry or may not be sustainedbelow this airspeed. The area to the left of the T4 velocity representsan area of low "g" and minimum turning capability, and should be avoidedduring ACM operations, unless a vertical maneuver tactic so dictates.
1.2 MANEUVER TRIANGLE
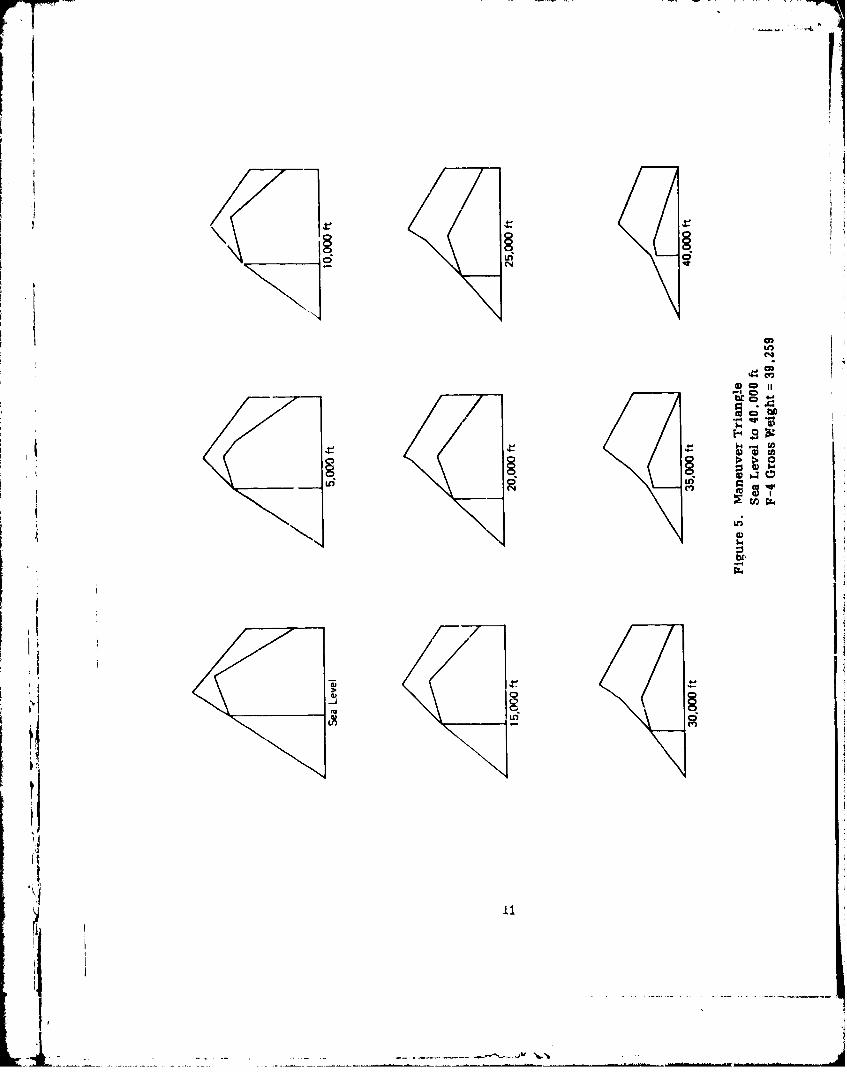
The baseline maneuver triangle is the basic EM display developed and used byMCAIR (1). It is a simplification of the turn rate-velocity profile, showing themaximum limits and the Ps = 0 line. On the original maneuver triangle the verticalscale had been normalized tn a height of 260 display units. Regardless of altitude,the apex remained fixed and represented the current maximum available instantaneousturn rate. The horizontal scale was fixed at 300 display units and represented theaircraft's V for the current altitude. During altitude changes, the corner turnpoint shifte• aterally as a result of the horizontal scale factor changes
Figure 5 represents the F-4s maneuver triangle for 5000 feet incrementsbetween sea level and 40,000 feet. The maneuver triangle for each subsequentaltitude is scaled, based on the maximum turn rate (corner turn) at sea level. Fromthis figure, one can visualize the dynamics of the display as altitude is vpried.
When Initially mechanized on the West Coast ACMR, the display appeared asshown in Figure 6. This pancl represents data for two aircraft, the ManeuverTriangle being for aircraft 1. The small symbol "1" on the display shows thecurrent state within the current envelorie. The small number "2" on the di3playrepresents the current turn rat( and velocity of tihe second aircraft. The lowerportion of the display is the digital display of the porameters shown presently onthe DDS "flight display."
"Ps, V and If were added to show energy rate and the two basic parametersthat contribute to it.fi Figure 7 defines the points used to generate the data on the Display and DebriefSubsystem (DDS) . The variables are defined as follows:
"tI0
10
S. . . . . . . . . , , .
r77
00
CD CDi-' CD
U,%o

tr)N -. O O'
(p I
121

rrr
0
x
- >4j.
'•"I 13
Li .--.- -

VMR = Velocity for the minimum sustained turn radius at specifiedfuel, specified altitudes.
TMR = Maximum horizontal turn rate at VMR.
TMRPS = Sustained turn rate at VMR.
VCT = Corner velocity - velocity for maximum instantaneous turn rateat specified fuel, specified altitude.
TCT = Maximum horizontal turn rate at VCT.
TCTPS = Sustainedl turn rats at VCT.
VXR Velocity for maximum sustained turn rate at specified fuel,specified altitude.
TXR Maximum horizontal turn rate at VXR at specified fuel, specifiedaltitude.
TXRPS = Maximum sustained turn rate occurs at VXR.
VMX = 750 KCAS, or actual Vmax if less than 750 KCAS.
TMXPS Sustained turn rate at VMX.
The units of all velocities are in ft/sec and all turn rates are In deg/sec. Toprovide sufficient data for subsequent construction of the display on the DDS graphics,data for nine altitudes, sea lavel to 40,000 feet, were generated. Tables I-IV representthe data necessary to generate the displays for two F-4 configurations flying out ofMiramar and Yuma. The 5,000-foot altitude increments have been round to provideadequate Interp.olation intervals between data points.
I7or data computation at intermediate altitudes, linear interpolation is performedfor each point defined on Figure 7. The result of the interpolation between two table
altitudes is the data that are used for subsequent display. Prior to use for finaldisplay at any specified altitude the data are scaled based upon the maximum sea levelturn rate.
The data are generated by using a MCAIR-developed computeT program thatbalances thrust and drag as a funntion of "'I" and airspeed to determine the variousturn parameters for specified P, ,els. Each set of data is calculated at a specified
constant gross weight.
2.3 V-N DIAGRAM
A display in the shape of a V-N diagramn was also mechanized. A majordifference between this and a conventional V-N diagram is that the Ps = 0 line isgenerated using m.ximum sustained turn rates in lieu of maximum sustained load
-- 14
.-- 7
*- 00 e (a
w- wC')r- V(a r IT CV oW cu
N N 9f *flQI'M* *C'NU;4;lO 0 u r 0~ o Cv4) wWcuOO~ co oI- fl- 0 0 * * 0CD 0% ftLE)%%% I
#4 ~ ~ q- ob% C 0a V
00 100,1 'r N)C

cu~ 00 *- V,
CUN\ N )or LfIW 4 1 11. ) .N
(1coM MW~ * Us W1 LAWft 41 9w 0(r %~ %1 414Cf 0 0 *L v1Y'q4 .00V0)
CU V IT 400 * <9 - -4 (,, W 41
WOO o0C' .WC'U-j ~ ~ ~ 411) CT 99ft) -4 qw 0 41vi CA (%J V V 4 M o WwI r- C
CDru W00)rf' C W% C O
V *~%CCU *CA
CU r qw ~OWoa(0cnucn
(A (L flJW '.4 V *U) 0 0 V-
0 9 0 41q.4U~U)C')qUW-9 40 W4 * * *- W 4 1
V 00 0 %1 -V C.CA 14 M0 U) W4 'V4W -4 *q 41r%
Ln I 41U) 9 99 4W) %to~ 419.4
0y % >'E 41 1410 'mc)CUc)C
MV) 0WU) 0V 41W M1 M0
N.~~~~ N410.N(LNC
w me
16

rA iUm C urCM %0, 'ecu 0.
*** *r-ýDLJ -OCU
(161 Ln (T) LA .() 61 6106 9 b 46 ob~*)T .f. 0 M Lf) M -WV
Vc)q 00 *r- W- *bt') LA%1 W4 M1 ft4r %100 %1 '.1
* & 0 *.C W C7)OC7O 00
m-4n LA %IVfl 0 *0 0
CU *v, 00 (D 611 WfC)
*m (D Ln W O W,4vQ00"V-4(D CAN to**CU 0V Vl(,~ 00 W r- Vr- (A
CLWW (Y (0 o C * .0) * *'-C- 0) CU n0 V * 00Q 0 V
C"- n0 0 0 %W.4(U.Inr-Lr- U) 0) r 0 *- -4 &flJ 6( 3
E q- q-Q'Tq 000 y400y-4oo(
('- W-4 r- *.w4 %M 1(
CUL I -4 *U). CA * - * 600
61 61 01 WQ-4 V.4 W. -4 61
Q'~0 -4 61 61 61 N 4 W-4 * 61~~~4M CD *4C %V %10v4')00U
t] LnV %0 w bl-0
17
NWu *
* 0 ~ C 0 CV~j)
*~W 9f 00 0 r- 0w
W-4Ir A C) Opn .- ccco u
~~(w~. -(.D rOO w4I(aqq C;C rqqAc) -C
G) (D r- J*bOf 0.99
C" Ln9 cy, Lf COfq -. Lp ,q4 - CU C
Wvo9 w 9 bv0 V4 0 0(.
.- % %u ftcu V IlW %.(Y)%
.0- 0 W) %0 w4 9 * *or
o4 Lo o m~W r-!. wfl F
3 ruwf'CqI~ (U*.-*.-.rU
F4 ft%9- asq..
M0 I *)W 9rU
a -q'. cuU)v o- co *wJOJCU 0 rq 4C -*,-$ 0 .0 4,6IUT WO- bU%m aV4*Ac o
NOV ~18 Ia W
% 9_V

factor. If actual maximum sutained "g" were displayed, the pilot would be suppliedwith incorrect velocity information. For example, Rn F-4 weighing 39,259 pounds at10,000 feet rearches maximum sustaining "g" at 546 KCAS. The maximum sustainedturn rate occurs at 513 YCAS. The sustained turn rate at maximum sustaiued "g" is lowerthar the mnximuv sustained turn rate and the turn radius is approximately 700feet larger. Velocity data obtained from a turn rate-velocity profile in a classroomcould not be correlated unless this display change were made. Turn rate is convertedinto ,gn by using the following expression:
g = / (9 * V/1845.06) 2 + 1
where: 9 = turn rate (deg/sec)
V = velocity (ft/sec) TAS
The associated display diagram is shown in Figure 8,
where:VNTRM SQRT ((TMR VMR/1845.06) 2 ,1)VNTMRPS = SQRT ((TMRS * VMt/1845.06) 2 + 1)
VNTXRPS = SQRT ((TXRPS * VXR/1845.06) 2 + 1)
VNTCT = SORT ((TCT * VCT/,485.06) 2 + 1)
VNTCTPS = SQRT ((TCTPS * VCTi1845.C6) 2 + 1)
VNTMX = SQRT ((TMX * VTMX/1845.06B + 1)
VNTMXPS= SQRT ((TMXPS * V7MC/1845.06)2 + 1)! VNTXR + SORT ((TXR * VMR/1845.06) 2 + 1)
S~Figures 9 through 11 show the V-N diagram for an F-4 at 41,500 pounds using
various vertical scale factors. The vertical scale of 150 units was selected sinceit more closely represented the classical shapo of a V-N diagram. The horizontalscale remained at 300 units.
,: gure 12 represents the V-N diagram as It appears on the ACMR DDS scope.
Using the points calculated from the above equations, th,_ data may be used directlyif zero "g" Is used as a base. Since the area between zero "g" and I "g" Is of no value,the base of the V-N diagram has been adjusted to a base of 1 "g". A base :f zero wasused; however, unity was subtracted fri m all load factors prior to the final displayplot. This technique allows the use of he ad,17tonal area for display. V and Hhad not been added when this frame was taken. Tne information on the lower portionof he display is the same as for the rate-velocity display.
'I 19'•I.]
L i _

rvdzzII I
xz a:
>4 x
>0
4 1L
zz
20

CD
ad g m
In >

r.iI
VVCD
Cd
c; qd
C4 (n ;
22o

0 (%j C4C
CD
,II
La
V-4
23

hi ID
N U')- f o
CV) (f)
I Ifr%~u.~NZ
D :D*1J (DC DIL%CDC
It)Y l ICD -CD ID
s
24
2.4 ACMR EM DISPLAY
During the initial portion of this program both the basic Maneuver Triangleand V-N display were mechanized. The preliminary verification of the entry datatables, algorithms, and scale factors was made by generating the display format shownin Figures 13(a), (b), (c), (d), and (e). (HMD-1 represents the maneuver triangleand EMD-2 the V-N display.)
The symbol "0" represents the turn rate-speed position of the simulated aircraftwithin the maneuver triangle. Three potentiometers on the DDS control panel wereused to manually select altitude, "R", and velocity representing aircraft inputs. Var-ious altitudes, speeds, and "g" were selected and hardcopy prints similar to those
shown in Figure 13 were made. Date points used to generate the display and the presentposition indicator were manually scaled and calculated using the hardcnpy print.
Any discrepancies found were correctcd using this technique throughout the ..ompletealtitude, speed, and load factor range. Verification consisted of comparing the dis-play values to table input values and calculated input values.
Once the data had been verified, this portion of the software program wasremoved and ,he displays were implemented to operate with an ACMR replay tapa.The present position indicator displays the aircraft's current position within theenvelope. Its operation was verified using selected maneuvers from an P-4 one vs
one engagement. Appendix B provides additional detail on the present positionindicator.
The replay tape was ztopped at several positions throughout the engagement.Each time the tape was stopped, the "Engineering Data" display was called up. The
downilinked and computed display data were compared to the data on the EM display.Unfortunately, the ACMR complex does not have the facilities to print a hardcopy ofa data time history. Verification of data was performed by manually scaling dataoff the display and comparing the scaled data with the 'engineering display' data.To allow ior the impact of weight changes on P., it was necessary to provide correc-tions for the EM displays. The nature of these corrections is specified in Appendix C.
Turn rates were considered acceptable if within 1.0 0/sec and velocity within 5KTS. This verification was performed on tapes where the fuel quantity was known
from pilot reports. (Range conditions during this period of time did not permit anF-4 to fly specific profiles for subsequent verification.) Based on the scalingperformed, it was concluded that the EM displays reflect correct F-4 performance.
After the displays were verified to display correct data, they were shown topilots at NAS Miramar to obtain comments.
'I Pilots from the Navy Fighter Weapons School (TOP GUN) provided valuableassistance in providing operationally usable displays. An initial critique from TOP
GUN indicated that since aircraft comparisons are made on the basis of turn rate andvelocity, that format would be superior to the V-N display for training purposes.Since the turn rate-velocity method is now being used by the Navy to develop tactics,
25

00 v1* NNa0V 0 NN
26a

IFI
CD
0 - 1,-V'O
0O 0 0 f N f 0 N NN N Nof If4.
13) I .>
I 27

ClH 0 CtC4 IDIPk
. "!fUý3jcya~gm- 0
P-NO OOO-N
28

CD'
Cý40
on
C2, CC
U, in' I
V 29

CD
4.'
I- c . -F. 17 1114
DK u14 rN .,,j4 7, a AIkI in1- j; - n0 J- t- , z I
'D COA 0 1
C300T
Ni P- Of 0 o-r .

TOP GUN indicated that It would be desirable to show the turn-rate displays for bothaircraft on the ACMfl display. By having the maneuver triangle for each aircraft,debrief crews could observe how each pilot was using his inergy tn counter movesby the other.
Navy pilots recommended that the base scales be changed to indicate 750 KCASas a maximum. As a result of this change, data are calculated in true airspeed, thenconverted to calitbrated airspeed for display. Vertical scaling was also changed.
These changes resulted in the display shown in Figure 14. The sea leveltable of the corner turn for each aircraft is used to establish which of the two com-peting aircraft has the highest turn rate. This value i. then used as the verticalscale for both aircraft. The display for each aircraft is then scaled based upon thi .value. The small numbers on the display portray the aircraft's current state withinits maneuvering envelope. By observing both displays in the horizontal plane, itbecomes an easy task to determine which aircraft has the turn rate advantage andhow each pilot is using his performance and energy for the situation. Also, the dataportrayed are now the same as the data used in the classroom.
It was also quickly learned that the maneuver triangle must be in conjunctionwith the 3-D display to obtain the most benefit from the ACMR debrief. The 3- Ddisplay is used to determine relative positioning, while the EM display is used toobserve maneuvering potential. The addition of the EM display often showsdynamically why mistakes are made.
During the verification phase, it was proposed that the two EM displays beintegrated, the figures overlaid, and the data below the figure be rescaled. Anillustration of the alternate display is contained in Figure 15. The solid line outlinesthe maneuvering triangle of aircraft 3, while the dashed line outlines the maneu-vering triangle of aircraft 4. Aircraft 3 and aircraft 4 are dissimilar types. Anexamination of Figure 15 will reveal that aircraft 4 Is in an area of energy loss, belowcorner velocity, losing altitude, but maintaining constant velocity by trading altitudefor airspeed. Aircraft 3 is in an area of energy gain, slightly below coriaer velocity,in a slight climt:, and maintaining a constant velocity. It can be noted from thefigure that for the altitudes indicated (approximately 23 Kft), aircraft 4 has a consider-ably higher CL than aircraft 3, a lower corner velocity (CV) than aircraft 3 and aturn rate approximately twice that of aircraft 3. Assuming a tactical situation, In whichaircraft 3 and aircraft 4 are commencing a turn toward each other, then if aircraft 4attempts to turn toward aircraft 3, aircraft 4 will very rapidly loso energy and be forcedto fight at a lower airspeed. It should be noted that due to aircraft 4's higher CLmax. air-craft 4 will have a substantially smaller turning radius at the lower airspeed. Alternately,if aircraft 3 remains in the Prea of energy gain, ne may accelerate to CV and whentactically appropriate, he may turn at his CV. It would be unwise for aircraft 3 toengage aircraft 4 at less than approximately 450 KTS (aircraft 3's CV). Alternately,if aircraft 3 dives to gain airspeed, aircraft 4 could then use its better turning cap-abilities at the lower altitudes.
31

I-
cx 0
32,Lfl..
• •, -. ~>" O
K,,r.,' 0 ,
__ __ _ __ __ _
32
It
ii ill

LI.UE LL4
U) C3
CDC
-J D
100
e0 >
Iý C) tn w
f C)
CID
'IOp
L ------ -1C
~~5% 0~ N
CL'
LO'
<fl L9 0. -~ ,~
Qý LAJ L9 6)
33

Figure 15 is based on dissimilar aircraft types. Presently, data are available
at the ACMR which will allow comparisons of not only the F-4 but the F-14, F-5, andA-4 against similar or dissimilar aircraft types.
2.5 VIDEO TAPE PRESENTATION
With the availability of the new EM displays at the West Coast ACMR, atleast two video tapes will be made to serve as training and briefing supplements.The first tape will be a short summary, lasting about 15 minutes. It will includea short overview on energy management and dissimilar aircraft comparison. Follow-ing the overview will be a nontechnical description of the EM• displays, followed bya sample of a debrief using a short engagement segment.
The second tape being made will be 80-90 minutes long. This tape can beused for training and refre.hers by squadrons using the ACMR. The first part ofthe tape will cover the '"anergy management" and "aircraft comparison" lectures,presently given by TOP GUN. Added to this will be a debrief session, coveringdisplay usage and including an actual analysis of a one-vs-one engagement on theACMR.
III. CONCLUSIONS
Based on preliminary indications, incorporation of the EM displays into theACMR should enhance ACM training. The display format proposed was acceptableto both flight crews and the evaluating pilots of the Naval Fighter Weapons School(NFWS), who indicated that the displays should become part of the Navy training assoon as possible. The Commanding Officer, NFWS (8) stated, "The Energy Maneu-verability Display on the ACMR represents a large step forward in the understand-ing of EM concepts by fleet fighter aircrews and its effect on air-to-air tactics."
theCommander Naval Air Systems Command (AIR 06E) has requested (9) thatthe display developed under this program be made available for incorporation intothe ACMR/TACTS. As requested, the software and documentation have been madeavailable to Commander, Fighter Wings Pacific by the Commander, Pacific M'ssileTest Center (10).
It should be noted that the EM display is designed for qualitative use andshould not be used for detailed quantitative performance assessment. The methodof approximating weight and fuel used is adequate only for qualitative usage.
IV. RECOMMENDATIONS
Recommendations are listed below:
1. The alternate display format, Figure 15, should be implemented to replace* Figure 14.
34* I

2. An evaluaton of the effectiveness of the display and video tapes shouldbe performed.
3. The display and associated video tapes need to be formally integrated intoACMR/TACTS training and performance evaluation program.
4. A concerted effort should be made to obtain more information on weightand fuel flow, to determine the overall accuracy of the weight approximation.
5. Consideration should be given to incorporating EM displays at otherACMR/ACMI. At these other facilities, the use of multicolor displays may enhancethe overlay technique.
6. Consideration should be given to incorporating EM displays into ACMtrainers such as the F-14 Air Combat Maneuvering Simulator and the USAF Simulatorfor the Air-to-Air Combat.
35
435- '...... j

V. REFERENCES
1. Pruitt, V. R., Within visual range energy management display. Report MCDA 3504. St. Louis, Mo.: McDonnell Aircraft Company, October 1974.
2. Second Advanced Aircrew Display Symposium, Naval Air Test Center, PatuxentRIver, Md, 23-24 April 1975.
3. 1976 Navy Fightec Weapons Symposi. n, Results end Recommendations (Confl-dential), NAS Mirmar, Ca., 14-16 July 1976.
4. COMNAVSAFCEN MSC 250731Z APR 1974. Survey of accidents of tactical aircraftinvolving pilot loss of control.
5. Moroney, W. F., and Barnette, J. F., Development of a helmet mounted lightemitting diode display and its application as an energy maneuverabilitydisplay. Pt. Mugu, CA.: Pacific Missile Test Center. In preparation1980.
6. Stanley, R., Limited flight evaluation of a helmet-mounted tact" -- ! maneuveringdisplay aystem on the NT-38A aircraft. Report SY-115R-79. PatuxentRiver, MD.: Naval Air Test Center, November 1979.
7. Pruitt, V. R., Energy management display system for a tactical fighter (U)(Confidential). AAFDL-TR-73-38. Wright-Patterson APB: USAF FlightDynamics Laboratory, April 1973.
b. Commanding Officer, Navy Fighter Weapons School letter of 7 May, 1979.Evaluation of energy maneuverability display (EMD); Incorporation intothe Air Combat Maneuvering Range (ACMR).
9. COMNAVAIRSYSCOM MSG 040805Z, January 1980, ACMR/TACTS EnergyManeuverability Program.
10. COMPACMISTESTCEN letter of 20 March 1980, Ser A385 to NAVAIRSYSCOM0BE, 340F, and 413. Subject: Energy Maneuverability Program: Transferof Documentation for. SSIC #1226/3960.
I I
: 36
Ii.
APPENDIX A
ENERGY MANEUVERABILITY AND DISPLAY CONCEPT BACKGROUND
hi
A-1
No
APPENDIX A
ENERGY MANEUVERABILITY AND DISPLAY CONCEPT BACKGROUND
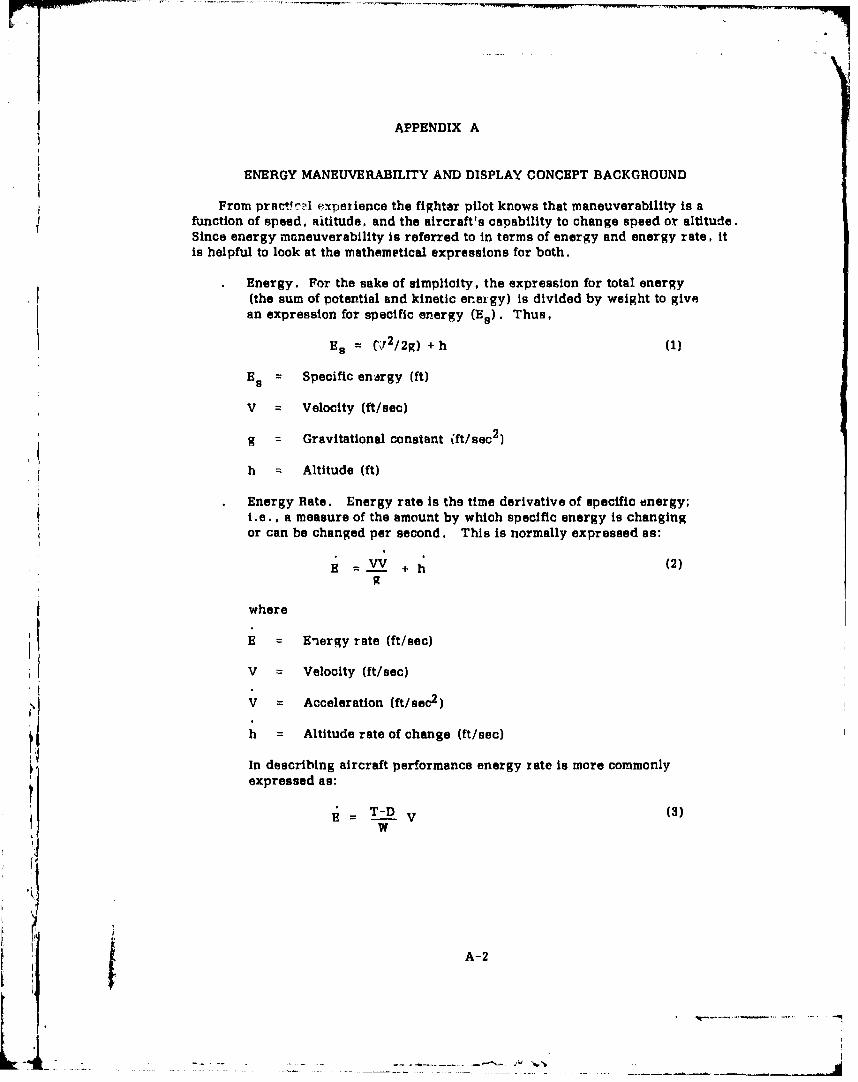
From prac-r!, experience the fighter pilot knows that maneuverability is afunction of speed, aititude, and the aircraft's capability to change speed or altitude.Since energy maneuverability is referred to in terms of energy and energy rate, itis helpful to look at the mathematical expressions for both.
Energy. For the sake of simplicity, the expression for total energy(the sum of potential and kinetic erergy) is divided by weight to givean expression for specific energy (E.). Thus,
Es = (,2/2g) + h (1)
Es = Specific en'argy (ft)
V - Velocity (ft/see)
g Gravitational constant Wft/sec 2)
h Altitude (ft)
Energy Rate. Energy rate is the time derivative of specific energy;i.e., a measure of the amount by which specific energy is changingor can be changed per second. This is normally expressed as:
E = VV + h (2)
where
E E'nergy rate (ft/sec)
V = Veloolty (ft/sec)
V - Acceleration (ft/sec2 )
h Altitude rate of change (ft/sac)
In describing aircraft performance energy rate is more commonly
expressed as:
T-D V (3)E W
A-2
f7
IIt

where
E = Energy rate (ft/sec)
T = Thrust available (ibs)
D = Total drag (Ibs)
W = Aircraft weight (ibs)
V = Velocity (ft/sec)
When expressed in this way energy rate is commonly referred to as P9 orspecific excess power. Equation (3) is derived by first summing the forces aboutthe aircraft's center of gravity. The forces can be 5xpreased as
F=T-D-WsinT =Ma (4)
where
F = Force (lbs)
T = Thrust (lbs)
D = Drag (Ibs)
W = Weight (lbs)
T = Aircraft flight path angle
M - Mass (Slugs/ft3 )
a = Acceleration (ft/sec2)
Solving for (a) in equation (4) and substituting it for V in equation (2)
E = VI S. (T-D-WsinT) +VsinTg W
where
VsinT = h
and simpifying
V (T-D-WsinT) + VsinT V(T-D)W W
A-3
I:'.
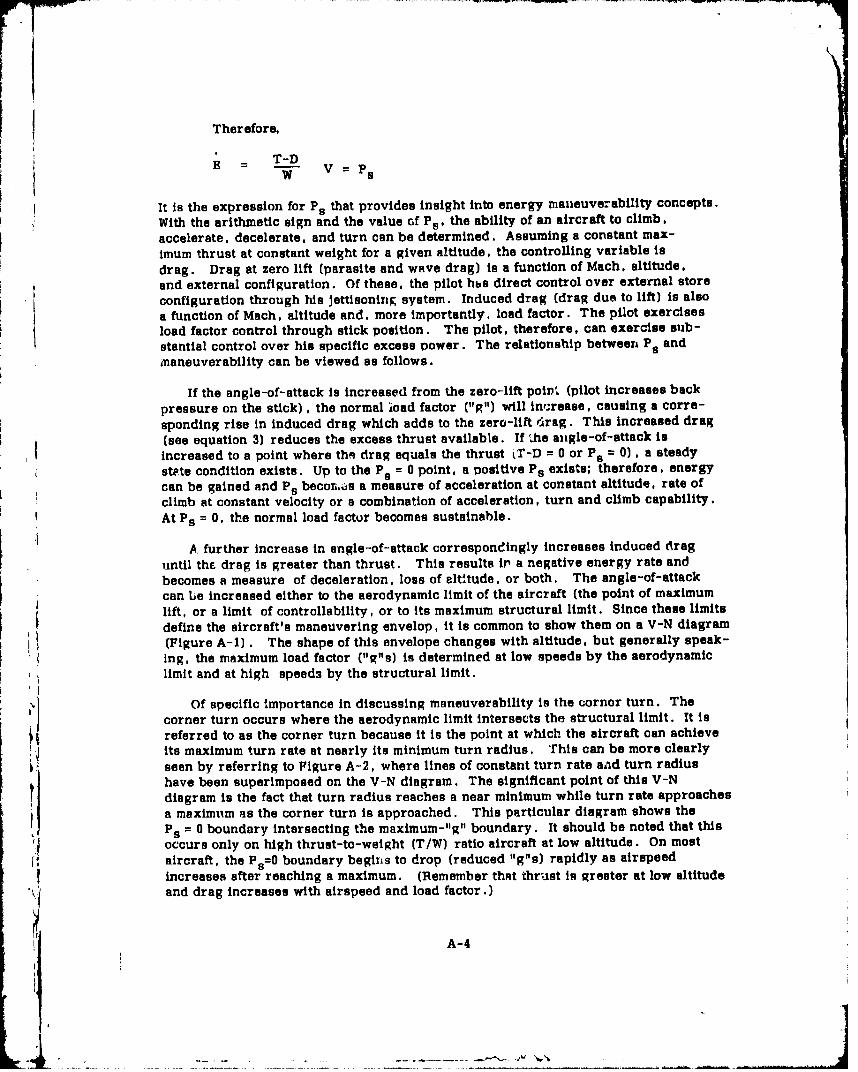
Therefore,
T-DE = V=ps
It is the expression for Ps that provides insight into energy maneuverability concepts.
With the arithmetic sign and the value of Ps. the ability of an aircraft to climb,
accelerate, decelerate, and turn can be determined. Assuming a constant max-
imum thrust at constant weight for a given altitude, the controlling variable is
drag. Drag at zero lift (parasite and wave drag) is a function of Mach, altitude,
and external configuration. Of these, the pilot hhs direct control over external store
configuration through his Jettisoning system. Induced drag (drag due to lift) is also
a function of Mach, altitude and, more importantly, load factor. The pilot exercises
load factor control through stick position. The pilot, therefore, can exercise sub-
stantial control over his specific excess power. The relationship between P5 and
mianeuverability can be viewed as follows.
If the angle-of-attack is increased from the zero-lift poizV, (pilot increases back
pressure on the stick) , the normal load factor (lg") will inr'.rease, causing a corre-
sponding rise in induced drag which adds to the zero-lift rdrag. This increased drag
(see equation 3) reduces the excess thrust available. If ,he angle-of-attack is
increased to a point where thm drag equals the thrust tT-D = 0 or P. = 0), a steady
stete condition exists. Up to the Ps = 0 point, a positive P5 exists; therefore, energy
can be gained and P. becorwas a measure of acceleration at constant altitude, rate of
climb at constant velocity or a combination of acceleration, turn and climb capability.At Ps = 0, the normal load factur becomes sustainable.
. further increase in angle-of-attack correspondingly increases induced drag
until th6 drag is greater than thrust. This results in a negative energy rate and
becomes a measure of deceleration, loss of altitude, or both. The angle-of-attackcan Le increased either to the aerodynamic limit of the aircraft (the point of maximum
lift, or a limit of controllability, or to its maximum structural limit. Since these limits
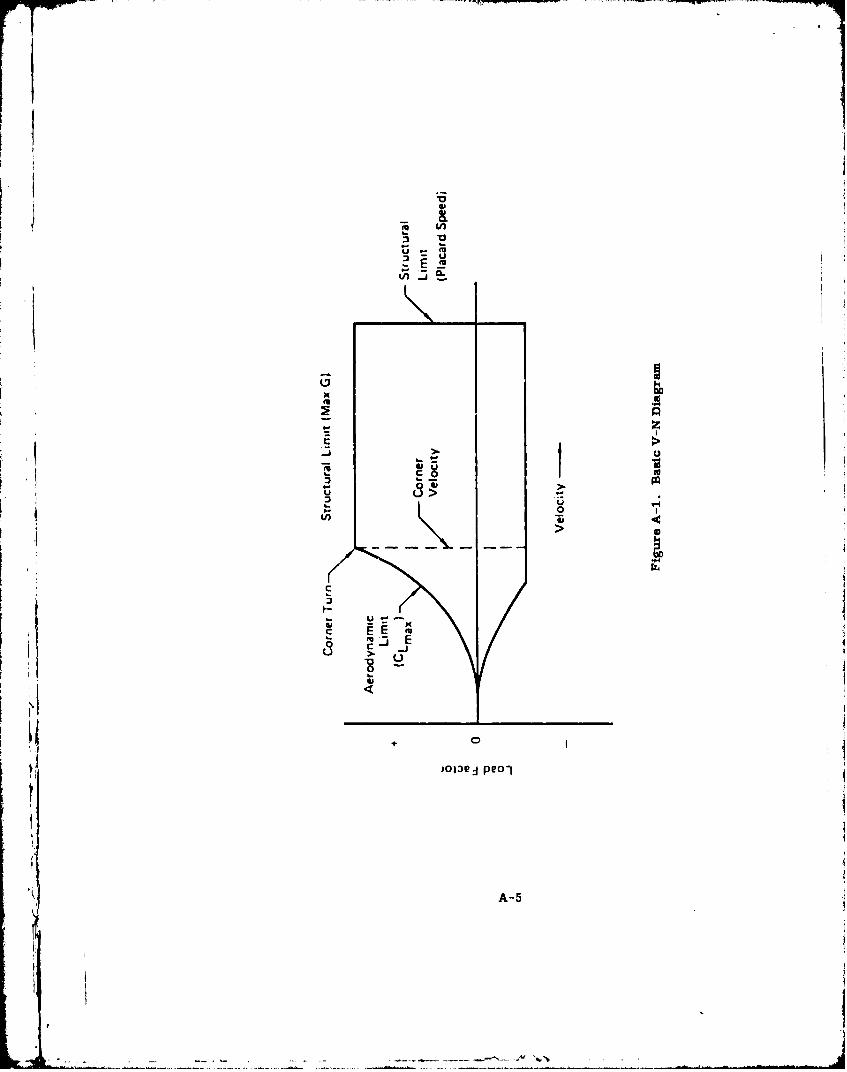
~I define the aircraft's maneuvering envelop, it is common to show them on a V-N diagram(Figure A-1) . The shape of this envelope changes with altitude, but generally speak-ing, the maximum load factor ("g"s) is determined at low speeds by the aerodynamiclimit and at high speed3 by the structural limit.
Of specific Importance in discussing maneuverability is the cornor turn. The
corner turn occurs where the aerodynamic limit intersects the structural limit. It isreferred to as the corner turn because it is the point at which the aircraft can achieveits maximum turn rate at nearly its minimum turn radius. This can be more clearly
seen by referring to Figure A-2, where lines of constant turn rate anid turn radius
have been superimposed on the V-N diagram. The significant point of this V-Ndiagram is the fact that turn radius reaches a near minimum while turn rate approachesa maximium as the corner turn is approached. This particular diagram shows thePs = 0 boundary intersecting the maximum-||g"| boundary. It should be noted that thisoccurs only on high thrust-to-weight (T/W) ratio aircraft at low altitude. On mostaircraft, the Ps=0 boundary begins to drop (reduced "g"s) rapidly as airspeed
increases after reaching a maximum. (Remember that thrust is greater st low altitude
and drag increases with airspeed and load factor.)
A-4
I -j U
IA--

P, C4
cn)
Ep W
L
GCD
(N
B. olae1 peo-I
A-6
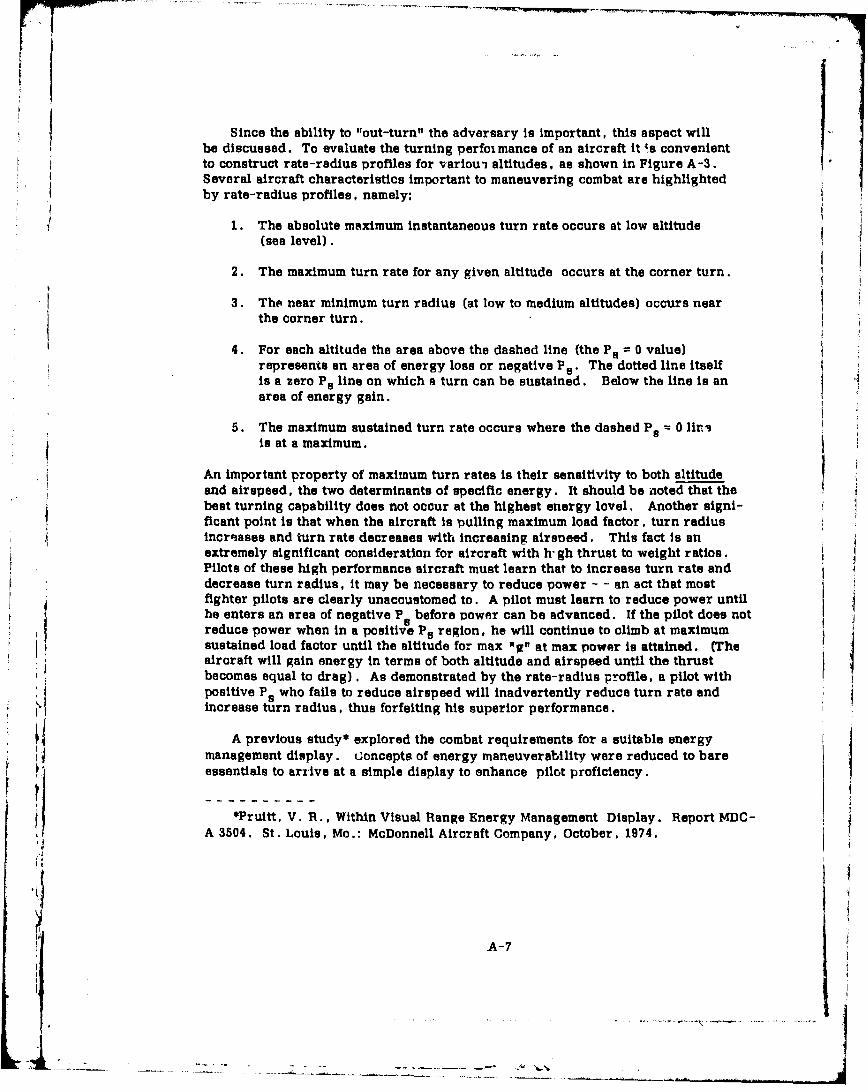
Since the ability to "out-turn" the adversary is important, this aspect willbe discussed. To evaluate the turning perfoi mance of an aircraft it 's convenientto construct rate-radius profiles for variou- altitudes, as shown in Figure A-3.Several aircraft characteristics important to maneuvering combat are highlightedby rate-radius profiles, namely;
1. The absolute maximum instantaneous turn rate occurs at low altitude(sea level).
2. The maximum turn rate for any given altitude occurs at the corner turn.
3. The near minimum turn radius (at low to medium altitudes) occurs nearthe corner turn.
4. For each altitude the area above the dashed line (the P. = 0 value)represents an area of energy loss or negative P". The dotted line itselfis a zero P5 line on which a turn can be sustained. Below the line is anarea of energy gain.
5. The maximum sustained turn rate occurs where the dashed P. 0 liriis at a maximum.
An important property of maximum turn rates is their sensitivity to both altitudeand airspeed, the two determinants of specific energy. It should be noted that thebest turning capability does not occur at the highest energy lovel. Another signi-ficant point is that when the aircraft is pulling maximum load factor, turn radiusincrases and turn rate decreases with increasing airseeed. This fact Is anextremely significant consideration for aircraft with h' gh thrust to weight ratios.Pilots of these high performance aircraft must learn that to increase turn rate and
decrease turn radius, it may be necessary to reduce power - - an act that mostfighter pilots are clearly unaccustomed to. A pilot must learn to reduce power untilhe enters an area of negative P5 before power can be advanced. If the pilot does notreduce power when in a positive P5 region, he will continue to climb at maximumsustained load factor until the altitude for max "W" at max power is attained. (Theaircraft will gain energy in terms of both altitude and airspeed until the thrustbecomes equal to drag). As demonstrated by the rate-radius profile, a pilot withpositive P. who fails to reduce airspeed will inadvertently reduce turn rate andincrease turn radius, thus forfeiting his superior performance.
A previous study* explored the combat requirements for a suitable energymanagement display. Concepts of energy maneuverability were reduced to bareessentials to arrive at a simple display to enhance pilot proficiency.
*Pruitt, V. R., Within Visual Range Energy Management Display. Report MDC-
A 3504. St. Louis, Mo.: McDonnell Aircraft Company, October. 1974.
A-7
--

B5iO~Sp31 00 (Dq
c c
*G.3
4.3:!, I E
I C*6.
0 (0
IiNil)
q~ij I i Poo
I V.
A-8
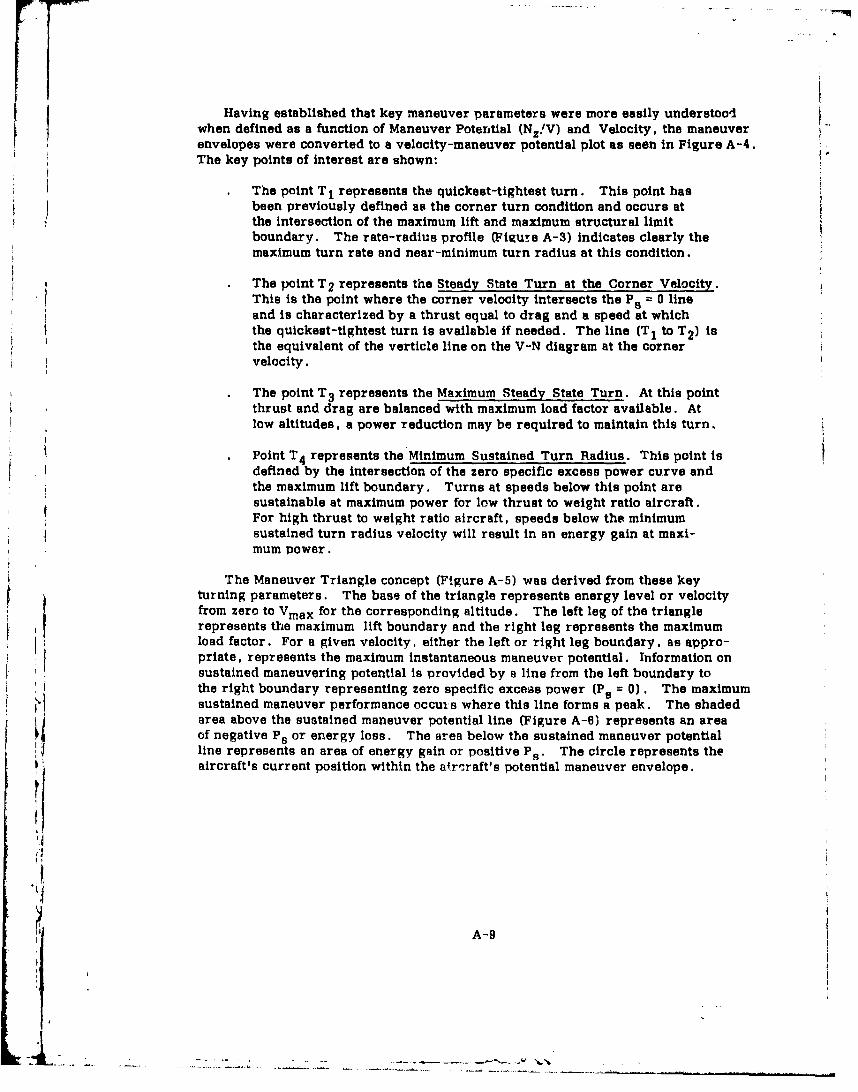
Having established that key maneuver parameters were more easily understoodwhen defined as a function of Maneuver Potenitial (NZ/V) and Velocity, the maneuverenvelopes were converted to a velocity-maneuver potential plot as seen in Figure A-4.The key points of interest are shown:
The point T1 represents the quickest-tightest turn. This point hasbeen previously defined as the corner turn condition and occurs atthe intersection of the maximum lift and maximum structural limitboundary. The rate-radius profile (Figu•-e A-3) indicates clearly themaximum turn rate and near-minimum turn radius at this condition.
The point T 2 represents the Steady State Turn at the Corner Velocity.This is the point where the corner velocity intersects the P1 = 0 lineand is characterized by a thrust equal to drag and a speed at whichthe quickest-tightest turn is available if needed. The line (T 1 to T2 ) isthe equivalent of the verticle line on the V-N diagram at the cornervelocity.
The point T 3 represents the Maximum Steady State Turn. At this pointthrust and drag are balanced with maximum load factor available. Atlow altitudes. a power reduction may be required to maintain this turn.
Point T4 represents the Minimum Sustained Turn Radius. This point isdefined by the intersection of the zero specific excess power curve andthe maximum lift boundary. Turns at speeds below this point aresustainable at maximum power for low thrust to weight ratio aircraft.For high thrust to weight ratio aircraft, speeds below the minimumsustained turn radius velocity will result in an energy gain at maxi-mum power.
The Maneuver Triangle concept (Figure A-5) was derived from these keyturning parameters. The base of the triangle represents energy level or velocityfrom zero to VmaX for the corresponding altitude. The left leg of the trianglerepresents the maximum lift boundary and the right leg represents the maximumload factor. For a given velocity, either the left or right leg boundary, as appro-priate, represents the maximum instantaneous maneuver potential. Information onsustained maneuvering potential is provided by a line from the left boundary tothe right boundary representing zero specific exceas power (P9 = 0). The maximum1 sustained maneuver performance occurs where this line forms a peak. The shadedarea above the sustained maneuver potential line (Figure A-6) represents an areaof negative P. or energy loss. The area below the sustained maneuver potentialline represents an area of energy gain or positive Ps. The circle represents theaircraft's current position within the aOriraft's potential maneuver envelope.
"AiA-9

c c
0 l
cc 'se u
C ~ L C Du e
E ~ ~ E, 4- E
- 0
N -q -6 -
N ~C
2~. o(0 -/
U ~ criL .....
c >0r u
0
A-1
C~r
E :0
E 0
A-11
jv-

rr __ --
C7r
LU U,
IIC
A-12.

APPENDIX B
PRESENT POSITION INDICATOR
B-1
B-
- -- ----!-'-~ ,,'
APPENDIX B
PRESENT POSITION INDICATOR
A present position indicator displays the aircraft's current position within itsturn rate-velocity envelope. This indicator is prevented from exceeding theCLrmax boundary by comparing the present turn rate with the interpolated CLmaxboundary turn rate. Even though the aircraft can remain airborne outside theCLmax boundary (for example during slow speed over-the-top maneuvers), MCAIRpilots recommended that the display limit be established, to avoid confusion. Thepresent position indicator is, however. allowed to exceed the specified maximum"g" limit.
For the F-4, a maximum value of 6.5 "lgs was used. If the aircraft exceeds
6.5 "1glvs the present position indicator indicates the actual rate on the display abovethe Nzm x limit line. The base has been calculated so that any time the aircraftis less tMan 1.1 "gl•s, the turn rate is set to zero.
On the ACMR display, the center of the numeric character representing theaircraft is the current turn rate-velocity loCation.
B-2
f --
!!
APPENDIX C
CORRECTIONS FOR CHANGES IN GROSS WEIGHT
' I 4
1
C-i
......-.... -.-1. i•7•Žo.>Ž...~.~____

APPENDIX C
CORRECTIONS FOR CHANGES IN GROSS WEIGHT
Recalling that the expression for specific excess power to
P -= T-.D V,W
it can be seen that weight is a significant variable. Due to the change in weightas fuel burns, it is necessary to provide corrections for the EM displays. Twomethods were considered. The first was to enter data for at least three weights,and interpolate the data, causing the display to shift slightly as fuel is burned.
Figure C-i shows display shifts for an F-4 at three fuel weights: 25 percent, 50percent, and 75 percent of on-range fuel. On-range fuel is the total fuel estimatedfor use while on the ACMR range for a particular aircraft.
The second method is to correct the present position indicator to reflect weightchange. The second method was chosen, to reduce the number of tables necessaryfor al! potential future aircraft using the ACMR. Details are discussed below.
Unfortunately, neither gross weight nor fuel quantities is available throughthe ACMR downlink. Therefore, a method of approximating fuel weight wasdeveloped. Table C-I shows the values that are used as basic input weights. Theempty weight is the operating weight empty of an l-4J. The Navy defined typicalF-4 configurations that are used on the ACMR. Both are equipped with one AIM 9and one AID Pod. The difference between the two entries for each location is thecenterline tank. Therefore, the weight of 2 pylons and LAU-7A launchers and 2AIM-9 missiles was added to the empty weight, as shown on the table. The AID Podwas assumed to have the same weight and aerodynamic characteristics as the AIM-9.
The "on-range" fuel was supplied by the NFWS as the average fuel on boardwhen arriving at the West Coast ACMR from Miramar or Yuma. Also supplied wasthe BINGO fuel necessary to return to Miramar or Yuma. The difference betweenthe on-range fuel and the BINGO fuel is the fuel available for ACM.
Since data need to be provided for only one weight, the 50 percent pointwas chosen. One half of the fuel available for ACM was added to the Bingo fuelstate and the empty weight to determine the "50 percent display gross weight." Alldata tables used for display mechanization were constructed using these weights.
The present position indicator on the EM display is corrected by multiplyingthe aircraft current turn rate by a weight ratio:
PRESENT WEIGHTWTRATO = 50% DISPLAY GROSS WEIGHT
C-2

LL I'-
C-3

r~ 1 rd
'-I (J(Y~C) R -S(O ~ 9
I.- c 4 4 o c .CV)
ai~~ W;r; -d
C44
C-4

if
If the aircraft is lighter than 50 percent display gross weight, the present position
indicator is corrected downward. If the aircraft is heavier, the turn rate isadjusted upward.
The next step was to devise a method of approximating current fuel weights.ACMR range times were provided by the NFWS, and the average was determinedto be about eight minutes. During those eight minutes, the allowable range fuel willbe consumed. For each location and configuration, an average fuel flow was cal-culated. Logic within the ACMR Control and Computation Subsystem (CCS) "knows"when the using aircraft crosses the range boundaries. As the aircraft crossos therange boundaries, the average calculated fuel flow is used to correct the fuel-on-board estimate. (When the ACMR starts using serial data concepts, using the air-craft MUX BUS to supply data, actual fuel weight will be available.)
Only two fuel checks were obtained from F-4's during this study. However,they agreed very closely to the approximation method of calculating fuel. One fuelcheck occurred at 6400 pounds. Data at the time of the fuel check indicated a weightratio of 0.9785. This ratio yields a fuel weight of 5855 pounds, or 733 pounds lowerthan reported.
teThe weight ratio at 6400 pounds would be 0.9974. The difference, representing
the 733 pounds, is 0.0189. At an actual turn rate of 10 deg/sec, this introduced anerror in the present position indicator of 0.189 deg/sec.
The second fuel check obtained occurred at 4600 pounds. The weight ratiobeing calculated when this state was reported equals 0.0953. The weight ratio for4600 pounds is 0.9516. The difference is 0.0063.
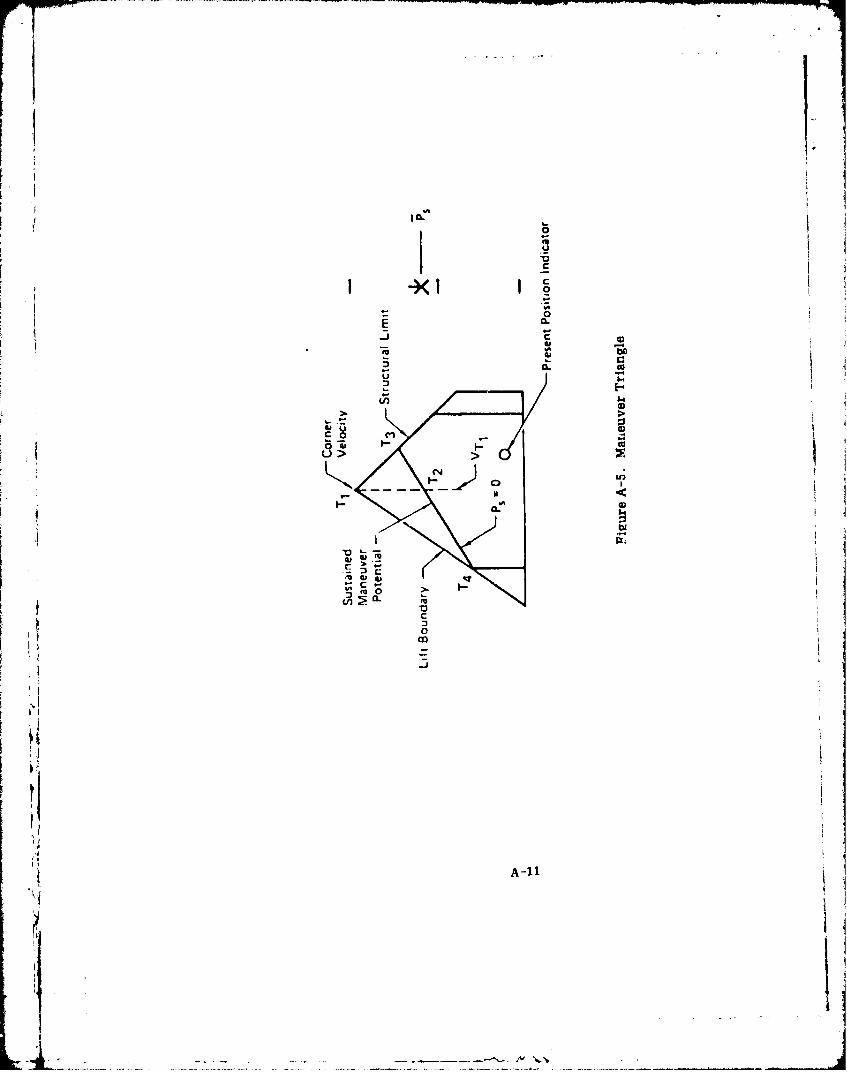
Figure C-2 represents the displayed turn rate as a function of weight error.As mentioned previously, at the present time there iq no way to obtain these fueldifferences. If it is assumed that the fuel weight will never be much more than 1000pounds in error, then the maximum display error at 20 deg/sec would be 0.5 deg/sec.Since the present position character has a height representing approximately 0.8 deg/sec, it is felt that for qualitative assessment, the 0.5 deg/sec error at a 20 deg/secturn is acceptable.
C-5

Weight Error- 1000 Ib
0 1 2 3 4, 5 0.1
0.01I -e0.08
0.04
0.02
• !-o.o4
-0.04
-0.,6II
0 _ _ _ 1
Actual Turn Rato4 deg/see
155
1- i
25
-0.1 00.1
Weight Ratio Change
Figure C-2. Display Turn Rate Error
F-4 50 percent Range FuelEw= 32,107 lb
C-6
I

rr
APPENDIX D
CONDITIONING OF ACMR DATA
D-1
*2~ 7 -

APPENDIX D
CONDITIONING OF ACMR L WTA
The date being received by the ACMR and used for display generation are:
ALTITUDE, AIRSPEED, and LOAD FACTOR. The Maximum Standard Deviation erroris shown in Table D-I.
Table D-I
DATA SPECIFICATIONS
Maximum StandardParameter LImitationa Deviation Error
Specification Measured
ALTITUDE 5000 - 50000 ft 25 ft 25 ft
MACH 250 ft/sec - Mach 1.6 0,02M 0.02M
VELOCITY 250 ft/sec - Mach 1.6 15 ft/sec 5 ft/secCOMPON4ENTS
LOAD FACTOR -2.5 to 8.5 "g" d.5 "g" 0.05 "g"
DATA CONDITIONING
Data samples on the ACMR are obtained 10 times/sec. However, several ofthe parameters used on the EM displays become very "Jumpy" if updated on thedisplay at 10 times/sec. In order 'o remove this jumpiness, smoothing routines areused on both velocity and load factor. A stack of 10 frames of data (1 sec) is estab-lished, then averaged. This average value t. used for display. Each 100 me, thenew value is added to the stack and the oldest value is removed. This type ofsmoothing provides a steady input to the display and still allows display refreshat 100-ms intervals.
Load factor is used for the calculation of turn rate and display of the presentposition indicator. The "g" value being displayed an the lower portion of the display(bar chart and alphanumeric) is not processed through the smoothing routine.
The smoothed velocity is used only for the calculations of F, V. and Ps. Allother velocity inputs are not affected by the smoothing routines.
D-2
p is calculated by computing the total specific energy at two times, separatedby 10i ms. Energy rate is the difference in the total specific energy for the 100-metime interval. P5 is calculated as the rate of change of specific energy,
where:
ES - h + V2
and:
Ps Es ESIDI Pa -- ESI 1 S
V is simply the velocity difference over one-second time period, yielding accelera-tion. H is the rate of change of altitude, and itr alculated directly from ACMR Inputdata. It should be noted that since the DDS could not generate an easily visibledot required for the V and H symbols, a line was drawn in place of the dot.
I
'1

UNCLASSIFIED'%ECUPf1TY CLASSIFICATION OF THIS PAGE (When Dae. Euiýeed)'
REPOT DCUMNTATON AGEREAD INSTRUCTIONS______ REPORT___DOCUMENTATION ____PAGE_ BEFORE COMPLETING FORM
1.REPORT NUMBER 2. GOVT ACCESSION NO. 3. RECIPIENT'S CATALOG NUMBER
Special Report 80-6 AT)_
Energy maneuverability Display for th Oir REORombat~ CVEC
Maneuvering Rlange/Tactical Training System )Fnl r-(ACMR/TACTS) j1-- - ~ Y ~ YAMC
CcA Pruitt, W. F j orone CDR MSC USN (Ph.D.) OTAC RGAT UUR
9. PERFORMING ORGANIZATION NAME AND ADDRESS I. PROGNAM ELEMENT. PROJECT, YrASK
Pacific Missile Test Ceniter.* Point Mugu, California AE OKUI UUR
and McDonnell Douglas Aircraft Company, St. Louis,Missouri AARYCb S3811I I. CONTROLLING OFFICE NAME AND ADDRESS !.R P20RTOAATU
Naval Aerospace Medical Researob Laboratory (INAS, Pensacola, Florida 32508 L_
14. MONITORING AGENCY NAME a ADDRESS(if dliferent from, Conitrolling Office) IS. tECURITY CLASS. (of this report)
Naval Air Systems CommendNavy Department -Unclassifie
Washington, D. C. too. CEkASSIPIATION/SOWNGRADINO
IG. OIS-10RIOUTI8N STATEMENT (of this Report)
Approved for Public Release; Distribution Unlimited
17. DISTRIBUTION STATEMENT (of Chi~ abstract enterod in Block 20, it different froem Report)
1S. SUPPLEMENTAIRY NOTES
19. KEY WORDS (Continue on. reveres aide if necessar and Identify' by block number)
Air Combat Maneuvering Range (ACMR)Tactical Training System (TACTS)Energy Maneuverability Display (EMD)Energy Management
20. ABSTRACT (Continue on reverse side if necessary and Identify by block nhmber)Over the past decade, emphasis has been placed on designing fighter aircraft
to energy maneuverability criteria. These criteria have indeed increased fighterperformance, but they have also presented analysts and pilots with now tasks infully utilizing this Improved capability. In the development of tactics.* the energymaneuverability capability of a potential adversary's aircraft must be comparedwith the maneuvering capability of one's own aircraft. A major factor which deter-
DD "n1473 EDITION OF INOV 69IS OBSOLETE NL SIDSECURITY CLASSIFICATiON, OF TPIS PAGII (01ke. Dza utom.I z/{~Jr,
- - - -
UNCLASSIFIEDSECUONTV CLASSIFICATIOK OF THIS PAGE (When D4a Euntw.4
20. (Cont'd)
ines the outcome of aerial combat is the pilot's ability to maximize the maneuveringapability of Iis aiz c-zaft. This report describes the development of an integrated
analog display (turn rate vs calibrated airspeed' for use as a debriefing aid on theAir Combat Maneuvering Range (ACMR).
The ACMR gathers in-flight data from aircraft while they are engaged in aircombat maneuvering. Upon returning from the ACMR, aircrew are presented with) a pictorial display of the engagement, and 2) a digital p-intout of selected encoun
ter paramaters (e.g., velocity, "g", altitude of each . 4 'ricaft, range between aircraftThe display integrates these relevant energy maneuverability data into an analogformat, thus providing an immediate comparison of the performance of each airci aft
th respect to the maneuvering envelope of that aircraft and that cf the opponent.The display a. o allows the aircrew to recognize very rapidly whether Vhey are gain-Ing or loosing energy and the rate of gain or loss. The naneuvering envelopes ofthe F-14, F-4, A-4, and F-5 aircraft can be d'uplated in this dynamic formet. it isxpected that this new format 1) will provide a better ne-_na for pilots to determine
how well they havo maximized the performance of their aircraft, and 2) may serve atqn aid in tactics development.
A br1af discussion of the nat'ir,• of energy maneuverability is container' in anAppendix.
It is proposes that the effectiveness of the sner-v maneuverability (EM) displayand the companion instructional video tape should be evaluated. The potential incor-)oration of the display into other ACMRs/ACMIs and ACM simulators should also be-onsidered.
TTNCTLA.STPTEflSECURITY CLAPSIPICATION OF THIS PAGEVhefln Daf. Bte u.i)
K!