identification and evaluation of intervarietal...
TRANSCRIPT

Identification and evaluation of intervarietal substitutionlines of rapeseed (Brassica napus L.) with donor segmentsaffecting the diploidization rate of isolated microspores
Anthimos Kampouridis . Katharina Ziese-Kubon .
Nurhasanah . Wolfgang Ecke
Received: 21 July 2015 / Accepted: 5 February 2016 / Published online: 13 February 2016
� The Author(s) 2016. This article is published with open access at Springerlink.com
Abstract In Brassica species microspore derived
doubled haploid lines are an important tool in breeding
and research. A limiting step in the production of
doubled haploid lines is the diploidization of the
microspores. Strong differences have been observed in
diploidization rates between different genotypes but
little is know about the genetic control of these
differences. To identify genomic regions that carry
genetic factors controlling the diploidization rate of
isolated microspores of rapeseed, marker segregations
were compared between segregating populations of
diploid and haploid microspore derived embryos and a
BC1 from a cross between ‘Express 617’ and ‘RS239’.
After map construction ten intervarietal substitution
lines from the same cross were selected with donor
segments covering five genomic regions that showed a
pattern of skewed marker segregations across the three
populations indicative of the segregation of genes
controlling the diploidization rates. The diploidization
rates of microspores of the ten lines ranged from 23.9 to
58.7 % while the recurrent parent ‘Express 617’
showed a rate of 52.5 %. For three lines the diploidiza-
tion rates were significantly lower (P = 0.05) than the
rate of ‘Express 617’. By comparing donor segments
between the significant and the non-significant lines,
seven genomic regions that cover just between 4.17
and 6.16 % of the rapeseed genome were identified that
may contain genetic factors controlling diploidization
rates in rapeseed. In addition, one marker was found
that has a high probability to be linked to such a factor.
The significant lines represent an ideal material for
further in depth studies of this trait.
Keywords Diploidization rate � Isolated microspore
culture � AFLP � Intervarietal substitution lines
Introduction
Microspores or immature pollen grains normal devel-
opmental pathway in vivo is to differentiate into male
gametophytes, but in vitro they can be diverted from
this pathway to a sporophytic development by a stress
treatment, usually a mild heat stress. Cultured in a
liquid medium, isolated microspores start to divide
repeatedly and develop into embryo like structures, so
Electronic supplementary material The online version ofthis article (doi:10.1007/s10681-016-1656-8) contains supple-mentary material, which is available to authorized users.
A. Kampouridis � K. Ziese-Kubon � Nurhasanah �W. Ecke (&)
Department of Crop Sciences, Georg-August-Universitat
Gottingen, Von-Siebold-Str. 8, 37075 Gottingen,
Germany
e-mail: [email protected]
Present Address:
Nurhasanah
Department of Agroecotechnology, Faculty of Agriculture,
Mulawarman University, Gunung Kelua Campus,
Samarinda 75119, Indonesia
123
Euphytica (2016) 209:181–198
DOI 10.1007/s10681-016-1656-8

called ‘‘microspore derived embryos’’ (MDEs; Lichter
1982; Swanson et al. 1987). MDEs can develop into
fully-grown plants after transfer to a solid medium
(Baillie et al. 1992; Burnett et al. 1992). Since
microspores are the products of meiosis, microspore
derived plants would be haploids, although some
spontaneous diploidization usually occurs by duplica-
tion of the original chromosome set, leading to so
called doubled haploid (DH) plants or lines, which are
entirely homozygous. In rapeseed the spontaneous
diploidization rates are low, in the range of 10–30 %,
which is too low for practical applications (Mollers
and Iqbal 2009). During the development of DH lines
in rapeseed, diploization rates are increased by a
treatment with colchicine, a natural alkaloid extracted
mainly from the plant Colchicum autumnale, which
depolymerises microtubules and disrupts regular
mitotic cell division. (Chen et al. 1994; Mollers et al.
1994; Zhao et al. 1996a, 1996b; Hansen and Andersen
1996; Zhou et al. 2002a, 2002b; Weber et al. 2005;
Seguı-Simarro and Nuez 2008). As discussed by
Mollers and Iqbal (2009), the most efficient protocol
for the colchicine treatment is a treatment of the
freshly isolated microspores during the first days of
cultivation, which will lead to entirely diploid plants
with full fertility and diploidization rates of up to
90 %.
In rapeseed and related Brassica crops doubled
haploid (DH) plants are a valuable material in modern
breeding programs. Traits are fixed and homozygous
true breeding lines are produced within one genera-
tion, which can help reduce the time needed to develop
new varieties (Thomas et al. 2003; Ferrie and Caswell
2011; Ferrie and Mollers 2011). For the same reasons,
in vitro microspore culture has become an important
tool for mutagenesis (Barro et al. 2001, 2002; Sonntag
and Rudloff 2004; Liu et al. 2005; Ferrie et al. 2008)
and in vitro selection (Albrecht et al. 1995; Mollers
et al. 2000; Liu et al. 2005). In addition, microspores,
MDEs and DH plants are being used for transforma-
tion studies. Different approaches have been reported,
using Agrobacterium tumefaciens (Dormann et al.
2001; Cegielska-Taras et al. 2008), particle gun
bombardment (Fukuoka et al. 1998; Chen and Bev-
ersdorf 1994; Nehlin et al. 2000), or microinjection
(Guerche et al. 1987; Jardinaud et al. 1993; Huang
1992).
One major application of DH lines is in genetic
mapping. In rapeseed, F1 derived segregating DH
populations have been extensively used for map
construction and the genetic analysis of important
traits (Ferreira et al. 1994; Parkin et al. 1995; Sharpe
et al. 1995; Uzunova et al. 1995; Zhao et al. 2005;
Delourme et al. 2006; Qiu et al. 2006; Radoev et al.
2008). In these mapping studies distorted marker
segregations have been observed regularly (summa-
rized in Ferrie and Mollers 2011). This is often
explained by the assumption that the selection of
favourable alleles at loci controlling microspore
embryogenesis leads to skewed segregations at linked
marker loci (Foisset et al. 1993; Cloutier et al. 1995;
Foisset and Delourme 1996). On the other hand, the
production of doubled haploid lines in Brassica
encounters three limiting factors: (1) the embryogenic
potential of the microspores, (2) the diploidization
capacity of the microspores after colchizine treatment,
and (3) the direct embryo to plant conversion (DEPC)
rate (Mollers and Iqbal 2009). For all three of these
traits large variations have been observed between
different genotypes of rapeseed, clearly indicating that
genetic factors play a major role in the control of the
three traits (Ferrie and Keller 2007; Chen et al. 1994;
Mollers et al. 1994; Klutschewski 2013). Accordingly,
skewed segregations in F1 derived DH populations
may not only result from selection of favourable
alleles at loci controlling the embryogenic potential of
microspores, but may also be due to selection at loci
controlling the diploidization capacity of microspores
or the DEPC rate of MDEs. In addition, skewed
segregations may also result from earlier selection
events during microspore formation. When analysing
a DH population that consists of fully developed
plants, it is not possible to distinguish between these
possibilities. To assign a specific cause to skewed
segregations in a specific region of the genome, it will
be necessary to analyse and compare skewed segre-
gations in different populations that have experienced
only one or different subsets of the selective factors
described above. Furthermore, since real segregating
populations always represent samples, skewed segre-
gations may occur just by chance, necessitating an
independent verification of effects assigned to a
genomic region.
While there has been a small number of studies on
the genetics of the embryogenic potential of isolated
microspores in rapeseed and B. rapa, either by
comparing skewed segregations in F1 derived popu-
lations of non-colchicinized MDEs and F2 or BC1
182 Euphytica (2016) 209:181–198
123

populations (Foisset et al. 1993; Ecke et al. 2015) or by
determining the embryogenic potentials of micro-
spores from all individuals of an F2 mapping popula-
tion (Zhang et al. 2003), to our knowledge there have
been no studies until now about the genetic control of
the diploidization rates of isolated microspores.
In this study we compared skewed segregations
between F1 derived populations of diploid and haploid
MDEs and a corresponding BC1 population of rape-
seed to identify genomic regions putatively affecting
the diploidization rates of isolated, colchicine treated
microspores in rapeseed. The putative effects of
selected regions were verified using intervarietal
substitution lines (ISLs; Howell et al. 1996) with
donor segments covering these regions. By comparing
the donor segments in ISLs with diploidization rates
significantly lower than the recurrent parent of the
ISLs with the donor segments in ISLs that did not
show significant differences in their diploidization
rates, a number of genomic regions corresponding to
only a few per cent of the rapeseed genome were
identified that should carry genes that control the
diploidization rate of isolated, colchicine treated
microspores in this crop species.
Materials and methods
Plant materials and genetic maps
Isolated colchicinized microspores from one clonally
propagated F1 plant of a cross between ‘Express 617’,
an inbred line of the winter rapeseed variety ‘Express’,
and ‘RS239’, a resynthesized rapeseed line, were used
to develop a segregating mapping population of 197
diploid MDEs for analysing skewed marker segrega-
tions. In addition, a population of 323 doubled haploid
ISLs, derived from microspores of BC4 plants of the
same cross with ‘Express 617’ as recurrent parent, was
available to verify effects of specific genomic regions
on the diploidization rate of microspores. The genetic
characterization of the ISL population with 484 AFLP
markers from a map constructed in a corresponding
F1DH population (DH map) has been summarized in
Ecke et al. (2015); full details can be found in
Nurhasanah (2010). Shortly, the ISLs carry an average
of three donor segments, with a minimum of one and a
maximum of nine. In total, the minimum and maxi-
mum donor segment coverage on the DH map is
951 cM and 1587 cM, respectively, out of 2003 cM.
Furthermore, information on marker segregations in a
haploid MDE and a BC1 population with 191 and 185
genotypes, respectively, derived from the same F1
plant as the diploid MDE population (Ecke et al. 2015)
and the corresponding genetic maps (haploid MDE
and BC1 map) was available for comparison with the
diploid MDE population.
Donor plant growth
Microspore donor plants were grown in the green-
house until they reached the four to six leaf stage after
which they were vernalized in a controlled climate
chamber at 4 �C under a photoperiod of 8 h for 8
weeks. Afterwards the plants were transferred to
13 cm plastic pots with compost soil and grown in the
greenhouse. When the first flower buds appeared,
plants were moved to an environmentally controlled
growth chamber with a photoperiod of 16 h with day/
night temperatures of 12�/6 �C, a light intensity of
400 lmol/m2s (Li-1400 Data Logger, Licor Bio-
sciences, Nebraska, Canada) and a relative humidity
of 65 %.
Bud harvest, microspore isolation and cultivation
Flower buds, 2–3 mm in length, were harvested and
placed on ice. The harvested flower buds were surface
sterilized under moderate agitation for 5 min in 1 %
calcium hypochloride laced with some drops of tween
20 and rinsed three times with cold sterile water.
For microspore isolation, 16 buds were transferred
to a sterile nylon sieve with a diameter of 5 cm and a
pore size of 40–50 lm (Wilson Sieves, Nottingham,
UK). The sieve was placed in a 9 cm sterile petri dish
(92 9 16 mm, Sarstedt AG and Co., Nurnbrecht,
Germany) filled with 5 ml cold sterile NLN medium
[0.039 % (w/v) NLN medium basal salt mixture,
0.104 % (w/v) NLN medium vitamin mixture (Duch-
efa Biochemie B.V., Haarlem, The Netherlands),
0.05 % (w/v) Ca(NO3)2�4H2O (Sigma-Aldrich Labor-
chemikalien GmbH, Seelze, Germany), 13 % (w/v
sucrose)] (Lichter 1982). The buds were crushed with
a sterile pestle and the microspores were released into
the sieve. The pestle and the sieve were rinsed with
7 ml cold NLN medium and the medium containing
the microspores was transferred to a sterile glass
centrifuge tube and centrifuged for 5 min at 1000 rpm.
Euphytica (2016) 209:181–198 183
123
The pellet was resuspended in 12 ml cold NLN
medium and centrifuged again. The washing step with
12 ml cold NLN medium was repeated one more time.
The final pellet was resuspended in 5 ml cold NLN
medium and transferred to a 9 cm petri dish already
containing 6.4 ml cold NLN medium and 600 ll of a
stock solution of colchicine (2 mg/ml). The petri dish
was sealed with two layers of Parafilm and incubated
in the dark at 32 �C for three days. After the three days
the suspension with the microspores was centrifuged
again for 5 min at 1000 rpm and the microspores were
washed twice with 12 ml cold NLN medium. The final
pellet was resuspended in 5 ml cold NLN medium and
transferred to a 9 cm petri dish already containing
7 ml cold NLN medium. The petri dish was sealed
with two layers of Parafilm and incubated in the dark at
28 �C for 7 days. Afterwards, the microspores were
transferred to a shaker set to 80 rpm and incubated at a
continuous temperature of 22 �C and a photoperiod of
12 h for 3 weeks.
Analysis of ploidy level
The ploidy level of MDEs was determined by flow
cytometry from 0.5 cm2 cotyledonary samples using a
Partec Ploidy Analyser PA-I (Partec GmbH, Gorlitz,
Germany) according to the manufacturer’s protocol:
The samples were chopped up with a razor blade in
0.5 ml of CyStain UV Ploidy (Partec GmbH), a DAPI
staining solution. After filtering through 30 lm partec
CellTrics filters into sample tubes and waiting for
2–5 min at room temparature, 2 ml CyStain were
added to the samples. Afterwards the samples were
loaded onto the ploidy analyser and measured for
about 20 s. Before MDE samples were measured, the
ploidy analyser was calibrated using samples from a
haploid and a diploid genotype of the rapeseed variety
‘Drakkar’ as standards. After measurements, the
MDEs were frozen in liquid nitrogen and stored at
-20 �C. Based on the analysis of ploidy levels, a
population of diploid MDEs was selected.
DNA preparation, AFLP analysis and map
construction
Total genomic DNA was extracted from frozen MDEs
using the innuSPEED Plant DNA kit (Analytik Jena
AG, Konrad-Zuse-Straße 1, Jena, Germany) according
to the manufacturer’s instructions. AFLP analyses
were carried out following the multiplexing protocol
described by Ecke et al. (2010). The same five primer
sets (20 primer combinations) used in the development
of the DH, haploid MDE and BC1 maps and for the
characterization of the ISLs were again used for the
analysis of skewed segregations and for map con-
struction in the diploid MDE population.
v2 tests were used to test the fit of marker
segregations to the expected 1:1 segregation ratio.
Significant deviations were considered at a level of
P = 0.05. The v2 values were also used as a measure
for the strength of the deviation of marker segregations
from the expected segregation ratio.
For the construction of the genetic map in the
diploid MDE population MAPMAKER/EXP 3.0b and
a Perl script were used. The script automates the
mapping process and distributes time critical pro-
cesses to multiple copies of MAPMAKER in order to
speed up the analysis. The mapping approach that was
followed, which results in a high fidelity (HF) map of a
subset of well ordered markers and a full map with all
markers, was described in detail by Ecke et al. (2015).
Statistical analysis
The diploidization rates of isolated microspores of the
ISLs and the recurrent parent ‘Express 617’ were
determined from 10 to 20 repeated microspore
cultures per genotype. For ‘Express 617’ the cultures
were treated as replicates of one experiment. The
mean diploidization rate and its 99 % confidence
interval were calculated according to Gardner and
Altman (1998). For the ISLs the diploidization rate
was taken from the total of all MDEs that developed in
the repeated microspore cultures and determined as
the fraction of diploid MDEs. To identify ISLs with
diploidization rates significantly different from the
mean diploidization rate of ‘Express 617’ the
diploidization rates of the ISLs were compared with
the boundaries of the 99 % confidence interval of the
rate of ‘Express 617’. For all ISLs with diploidization
rates between these boundaries the hypothesis of a
significant difference to ‘Express 617’ was rejected.
For ISLs with diploidization rates outside the bound-
aries a v2 test was applied with the calculated fractions
of diploid and non-diploid MDEs at the closer
boundary as expected frequencies. A significant
difference to ‘Express 617’ was declared when the
v2 test yielded a P B 0.05.
184 Euphytica (2016) 209:181–198
123
Results
Genetic mapping in the diploid MDE population
To localize genetic factors that have an effect on the
diploidization rate of isolated microspores of rape-
seed, 526 AFLP markers were scored in the diploid
MDE population. Using these markers, a genetic map
of 470 markers could be constructed (Table S1), which
consists of 19 linkage groups that could be assigned to
the 19 chromosomes of rapeseed based on markers
shared with the DH map and a map from the cross
‘Express 617’ 9 ‘R53’ (Ecke et al. 2010). Of linkage
group C4 only as a short fragment of five markers was
present. The full map had a total length of 2094.9 cM.
A summary of the diploid MDE map and a comparison
with the corresponding maps of the haploid MDE and
the BC1 populations is shown in Table 1.
Analysis of skewed segregations in the diploid
MDE population
From the 470 AFLP markers on the diploid MDE
map 186 (39.6 %) showed a significant deviation from
the expected 1:1 segregation ratio in the diploid MDE
population (Tables 2, S1). These skewed markers
were distributed across all linkage groups except C3.
Of the 186 skewed markers, 177 clustered in 23
regions with some regions also containing up to two
markers with regular segregations. The number of
markers in these regions ranged from 2 to 26, covering
from 1.6 to 115.9 cM, in total 645.7 cM (30.8 %), of
the map. Moreover, another nine skewed markers were
found dispersed across the map, suggesting additional
small regions with disturbed segregations. In total, 32
genomic regions showed skewed segregations in the
diploid MDE population, with fifteen regions display-
ing an excess of ‘Express 617’ alleles and seventeen
regions an excess of ‘RS239’ alleles. Peak v2 values in
these regions ranged from 3.94 to 71.41. The nine
single marker regions (nos. 5, 8, 9, 19, 25, 26, 27, 29,
31 in Table 2) were excluded from further analysis.
From the 23 extended regions six regions showed
regular segregations in the corresponding regions on
the haploid MDE and BC1 maps (nos. 2, 6, 12, 13, 15,
30), the pattern expected for the segregation of a
genetic factor controlling diploidization efficiency.
Two additional regions (nos. 21, 24) showed a
comparable pattern only that here no information
was available for the BC1 map since all markers in the
two regions could not be mapped on this map.
Together, these eight regions constitute the group of
regions where skewed segregations were only
observed in the diploid MDE population. Of the
remaining fifteen regions, one region was not covered
by donor segments in the ISLs (no. 28), five regions
showed similarly skewed segregations in the diploid
MDE map as in the haploid MDE map (nos. 1, 10, 18,
22, 23), four regions showed segregations less skewed
in the diploid MDE map than in the haploid MDE map
(nos. 3, 11, 16, 17), and five regions showed different
segregation patterns between the diploid and haploid
MDE maps across the region (nos. 4, 7, 14, 20, 32). A
closer investigation of these five regions revealed that
all contained subsections where the v2 values in the
diploid MDE population greatly exceeded the values
in the haploid MDE population and the BC1 popula-
tion (Table S1), which was considered to also indicate
the segregation of a genetic factor controlling
diploidization efficiency in these subsections. This
notion was reinforced in some of these regions by the
specific pattern of change in the skewed segregations
across the regions. For example in region no. 14 on A7,
skewed segregations in the haploid MDE population
rise to a peak at 53.8 cM after which the v2 values fall
again. On the other hand, in the diploid MDE
population v2 values rise more slowly, but strongly
exeed the values in the haploid MDE population after
60.4 cM, reaching a peak at 71.3 cM. This pattern was
interpreted as the segregation of two loosely linked
loci, one around 71.3 cM that affected the diploidiza-
tion efficiency in the diploid MDE population, the
other around 53.8 cM, which affected the segregation
ratio in the haploid MDE population.
Selection of regions with skewed segregations
and of ISLs with donor segments covering these
regions
The selection of regions with skewed segregations in
the diploid MDE population for further analysis was
based on peak v2 values, the distribution of skewed
segregations across the regions, and the availability of
ISLs carrying donor segments covering these regions.
Three regions on A3, A8 and C4 (nos. 6, 15, 24 in
Table 2; Fig. 1) were chosen from the group of
regions where skewed segregations were only
observed in the diploid MDE population. The
Euphytica (2016) 209:181–198 185
123
remaining regions in this group either showed only
low v2 values (\7.5) or were rather long (C40 cM),
which made it difficult to cover them by donor
segments. In addition, two regions on A2 and A7 (nos.
4 and 14) were chosen from the regions with
subsections where v2 values in the diploid MDE
population strongly exceeded the values in the other
populations. These regions were chosen based on
higher peak v2 values (C12), the pattern of skewed
segregations along the region and a good coverage by
donor segments (Fig. 1). On A2 a subsection from
54.2 to 64.4 cM showed highly skewed segregations
in the diploid MDE map while, with one exception, in
the haploid MDE population the v2 values of the
markers only just exceeded the significance threshold.
Only one marker in this subsection showed a high v2
value of 8.13 in the haploid MDE population, which,
nevertheless, was still less than the lowest value in the
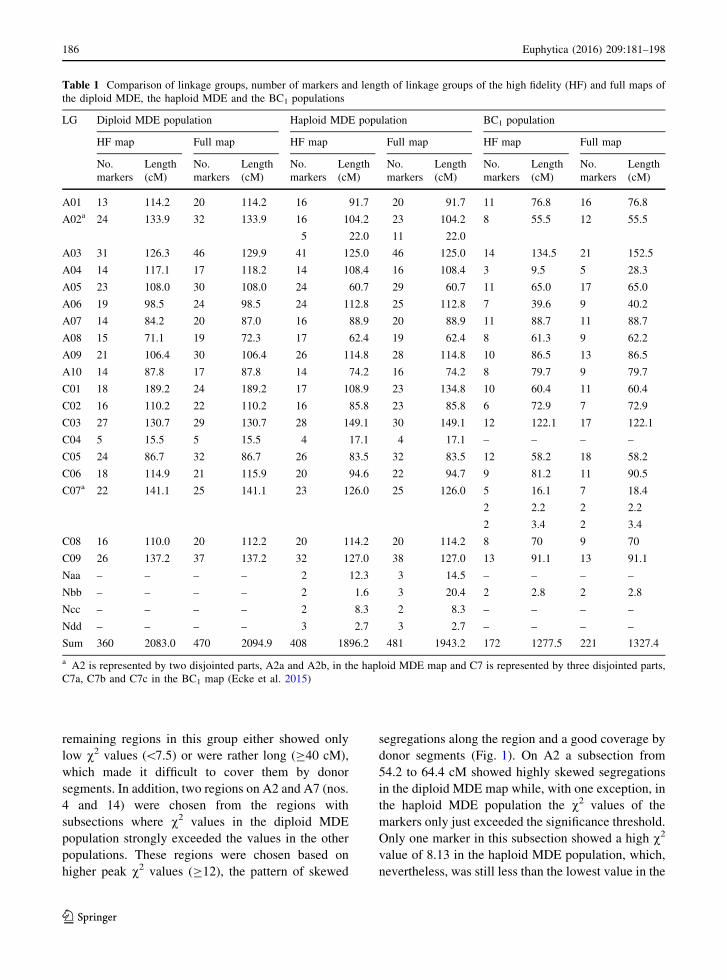
Table 1 Comparison of linkage groups, number of markers and length of linkage groups of the high fidelity (HF) and full maps of
the diploid MDE, the haploid MDE and the BC1 populations
LG Diploid MDE population Haploid MDE population BC1 population
HF map Full map HF map Full map HF map Full map
No.
markers
Length
(cM)
No.
markers
Length
(cM)
No.
markers
Length
(cM)
No.
markers
Length
(cM)
No.
markers
Length
(cM)
No.
markers
Length
(cM)
A01 13 114.2 20 114.2 16 91.7 20 91.7 11 76.8 16 76.8
A02a 24 133.9 32 133.9 16 104.2 23 104.2 8 55.5 12 55.5
5 22.0 11 22.0
A03 31 126.3 46 129.9 41 125.0 46 125.0 14 134.5 21 152.5
A04 14 117.1 17 118.2 14 108.4 16 108.4 3 9.5 5 28.3
A05 23 108.0 30 108.0 24 60.7 29 60.7 11 65.0 17 65.0
A06 19 98.5 24 98.5 24 112.8 25 112.8 7 39.6 9 40.2
A07 14 84.2 20 87.0 16 88.9 20 88.9 11 88.7 11 88.7
A08 15 71.1 19 72.3 17 62.4 19 62.4 8 61.3 9 62.2
A09 21 106.4 30 106.4 26 114.8 28 114.8 10 86.5 13 86.5
A10 14 87.8 17 87.8 14 74.2 16 74.2 8 79.7 9 79.7
C01 18 189.2 24 189.2 17 108.9 23 134.8 10 60.4 11 60.4
C02 16 110.2 22 110.2 16 85.8 23 85.8 6 72.9 7 72.9
C03 27 130.7 29 130.7 28 149.1 30 149.1 12 122.1 17 122.1
C04 5 15.5 5 15.5 4 17.1 4 17.1 – – – –
C05 24 86.7 32 86.7 26 83.5 32 83.5 12 58.2 18 58.2
C06 18 114.9 21 115.9 20 94.6 22 94.7 9 81.2 11 90.5
C07a 22 141.1 25 141.1 23 126.0 25 126.0 5 16.1 7 18.4
2 2.2 2 2.2
2 3.4 2 3.4
C08 16 110.0 20 112.2 20 114.2 20 114.2 8 70 9 70
C09 26 137.2 37 137.2 32 127.0 38 127.0 13 91.1 13 91.1
Naa – – – – 2 12.3 3 14.5 – – – –
Nbb – – – – 2 1.6 3 20.4 2 2.8 2 2.8
Ncc – – – – 2 8.3 2 8.3 – – – –
Ndd – – – – 3 2.7 3 2.7 – – – –
Sum 360 2083.0 470 2094.9 408 1896.2 481 1943.2 172 1277.5 221 1327.4
a A2 is represented by two disjointed parts, A2a and A2b, in the haploid MDE map and C7 is represented by three disjointed parts,
C7a, C7b and C7c in the BC1 map (Ecke et al. 2015)
186 Euphytica (2016) 209:181–198
123

Table
2R
egio
ns
wit
hsk
ewed
seg
reg
atio
ns
on
the
dip
loid
MD
Em
apan
dco
mp
aris
on
wit
hth
eco
rres
po
nd
ing
reg
ion
so
nth
eh
aplo
idM
DE
and
BC
1m
aps
Dip
loid
MD
Em
apH
aplo
idM
DE
map
BC
1m
ap
No
.L
GS
tart
(cM
)
En
d
(cM
)
Len
gth
(cM
)
tm/
sma
Fav
ore
d
alle
leb
Pea
k
v2
Sta
rt
(cM
)
En
d
(cM
)
Len
gth
(cM
)
tm/
sma
Fav
ore
d
alle
leb
Pea
k
v2
Sta
rt
(cM
)
En
d
(cM
)
Len
gth
(cM
)
tm/
sma
Fav
ore
d
alle
leb
Pea
k
v2
1A
01
21
.82
3.4
1.6
3/3
R6
.84
66
.26
7.8
1.6
3/2
R5
.08
5.7
8.0
2.3
3/0
–0
.45
2A
01
88
.31
14
.22
5.9
3/3
E6
.95
0.0
8.3
8.3
2/0
–2
.17
48
.47
6.8
28
.83
/0–
1.7
8
3A
02
0.0
12
.51
2.5
3/3
R2
1.6
00
.01
8.2
18
.25
/5R
36
.45
41
.75
0.5
8.8
5/1
R4
.65
4A
02
54
.27
7.3
23
.18
/8R
16
.49
48
.81
04
.25
5.4
18
/9R
8.1
32
3.2
24
.91
.72
/0–
1.4
2
5A
03
0.0
0.0
0.0
1/1
R1
0.8
0–
––
––
–1
34
.51
34
.50
.01
/0–
0.0
9
6A
03
12
3.0
12
9.9
6.9
8/7
E1
4.8
80
.03
.83
.88
/0–
2.6
64
6.3
49
.73
.45
/0–
0.7
9
7A
04
-1
.16
1.2
62
.31
2/1
1R
45
.55
0.0
95
.49
5.4
12
/11
R2
8.8
10
.02
8.3
28
.35
/5R
87
.23
8A
04
11
7.1
11
7.7
0.0
1/1
R2
2.8
4–
––
––
–2
6.3
26
.30
.01
/1R
20
.45
9A
05
0.0
0.0
0.0
1/1
R1
3.4
1–
––
––
––
––
––
–
10
A0
53
3.6
96
.26
2.6
26
/26
E2
8.8
11
7.8
58
.04
0.2
26
/26
E3
2.4
01
3.6
50
.23
6.6
14
/2R
6.9
2
11
A0
61
7.0
33
.41
6.4
4/4
E6
.22
25
.54
2.2
16
.74
/4E
9.3
8–
––
––
–
12
A0
65
8.7
98
.53
9.8
6/4
E1
6.1
87
0.2
10
6.3
36
.16
/1E
3.8
61
2.7
39
.62
6.9
5/0
–0
.57
13
A0
7-
2.8
6.0
8.8
4/4
E6
.35
79
.78
8.9
9.2
4/0
–0
.28
0.0
6.0
6.0
2/0
–3
.76
14
A0
72
9.8
79
.85
0.0
13
/13
E1
1.9
45
.65
4.7
49
.11
3/1
0E
20
.45
33
.18
8.7
55
.68
/0–
2.2
2
15
A0
8-
1.2
10
.41
1.6
9/8
E1
1.0
00
.08
.38
.39
/0–
3.3
85
1.8
62
.21
0.4
4/0
–0
.56
16
A0
86
2.7
71
.18
.42
/2E
10
.83
56
.56
2.4
5.9
2/2
E2
6.3
40
.00
.00
.01
/0–
1.4
1
17
A0
90
.02
4.6
24
.61
8/1
7R
12
.39
90
.41
14
.32
3.9
17
/17
R2
3.0
16
2.8
86
.52
3.7
7/6
E8
.50
18
A0
96
1.4
71
.91
0.5
5/3
E8
.99
40
.75
2.4
11
.75
/1E
7.0
42
2.8
28
.65
.82
/0–
2.3
0
19
A1
00
.00
.00
.01
/1E
9.8
0–
––
––
––
––
––
–
20
C0
16
9.6
94
.02
4.4
7/7
R1
2.8
04
2.0
61
.31
9.3
7/6
R9
.28
––
––
––
21
C0
11
41
.61
89
.24
7.6
4/4
R1
7.4
26
9.4
10
8.9
39
.55
/1R
2.8
6–
––
––
–
22
C0
20
.02
4.9
24
.99
/9E
71
.41
0.0
23
.02
3.0
11
/10
E5
1.8
6–
––
––
–
23
C0
24
5.8
52
.36
.53
/3E
41
.63
35
.33
8.2
2.9
2/2
E1
6.1
8–
––
––
–
24
C0
40
.01
5.5
15
.55
/5E
20
.11
0.0
17
.11
7.1
4/0
–0
.90
––
––
––
25
C0
55
.65
.60
.01
/1R
3.9
47
8.5
78
.50
.01
/0–
0.0
5–
––
––
–
26
C0
53
9.3
39
.30
.01
/1R
4.9
54
0.9
40
.90
.01
/0–
3.0
6–
––
––
–
27
C0
58
6.7
86
.70
.01
/1R
5.3
70
.00
.00
.01
/0–
2.6
3–
––
––
–
Euphytica (2016) 209:181–198 187
123

diploid MDE population. In the BC1 map the markers
in this region could not be mapped. As already stated
above, on A7 the pattern of skewed segregations
across the populations indicated the segregation of two
loosely linked factors, one of which affects diploidza-
tion efficiency. Here marker segregations were
strongly skewed in the diploid MDE population from
66.4 to 79.8 cM, while the same markers showed
regular or less skewed segregations in the haploid
MDE population. In the BC1 population the marker
segregations in this region were regular. Among the
chosen regions an excess of ‘RS239’ alleles was
observed on A2, while an excess of ‘Express 617’
alleles occurred on A3, A7, A8, and C4.
In total 10 ISLs were selected with donor segments
covering the selected regions with skewed segrega-
tions (Fig. 1). On A2, the donor segment in ER1284,
with a minimal extent from 12.5 to 64.4 cM, covers
the whole subsection from 54.2 to 64.4 cM where the
v2 values in the diploid MDE population exceed the
values in the haploid MDE population. In its maximal
extent it also covers the region from 64.4 to 77.3 cM,
part of a region where a transition from highly skewed
segregations in the diploid MDE population to highly
skewed segregations in the haploid MDE population
occurs. The remainder of this transitory region is
covered by the donor segments in two additional ISLs,
ER137 and ER199. On A3 the minimal extent of the
donor segments in the two selected ISLs, ER984 and
ER1433, covers 87.5 % of the selected region with
skewed segregations. Taking into account the maxi-
mal extent of the donor segments the whole region,
which extents from 123.0 to 129.9 cM, is covered. On
A7 the selected ISL, ER1437, carries a donor segment
that covers the entire subsection where skewed
segregations are more pronounced in the diploid
MDE population than in the haploid population. On
A8 the minimal extent of the donor segments of the
two selected ISLs, ER444 and ER807, covers 71 % of
the region with skewed segregations, while, taking
into account the maximal extent of the donor seg-
ments, the whole region is covered. The peak v2 value
of this region falls within the minimal extent of the
donor segments. On C4 the two selected ISLs, ER281
and ER964, carry donor segments that cover the entire
region.
In the original characterization of the donor
segments in the ISL population based on the DH
map, the donor segments of ER984 on A3 is aTable
2co
nti
nu
ed
Dip
loid
MD
Em
apH
aplo
idM
DE
map
BC
1m
ap
No
.L
GS
tart
(cM
)
En
d
(cM
)
Len
gth
(cM
)
tm/
sma
Fav
ore
d
alle
leb
Pea
k
v2
Sta
rt
(cM
)
En
d
(cM
)
Len
gth
(cM
)
tm/
sma
Fav
ore
d
alle
leb
Pea
k
v2
Sta
rt
(cM
)
En
d
(cM
)
Len
gth
(cM
)
tm/
sma
Fav
ore
d
alle
leb
Pea
k
v2
28
C0
60
.01
15
.91
15
.92
1/2
1E
20
.11
0.0
94
.79
4.7
22
/22
E4
8.0
20
.09
0.5
90
.51
1/1
E4
.65
29
C0
70
.00
.00
.01
/1R
5.6
31
3.4
13
.40
.01
/1R
8.5
1–
––
––
–
30
C0
85
0.9
77
.32
6.4
5/5
R7
.40
24
.44
6.0
21
.65
/0–
1.2
02
8.8
50
.12
1.3
4/0
–1
.84
31
C0
90
.00
.00
.01
/1R
17
.34
12
7.0
12
7.0
0.0
1/0
–0
.78
––
––
––
32
C0
91
17
.71
37
.21
9.5
7/7
R1
4.5
30
.02
4.1
24
.18
/6R
9.7
88
4.4
91
.16
.72
/0–
1.4
1
Su
m6
45
.71
94
/18
66
26
20
3/1
36
35
6.8
85
/16
atm
:to
tal
nu
mb
ero
fm
ark
ers
inth
ere
gio
n;
sm:
nu
mb
ero
fm
ark
ers
wit
hsi
gn
ifica
ntl
ysk
ewed
seg
reg
atio
ns
(P=
0.0
5)
inth
ere
gio
nb
R=
‘RS
23
9’
alle
le,
E=
‘Ex
pre
ss6
17
’al
lele
188 Euphytica (2016) 209:181–198
123
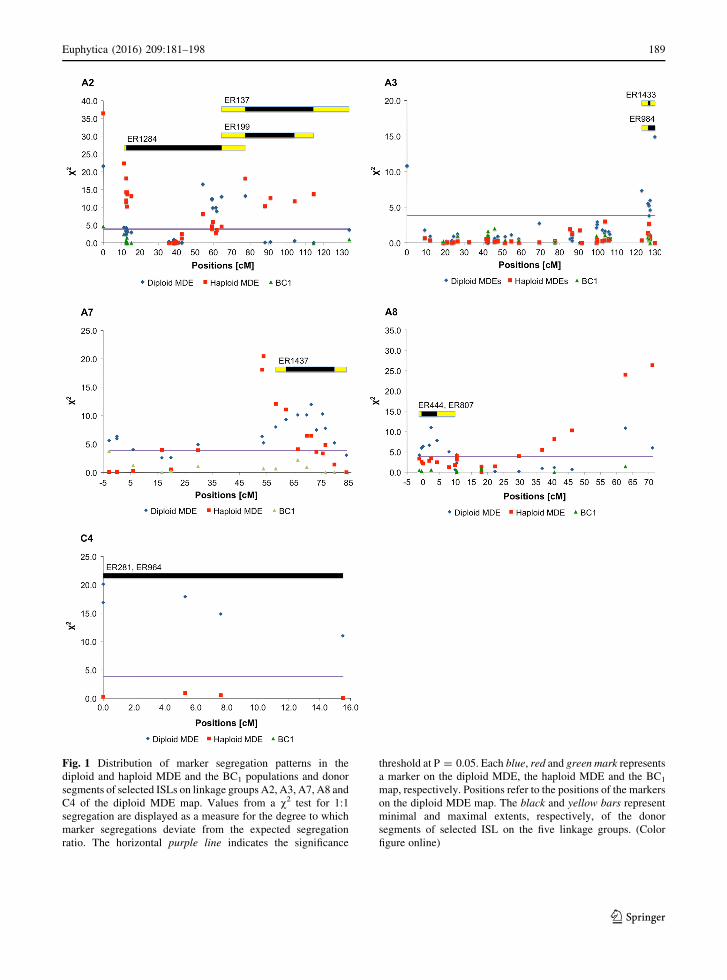
Fig. 1 Distribution of marker segregation patterns in the
diploid and haploid MDE and the BC1 populations and donor
segments of selected ISLs on linkage groups A2, A3, A7, A8 and
C4 of the diploid MDE map. Values from a v2 test for 1:1
segregation are displayed as a measure for the degree to which
marker segregations deviate from the expected segregation
ratio. The horizontal purple line indicates the significance
threshold at P = 0.05. Each blue, red and green mark represents
a marker on the diploid MDE, the haploid MDE and the BC1
map, respectively. Positions refer to the positions of the markers
on the diploid MDE map. The black and yellow bars represent
minimal and maximal extents, respectively, of the donor
segments of selected ISL on the five linkage groups. (Color
figure online)
Euphytica (2016) 209:181–198 189
123

subsegment of the corresponding segment in ER1433,
distiguished by a pair of cosegregating markers at
7.9 cM both of which show donor alleles in ER1433,
but only one in ER984 (Fig. S1). In the diploid MDE
map a marker, E44M50-147E, has been mapped at the
end of A3 at 129.9 cM (Table S1), which corresponds
to the beginning of A3 in the DH map since A3 has an
inverted orientation in the diploid MDE map with
respect to the orientation in the DH map. This marker
had not been mapped in the DH map, but had been
scored in the ISL population. E44M50-147E shows a
donor allele in ER984 but a recurrent parent allel in
ER1433 and therefore also distiguishes the two lines
as shown in Fig. 1. Since in the upper respectively
lower part of A3 the alignement between the DH and
the diploid MDE map was poor, it was not possible to
extrapolate a position for E44M50-147E on the
diploid MDE map. The marker is therefore not
represented in Fig. S1 and was entered in Table 3,
which shows an overview of all donor segments in the
selected ISLs, as a separate one-marker segment with
a position based on the diploid MDE map. In addition
to ER984, E44M50-147E also shows donor alleles in
ER281 and ER964.
Determination of the diploidization rates
of microspores of ‘Express 617’ and the selected
ISLs
To determine the diploidization rate of isolated
microspores of ‘Express 617’, 23 independent micro-
spore isolations were cultured (Table 4) and the ploidy
level of the resulting MDEs was analysed. Of the 23
cultures, 12 yielded C10 MDEs. For each of these
cultures an independent estimation of the diploidiza-
tion rate was determined. The remaining cultivations
yielded less than ten MDEs each and a 13th estimation
of the diploidization rate was determined from the
total of MDEs from these cultivations. Based on these
13 independent estimates a mean diploidization rate of
‘Express 617’ of 52.5 % was calculated, with a 99 %
confidence interval ranging from 34.8 to 70.2 %.
The diploidization rates of the ten selected ISLs
were calculated from the total number of MDEs
derived from 10 to 20 microspore preparations
(Table 4). The number of MDEs analysed for ploidy
level ranged from 107 to 395 and the diploidization
rates of the lines from 23.9 % for ER281 to 58.7 % for
ER444. These rates cover a range of 0.46–1.12 times
the mean rate of the recurrent parent ‘Express 617’. A
comparison of the diploidization rates of the ISLs with
the boundaries of the 99 % confidence interval of the
mean rate of ‘Express 617’ identified three ISLs,
ER281, ER964, and ER984, with diploidization rates
significantly lower than ‘Express 617’, indicating that
the donor segments in these lines carry alleles that
reduce the diploidization efficiency of isolated micro-
spores. No lines were identified with significantly
enhanced diploidization efficiencies.
Donor segments involved in the control
of the diploidization rate of microspores
The available marker data showed that the number of
donor segments carried by the selected ISLs range
from one to six (Table 3, Fig. S1). In individual ISLs
the sum of the minimal extents of the donor segments
ranges from 3.2 to 66.9 cM, covering between 0.16
and 3.34 % of the total length of the DH map.
Considering the maximal extent, the coverage by the
donor segments ranges from 7.7 to 76.2 cM, corre-
sponding to 0.38 and 3.80 % of the DH map,
respectively (Table 5).
To identify genomic regions that may carry genetic
factors involved in the control of the diploidization
rate of microspores, the distribution and overlap of
donor segments in the ISLs with significantly lower
diploidization rates were compared with the donor
segments in the non-significant ISLs (Fig. S1,
Table 3). Seven regions on five linkage groups were
identified where donor segments only occurred in the
significant lines, which, accordingly, may carry
genetic factors controlling the diploidization rate of
microspores (Table 6). The seven regions are on
chromosomes A03, A08, C03, C04 and C05. The
minimal extent of these regions ranges from 0.0 to
56.8 cM and covers 83.6 cM (4.17 %) of the total
length of the DH map. Taking into account the
maximal extent of these regions the range is from 3.3
to 57.6 cM, covering 123.4 cM (6.16 %) of the total
length of the DH map.
Discussion
In order to identify genomic regions that carry genetic
factors affecting the diploidization rate of isolated,
colchicine treated microspores in rapeseed, skewed
190 Euphytica (2016) 209:181–198
123

marker segregations were analysed in a segregating
diploid MDE population and were compared to
skewed segregations found in corresponding haploid
MDE and BC1 populations. In a second step, the
effects of selected regions on the diploidization rate
were verified using ISLs carrying donor segments
covering these regions.
For the analysis of skewed segregations in the
diploid MDE population a genetic map was con-
structed. With 470 markers and a total length of
2094.9 cM this map is similar to the map
constructed in the haploid MDE population, which
has 481 markers and a length of 1943.2 cM. In
contrast, with only 221 markers and 1327.4 cM, the
BC1 map has both, a lower marker density and
lower genome coverage than the diploid and haploid
MDE maps, although the same primer sets were
used for marker analysis in all three populations.
The lower marker number on the BC1 map is a
consequence of the dominant inheritance of the
AFLP markers used for marker analysis, which
allowed only the mapping of markers with the
Table 3 Genomic regions with skewed segregations in the diploid MDE population and the donor segments of intervarietal
substitution lines selected for coverage of these regions
LG A02 A03 A07 A08 C04Extenta 54.4 - 64.2 cM 123 - 129.9 cM 66.4 - 79.8 cM -1.2 - 8 cM 0 -17 cMExtentb 58.8 - 65.3 cM 0 - 11.1 cM 74.4 - 90.2 cM 0 - 5.5 cM 46.9 - 94.5 cMFavoured allelec R E E E ESelected ISLs ER137 ER199 ER1284 ER984 ER1433 ER1437 ER444 ER807 ER281 ER964
No. of segmentsd 2 1 2 6 1 3 1 1 3 3
Donor segments of the selected ISLs
LG Segments
A02
0.0 - 42.8e 27.0 - 42.8 0.0 - 12.4
54.5 - 78.3 54.5 - 58.8
62
A03
7.9 - 11.1 7.9 - 11.1 7.9 - 11.1
(129.9)f (129.9)f (129.9)f
136.8 136.8
A07 71.2 - 91.7
A08/lg22 0.0 - 4.6g 0.0 - 5.5 0.0 - 5.5
C01 44.3
C02 0.0
C03 77.1 - 79.3
C0446.9 - 80.7 23.9 - 80.7
84.4 - 94.5 84.4 - 94.5
C05 34.9 - 44.8
Donor segments that cover the selected genomic regions with skewed segregations are in bold
Segments with bold box borders cover or overlap genomic regions that may be involved in the decreased diploidization rates of the
significant ISLs
Positions are in cM and refer to the DH map if not otherwise indicateda Positions of genomic regions with skewed segregations in the diploid MDE population with respect to the diploid MDE mapb Positions of the regions with respect to the DH map based on an alignment with the diploid MDE mapc R, E: excess of ‘RS239’ or ‘Express 617’ alleles in the respective regiond Number of donor segments in the selected ISLs according to the DH mape Minimal extent of donor segmentsf Segment marked by E44M50-147E, position according to diploid MDE mapg Posititions are from a pair of markers that constitute lg22 in the DH map that were shown to belong to chromosome A8 in the
diploid MDE map
Euphytica (2016) 209:181–198 191
123

dominant (visible) allele coming from the donor
parent ‘RS239’ in the BC1 population.
The diploid MDE map consists of nineteen linkage
groups corresponding to the nineteen chromosomes of
B. napus. With about one marker every 4.5 cM the
marker density of this map can already be considered
high. Nevertheless, one linkage group, C4, consisted
of only five markers covering just 15.5 cM, although
Table 4 Diploidization rate of microspores of the 10 selected ISLs compared to the diplodization rate of microspores of the
recurrent parent ‘Express 617’
ISL na Nb Meanc Diploid
MDEs (%)dRatio
to express
v2e
ER137 16 110 6.9 43.6 0.83 3.79n.s.
ER199 10 107 10.7 36.4 0.69 0.13n.s.
ER281 19 142 7.5 23.9 0.46 7.38***
ER444 10 143 14.3 58.7 1.12 8.91n.s.
ER807 13 395 30.4 45.6 0.87 20.19n.s.
ER964 20 207 10.4 27.1 0.52 5.48***
ER984 11 168 15.3 25.6 0.49 6.27***
ER1284 13 119 9.2 32.8 0.63 0.22n.s.
ER1433 17 166 9.8 45.2 0.86 7.88n.s.
ER1437 16 123 7.7 56.1 1.07 11.62n.s.
Express 617 23 276 11.5 52.5 1
a Number of microspore preparationsb Number of individual MDEs analysed by flow cytometryc Mean number of embryos per microspore preparationd Percentage of diploid MDEse v2 test using the calculated ratio of diploid and non-diploid MDEs of ‘Express 617’ at the closer border of the 99 % confidence
interval (34.8 B 52.48 B 70.2) as the expected ratio
*, **, *** diploidization rate is significantly different from the mean diploidization rate of ‘Express 617’ at P = 0.05 (v2 = 3.84),
P = 0.01 (v2 = 6.64) and P = 0.001 (v2 = 10.83), respectively, n.s.: not significant (P[ 0.05 or the diploidization rate is between
the boundaries of the confidence interval of the mean of ‘Express 617’)
Table 5 Minimal and
maximal genome coverage
by the donor segments in
the selected ISLs according
to the DH map
ISL Minimal coverage Maximal coverage
Absolute
coverage (cM)
Percentage
of map (%)
Absolute
coverage (cM)
Percentage
of map (%)
ER137 42.8 2.14 62.4 3.12
ER199 15.8 0.79 32.2 1.61
ER281 43.9 2.19 74.1 3.70
ER444 5.5 0.27 7.7 0.38
ER807 5.5 0.27 7.7 0.38
ER964 66.9 3.34 76.2 3.80
ER984 24.2 1.21 75.1 3.75
ER1284 23.8 1.19 46.2 2.31
ER1433 3.2 0.16 10.8 0.54
ER1437 36.1 1.80 62.6 3.13
Mean 26.8 1.34 45.5 2.27
192 Euphytica (2016) 209:181–198
123

in other maps, for example the map published by Ecke
et al. (2010), C4 (N14) was much larger. In addition, in
the haploid MDE map and the BC1 map—both maps
developed in mapping populations derived from the
same F1 plant as the diploid MDE population—C4 was
also only present as a small fragment or missing
altogether. This indicates that, even though the marker
density was high, there are some parts of the genome,
at least on C4, which are not covered by the AFLP
markers of these maps. A possible explanation is that
in this part of the genome extensive deletions or
homoeologous exchanges between the two genomes
of rapeseed have occurred. As a result marker loci may
be deleted or, in the case of non-reciprocal homoeol-
ogous exchanges, duplicated on different chromo-
somes, which would render the markers unmappable.
It has actually been shown that homoeologous
exchanges occur with higher frequency in resynthe-
sized rapeseed genotypes or in crosses between such
genotypes and natural rapeseed than in natural rape-
seed itself (Parkin et al. 1995; Song et al. 1995; Udall
et al. 2005; Szadkowski et al. 2010; Chalhoub et al.
2014). Furthermore Ecke et al. (2015) found some
evidence that such occurrences have happened during
the development of the ISLs or already in the donor
parent ‘RS239’.
About 40 % of the markers (186 out of 470
markers) on the diploid MDE map showed skewed
segregations in the diploid MDE population. This is
less than the 48 % that had been observed in the
haploid MDE population (Ecke et al. 2015), a
somewhat unexpected result since the diploid MDE
population has experienced an extra limiting step, the
diploidization, which should have caused additional
skewed segregations. This contradiction may indicate
that sample effects, that is chance, may have con-
tributed to the occurrence of skewed segregations in
both populations.
On the diploid MDE map, the skewed markers
cluster in 32 regions, including nine regions marked by
only one marker. Overall, both parental alleles were
favoured in a similar number of regions. Contrary to
this, among the eight regions where skewed segrega-
tions were only observed in the diploid MDE popu-
lation—the pattern expected when the skewed
segregations are due to the segregation of alleles at a
locus controlling the diploidization efficiency—all but
two regions showed an excess of ‘Express 617’ alleles.
On the other hand, among the five regions with
changing patterns of skewed segregations, where only
part of the region showed the expected pattern, five
showed an excess of ‘RS239’ alleles. In addition,
‘RS239’ alleles were predominantly favoured among
the single marker regions where eight out of nine
showed an excess of this allele. This distribution of the
favoured allele across different types of regions with
skewed segregations may indicate that ‘Express 617’
contributed more alleles or more strongly acting
alleles favourable for the diploidization efficiency of
isolated microspores of rapeseed than ‘RS239’.
Table 6 Genomic regions that may control the diploidization rate of microspores
LG Minimal extent Maximal extent No. Markers ISLs
Start
(cM)aEnd
(cM)
Length
(cM)
Start
(cM)
End
(cM)
Length
(cM)
A03b 129.9 129.9 0 127.4 129.9 2.5 1 ER281, ER964, ER984
A03 136.8 136.8 0.0 134.4 137.7 3.3 1 ER281, ER964
A08/lg22c 0.0 4.6 4.6 0.0 4.6 4.6 2 ER984
C03 77.1 79.3 2.2 74.4 83.7 9.3 2 ER984
C04 23.9 80.7 56.8 23.9 81.5 57.6 10 ER281, ER964
C04 84.4 94.5 10.1 81.5 96.8 15.3 7 ER281, ER964
C05 34.9 44.8 9.9 34.9 65.7 30.8 7 ER984
Sum 83.6 123.4
Map coverage 4.17 % 6.16 %
a Positions refer to the DH map if not indicated differentlyb Marker position is referring to the diploid MDE mapc Two markers constituting lg22 in the DH map that belong to A08 according to the diploid MDE map
Euphytica (2016) 209:181–198 193
123

Single marker regions were excluded from the
selection of regions with skewed segregations for
verification. This exclusion was based on two consid-
erations: (1) when a region with skewed segregations
is only indicated by just one marker there is an
increased probability that the underlying genetic
factor has only a minor effect, and (2) with individual
markers there is always the possibility that skewed
segregations are due to a bias in allele scoring. If one
of the alleles is more difficult to score, more failed
scorings may occur for this allele, leading to a
deviation from the expected allele ratio among the
scored genotypes.
To verify possible effects of the five genomic
regions chosen because they showed the pattern of
skewed segregations across the populations expected
from the segregation of a locus controlling the
diploidization capacity of isolated microspores, ten
ISLs were selected with donor segments covering the
chosen regions. The comparison of the diploidization
rates of isolated microspores of the ISLs with the rate
of ‘Express 617’ was hampered by the fact that
microspores of ‘Express 617’ and most of the ISLs
have a very low embryogenic potential (Ecke et al.
2015). As a consequence, many of the repeated
microspore cultivations yielded less than ten MDEs,
a number considered too small a sample size for a
proper analysis of variance. Therefore, diploidization
rates derived from the total number of MDEs of an ISL
were compared to the rate of ‘Express 617’ by v2 tests.
To at least take into account the statistical error in the
determination of the diploidization rate of ‘Express
617’ in these comparisons, a larger number of
microspore cultivations was carried out for this
genotype until 12 cultures were available that had
produced at least ten MDEs from which 12 estimates
of the diploidization rate could be calculated. To not
loose the information from the additional MDEs
produced in the remaining cultures completely, these
were combined and a 13th estimate was calculated.
Based on these estimates a mean and a 99 %
confidence interval for the diploidization rate of
microspores of ‘Express 617’ could be calculated,
with the boundaries of the latter providing the
expected frequencies for the v2 tests.
The mean diploidization rate of ‘Express 617’ was
52.5 % and the ISLs showed a range from 23.9 to
58.7 %. These values fall into the lower to middle
range of the diploidization rates of 37–94 % reported
in the literature for isolated microspores after
colchicine treatment (Chen et al. 1994; Mollers et al.
1994; Iqbal et al. 1994; Hansen and Andersen 1996;
Klutschewski 2013). Three ISLs had significantly
reduced diploidization rates of 23.9, 25.6 and 27.1 %
respectively. No lines with significantly increased
diploidization rates were found. This is perhaps not
surprising since four of the five regions with skewed
segregations chosen for verification showed an excess
of ‘Express 617’ alleles, which would indicate that the
donor alleles should decrease diploidization rates.
This bias in the selection of regions for verification
was due to the fact that three regions were chosen from
the regions that showed the expected pattern of
skewed segregations along their whole length, which,
with two exceptions, all showed an excess of ‘Express
617’ alleles. The other two regions were chosen from
the regions with changing patterns, but here the one
region showing an excess of ‘Express 617’ alleles was
included in the selection. This region was chosen
because of a subsection showing a clear pattern of
skewed segregations with the v2 values in the haploid
MDE population continuously falling along the sub-
section and the values in the diploid MDE population
rising to a peak in the middle of the subsection before
falling again. The latter pattern is exactly the pattern
expected when the skewed segregations are caused by
a selective factor segregating at the peak position.
The comparison of the donor segments of the lines
with significantly reduced diploidization rates with the
segments of the non-significant lines identified seven
genomic regions that were only covered by donor
segments in the significant lines. Therefore, these
regions, which cover only between 4.17 and 6.16 % of
the rapeseed genome, are candidate regions for
carrying the genetic factor(s) that reduced the
diploidization rates in the significant lines. On the
other hand, the seven regions may not represent all
differences between the significant and non-significant
lines. Three of the lines, ER137, ER1284, and
ER1437, had been included in the high-throughput
SNP analysis published by Ecke et al. (2015). In this
analysis additional, mostly small donor segments were
detected, which could not be taken into account in the
current analysis because it was not possible to include
all of the ISLs analysed here in the SNP analysis. The
detection of additional donor segments in the ISLs not
discovered in the original AFLP analysis reflects on a
basic problem inherent in using ISLs for genetic
194 Euphytica (2016) 209:181–198
123

analysis. ISLs are produced by several rounds of
backcrossing, with one round of meiotic recombina-
tion in each generation. This increases the probability
that small donor segments are produced that may not
be detected in the marker analysis used to characterize
the lines. Furthermore, in rapeseed, especially in
crosses with resynthesized rapeseed, further genetic
changes may be present in ISLs due to homoeologous
exchanges whose detection may depend on the marker
type used (Ecke et al. 2015).
Only based on the comparison of donor segments
between significant and non-significant lines it was not
possible to assign a genetic factor to a specific
genomic region because all three of the significant
lines carried several segments that were not present in
the non-significant lines. On the other hand, the 10
ISLs had been selected because they carry donor
segments that cover or overlap regions with strongly
skewed segregations in the diploid MDE population
and regular segregations in the haploid MDE and BC1
populations. For the region on A3, two ISL, ER984
and ER1433, had been selected. While ER984 showed
a significantly reduced diploidization rate of 25.6 %,
the diploidization rate of ER1433, 45.2 %, was much
higher and not significantly different from the rate of
‘Express 617’. According to the genetic characteriza-
tion of the ISLs based on the DH map (Fig. S1) the
donor segment in ER984 on A3 is a subsegment of the
segment in ER1433 and ER1437, another non-signif-
icant line. On the other hand, ER984 and ER1433 are
distiguished by E44M50-147E from the diploid MDE
map, wich shows a donor allele in ER984 but not in
ER1433 or ER1437. Interestingly, this marker also
shows donor alleles in ER281 and ER641, the two
other significant lines, but in none of the non-
significant lines. This finding provides a strong
argument that the AFLP marker E44M50-147E on
A3 is indeed linked to a gene controlling the
diploidization rate of isolated microspores. The
reduced diploidization rates of the significant ISLs
would indicate that ‘Express 617’ contributes the
favourable allele, which is in agreement with the
excess of ‘Express 617’ alleles observed at the marker
loci in the respective region of A3 in the diploid MDE
map.
The other two lines with significantly reduced
diploidization rates, ER281 and ER964, had been
selected because they carry donor segments that cover
the region with skewed segregations on C4. Since
these donor segments do not occur in any of the non-
significant lines, the significantly reduced diploidiza-
tion rates of ER281 and ER964 support the idea that
the skewed segregations on C4 are due to the
segregation of alleles at a locus controlling diploidiza-
tion rates in isolated microspores of rapeseed. Again,
‘Express 617’ would have contributed the favourable
allele. On the other hand, ER281 and ER964 show
donor alleles at the marker locus E44M50-147E, too,
which is strongly implicated to be linked to a factor
controlling diploidization rates. In addition, the
diploidization rates of the two lines are quite similar
to one another and to the rate of ER984, raising the
possibility that just one factor, a gene linked to
E44M50-147E, may be responsible for the reduced
diploidization rates of the three lines. Then again, the
broad range of diploidization rates from 37 to 94 %
described in the literature (Chen et al. 1994; Mollers
et al. 1994; Iqbal et al. 1994; Hansen and Andersen
1996; Klutschewski 2013) would argue for a poly-
genic control of this trait. Taking into account the large
genetic distance between the parents of the mapping
populations, ‘Express 617’ being a natural biannual
rapeseed type and ‘RS239’ an annual resynthesized
rapeseed, it is quite likely that more than one gene
controlling diploidization rates in rapeseed is segre-
gating in our populations. Accordingly, the possibility
that the reduced diploidization rates of the three
significant ISLs are due to more than one genetic
factor residing on different donor segments cannot be
discarded just based on the current results.
The ISLs selected for donor segments covering the
regions with skewed segregations on A2, A7 and A8
did not show significant differences in their diploidiza-
tion rates from the rate of ‘Express 617’. Accordingly,
the hypothesis that the skewed segregations in these
regions are caused by the segregation of different
alleles at a locus controlling diploidization rates could
not be verified in this study. On the other hand, the
results do not actually disprove this hypothesis. There
are two reasons why the verification could have failed
although the hypothesis is correct: (1) the non-
significant ISLs still show a broad range of diploidiza-
tion rates, from 32.8 to 58.7 %. There may be true
effects that just could not be detected due to limits to
the statistical power of the experiments conducted. (2)
On A8, the region with the expected pattern of skewed
segregations is not completely covered by the minimal
extent of the donor segments, raising the possibility
Euphytica (2016) 209:181–198 195
123

that the gene causing the skewed segregations is not
located on the donor segments.
As far as we are aware the work presented here is
the first study into the genetics of the diploidization
capacity of isolated microspores in rapeseed. In this
study it was possible to identify seven genomic
regions, which may carry genetic factors that affect
the diploidization rate of isolated microspores of B.
napus and to identify one marker that has a high
probability to be actually linked to one of these factors.
It was not possible to assign one of the genetic factors
responsible for the reduced diploidization rates of the
significant ISLs unequivocally to a specific region of
the genome or to determine their exact number, but the
seven genomic regions that should carry these factors
cover only about 4 % of the rapeseed genome in their
minimal extent. Furthermore, three ISLs with signif-
icantly reduced diploidization rates compared to the
recurrent parent ‘Express 617’ have been identified.
These lines are distinguished from ‘Express 617’ by
only a few donor segments that cover in their minimal
extent just between 1.21 and 3.34 % of the genome
according to the genetic characterization of the lines
based on the DH map. This makes these lines together
with ‘Express 617’ an ideal material for further genetic
studies on diploidization efficiency, for example by
using transcriptomic, proteomic or metabolomic
approaches. They also represent an ideal starting
material for a fine mapping of the genes controlling the
diploidization rate. By again backcrossing the lines
with ‘Express 617’ new ISLs with a smaller set of
donor segments and with donor segments representing
subsegments of the segments in the significant lines
could be produced, which could be used to further
delimit the position of the genes controlling the
diploidization rate. The three ISLs and the recurrent
parent ‘Express 617’ are availabel upon request from
the corresponding author.
Acknowledgments This study was funded by the Deutsche
Forschungsgemeinschaft (DFG), grant no. EC 131/6-1. We
thank Rosemarie Clemens for skillful technical help during this
study. WE also thanks Christian Mollers for stimulating
discussions that contributed to the design of the project. We
are grateful to the Bundesministerium fur Bildung und
Forschung (BMBF, Federal Ministry for Education and
Research) that funded the first 3 years of the development of
the ISLs within the program GABI (Grant no. 0315053F) and to
the breeding companies Deutsche Saatveredelung AG, KWS
SAAT AG, Norddeutsche Pflanzenzucht Hans-Georg Lembke
KG and SW Seed GmbH whose financial support allowed us to
continue the development of the lines.
Compliance with ethical standards
Conflict of interest The authors state that the experiments
comply with the current laws in Germany where they were
performed. The authors declare that they have no conflict of
interest.
Open Access This article is distributed under the terms of the
Creative Commons Attribution 4.0 International License (http://
creativecommons.org/licenses/by/4.0/), which permits unre-
stricted use, distribution, and reproduction in any medium,
provided you give appropriate credit to the original
author(s) and the source, provide a link to the Creative Com-
mons license, and indicate if changes were made.
References
Albrecht S, Mollers C, Robbelen G (1995) Selection in vitro for
erucic acid content in segregating populations of micro-
spore-derived embryoids of Brassica napus. Plant Breed
114:210–214
Baillie AMR, Epp DJ, Hutcheson D, Keller WA (1992) In vitro
culture of isolated microspores and regeneration of plants
in Brassica campestris. Plant Cell Rep 11:234–237
Barro F, Fernandez-Escobar J, De la Vega M, Martin A (2001)
Doubled haploid lines of Brassica carinata with modified
erucic acid content through mutagenesis by EMS treatment
of isolated microspores. Plant Breed 120:262–264
Barro F, Fernandez-Escobar J, De la Vega M, Martin A (2002)
Modification of glucosinolate and erucic acid contents in
doubled haploid lines of Brassica carinata by UV treat-
ment of isolated microspores. Euphytica 129:1–6
Burnett L, Yarrow S, Huang B (1992) Embryogenesis and plant
regeneration from isolated microspores of Brassica rapa L.
ssp. oleifera. Plant Cell Rep 11:215–218
Cegielska-Taras T, Pniewski T, Szala L (2008) Transformation
of microspore-derived embryos of winter oilseed rape
(Brassica napus L.) by using Agrobacterium tumefaciens.
J Appl Genet 49:343–347
Chalhoub B, Denoeud F, Liu S, Parkin IAP et al (2014) Early
allopolyploid evolution in the post-Neolithic Brassica
napus oilseed genome. Science 345:950–953
Chen JL, Beversdorf WD (1994) A combined use of micro-
projectile bombardment and DNA imbibition enhances
transformation frequency of canola (Brassica napus L.).
Theor Appl Genet 88:187–192
Chen ZZ, Snyder S, Fan ZG, Loh WH (1994) Efficient pro-
duction of doubled haploid plants through chromosome
doubling of isolated microspores in Brassica napus. Plant
Breed 113:217–221
Cloutier S, Cappadocia M, Landry BS (1995) Study of micro-
spore-culture responsiveness in oilseed rape (Brassica
napus L.) by comparative mapping of a F2 population and
two microspore-derived populations. Theor Appl Genet
91:841–847
196 Euphytica (2016) 209:181–198
123

Delourme R, Falentin C, Huteau V, Clouet V, Horvais R,
Gandon B, Specel S, Hanneton L, Dheu JE, Deschamps M,
Margale E, Vincourt P, Renard M (2006) Genetic control
of oil content in oilseed rape (Brassica napus L.). Theor
Appl Genet 113:1331–1345
Dormann M, Wang H-M, Oelck M (2001) Transformed
embryogenic microspores for the generation of fertile
homozygous plants. USA Pat 6(316):694
Ecke W, Clemens R, Honsdorf N, Becker HC (2010) Extent and
structure of linkage disequilibri-um in canola quality
winter rapeseed (Brassica napus L.). Theor Appl Genet
120:921–931
Ecke W, Kampouridis A, Ziese-Kubon K, Hirsch AC (2015)
Identification and genetic characterization by high-
throughput SNP analysis of intervarietal substitution lines
of rapeseed (Brassica napus L.) with enhanced embryo-
genic potential. Theor Appl Genet 128:587–603
Ferreira ME, Williams PH, Osborn TC (1994) RFLP mapping of
Brassica napus using doubled haploid lines. Theor Appl
Genet 89:615–621
Ferrie AMR, Caswell KL (2011) Isolated microspore culture
techniques and recent progress for haploid and doubled
haploid plant production. Plant Cell Tissue Organ Cult
104:301–309
Ferrie AMR, Keller WA (2007) Optimization of methods for
using polyethylene glycol as a non-permeating osmoticum
for the induction of microspore embryogenesis in the
Brassicaceae. In Vitro Cell Dev Biol Plant 43:348–355
Ferrie AMR, Mollers C (2011) Haploids and doubled haploids
in Brassica spp. for genetic and genomic research. Plant
Cell Tiss Organ Cult 104:375–386
Ferrie AMR, Taylor DC, MacKenzie SL, Rakow G, Raney JP,
Keller WA (2008) Microspore mutagenesis of Brassica
species for fatty acid modifications: a preliminary evalua-
tion. Plant Breed 127:501–506
Foisset N, Delourme R (1996) Segregation distortion in andro-
genic plants. In: Sopory SK, Veilleux RE (eds) In vitro
haploid production in higher plants. Kluwer Academic
Publisher, Dordrecht, pp 189–201
Foisset N, Delourme R, Lucas MO, Renard M (1993) Segre-
gation analysis of isozyme markers on isolated microspore-
derived embryos in Brassica napus l. Plant Breed
110:315–322
Fukuoka H, Ogawa T, Matsuoka M, Ohkawa Y, Yano H (1998)
Direct gene delivery into isolated microspores of rapeseed
(Brassica napus L.) and the production of fertile transgenic
plants. Plant Cell Rep 17:323–328
Gardner MJ, Altman DG (1989) Statistics with confidence:
confidence intervals and statistical guidelines. British
Medical Journal, London
Guerche P, Charbonnier M, Jouanin L, Tourneur C, Paszkowski
J, Pelletier G (1987) Direct gene transfer by electroporation
in Brassica napus. Plant Sci 52:111–116
Hansen NJP, Andersen SB (1996) In vitro chromosome dou-
bling potential of colchicine, oryzalin, trifluralin, and APM
in Brassica napus microspore culture. Euphytica
88:159–164
Howell PM, Marshall DF, Lydiate DJ (1996) Towards devel-
oping intervarietal substitution lines in Brassica napus
using marker-assisted selection. Genome 39:348–358
Huang B (1992) Genetic manipulation of microspores and
microspore-derived embryos. In Vitro Cell Dev Biol Plant
28:53–58
Iqbal MCM, Mollers C, Robbelen G (1994) Increased
embryogenesis after colchicine treatment of microspore
cultures of Brassica napus l. J Plant Physiol 143:222–226
Jardinaud M-F, Souvre A, Alibert G (1993) Transient GUS gene
expression in Brassica napus electroporated microspores.
Plant Sci 93:177–184
Klutschewski S (2013) Methodical improvements in microspore
culture of Brassica napus L. Dissertation, Georg-August-
Universitat Gottingen. http://hdl.handle.net/11858/00-
1735-0000-0001-BC20-2. Accessed 15 July 2015
Lichter R (1982) Induction of haploid plants from isolated
pollen of Brassica napus. Zeitschrift fur Pflanzenphysi-
ologie 105:427–434
Liu S, Wang H, Zhang J, Fitt BDL, Xu Z, Evans N, Liu Y, Yang
W, Guo X (2005) In vitro mutation and selection of dou-
bled-haploid Brassica napus lines with improved resis-
tance to Sclerotinia sclerotiorum. Plant Cell Rep
24:133–144
Mollers C, Iqbal MCM (2009) Doubled haploids in breeding
winter oilseed rape. In: Touraev A, Forster BP, Jain SM
(eds) Advances in haploid production in higher plants.
Springer, Heidelberg, pp 161–170
Mollers C, Iqbal MCM, Robbelen G (1994) Efficient
diploidization of Brassica napus by colchicine treatment of
microspores and regeneration of doubled haploid plants.
Euphytica 75:95–104
Mollers C, Rucker B, Stelling D, Schierholt A (2000) In vitro
selection for oleic and linoleic acid content in segregating
populations of microspore derived embryos of Brassica
napus. Euphytica 112:195–201
Nehlin L, Mollers C, Bergman P, Glimelius K (2000) Transient
ß-gus and GFP gene expression and viability analysis of
microprojectile bombarded microspores ofBrassica napus.
J Plant Physiol 156:175–183
Nurhasanah (2010) QTL mapping using intervarietal substitu-
tion lines in rapeseed (Brassica napus L.). Dissertation,
Georg-August-Universitat Gottingen. Cuvillier Verlag,
Gottingen, Germany
Parkin IAP, Sharpe AG, Keith DJ, Lydiate DJ (1995) Identifi-
cation of the A and C genomes of amphidiploid Brassica
napus (oilseed rape). Genome 38:1122–1131
Qiu D, Morgan C, Shi J, Long Y, Liu J, Li R, Zhuang X, Wang
Y, Tan X, Dietrich E, Weihmann T, Everett C, Vanstraelen
S, Beckett P, Fraser F, Trick M, Barnes S, Wilmer J,
Schmidt R, Li J, Li D, Meng J, Bancroft I (2006) A com-
parative linkage map of oilseed rape and its use for QTL
analysis of seed oil and erucic acid content. Theor Appl
Genet 114:67–80
Radoev M, Becker HC, Ecke W (2008) Genetic analysis of
heterosis for yield and yield components in rapeseed (Bras-
sica napus L.) by QTL mapping. Genetics 179:1547–1558
Seguı-Simarro JM, Nuez F (2008) Pathways to doubled hap-
loidy: chromosome doubling during androgenesis. Cyto-
genet Genome Res 120:358–369
Sharpe AG, Parkin IAP, Keith DJ, Lydiate DJ (1995) Frequent
nonreciprocal translocations in the amphidiploid genome
of oilseed rape (Brassica napus). Genome 38:1112–1121
Euphytica (2016) 209:181–198 197
123

Song K, Lu P, Tang K, Osborn TC (1995) Rapid genome change
in synthetic polyploids of Brassica and its implications for
polyploid evolution. Proc Natl Acad Sci USA
92:7719–7723
Sonntag K, Rudloff E (2004) Microspore mutagenesis in
transgenic oilseed rape for the modification of fatty-acid
composition. Acta Universitatis Latviensis Biol
676:227–230
Swanson EB, Coumans MP, Wu SC, Barsby TL, Beversdorf
WD (1987) Efficient isolation of microspores and the
production of microspore-derived embryos from Brassica
napus. Plant Cell Rep 6:94–97
Szadkowski E, Eber F, Huteau V, Lode M, Huneau C, Belcram
H, Coriton O, Manzanares-Dauleux MJ, Delourme R, King
GJ, Chalhoub B, Jenczewski E, Chevre A-M (2010) The
first meiosis of resynthesized Brassica napus, a genome
blender. New Phytol 186:102–112
Thomas WTB, Forster BP, Gertsson B (2003) Doubled haploids
in breeding. In: Maluszynski M, Kasha KJ, Forster BP,
Szarejko I (eds) Doubled haploid production in crop plants.
Kluwer Academic Publishers, Dordrecht, pp 337–349
Udall JA, Quijada PA, Osborn TC (2005) Detection of chro-
mosomal rearrangements derived from homeologous
recombination in four mapping populations of Brassica
napus l. Genetics 169:967–979
Uzunova M, Ecke W, Weißleder K, Robbelen G (1995) Map-
ping the genome of rape-seed (Brassica napus L.). I. Con-
struction of an RFLP linkage map and localization of QTLs
for seed glucosinolate content. Theor Appl Genet
90:194–204
Weber S, Unker F, Friedt W (2005) Improved doubled haploid
production protocol for Brassica napus using microspore
colchicine treatment in vitro and ploidy determination by
flow cytometry. Plant Breed J 124:511–513
Zhang FL, Aoki S, Takahata Y (2003) RAPD markers linked to
microspore embryogenic ability in Brassica crops.
Euphytica 131:207–213
Zhao JP, Simmonds DH, Newcomb W (1996a) High frequency
production of doubled haploid plants of Brassica napus cv.
Topas derived from colchicine-induced microspores
embryogenesis without heat shock. Plant Cell Rep
15:671–688
Zhao JP, Simmonds DH, Newcomb W (1996b) Induction of
embryogenesis with colchicine instead of heat in micro-
spores of Brassica napus L. cv. Topas Planta 198:433–439
Zhao J, Becker HC, Zhang D, Zhang X, Ecke W (2005) Oil
content in a European x Chinese rapeseed population: QTL
with additive and epistatic effects and their genotype–en-
vironment interactions. Crop Sci 45:51–59
Zhou WJ, Hagberg P, Tang GX (2002a) Increasing embryoge-
nesis and doubling efficiency by immediate colchicine
treatment of isolated microspores in spring Brassica napus.
Euphytica 128:27–34
Zhou WJ, Tang GX, Hagberg P (2002b) Efficient production of
doubled haploid plants by immediate colchicine treatment
of isolated microspores in winter Brassica napus. Plant
Growth Regul 37:185–192
198 Euphytica (2016) 209:181–198
123