identification of genes potentially involved in the
TRANSCRIPT

INTRODUCTIONNeurofibromatosis type 1 (NF1) is an
autosomal-dominant neurocutaneous dis-order affecting 1 in 3,000 individualsworldwide (1). The NF1 gene, located inchromosome region 17q11.2, was identi-fied by positional cloning; its proteinproduct, neurofibromin, functions as atumor suppressor (2,3). Main clinicalcharacteristics of NF1 include café au laitspots (CALS), Lish nodules, freckling andneurofibromas. These patients are also atan increased risk of both benign and ma-lignant tumors, and NF1 is thus classifiedas a tumor predisposition syndrome. Themost common tumors are benign periph-eral nerve sheath tumors (neurofibromas),
which vary greatly in both number andsize and may be dermal or plexiform (4).
In contrast to dermal neurofibromas,plexiform neurofibromas can progress tomalignant peripheral nerve sheath tu-mors (MPNSTs) in about 10% of patientswith NF1 (5). MPNSTs are resistant toconventional therapies, and their deep-seated position and locally invasivegrowth hinder complete surgical resec-tion. Both neurofibromas and MPNSTsare heterogeneous tumors mainly com-posed of Schwann cells (60–80%), to-gether with fibroblasts, mast cells andother cell types. Schwann cells are con-sidered to be the pathogenic cell type ofthese two tumor types.
Most patients with NF1 have a smallmutation in the NF1 gene (point muta-tion, small deletion, intragenic insertionor duplication). Approximately 5% ofNF1 patients have a large rearrangement,classically known as NF1 microdeletion(6–8). Most of these microdeleted patientshave a germline 1.4-Mb microdeletion en-compassing the entire 350-kb NF1 gene,caused by unequal recombination be-tween two highly homologous segmentstermed NF1 low copy repeats (NF1-REPs)(9). Genome database analysis indicatesthat the common NF1 microdeletion re-gion contains at least 16 additional pro-tein-coding genes, 4 pseudogenes and 2 microRNAs (Table 1 and Figure 1) (10).Most of these genes have unknown functions. It is noteworthy that 1 of the2 microRNAs (has-mir-193a) was recentlyidentified as a tumor suppressor miRNAthat is epigenetically silenced in oralsquamous cell carcinoma (11).
NF1-microdeleted patients have amore severe phenotype than the general
M O L M E D 1 7 ( 1 - 2 ) 7 9 - 8 7 , J A N U A R Y - F E B R U A R Y 2 0 1 1 | P A S M A N T E T A L . | 7 9
Identification of Genes Potentially Involved in the IncreasedRisk of Malignancy in NF1-Microdeleted Patients
Eric Pasmant,1,2 Julien Masliah-Planchon,1,2 Pascale Lévy,1 Ingrid Laurendeau,1 Nicolas Ortonne,3
Béatrice Parfait,1,2 Laurence Valeyrie-Allanore,4 Karen Leroy,5 Pierre Wolkenstein,4 Michel Vidaud,1,2
Dominique Vidaud,1,2 and Ivan Bièche1,2,6
1UMR745 INSERM, Université Paris Descartes, Faculté des Sciences Pharmaceutiques et Biologiques, Paris, France; 2Service deBiochimie et de Génétique Moléculaire, Hôpital Beaujon, Clichy, France; 3Département de Pathologie, Hôpital Henri Mondor-AP-HP,Université Paris 12, Créteil, France; 4Service de Dermatologie, Hôpital Henri Mondor-AP-HP, Université Paris 12, Créteil, France;5Platform of Biological Resources, Hôpital Henri Mondor-AP-HP, Université Paris 12, Créteil, France; and 6INSERM U735, CentreRené Huguenin, Saint-Cloud, France
Patients with NF1 microdeletion develop more neurofibromas at a younger age, and have an increased risk of malignant pe-ripheral nerve sheath tumors (MPNSTs). We postulated that the increased risk of malignancy could be due to inactivation, in ad-dition to NF1, of a second tumor suppressor gene located in the typical 1.4-Mb microdeletion found in most of the microdeletedpatients. We investigated the expression of NF1, the other 16 protein-coding genes and the 2 microRNAs located in the 1.4-Mbmicrodeletion by means of real-time quantitative reverse-transcription polymerase chain reaction (RT-PCR) in a large series ofhuman dermal and plexiform neurofibromas and MPNSTs. Five genes were significantly upregulated: OMG and SUZ12 in plexiformneurofibromas and ATAD5, EVI2A and C17orf79 in MPNSTs. More interestingly, two genes were significantly downregulated (RNF135and CENTA2) in tumor Schwann cells from MPNST biopsies and in MPNST cell lines. This study points to the involvement of severalgenes (particularly RNF135 and CENTA2) in the increased risk of malignancy observed in NF1-microdeleted patients.© 2011 The Feinstein Institute for Medical Research, www.feinsteininstitute.orgOnline address: http://www.molmed.orgdoi: 10.2119/molmed.2010.00079
Address correspondence and reprint requests to Eric Pasmant, UMR745 INSERM, Université
Paris Descartes, Faculté des Sciences Pharmaceutiques et Biologiques, 4 avenue de
L’Observatoire, 75006, Paris, France. Phone: +33-1-53-73-97-25; Fax: +33-1-44-07-17-54;
E-mail: [email protected].
Submitted June 14, 2010; accepted for publication September 7, 2010; Epub
(www.molmed.org) ahead of print September 10, 2010.

NF1 population. In particular, NF1-mi-crodeleted patients show learning dis-ability, facial dysmorphism and cardio-vascular malformations (12–14). It hasbeen suggested that OMG and RNF135haploinsufficiency may be involved inthe learning disability, the RNF135 genein the facial dysmorphism and theSUZ12/JJAZ1 and CENTA2 genes in thecardiovascular malformations (13–15).NF1-microdeleted patients have moreneurofibromas, at an earlier age, and arealso at an increased risk of developingMPNSTs (9,16–19). De Raedt et al. (16) es-timated that the lifetime risk of MPNSTin NF1- microdeleted patients is almosttwice that observed in the general NF1population. The increased malignancyrisk may be explained by variations inthe expression of one or several genes(tumor suppressor genes rather thanoncogenes) located in the 1.4-Mb mi-crodeletion. Piddubnyak et al. (20) sug-gested that reduced expression of
HCA66 protein, owing to haploinsuffi-ciency of the UTP6/HCA66 gene, couldmake NF1-microdeleted patients’ cellsless susceptible to apoptosis.
The aim of this study was to identifycandidates for involvement in MPNSTtumorigenesis among the 18 additionalgenes (16 protein-coding genes and 2 mi-croRNA genes) located in the 1.4-Mb mi-crodeletion. Changes in the expression ofNF1 and of these 18 genes were analyzedby real-time quantitative reverse- transcription polymerase chain reaction(RT-PCR) in a large series of human der-mal and plexiform neurofibromas andMPNSTs, as well as in MPNST cell lines.
MATERIALS AND METHODS
Patients and SamplesSamples of 23 dermal neurofibromas,
13 plexiform neurofibromas and 13 MPNSTs were obtained by laser excision(dermal neurofibromas) or surgical exci-
sion (plexiform neurofibromas and MPNSTs) from NF1 patients at HenriMondor Hospital (Creteil, France). Theexperiments of this work comply withthe current French laws. Written in-formed consent for sample collection anddata publication was obtained from allpatients or their relatives. The dermalneurofibromas were used as “normal”control samples, since they are not at riskof developing into malignant MPNSTs.Indeed, neurofibromas are heterogeneousbenign tumors composed of Schwanncells, fibroblasts, mast cells and othercells and have no “normal” tissue equiva-lent. Gene expression levels in plexiformneurofibromas and MPNSTs, determinedby real-time RT-PCR analysis, were thusexpressed relative to the expression levelsin dermal neurofibromas. Immediatelyafter surgery, the tumor samples wereflash-frozen in liquid nitrogen and storedat –80°C until RNA extraction. The mainclinical and histological characteristics of
8 0 | P A S M A N T E T A L . | M O L M E D 1 7 ( 1 - 2 ) 7 9 - 8 7 , J A N U A R Y - F E B R U A R Y 2 0 1 1
C A N C E R G E N E S I N N F 1 - M I C R O D E L E T E D P A T I E N T S
Table 1. Genes located in the 1.4-Mb microdeletion.
GenBank Orientation: Alternative accession Location at Sense (+);
Gene Symbola symbols number 17q11.2 (kb) Antisense (–) Gene name
LRRC37B2 DKFZp667M2411 NM_207323 25,959–25,966 + Leucine rich repeat containing 37, member B2SUZ12Pb LOC440423, JJAZ1-P BC041912 26,082–26,121 + Suppressor of zeste 12 homolog pseudogeneCRLF3 CYTOR4 NM_015986 26,175–26,133 – Cytokine receptor-like factor 3LOC646013b — XR_017620 26,182–26,183 + LOC646013 similar to 40S ribosomal protein S17ATAD5 FLJ12735 NM_024857 26,183–26,246 + ATPase family, AAA domain containing 5C17orf42 FLJ22729 NM_024683 26,257–26,250 – Chromosome 17 open reading frame 42CENTA2 HSA272195 NM_018404 26,273–26,310 + Centaurin, α2RNF135 MGC13061 NM_032322 26,322–26,351 + Ring finger protein 135DPRXP4b — AC138207 26,326–26,327 + Divergent-paired related homeobox pseudogene 4LOC646021 — XM_933339 26,356–26,396 + LOC646021 hypothetical LOC646021LOC646037 — XM_928998 26,404–26,399 – LOC646037 similar to CG11835-PANF1 — NM_000267 26,446–26,725 + Neurofibromin 1OMG OMGP NM_002544 26,648–26,645 – Oligodendrocyte myelin glycoproteinEVI2B — NM_006495 26,665–26,654 – Ecotropic viral integration site 2BEVI2A — NM_014210 26,672–26,668 – Ecotropic viral integration site 2AAK3P1b — X60674 26,696–26,697 + Adenylate kinase 3 pseudogene 1RAB11FIP4 Rab11-FIP4 NM_032932 26,742–26,889 + RAB11 family interacting protein 4 (class II)MIRN193A hsa-mir-193a MI0000487 26,911–26,911 + MicroRNA 193aMIRN365-2 hsa-mir-365-2 MI0000769 26,926–26,926 + MicroRNA 365-2C17orf79 HSA272196 NM_018405 27,210–27,203 – Chromosome 17 open reading frame 79UTP6 HCA66, C17orf40 NM_018428 27,252–27,214 – UTP6, small subunit (SSU) processome componentSUZ12 JJAZ1, KIAA0160 NM_015355 27,288–27,352 + Suppressor of zeste 12 homolog (Drosophila)LRRC37B LOC114659 NM_052888 27,372–27,404 + Leucine-rich repeat containing 37B
aEntrez gene symbol.bPseudogene.

the patients with MPNSTs are shown inSupplemental Table 1.
We also analyzed the seven followingMPNST cell lines: NMS-2, NMS-2PC, 88-3, ST88-14, 90-8, S462 and T265. NMS-2and NMS-2PC were gifts from Dr. AkiraOgose (Niigata University School ofMedicine, Niigata, Japan); 88-3, ST88-14and 90-8 were gifts from Dr. Nancy Rat-ner (Cincinnati Children’s Hospital Med-ical Center, Cincinnati, OH, USA); S462was a gift from Dr. Lan Kluwe (Univer-sity Hospital Eppendorf, Hamburg, Ger-many); and T265 was a gift from Dr.Georges De Vries (Loyola University,Chicago, OH, USA). MPNST cell lineswere grown in RPMI medium supple-mented with 15% heat-inactivated fetalbovine serum, 10 IU/mL penicillin and10 μg/mL streptomycin.
Normal Schwann cells and fibroblastswere obtained by primary cell cultureand differential isolation from normalskin and sciatic nerve biopsies, respec-tively, and using cell culture and isola-tion conditions as previously described(21–22). Normal mast cells were ob-tained by means of cell culture and vari-ous specific purification steps from cordblood–derived human cells, as previ-ously described (23).
NF1 Alteration AnalysisNF1 alteration analysis (GenBank
reference sequence NM_000267.1,www.ncbi.nlm.nih.gov/GenBank) wasperformed using a variety of NF1 genescreening methodologies including se-quencing (for point mutations) and loss ofheterozygosity assessment using a series
of 17q11.2-linked microsatellite markers(D17S841, D17S635, D17S1307, D17S2163,D17S1166, IVS38-GT53.0, D17S1800 andD17S798). The primer oligonucleotide se-quences for microsatellite markers studyare given in Supplemental Table 2.
Real-Time RT-PCR for Protein-CodingGenes
The theoretical and practical aspects ofreal-time quantitative RT-PCR using theABI Prism 7900 Sequence Detection Sys-tem (Applied Biosystems, Foster City,CA, USA) have been described in detailelsewhere (24). Quantitative values areobtained from the threshold cycle num-ber at which the increase in the fluores-cence signal generated by SYBR® Greendye amplicon complex formation (associ-ated with exponential growth of PCRproducts) passes a fixed threshold abovebaseline. The precise amount of totalRNA added to each reaction mix (basedon optical density) and its quality (that is,lack of extensive degradation) are diffi-cult to assess. We therefore also quanti-fied transcripts of two endogenous RNAcontrol genes involved in two cellularmetabolic pathways, namely TBP (Gen-Bank accession NM_003194), which en-codes the TATA box-binding protein(a component of the DNA-binding pro-tein complex transcription factor II D[TFIID]), and RPLP0 (also known as 36B4;NM_001002), which encodes humanacidic ribosomal phosphoprotein P0. Weselected TBP and RPLP0 as endogenouscontrols because the prevalence of theirtranscripts is low (threshold cycle [Ct]values between 24 and 26 in the tumorsamples) and high (Ct values between 18and 20), respectively. Each sample wasnormalized on the basis of its TBP (orRPLPO) content. Results, expressed asN-fold differences in target gene expres-sion relative to the TBP (or RPLPO) geneand termed “Ntarget,” were determined as Ntarget = 2ΔCt sample, where the ΔCtvalue of the sample was determined bysubtracting the average Ct value of thetarget gene from the average Ct value ofthe TBP (or RPLP0) gene (24,25). The Ntarget values of the samples were subse-
R E S E A R C H A R T I C L E
M O L M E D 1 7 ( 1 - 2 ) 7 9 - 8 7 , J A N U A R Y - F E B R U A R Y 2 0 1 1 | P A S M A N T E T A L . | 8 1
Figure 1. Schematic representation of the 17q11.2 region. The 1.4-Mb deletion encom-passes the entire 350-kb NF1 gene, 16 flanking protein-coding genes, 4 pseudogenes, and2 microRNAs.

quently normalized such that the mean ofthe dermal neurofibromas (used as cali-brators) Ntarget values was 1. All PCRswere performed with an ABI Prism 7900Sequence Detection System (AppliedBiosystems) and the SYBR Green PCRCore Reagents Kit (Applied Biosystems).Experiments were performed with dupli-cates for each data point. All patient sam-ples with a coefficient of variation of Ctvalues >1% were retested. The nucleotide
sequences of the oligonucleotide primersused to amplify TBP, RPLP0, MKI67 andthe 17 target genes are shown in Table 2.To avoid amplification of contaminatinggenomic DNA, 1 of the 2 primers wasplaced at the junction between two exons.For each primer pair, we performed no-template control and no-reverse-tran-scriptase control assays, which producednegligible signals (usually Ct >40), sug-gesting that primer-dimer formation and
genomic DNA contamination effects werenegligible. The conditions of RNA extrac-tion, cDNA synthesis and PCRs are de-scribed elsewhere (24).
Real-Time RT-PCR for Mature miRNAsMicroRNAs were isolated as described
above for the protein-coding genes, andthe expression of specific mature miR-NAs (hsa-mir-365-2 and has-mir-193a)was quantified with real-time PCR andHuman TaqMan® MicroRNA assay kitsaccording to the manufacturer’s protocol(Applied Biosystems). U44 small nucleo-lar RNA was used as an internal controlto normalize RNA input in the real-timeRT-PCR assay. Expression of this en-dogenous control was measured withthe TaqMan Endogenous ControlRNU44 kit.
Statistical AnalysisBecause the mRNA (and microRNA)
levels did not fit a Gaussian distribution,the mRNA (microRNA) levels in eachsubgroup of samples were expressed asmedians and ranges rather than asmeans and coefficients of variation andrelationships between the molecularmarkers and clinical and biological pa-rameters were tested with the nonpara-metric Mann–Whitney U test (26). Differ-ences between two populations wereconsidered significant at confidence lev-els >95% (P < 0.05).
All supplementary materials are availableonline at www.molmed.org.
RESULTS
NF1 Mutation AnalysisGermline NF1 mutations and loss of
heterozygosity assessment in plexiformneurofibromas and MPNSTs of the studyNF1 patients are summarized in Supple-mental Table 3.
RNA Expression of NF1, the Other 16Protein-Coding Genes and the 2MicroRNAs
Very low levels of LOC646021 andLOC646037 mRNA—detectable but not
8 2 | P A S M A N T E T A L . | M O L M E D 1 7 ( 1 - 2 ) 7 9 - 8 7 , J A N U A R Y - F E B R U A R Y 2 0 1 1
C A N C E R G E N E S I N N F 1 - M I C R O D E L E T E D P A T I E N T S
Table 2. Oligonucleotide primer sequences.
PCR product
Genes Oligonucleotide Sequence size (bp)
LRRC37B2 Upper primer 5′-GCA GAA GTC AAG TGA GCT CAT GAA-3′ 84Lower primer 5′-ATG ACA GTC ACA GAT ATT GCG AAG AT-3′
CRLF3 Upper primer 5′-GAA TCA TCG GGT GTT CTC TAC TCC A-3′ 83Lower primer 5′-TGT CCC ACA GTT TCA ACT CTG AAT-3′
ATAD5 Upper primer 5′-GTT TGA TGG CTG CTT TGA AGA AA-3′ 60Lower primer 5′-CTG GCA ACA TTT AGC AGG GAA G-3′
C17orf42 Upper primer 5′-CTG AGA AAG CTC CTC AAA CCA GAC-3′ 95Lower primer 5′-CAG GCA ATT CTT CGA GTA CCA AA-3′
CENTA2 Upper primer 5′-CCC TCA ACC GGC TTA CTG CAT C-3′ 86Lower primer 5′-AGG TGT TCA GTG GCA GCC AGT TC-3′
RNF135 Upper primer 5′-TGC CTG ACC AGA GCC ACC C-3′ 63Lower primer 5′-GAT GGA TGG CCC ACT GAG CA-3′
LOC646021 Upper primer 5′-CAG AGG CCG GGA CAG TTT CT- 3′ 98Lower primer 5′-TGT GAT CTC AGG TTT TGG ATA GGT T-3′
LOC646037 Upper primer 5′-TGA TGT TGG GCA CCT CAA CTC C-3′ 65Lower primer 5′-GGC TTT GGC AGG GGG TGA-3′
NF1 Upper primer 5′-ACA GAG CGT GGC CTA CTT AGC A-3′ 166Lower primer 5′-GGA CCA TGG CTG AGT CTC CTT T-3′
OMG Upper primer 5′-TCC AGA CCA ATC TTT TGA CCA ACT-3′ 123Lower primer 5′-GCT TTT GTT TCC ATC ATC CAC TTC-3′
EVI2B Upper primer 5′-CAG GAC GAC TAC GCT CGG CA-3′ 90Lower primer 5′-CAC CAC AGC GTC AGG GGC T-3′
EVI2A Upper primer 5′-TGT CTC CTG GAA CAA AAG CAA ACT-3′ 93Lower primer 5′-GGT TTC TGC CTG TCT TGT TTT GAA-3′
RAB11FIP4 Upper primer 5′-AGC CTC AGC CTC TAC GAA GCA A-3′ 111Lower primer 5′-CTT CAG GGC TTC CAT TAG CTC ATC-3′
C17orf79 Upper primer 5′-TCA AGG GAA TCC ATA TGA TGC TGA-3′ 72Lower primer 5′-CAG CAC ACC CAA GGT TTA AGC TCT-3′
UTP6 Upper primer 5′-GGC TCC CGG AAT TGG AAC AG-3′ 82Lower primer 5′-TCG GAA GCC TTC TTA ATG ATA GCC T-3′
SUZ12 Upper primer 5′-TCG CAA CGG ACC AGT TAA GAG AA-3′ 64Lower primer 5′-TGT TCG TTT TGG CCT GCA CA-3′
LRRC37B Upper primer 5′-CCG GCA TTA AAA TAT CTA GAC ATG-3′ 87Lower primer 5′-TTC CAG TTC AAC AGT CAT CGT GAG-3′
MKI67 Upper primer 5′-ATT GAA CCT GCG GAA GAG CTG A-3′ 105Lower primer 5′-GGA GCG CAG GGA TAT TCC CTT A-3′
TBP Upper primer 5′-TGC ACA GGA GCC AAG AGT GAA-3′ 132Lower primer 5′-CAC ATC ACA GCT CCC CAC CA-3′
RPLP0 Upper primer 5′-GGC GAC CTG GAA GTC CAA CT-3′ 149Lower primer 5′-CCA TCA GCA CCA CAG CCT TC-3′

reliably quantifiable by real-time quanti-tative RT-PCR (mainly based on fluores-cence SYBR Green methodology; Ct>32)—were observed in dermal andplexiform neurofibromas and MPNSTs.
Table 3 shows the median mRNA lev-els (and ranges) of the remaining 15 protein-coding genes and the two mi-croRNAs in the three groups of tumorsamples. For each gene, mRNA levelswere normalized such that the medianvalue of the 23 dermal neurofibromaswas 1. Table 3 also shows the mRNA lev-els of the MKI67 gene encoding Ki-67, alarge protein of unknown function classi-cally used as a histopathological markerof cell proliferation.
OMG and SUZ12 were significantlyupregulated in the plexiform neurofibro-mas compared with the dermal neurofi-bromas, whereas ATAD5, EVI2A andC17orf79 were specifically upregulated inthe MPNSTs.
The CENTA2, RNF135 and EVI2Bgenes were significantly downregulatedin MPNSTs but not in plexiform neurofi-
bromas. The other genes, including NF1and the two microRNAs (hsa-mir-365-2and has-mir-193a), were not significantlyaltered in plexiform neurofibromas orMPNSTs. Figure 2 shows the mRNA lev-els of the three downregulated genes(CENTA2, RNF135 and EVI2B) in eachneurofibroma and MPNST sample. Theonly grade I MPNST (MP6; see Supple-mental Table 1) did not show a decreasedexpression of CENTA2, RNF135 andEVI2B (Figure 2). It is noteworthy that 3of the 13 patients with MPNSTs (MP1,MP3 and MP9; see Supplemental Table 3)had a known germline microdeletion ofNF1. Interestingly, the mRNA levels ofCENTA2, RNF135 and EVI2B were low inthese three MPNSTs: the RCENTA2, RRNF135
and REVI2B values (calculated as describedin Materials and Methods) were respec-tively 0.15, 0.49 and 0.41 in MP1; 0.28,0.49 and 0.30 in MP3; and 0.23, 0.42 and0.37 in MP9 (Figure 2).
Table 3 shows the mRNA abundanceof the 15 protein-coding genes (calcu-lated as described in “Materials and
Methods”) relative to the endogenouscontrol (TBP) used to normalize the start-ing amount and quality of total RNA.Similar results were obtained with a sec-ond endogenous control, RPLP0 (datanot shown).
mRNA Expression of CENTA2, RNF135and EVI2B in Normal Human Cells
Neurofibromas and MPNSTs are het-erogeneous tumors mainly composed ofSchwann cells (60–80%), together with fi-broblasts, mast cells and other cells. Wehave previously observed a depletion ofmast cells and fibroblasts during malig-nant transformation of plexiform neu-rofibromas into MPNSTs (27,28).
If CENTA2, RNF135 and EVI2B weremast cell or fibroblast specific, then alower abundance of mast cells or fibrob-lasts in MPNSTs relative to neurofibro-mas could explain the observed underex-pression of these three genes in MPNSTs.To investigate the cellular specificity ofCENTA2, RNF135 and EVI2B expression,we analyzed the mRNA levels of these
R E S E A R C H A R T I C L E
M O L M E D 1 7 ( 1 - 2 ) 7 9 - 8 7 , J A N U A R Y - F E B R U A R Y 2 0 1 1 | P A S M A N T E T A L . | 8 3
Table 3. Median mRNA levels (and ranges) of 15 genes and 2 microRNAs in the 1.4-Mb deletion in dermal and plexiform neurofibromasand MPNSTs.
Dermal Plexiform Alternative neurofibromas neurofibromas
Genes symbols (n = 23) (n = 13) MPNSTs (n = 13) Pa Pb
LRRC37B2 DKFZp667M2411 1.00 (0.54–1.90) 1.16 (0.49–2.71) 1.22 (0.47–1.89) NS NSc
CRLF3 CYTOR4 1.00 (0.42–1.88) 1.25 (0.66–1.97) 0.76 (0.17–2.32) NS NSATAD5 FLJ12735 1.00 (0.38–2.52) 1.19 (0.65–1.62) 3.02 (0.44–9.55) NS 1.4 × 10⁻⁴
C17orf42 FLJ22729 1.00 (0.62–1.79) 1.24 (0.53–3.63) 1.14 (0.27–2.71) NS NSCENTA2 HSA272195 1.00 (0.62–2.27) 0.95 (0.53–4.59) 0.38 (0.15–1.89) NS 0.014RNF135 MGC13061 1.00 (0.41–1.68) 0.92 (0.57–1.37) 0.49 (0.13–1.74) NS 0.026NF1 — 1.00 (0.81–1.27) 1.01 (0.49–1.84) 0.93 (0.38–2.25) NS NSOMG OMGP 1.00 (0.52–1.57) 1.65 (0.51–3.09) 0.92 (0.32–2.16) 0.013 NSEVI2B — 1.00 (0.54–1.75) 0.74 (0.59–1.82) 0.30 (0.14–1.47) NS 6 × 10⁻⁴
EVI2A — 1.00 (0.46–1.94) 1.10 (0.46–3.16) 2.03 (0.44–6.93) NS 0.047RAB11FIP4 Rab11-FIP4 1.00 (0.37–4.12) 1.23 (0.47–3.23) 0.99 (0.23–5.07) NS NSMIRN193A hsa-mir-193a 1.00 (0.64–1.48) 0.65 (0.38–1.35) 0.77 (0.40–2.83) NS NSMIRN365-2 hsa-mir-365-2 1.00 (0.55–1.95) 1.49 (0.77–2.35) 0.84 (0.44–1.89) NS NSC17orf79 HSA272196 1.00 (0.35–1.89) 0.95 (0.18–1.69) 2.58 (0.86–4.53) NS 0.006UTP6 HCA66, C17orf40 1.00 (0.38–1.51) 1.09 (0.57–1.71) 0.83 (0.32–2.51) NS NSSUZ12 JJAZ1, KIAA0160 1.00 (0.47–1.81) 1.90 (1.02–3.83) 0.96 (0.31–3.31) 2 × 10⁻⁴ NSLRRC37B LOC114659 1.00 (0.10–2.07) 0.83 (0.16–1.62) 0.94 (0.54–1.96) NS NSMKI67 1.00 (0.30–2.82) 1.54 (0.88–4.77) 30.7 (13.6–82.9) 0.012 8 × 10⁻⁶
Data are median (range) mRNA levels, unless otherwise indicated. Bold data indicate significantly different expression.aMann–Whitney U test: plexiform neurofibromas versus dermal neurofibromas.bMann–Whitney U test: MPNSTs versus dermal neurofibromas.cNS, not significant.
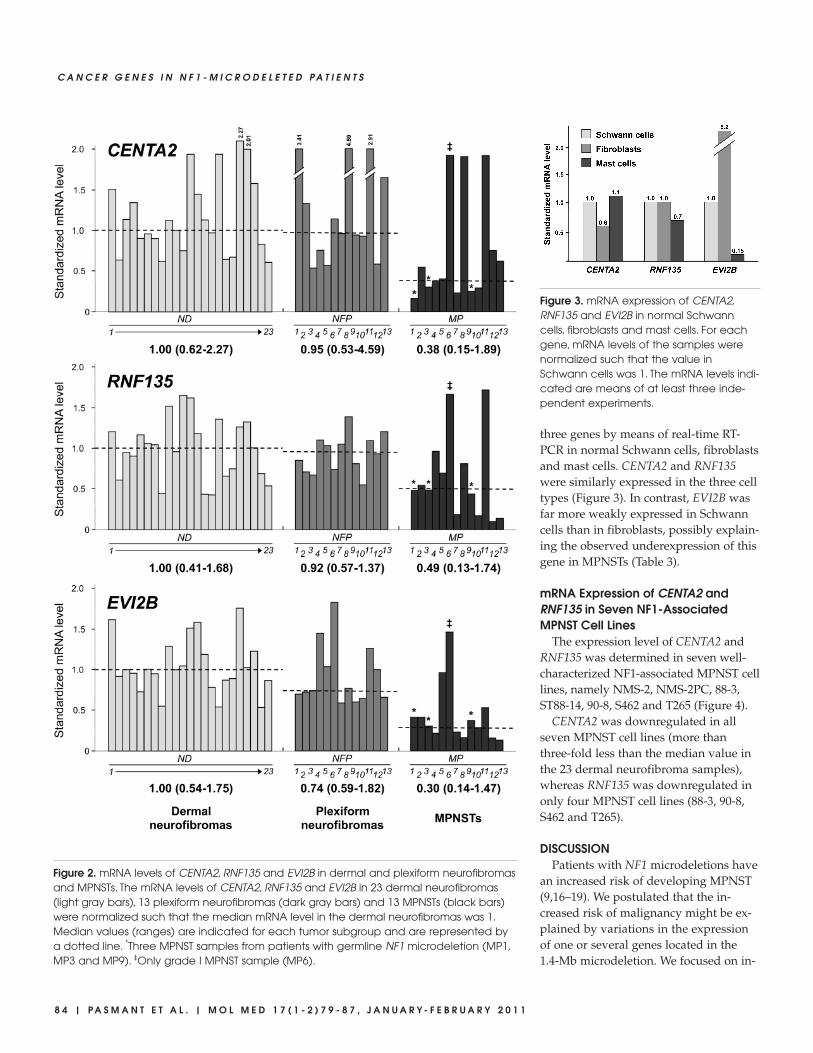
three genes by means of real-time RT-PCR in normal Schwann cells, fibroblastsand mast cells. CENTA2 and RNF135were similarly expressed in the three celltypes (Figure 3). In contrast, EVI2B wasfar more weakly expressed in Schwanncells than in fibroblasts, possibly explain-ing the observed underexpression of thisgene in MPNSTs (Table 3).
mRNA Expression of CENTA2 andRNF135 in Seven NF1-AssociatedMPNST Cell Lines
The expression level of CENTA2 andRNF135 was determined in seven well-characterized NF1-associated MPNST celllines, namely NMS-2, NMS-2PC, 88-3,ST88-14, 90-8, S462 and T265 (Figure 4).
CENTA2 was downregulated in allseven MPNST cell lines (more thanthree-fold less than the median value inthe 23 dermal neurofibroma samples),whereas RNF135 was downregulated inonly four MPNST cell lines (88-3, 90-8,S462 and T265).
DISCUSSIONPatients with NF1 microdeletions have
an increased risk of developing MPNST(9,16–19). We postulated that the in-creased risk of malignancy might be ex-plained by variations in the expressionof one or several genes located in the1.4-Mb microdeletion. We focused on in-
8 4 | P A S M A N T E T A L . | M O L M E D 1 7 ( 1 - 2 ) 7 9 - 8 7 , J A N U A R Y - F E B R U A R Y 2 0 1 1
C A N C E R G E N E S I N N F 1 - M I C R O D E L E T E D P A T I E N T S
Figure 2. mRNA levels of CENTA2, RNF135 and EVI2B in dermal and plexiform neurofibromasand MPNSTs. The mRNA levels of CENTA2, RNF135 and EVI2B in 23 dermal neurofibromas(light gray bars), 13 plexiform neurofibromas (dark gray bars) and 13 MPNSTs (black bars)were normalized such that the median mRNA level in the dermal neurofibromas was 1.Median values (ranges) are indicated for each tumor subgroup and are represented bya dotted line. *Three MPNST samples from patients with germline NF1 microdeletion (MP1,MP3 and MP9). ‡Only grade I MPNST sample (MP6).
Figure 3. mRNA expression of CENTA2,RNF135 and EVI2B in normal Schwanncells, fibroblasts and mast cells. For eachgene, mRNA levels of the samples werenormalized such that the value inSchwann cells was 1. The mRNA levels indi-cated are means of at least three inde-pendent experiments.

activation of putative tumor suppressorrather than on oncogene activation. Wetherefore examined the expression ofNF1, the other 16 protein-coding genesand the 2 microRNA genes locatedwithin the 1.4-Mb deletion by means ofreal-time quantitative RT-PCR in a largeseries of dermal and plexiform neurofi-bromas and MPNSTs.
Several genes were significantly upreg-ulated only in the plexiform neurofibro-mas (OMG and SUZ12) or only in theMPNSTs (ATAD5, EVI2A and C17orf79).Among these five putative oncogenes,C17orf79 showed the strongest upregula-tion in the seven NF1-associated MPNSTcell lines tested; its expression was two-to nine-fold higher than in the dermalneurofibromas (data not shown). Thefunction of 3 of these 5 genes (ATAD5,EVI2A and C17orf79) is unknown. Theother 2 genes (OMG and SUZ12) aregood candidates for involvement in NF1tumorigenesis. It is noteworthy thatthese 2 genes are upregulated in plexi-form neurofibromas but not in MPNSTs,suggesting that they are more specifically
involved in the development of plexi-form neurofibromas (Table 3). OMG,which is located in an antisense orienta-tion within intron 27b of the NF1 gene,encodes the oligodendrocyte–myelin gly-coprotein, 1 of 3 known Nogo receptorligands (29). However, our observationof OMG mRNA upregulation in plexi-form neurofibromas is consistent with apositive effect of OMG on cell prolifera-tion. However, this is difficult to recon-cile with evidence suggesting that OMGis a tumor-suppressor gene and that itsoverexpression blocks mitogenic signal-ing in NIH3T3 fibroblasts (30).
SUZ12, the second gene found to beupregulated in plexiform neurofibromas,has a known function and is a good can-didate oncogene. Indeed, SUZ12 en-codes a major polycomb regulator that ispreferentially activated during embry-onic stem cell differentiation (31,32).SUZ12 is overexpressed in a broad spec-trum of human tumors (33). SUZ12 up-regulation is accompanied by the re-cruitment of DNA methyltransferasesand by DNA hypermethylation, result-ing in the silencing of important tumorsuppressor genes (34). Interestingly, re-current chromosomal translocation—t(7;17)(p15;q21)—involving SUZ12 (lo-cated at 17q21) has been detected inapproximately one-half of endometrialstromal sarcomas, malignancies that de-rive from mesenchymal tissue (35). Theauthors of this latter study suggested agenetic pathway for progression of a be-nign precursor to a sarcoma, involvingincreased cell survival associated withacquisition of a SUZ12 rearrangement.
Our present findings (that is, geneoverexpression in plexiform neurofibro-mas and MPNSTs) are consistent with amodel in which the overexpressed genespromote proliferation and thus act asoncogenes. The upregulation of these fiveputative oncogenes during NF1 tumori-genesis is probably due to a molecularmechanism independent of the NF1 mi-crodeletion. However, we cannot rule outthe possibility that the 1.4-Mb region con-tains an unknown negative regulator ofgene transcription (such as an unidenti-
fied noncoding RNA gene), which wouldbe inactivated by deletion and upregulateneighboring oncogenes. It is noteworthythat the two microRNAs (hsa-mir-365-2and has-mir-193a) located in the NF1 mi-crodeleted region and analyzed in thisstudy were normally expressed in theplexiform neurofibromas and MPNSTs.
More interestingly, three genes(RNF135, CENTA2 and EVI2B) were sig-nificantly downregulated in MPNSTs, afinding compatible with a role as tumorsuppressor genes. EVI2B was expressedmore strongly by fibroblasts than bySchwann cells and mast cells, suggestingthat the observed underexpression of thisgene was due to a lower abundance of aparticular cell type (likely fibroblasts inthe present case) in MPNSTs, as previ-ously described (28).
Concerning the other two downregu-lated genes, we observed that CENTA2was more strongly underexpressed thanRNF135 in MPNSTs (Figure 2) and inMPNST cell lines (Figure 4). It is note-worthy that CENTA2 underexpressionwas recently described in two MPNSTsas compared with four plexiform neu-rofibromes (36).
The RNF135 gene encodes a putative432–amino acid protein of unknownfunction. This protein contains a RINGfinger domain, a motif present in a vari-ety of functionally distinct proteins andknown to be involved in protein-proteinand protein-DNA interactions. Interest-ingly, Douglas et al. (15) recently identi-fied RNF135 mutations in families char-acterized by overgrowth, learningdisability and dysmorphic features anddemonstrated that RNF135 haploinsuffi-ciency contributes to several features ofthe phenotype of NF1-microdeleted pa-tients. The possible role of RNF135 in theincreased risk of MPNST is unknown,but it is conceivable that the growth-pro-moting effects of RNF135 haploinsuffi-ciency are involved.
CENTA2 encodes the recently de-scribed protein centaurin-α2 and formswith p42IP4/centaurin-α1, a proteinfamily with strong homology and thesame overall protein structure (37). Cen-
R E S E A R C H A R T I C L E
M O L M E D 1 7 ( 1 - 2 ) 7 9 - 8 7 , J A N U A R Y - F E B R U A R Y 2 0 1 1 | P A S M A N T E T A L . | 8 5
Figure 4. mRNA levels of CENTA2 andRNF135 in seven NF1-associated MPNSTcell lines. For each gene, mRNA levelswere normalized such that the medianvalue in 23 dermal neurofibromas was 1.

taurins are a family of GTPase-activatingproteins for the ADP-ribosylation factor(ARF) family of small G proteins (38).P42IP4/centaurin-α1 can regulate extra-cellular signal-regulated kinase (ERK)-1/2, and this regulation requires phos-phatidylinositol 3-kinase–dependentrecruitment of p42IP4/centaurin-α1 tothe plasma membrane (39). Recently,Venkateswarlu et al. (40) demonstratedthat centaurin-α2 is a target for activatedphosphatidylinositol 3-kinase, which isrecruited, in a sustained manner, to theplasma membrane and thereby nega-tively regulates ARF6-mediated actin cy-toskeleton reorganization. The centaurinα family thus could be involved, likeneurofibromin, in the Ras signalingpathway. Finally, CENTA2 haploinsuffi-ciency could be involved in the cardio-vascular malformations observed inNF1-microdeleted patients (13).
In conclusion, this expression profilingstudy of 18 poorly studied genes (16protein-coding genes and 2 microRNAgenes) located in the NF1 microdeletionregion in a large series of dermal andplexiform neurofibromas and MPNSTspoints to the involvement of severalgenes, particularly CENTA2 andRNF135, in the increased risk of malig-nancy observed in NF1-microdeleted pa-tients. The role of these genes in NF1 tu-morigenesis now needs to be confirmedin vitro (gain- and loss-of-function exper-iments in cultured cells) and in animalmodels.
ACKNOWLEDGMENTSThis work was supported by Associa-
tion pour la Recherche sur le Cancer,Association Neurofibromatoses et Recklinghausen, Ligue Française Contreles Neurofibromatoses, the Clinical Re-search program (PHRC 2002), INSERMProjet NF1GeneModif and Ministère de L’Enseignement Supérieur et de laRecherche.
DISCLOSURE The authors declare that they have no
competing interests as defined by Molecu-lar Medicine, or other interests that might
be perceived to influence the results anddiscussion reported in this paper.
REFERENCES1. Friedman JM. (1999) Epidemiology of neurofi-
bromatosis type 1. Am. J. Med. Genet. 89:1–6.2. Cawthon RM, et al. (1990) A major segment of
the neurofibromatosis type 1 gene: cDNA se-quence, genomic structure, and point mutations.Cell 62:193–201.
3. Wallace MR, et al. (1990) Type 1 neurofibromato-sis gene: identification of a large transcript dis-rupted in three NF1 patients. Science 249:181–6.
4. Ferner RE, Gutmann DH. (2002) Internationalconsensus statement on malignant peripheralnerve sheath tumors in neurofibromatosis. CancerRes. 62:1573–7.
5. Evans DG, et al. (2002) Malignant peripheral nervesheath tumours in neurofibromatosis 1. J. Med.Genet. 39:311–4.
6. Kluwe L, et al. (2004) Screening 500 unselectedneurofibromatosis 1 patients for deletions of theNF1 gene. Hum. Mutat. 23:111–6.
7. Mantripragada KK, et al. (2006) Identification ofnovel deletion breakpoints bordered by segmen-tal duplications in the NF1 locus using high reso-lution array-CGH. J. Med. Genet. 43:28–38.
8. Wimmer K, et al. (2006) Spectrum of single- andmultiexon NF1 copy number changes in a cohortof 1,100 unselected NF1 patients. Genes Chromo-somes Cancer 45:265–76.
9. Dorschner MO, Sybert VP, Weaver M, PletcherBA, Stephens K. (2000) NF1 microdeletion break-points are clustered at flanking repetitive se-quences. Hum. Mol. Genet. 9:35–46.
10. Jenne DE, et al. (2003) Complete physical mapand gene content of the human NF1 tumor sup-pressor region in human and mouse. Genes Chro-mosomes Cancer 37:111–20.
11. Kozaki K, Imoto I, Mogi S, Omura K, Inazawa J.(2008) Exploration of tumor-suppressive mi-croRNAs silenced by DNA hypermethylation inoral cancer. Cancer Res. 68:2094–105.
12. Upadhyaya M, et al. (1998) Gross deletions of theneurofibromatosis type 1 (NF1) gene are pre-dominantly of maternal origin and commonly as-sociated with a learning disability, dysmorphicfeatures and developmental delay. Hum. Genet.102:591–7.
13. Venturin M, et al. (2004) Mental retardation andcardiovascular malformations in NF1-mi-crodeleted patients point to candidate genes in17q11.2. J. Med. Genet. 41:35–41.
14. Wu BL, Austin MA, Schneider GH, Boles RG,Korf BR. (1995) Deletion of the entire NF1 genedetected by the FISH: four deletion patients asso-ciated with severe manifestations. Am. J. Med.Genet. 59:528–35.
15. Douglas J, et al. (2007) Mutations in RNF135, agene within the NF1 microdeletion region, causephenotypic abnormalities including overgrowth.Nat. Genet. 39:963–5.
16. De Raedt, et al. (2003) Elevated risk for MPNSTin NF1 microdeletion patients. Am. J. Hum. Genet.72:1288–92.
17. Kluwe L, Friedrich RE, Peiper M, Friedman J,Mautner VF. (2003) Constitutional NF1 muta-tions in neurofibromatosis 1 patients with malig-nant peripheral nerve sheath tumors. Hum.Mutat. 22:420.
18. Wu R, et al. (1999) Germline mutations in NF1patients with malignancies. Genes ChromosomesCancer 26:376–80.
19. Pasmant E, et al. (2010) NF1 microdeletions inneurofibromatosis type 1: from genotype to phe-notype. Hum. Mutat. 31:E1506–18.
20. Piddubnyak V, et al. (2007) Positive regulation ofapoptosis by HCA66, a new Apaf-1 interactingprotein, and its putative role in the physiopathol-ogy of NF1 microdeletion syndrome patients.Cell Death Differ. 14:1222–33.
21. Avellana-Adalid V, et al. (1998) In vitro and invivo behaviour of NDF-expanded monkeySchwann cells. Eur. J. Neurosci. 10:291–300.
22. Glasow A, et al. (2001) Expression of leptin (Ob)and leptin receptor (Ob-R) in human fibroblasts:regulation of leptin secretion by insulin. J. Clin.Endocrinol. Metab. 86:4472–9.
23. Royer B, et al. (2001) Autocrine regulation ofcord blood-derived human mast cell activationby IL-10. J. Allergy Clin. Immunol. 108:80–6.
24. Bieche I, et al. (2001) Identification of CGA as anovel estrogen receptor-responsive gene in breastcancer: an outstanding candidate marker to pre-dict the response to endocrine therapy. CancerRes. 61:1652–8.
25. Bieche I, et al. (1999) Real-time reverse transcrip-tion-PCR assay for future management ofERBB2-based clinical applications. Clin. Chem.45:1148–56.
26. Mann H, Whitney D. (1947) On a test of whetherone of two random variables is stochasticallylarger than the other. Annals of Mathematical Sta-tistics 18:50–60.
27. Levy P, et al. (2004) Molecular profiles of neurofi-bromatosis type 1-associated plexiform neurofibro-mas: identification of a gene expression signatureof poor prognosis. Clin. Cancer Res. 10:3763–71.
28. Levy P, et al. (2004) Molecular profiling of malig-nant peripheral nerve sheath tumors associatedwith neurofibromatosis type 1, based on large-scale real-time RT-PCR. Mol. Cancer 3:20.
29. Wang KC, et al. (2002) Oligodendrocyte-myelinglycoprotein is a Nogo receptor ligand that in-hibits neurite outgrowth. Nature 417:941–4.
30. Habib AA, Gulcher JR, Högnason T, Zheng L,Stefánsson K. (1998) The OMG gene, a secondgrowth suppressor within the NF1 gene. Onco-gene 16:1525–31.
31. Lee TI, et al. (2006) Control of developmental reg-ulators by Polycomb in human embryonic stemcells. Cell 125:301–13.
32. Sparmann A, van Lohuizen M. (2006) Polycombsilencers control cell fate, development and can-cer. Nat Rev Cancer 6:846–56.
8 6 | P A S M A N T E T A L . | M O L M E D 1 7 ( 1 - 2 ) 7 9 - 8 7 , J A N U A R Y - F E B R U A R Y 2 0 1 1
C A N C E R G E N E S I N N F 1 - M I C R O D E L E T E D P A T I E N T S

33. Kirmizis A, Bartley SM, Farnham PJ. (2003) Iden-tification of the polycomb group protein SUZ12as a potential molecular target for human cancertherapy. Mol. Cancer Ther. 2:113–21.
34. Reynolds PA, et al. (2006) Tumor suppressorP16INK4A regulates polycomb-mediated DNAhypermethylation in human mammary epithelialcells. J. Biol. Chem. 281:24790–802.
35. Li H, et al. (2007) Effects of rearrangement and al-lelic exclusion of JJAZ1/SUZ12 on cell prolifera-tion and survival. Proc. Natl. Acad. Sci. U. S. A.104:20001–6.
36. Bartelt-Kirbach B, Wuepping M, Dodrimont- Lattke M, Kaufmann D. (2009) Expression analy-sis of genes lying in the NF1 microdeletion inter-val points to four candidate modifiers forneurofibroma formation. Neurogenetics 10:79–85.
37. Hanck T, Stricker R, Sedehizade F, Reiser G.(2004) Identification of gene structure and sub-cellular localization of human centaurin alpha 2,and p42IP4, a family of two highly homologous,Ins 1,3,4,5-P4-/PtdIns 3,4,5-P3-binding, adapterproteins. J. Neurochem. 88:326–36.
38. Randazzo PA, Hirsch DS. (2004) Arf GAPs multi-functional proteins that regulate membrane traf-fic and actin remodelling. Cell. Signal. 16:401–13.
39. Hayashi H, et al. (2006) Centaurin-alpha1 is aphosphatidylinositol 3-kinase-dependent activa-tor of ERK1/2 mitogen-activated protein kinases.J. Biol. Chem. 281:1332–7.
40. Venkateswarlu K, Brandom KG, Yun H. (2007)PI-3-kinase-dependent membrane recruitment ofcentaurin-alpha2 is essential for its effect onARF6-mediated actin cytoskeleton reorganisa-tion. J. Cell. Sci. 120:792–801.
R E S E A R C H A R T I C L E
M O L M E D 1 7 ( 1 - 2 ) 7 9 - 8 7 , J A N U A R Y - F E B R U A R Y 2 0 1 1 | P A S M A N T E T A L . | 8 7