identifying performance bottlenecks monitor: sql server objects sql server: locks •lock requests /...
TRANSCRIPT
Identifying Performance
Bottlenecks
Joe Webb
Microsoft SQL Server MVP
WebbTech Solutions, LLC
A bit of background
Joe Webb
• Started in IT in 1993 after receiving a BSEE & MBA from Auburn University
• Founded WebbTech Solutions in 1996
• Providing consulting, mentoring, & technical training
• Began working with SQL Server in 1996 with version 6.0
• 5-time recipient of the Microsoft MVP Award for SQL Server
• Author of 3 books
• Served 6 years on the Board of Directors for PASS (sqlpass.org)
• Spoken at over 20 conferences in North America & Europe
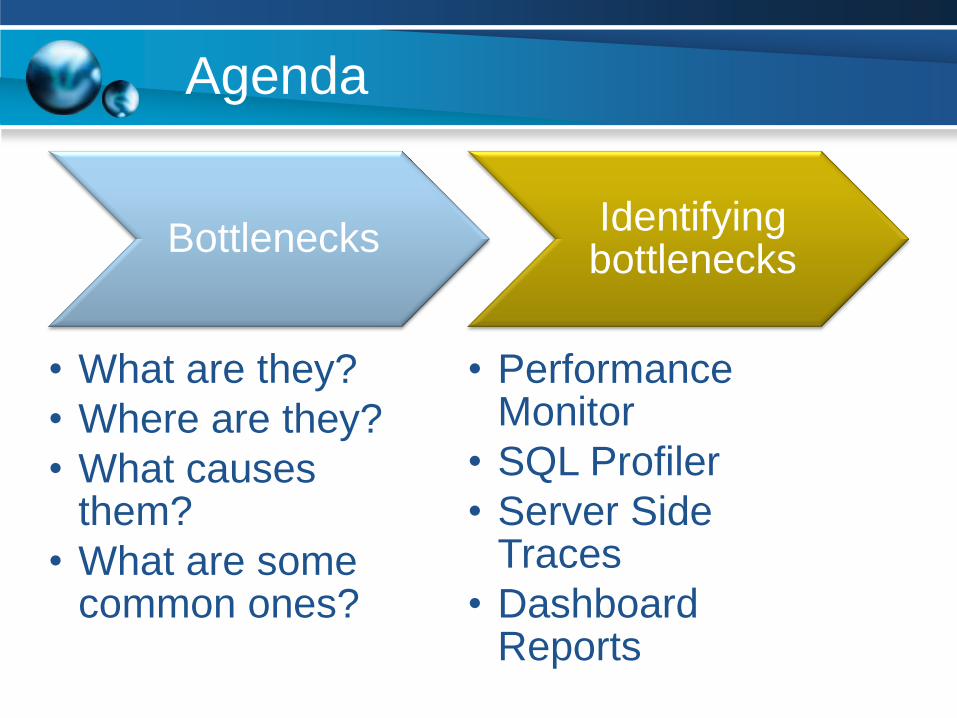
Agenda
Bottlenecks
• What are they?
• Where are they?
• What causes them?
• What are some common ones?
Identifying bottlenecks
• Performance Monitor
• SQL Profiler
• Server Side Traces
• Dashboard Reports
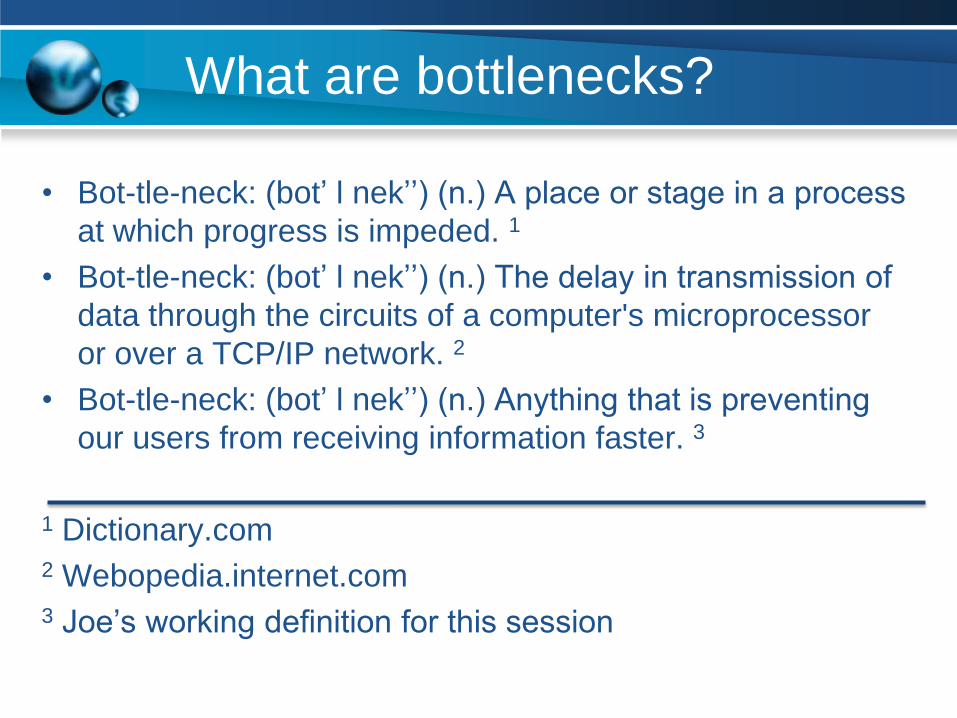
What are bottlenecks?
• Bot-tle-neck: (bot’ l nek’’) (n.) A place or stage in a process
at which progress is impeded. 1
• Bot-tle-neck: (bot’ l nek’’) (n.) The delay in transmission of
data through the circuits of a computer's microprocessor
or over a TCP/IP network. 2
• Bot-tle-neck: (bot’ l nek’’) (n.) Anything that is preventing
our users from receiving information faster. 3
1 Dictionary.com2 Webopedia.internet.com3 Joe’s working definition for this session
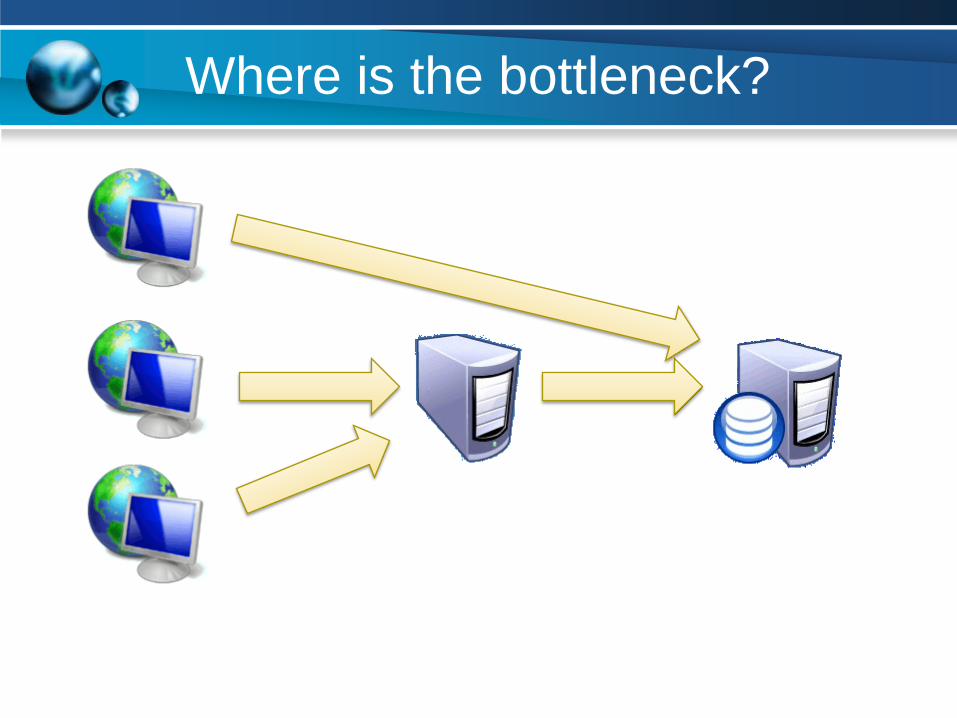
Where is the bottleneck?
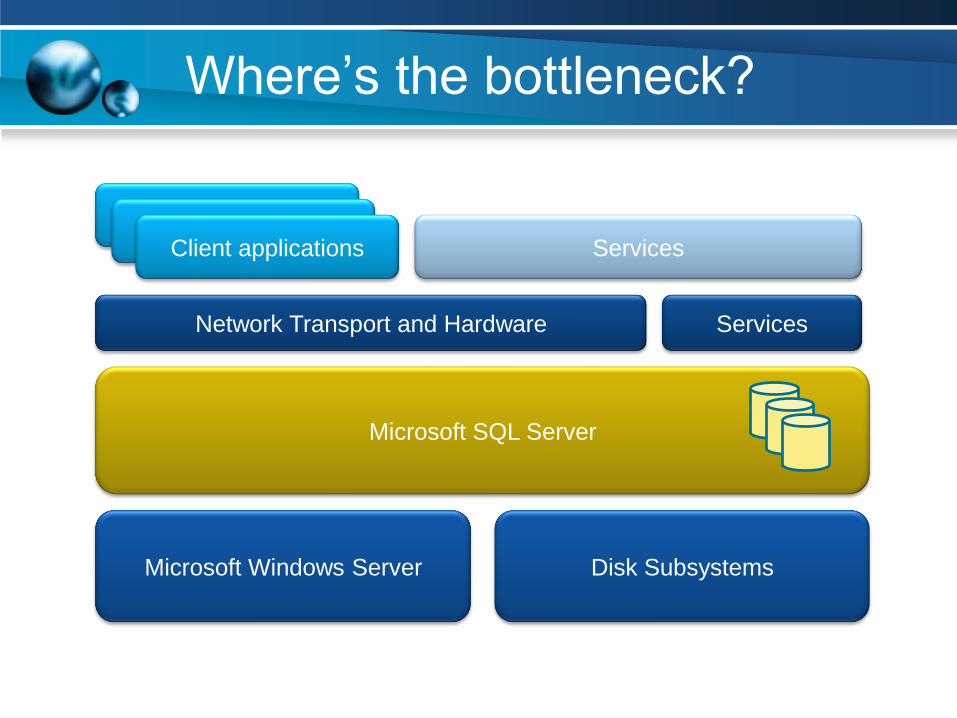
Where’s the bottleneck?
Microsoft SQL Server
Microsoft Windows Server Disk Subsystems
Network Transport and Hardware
Client applicationClient applications
Client applications
Services
Services
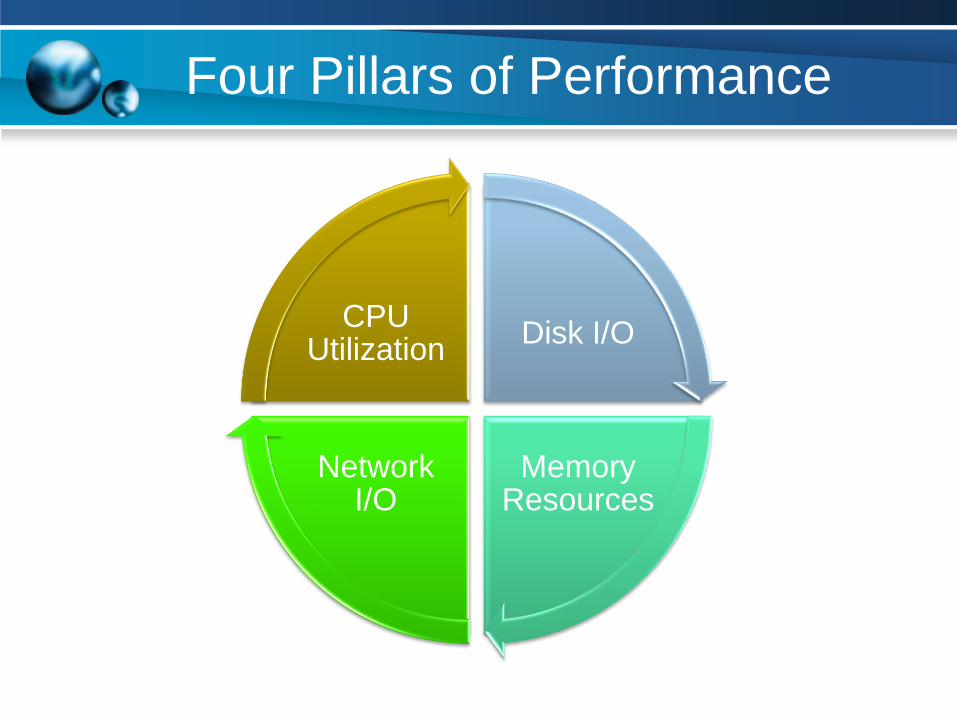
Four Pillars of Performance
Disk I/O
Memory Resources
Network I/O
CPU Utilization
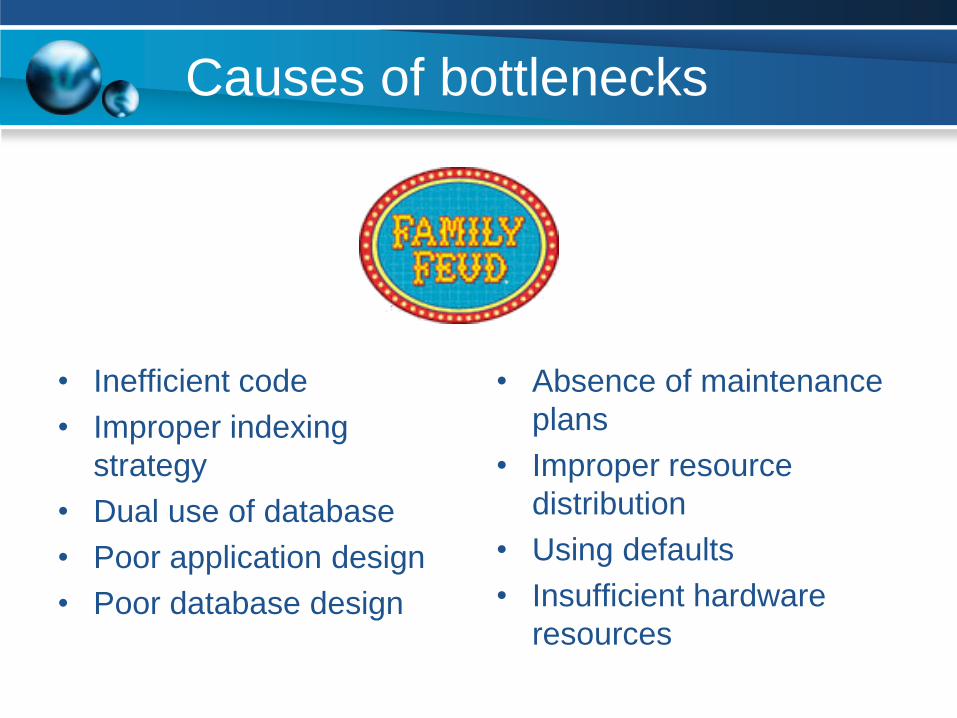
Causes of bottlenecks
• Inefficient code
• Improper indexing
strategy
• Dual use of database
• Poor application design
• Poor database design
• Absence of maintenance
plans
• Improper resource
distribution
• Using defaults
• Insufficient hardware
resources
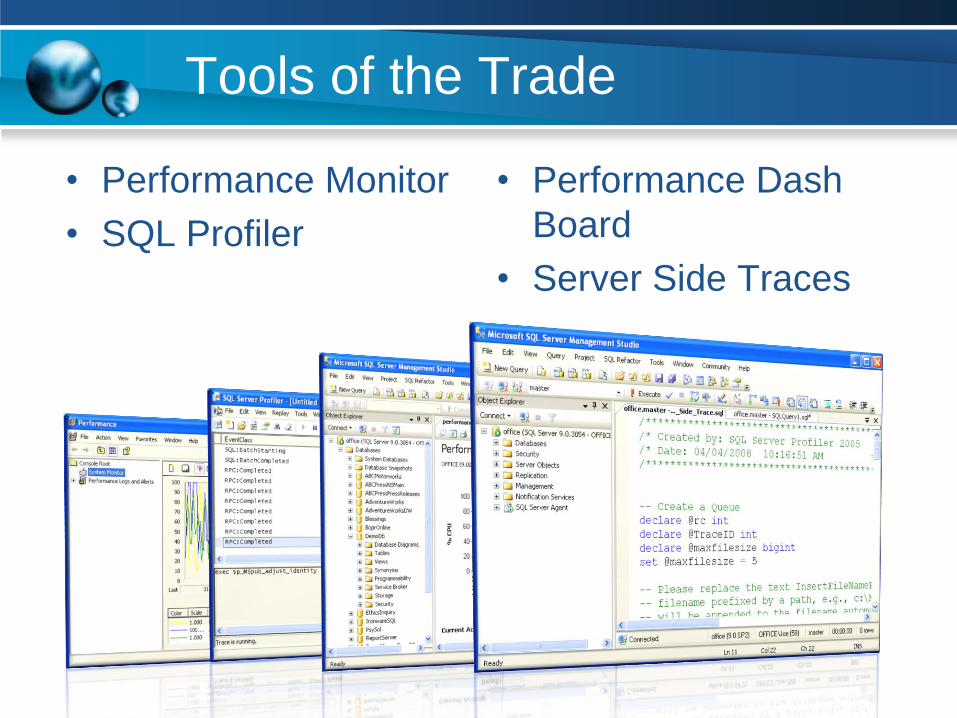
Tools of the Trade
• Performance Dash
Board
• Server Side Traces
• Performance Monitor
• SQL Profiler
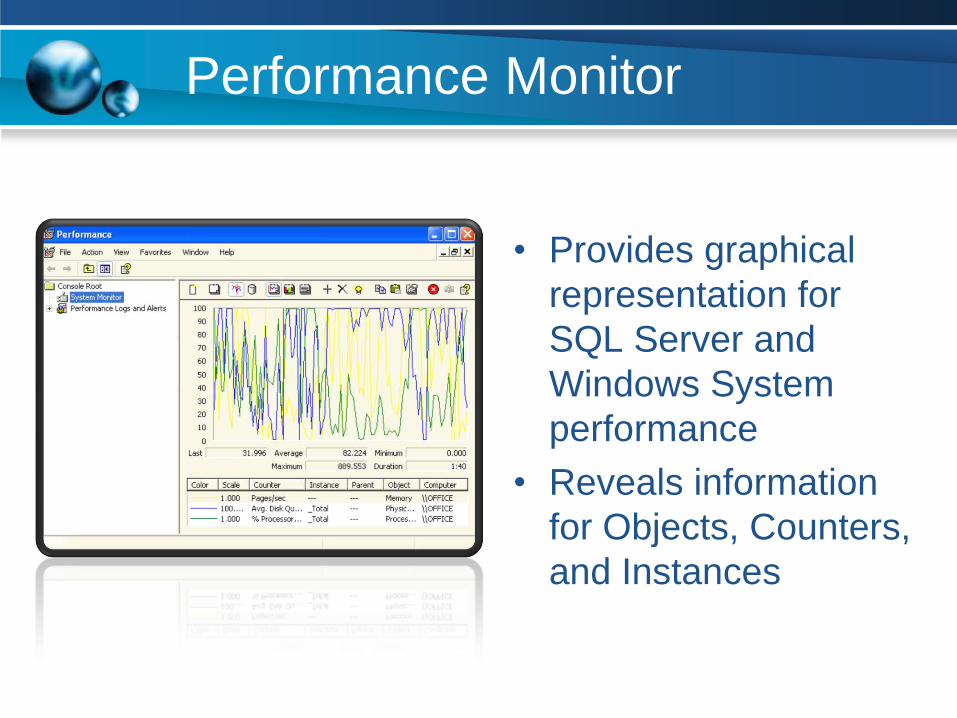
Performance Monitor
• Provides graphical
representation for
SQL Server and
Windows System
performance
• Reveals information
for Objects, Counters,
and Instances
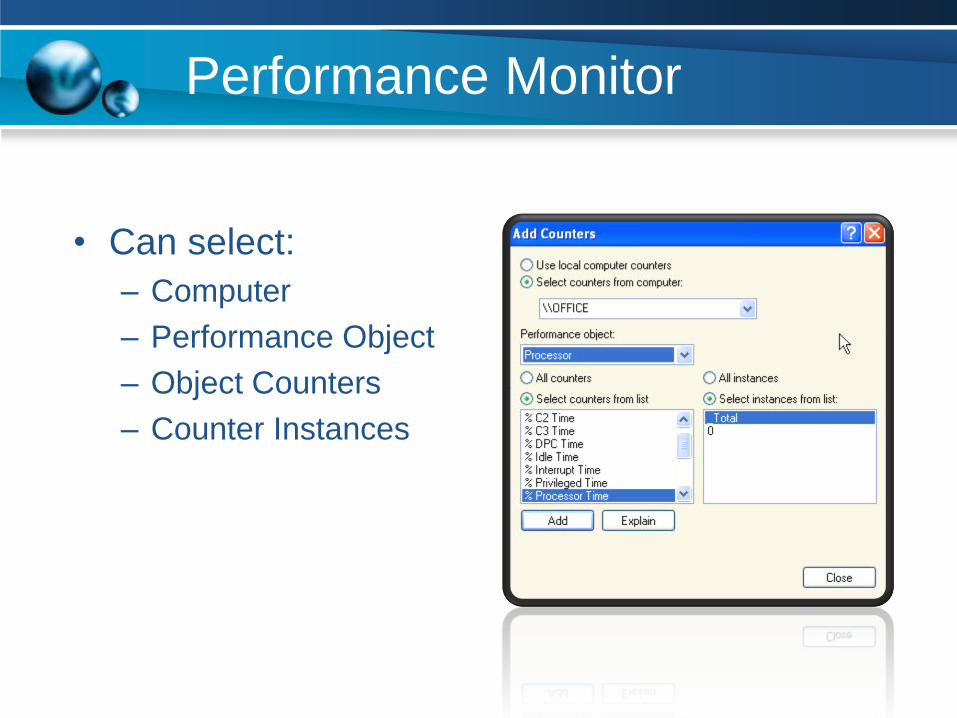
Performance Monitor
• Can select:
– Computer
– Performance Object
– Object Counters
– Counter Instances
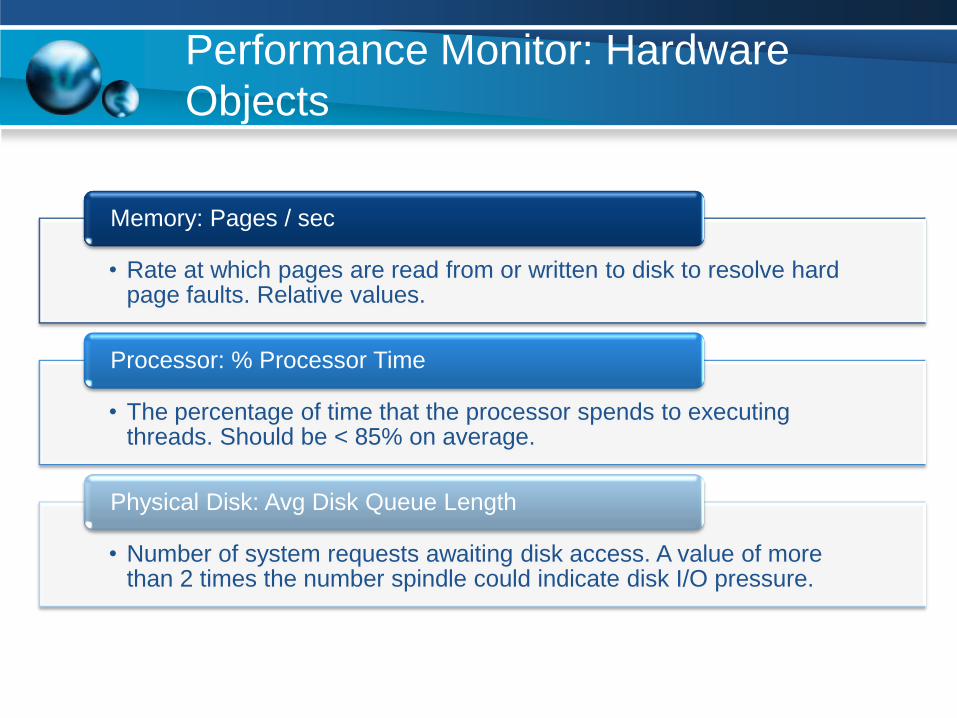
Performance Monitor: Hardware
Objects
• Rate at which pages are read from or written to disk to resolve hard page faults. Relative values.
Memory: Pages / sec
• The percentage of time that the processor spends to executing threads. Should be < 85% on average.
Processor: % Processor Time
• Number of system requests awaiting disk access. A value of more than 2 times the number spindle could indicate disk I/O pressure.
Physical Disk: Avg Disk Queue Length
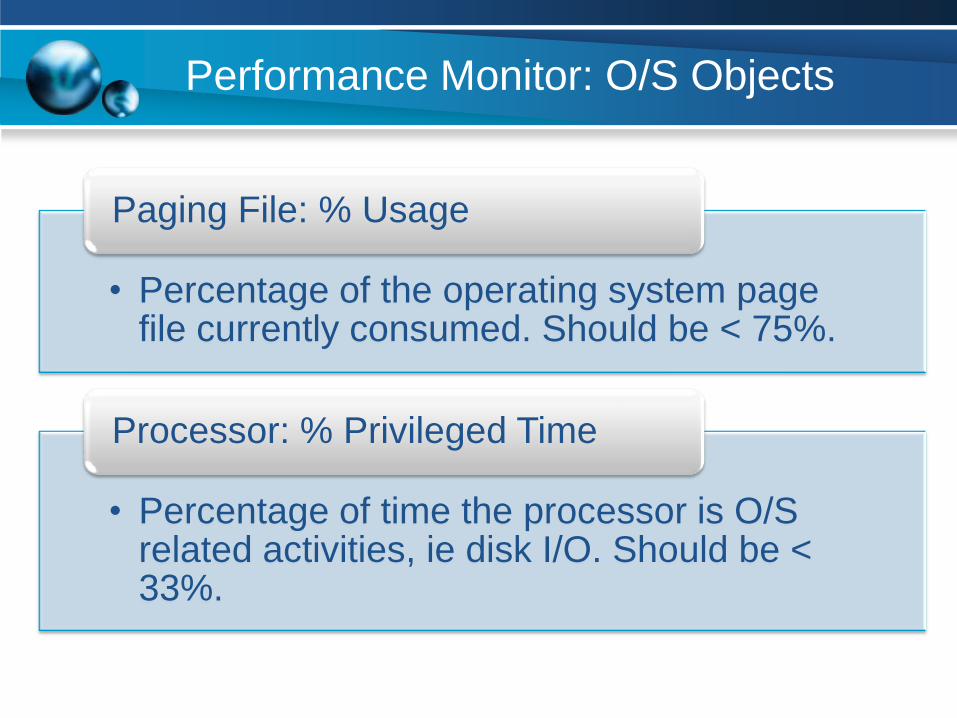
Performance Monitor: O/S Objects
• Percentage of the operating system page file currently consumed. Should be < 75%.
Paging File: % Usage
• Percentage of time the processor is O/S related activities, ie disk I/O. Should be < 33%.
Processor: % Privileged Time
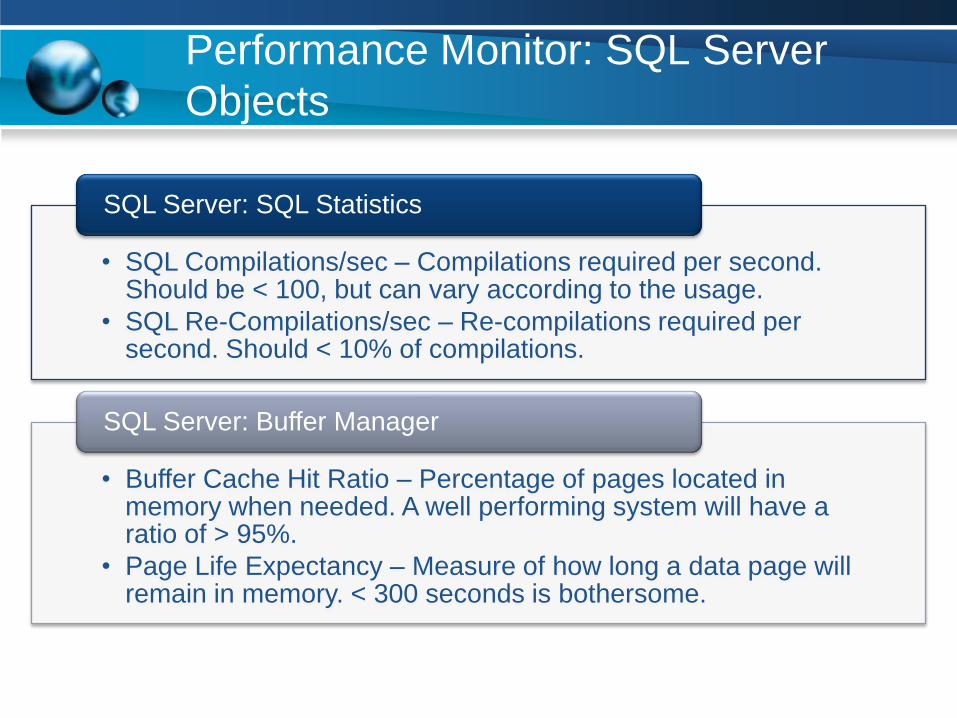
Performance Monitor: SQL Server
Objects
• SQL Compilations/sec – Compilations required per second. Should be < 100, but can vary according to the usage.
• SQL Re-Compilations/sec – Re-compilations required per second. Should < 10% of compilations.
SQL Server: SQL Statistics
• Buffer Cache Hit Ratio – Percentage of pages located in memory when needed. A well performing system will have a ratio of > 95%.
• Page Life Expectancy – Measure of how long a data page will remain in memory. < 300 seconds is bothersome.
SQL Server: Buffer Manager
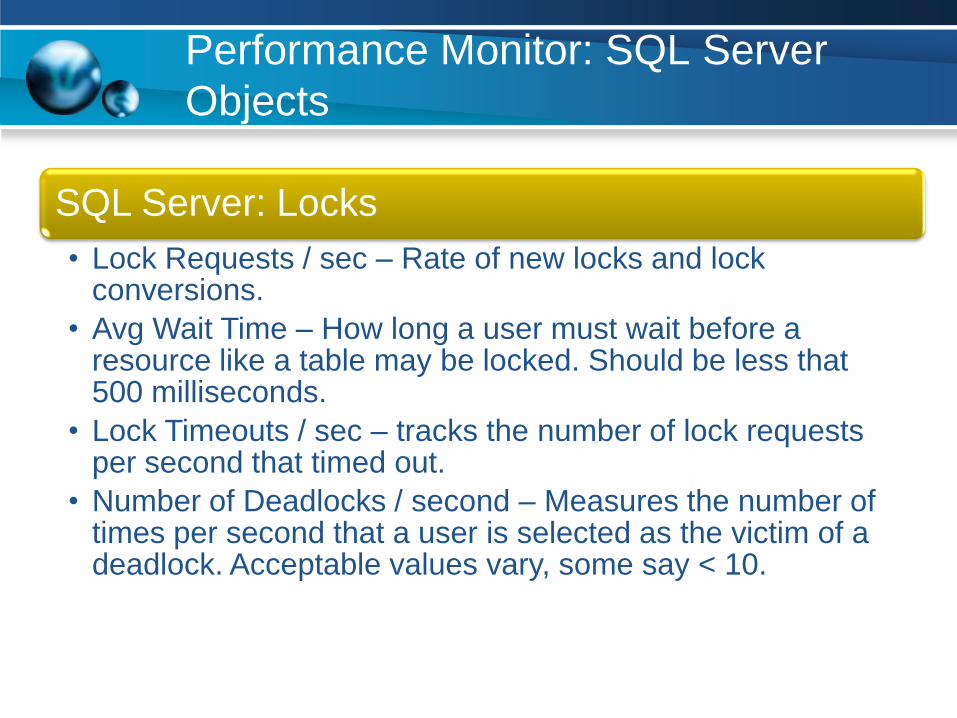
Performance Monitor: SQL Server
Objects
SQL Server: Locks
• Lock Requests / sec – Rate of new locks and lock conversions.
• Avg Wait Time – How long a user must wait before a resource like a table may be locked. Should be less that 500 milliseconds.
• Lock Timeouts / sec – tracks the number of lock requests per second that timed out.
• Number of Deadlocks / second – Measures the number of times per second that a user is selected as the victim of a deadlock. Acceptable values vary, some say < 10.
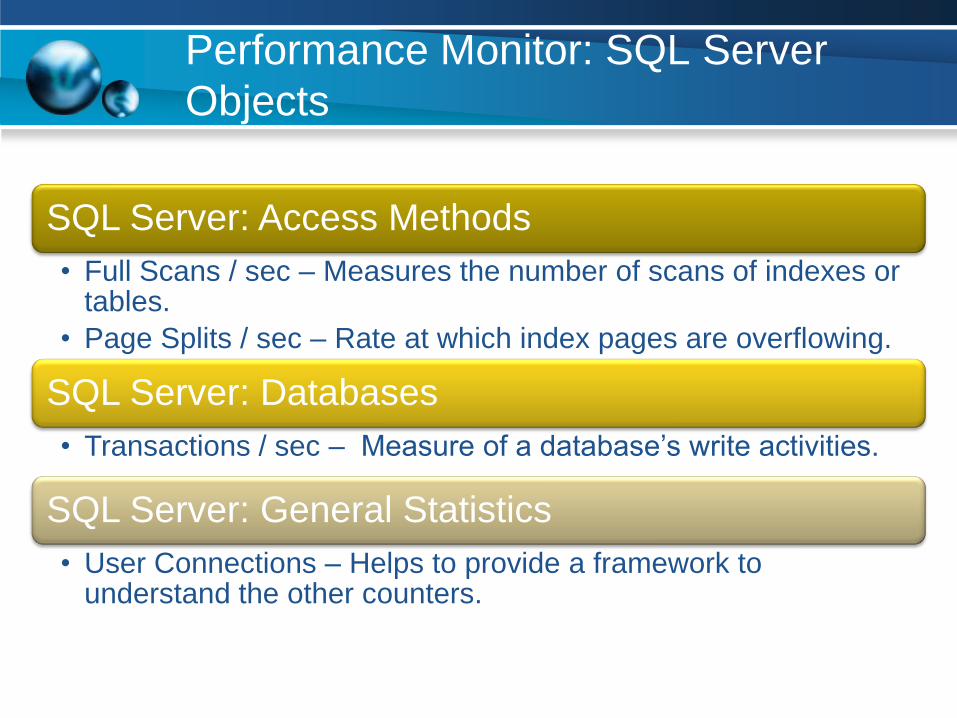
Performance Monitor: SQL Server
Objects
SQL Server: Access Methods
• Full Scans / sec – Measures the number of scans of indexes or tables.
• Page Splits / sec – Rate at which index pages are overflowing.
SQL Server: Databases
• Transactions / sec – Measure of a database’s write activities.
SQL Server: General Statistics
• User Connections – Helps to provide a framework to understand the other counters.
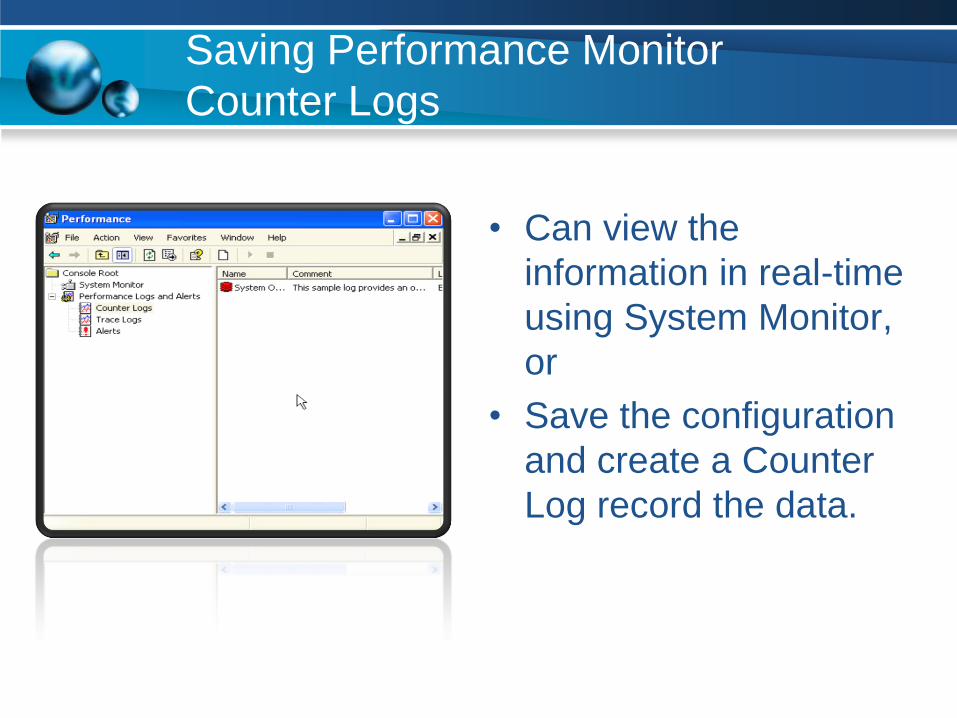
Saving Performance Monitor
Counter Logs
• Can view the
information in real-time
using System Monitor,
or
• Save the configuration
and create a Counter
Log record the data.
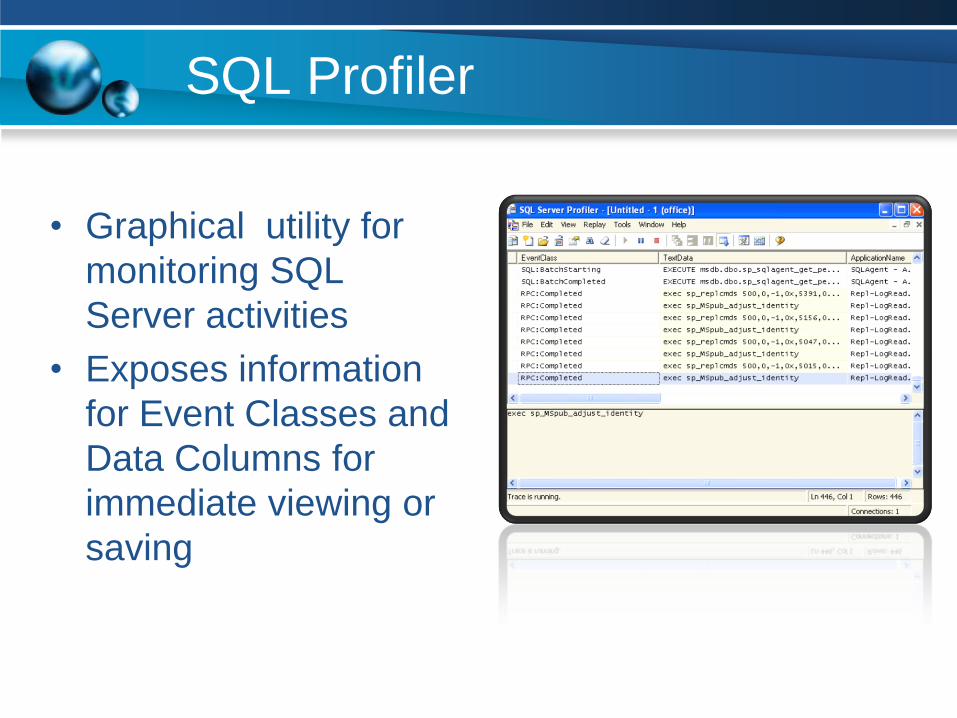
SQL Profiler
• Graphical utility for
monitoring SQL
Server activities
• Exposes information
for Event Classes and
Data Columns for
immediate viewing or
saving

SQL Profiler Uses
• Watch SQL Server activity as it occurs.
• Record events for subsequent analysis.
• Replay traces to simulate workload during stress
testing.
• Audit connection activities.
• Overlay Performance Monitor Counter Logs to
provide an integrate view of performance.
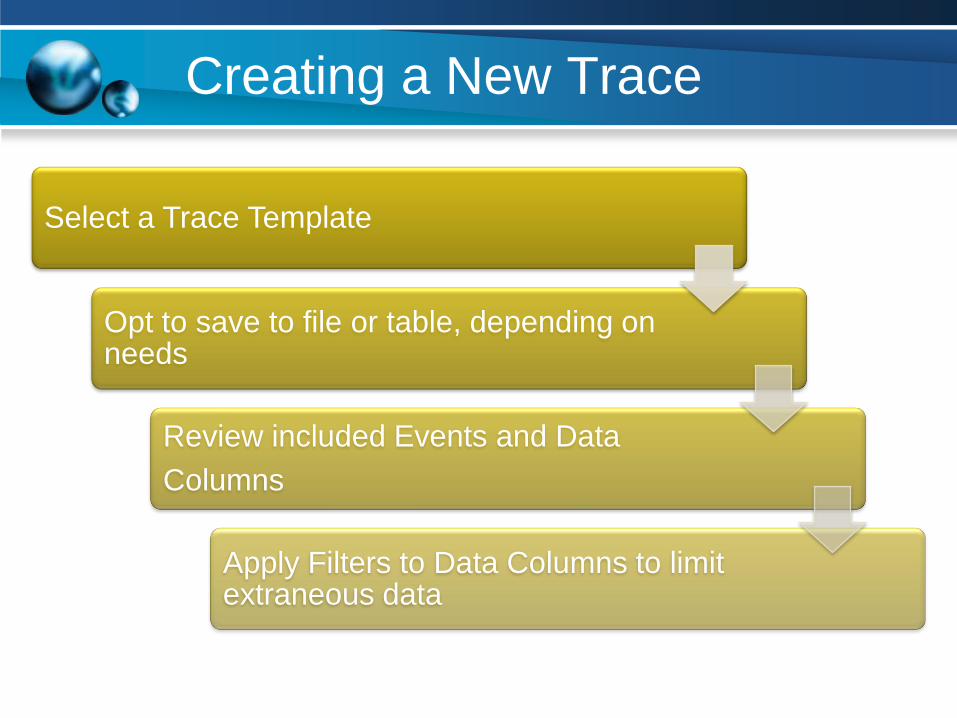
Creating a New Trace
Select a Trace Template
Opt to save to file or table, depending on needs
Review included Events and Data
Columns
Apply Filters to Data Columns to limit extraneous data
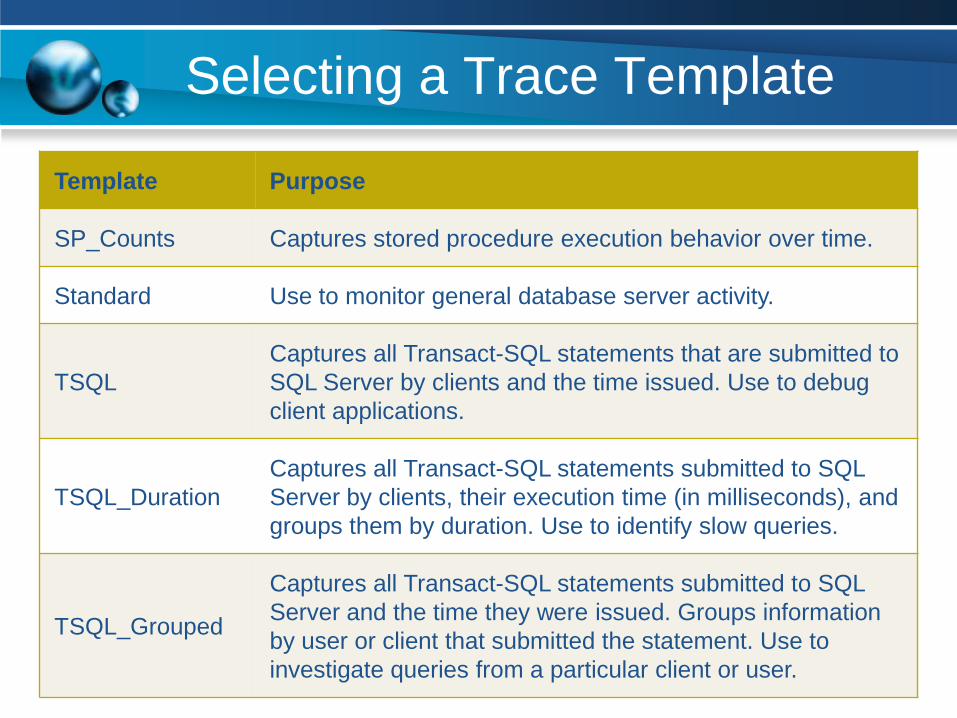
Selecting a Trace Template
Template Purpose
SP_Counts Captures stored procedure execution behavior over time.
Standard Use to monitor general database server activity.
TSQL
Captures all Transact-SQL statements that are submitted to
SQL Server by clients and the time issued. Use to debug
client applications.
TSQL_Duration
Captures all Transact-SQL statements submitted to SQL
Server by clients, their execution time (in milliseconds), and
groups them by duration. Use to identify slow queries.
TSQL_Grouped
Captures all Transact-SQL statements submitted to SQL
Server and the time they were issued. Groups information
by user or client that submitted the statement. Use to
investigate queries from a particular client or user.
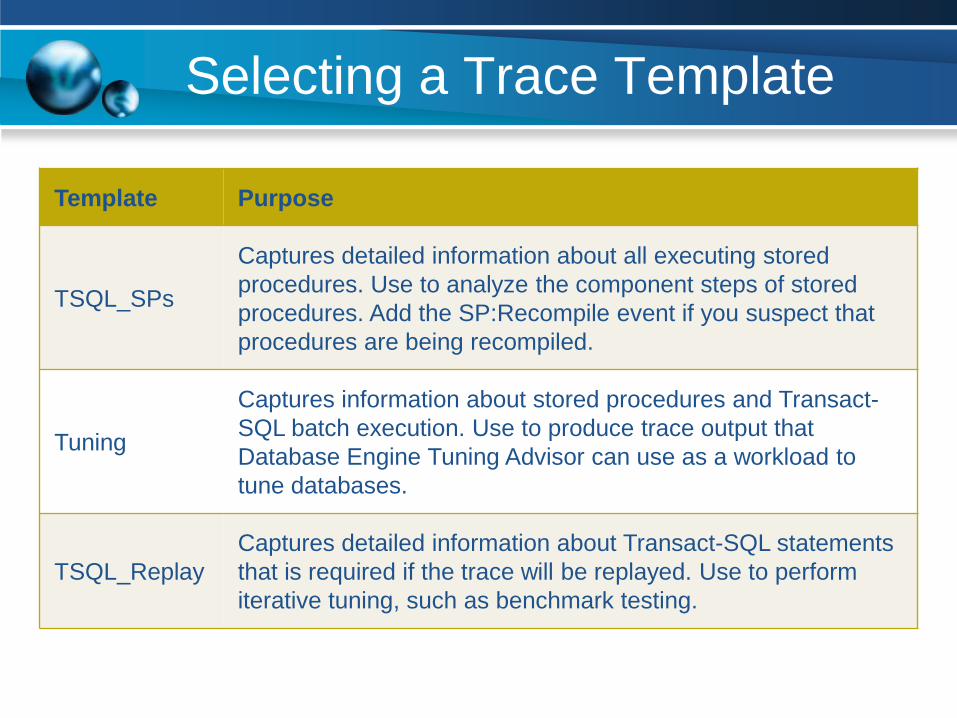
Selecting a Trace Template
Template Purpose
TSQL_SPs
Captures detailed information about all executing stored
procedures. Use to analyze the component steps of stored
procedures. Add the SP:Recompile event if you suspect that
procedures are being recompiled.
Tuning
Captures information about stored procedures and Transact-
SQL batch execution. Use to produce trace output that
Database Engine Tuning Advisor can use as a workload to
tune databases.
TSQL_Replay
Captures detailed information about Transact-SQL statements
that is required if the trace will be replayed. Use to perform
iterative tuning, such as benchmark testing.
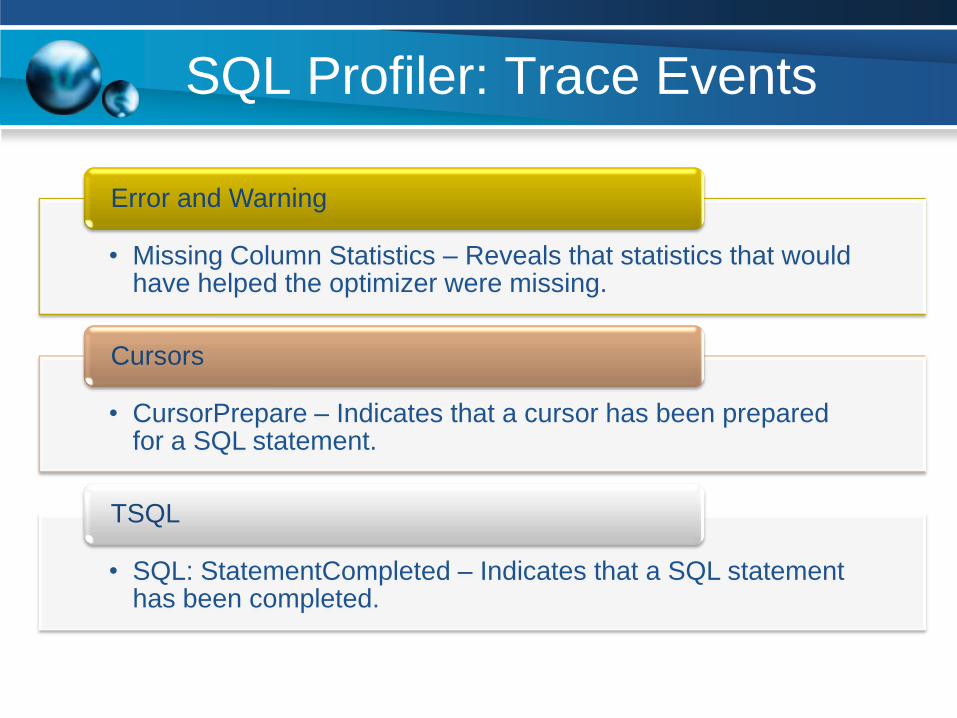
SQL Profiler: Trace Events
• Missing Column Statistics – Reveals that statistics that would have helped the optimizer were missing.
Error and Warning
• CursorPrepare – Indicates that a cursor has been prepared for a SQL statement.
Cursors
• SQL: StatementCompleted – Indicates that a SQL statement has been completed.
TSQL
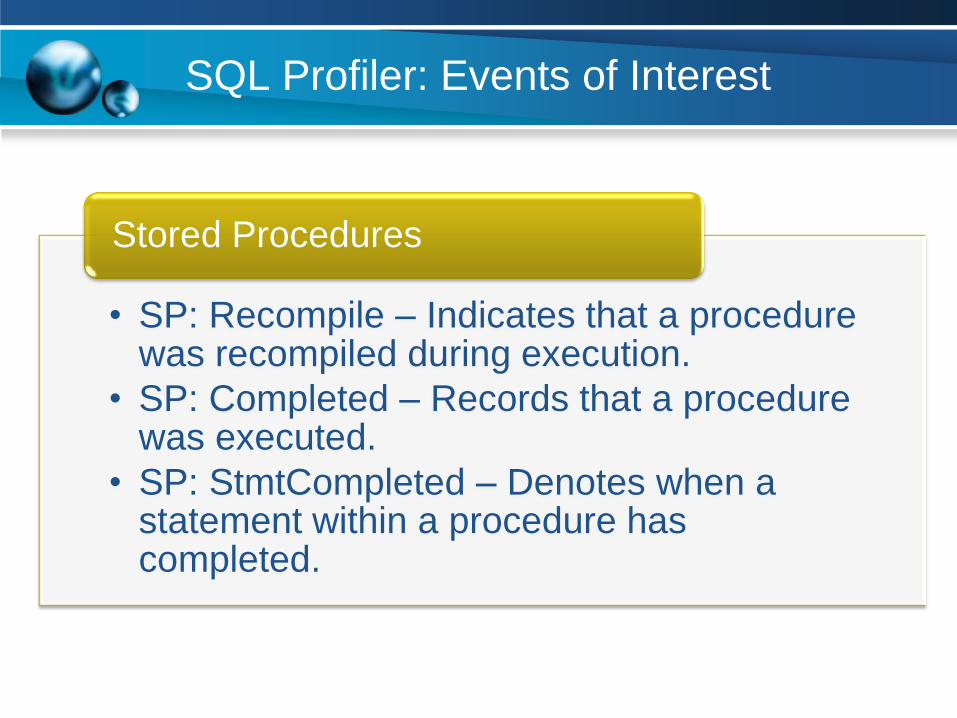
SQL Profiler: Events of Interest
• SP: Recompile – Indicates that a procedure was recompiled during execution.
• SP: Completed – Records that a procedure was executed.
• SP: StmtCompleted – Denotes when a statement within a procedure has completed.
Stored Procedures
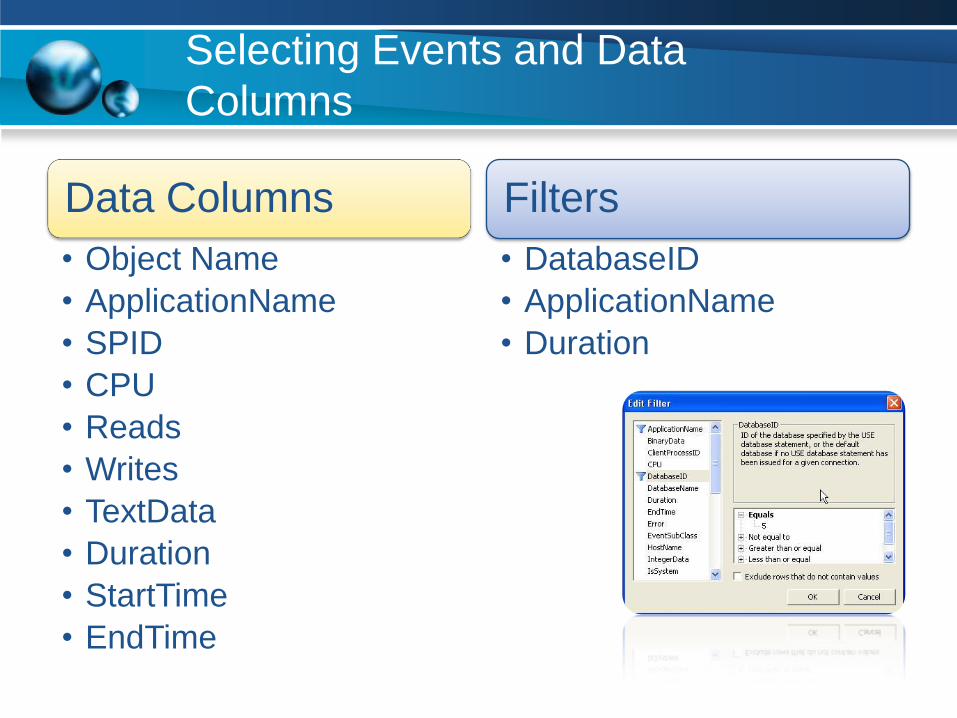
Selecting Events and Data
Columns
Data Columns
• Object Name
• ApplicationName
• SPID
• CPU
• Reads
• Writes
• TextData
• Duration
• StartTime
• EndTime
Filters
• DatabaseID
• ApplicationName
• Duration
Creating Server Side Traces
• Use SQL Profiler to create the trace and then
export it to a T-SQL script
• Use the trace procedures to execute and stop the
trace
– sp_trace_setstatus @TraceID, 1
– sp_trace_setstatus @TraceID, 0
• Can schedule to run at various times through the
day for benchmarking
Using Performance Dashboard
Reports
• Download Dashboard reports from http://www.microsoft.com/downloads/details.aspx?familyid=1d3a4a0d-
7e0c-4730-8204-e419218c1efc&displaylang=en
• Provides
– Recent CPU Utilization
– Current Activity
– Expensive Queries
• By CPU
• Logical Reads/Writes
• Physical Reads/Writes
• Duration
Additional Resources
• http://www.sql-server-performance.com
• http://blogs.msdn.com/psssql/default.aspx
• http://www.simple-talk.com
• http://www.sqlservercentral.com
• http://www.sqlteam.com
• http://www.sqlblog.com
• http://weblogs.sqlteam.com
• Inside SQL Server 2005 series of books

Questions?
http://www.twitter.com/joewebb
http://www.webbtechsolutions.com/blog
http://www.speakerrate.com/joewebb
Thank you!