identifying the types of missingness in quality of life data from clinical trials
TRANSCRIPT
STATISTICS IN MEDICINE, VOL. 17, 739—756 (1998)
Statist. Med., 17, 739—756 (1998)
IDENTIFYING THE TYPES OF MISSINGNESS IN QUALITYOF LIFE DATA FROM CLINICAL TRIALS
D. CURRAN1*, M. BACCHI2, S. F. HSU SCHMITZ2, G. MOLENBERGHS3 AND R. J. SYLVESTER1
1European Organization for Research and Treatment of Cancer (EORTC), Data Center, Avenue Mounier 83, Bte 11,Brussels 1200, Belgium
2Swiss Institute for Applied Cancer Research (SIAK), Effingerstr. 40, CH-3008 Bern, Switzerland3Limburgs Universitair Centrum, Universitaire Campus, Building D, B3590 Diepenbeek, Belgium
SUMMARY
This paper discusses methods of identifying the types of missingness in quality of life (QOL) data in cancerclinical trials. The first approach involves collecting information on why the QOL questionnaires were notcompleted. Based on the reasons provided one may be able to distinguish the mechanisms causing missingdata. The second approach is to model the missing data mechanism and perform hypothesis testing todetermine the missing data processes. Two methods of testing if missing data are missing completely atrandom (MCAR) are presented and applied to incomplete longitudinal QOL data obtained from interna-tional multi-centre cancer clinical trials. The first method (Ridout, 1991) is based on a logistic regression andthe second method (Park and Davis, 1993) is based on an adaptation of weighted least squares. In oneapplication (advanced breast cancer) missing data was not likely to be MCAR. In the second application(adjuvant breast cancer) the missing mechanism was dependent on the QOL scale under study. MCAR andmissing at random (MAR) have distinct consequences for data analysis. Therefore it is relevant to distinguishbetween them. However, if either MCAR or MAR hold, likelihood or Bayesian inferences can be basedsolely on the observed data, although for MAR, depending on the research question, modelling the dropoutmechanism may still be necessary. Distinguishing between MAR and missing not at random (MNAR) is nottrivial and relies on fundamentally untestable assumptions. ( 1998 John Wiley & Sons, Ltd.
INTRODUCTION
In the last few years increasing attention has been focused on the problem of analysinglongitudinal data with missing values and subsequently many methods have become available forthe analysis of such data. Although most of the literature focuses on continuous outcomes,categorical data analysis with missing values has also been given some attention. In the field ofquality of life (QOL) research many authors have commented on the problem of analysingincomplete data and interpreting the results. However, only a few authors have discussed thisproblem in detail and given some possible approaches to analyses.1,2
The first step in any analysis of incomplete data should involve determining the severity ofmissingness, identifying which individuals have missing data at which assessments. The
* Correspondence to: Desmond Curran, EORTC Data Center, Avenue E. Mounier, 83, Bte 11, 1200 Brussels, Belgium.E-mail: [email protected]
CCC 0277—6715/98/070739—18$17.50( 1998 John Wiley & Sons, Ltd.

mechanism which generates missing data should be identified so as to determine which methods ofanalysis are appropriate. Rubin described three missing data mechanisms: missing completely atrandom (MCAR); missing at random (MAR), and missing not at random (MNAR).3 These missingvalue processes are described in further detail later in this paper and elsewhere in this issue.4,5
In addition, Rubin addressed the key issue of what assumptions are necessary to justifyignoring the missing data mechanism. He established that the extent of ignorability depends onthe inferential framework. More precisely, for frequentist inference, such as least squares orgeneralized estimating equations, only MCAR is ignorable, while with likelihood and Bayesianinference, both MCAR and MAR are ignorable. Thus, for the latter modes of inference, ‘MNAR’and ‘non-ignorable’ become synonyms. In general, the undesirable effect of missingness on biasand power increases with the severity of non-randomness as well as with the proportion ofmissingness. Choi6 examined the results of simple statistical methods when the missing data wereignored (with dropout depending on outcome, not on treatment). Specifically, he showed that forboth binary and normally distributed response variables the results obtained by ignoring themissing data can be seriously flawed if the non-randomness is severe, even when only a smallproportion of the sample is missing.
Identifying the missing data mechanisms can be viewed from two complementary perspectives:
(i) collecting information on why the QOL questionnaires were not completed;(ii) hypotheses testing of the missing data processes.
The first approach is a pragmatic one and is based on prospectively collecting as muchinformation as possible to determine the reasons why questionnaires are missing. In QOL studies,reasons for dropout often vary between patients. However, due to the close link between QOLresearch and clinical settings, these reasons might be known. Based on the reasons why question-naires were missing it may be possible to decide if ignoring the missing questionnaires will bias theanalysis. The second approach is based on modelling the missing data mechanism to test if thedata are MCAR, MAR or MNAR. This paper presents two methods from the literature fortesting MCAR with applications to QOL data from clinical trials. The first method is based onfitting a logistic regression whereas the second method is based on an adaptation of weightedleast squares (WLS). Testing MNAR is also discussed. An argument is provided to illustrate thatit may not be possible to test this hypothesis.
TERMINOLOGY
In QOL studies missing data may be classified as: (i) item non-response (missing data ina questionnaire where no response has been provided for a question), or (ii) unit non-response (thewhole questionnaire is missing for a patient). Unit non-response can be further classified as: (a)intermittent-missing questionnaires; (b) dropout from the study; (c) late entry into the study. Toexplain the different types of unit non-response we provide some examples as follows. Considera study where QOL is assessed every month. Suppose, a patient completed assessments at months0, 2, 3, 5 and 6. There are intermittent missing questionnaires at months 1 and 4. At month 7 thepatient dropped out of the study and therefore no additional assessments were received. Supposea second patient was registered into the trial in September 1996 and the analysis was performed inthe beginning of December 1996. Questionnaires were completed at months 0, 1 and 2. For thispatient, no additional questionnaires were expected as the patient was recently registered in thestudy.
740 D. CURRAN E¹ A¸.
Statist. Med., 17, 739—756 (1998) ( 1998 John Wiley & Sons, Ltd.

A QOL questionnaire is MCAR if the probability of having a missing questionnaire isindependent of scores on previous observed questionnaires and independent of the current andfuture scores had they been observed. Thus, a QOL questionnaire may be MCAR if the reason formissingness is that the nurse or data manager forgot to ask the patient to complete thequestionnaire, that is, the reason for missingness is independent of the patient’s QOL. For MAR,the probability of having a missing questionnaire may depend on previous scores but must beindependent of the current and future scores. For example, if patients with a poorer QOL score atthe previous assessment are more likely to have missing questionnaires at the current assessment,then the missing questionnaires are not MCAR but may be MAR. For MNAR, the probability ofhaving a missing questionnaire depends on scores in current and future unobserved assessments.If patients’ QOL scores are constant during the period over which they complete questionnairesbut the QOL scores deteriorate at and/or after the time of dropout, then the process of decline isnot observed and the questionnaires are MNAR. This is sometimes referred to as informativedropout.7
1. WHY HAS THE QOL QUESTIONNAIRE NOT BEEN COMPLETED?
One of the major challenges in analysing QOL data with missing questionnaires in the setting ofa clinical trial is determining if a valid comparison of the treatment arms is being made. Whenperforming a longitudinal QOL analysis, complications may occur due to intermittently missingquestionnaires and patients dropping out of the study. However, one advantage of studying QOLas an integral part of a clinical trial is that additional clinical information is collected at each visit.In the past, information related to the patients’ survival status, disease status, symptoms andtoxicity was useful in determining retrospectively why further QOL data had not been attained.However, this information was useful for explaining only a portion of the missing questionnaires.Therefore, more recently the European Organization for Research and Treatment of Cancer(EORTC) and the Swiss Institute for Applied Cancer Research (SIAK) have prospectivelyincluded questions on the clinical case report forms (CRF’s, for example, treatment and follow-upforms) in an attempt to capture more information on why questionnaires were missing. InEORTC and SIAK trials these questions generally have the following format:
Has the patient filled in the current quality of life questionnaires, 0"no, 1"yesIf no, please state the main reason
1"patient felt too ill2"clinician or nurse felt the patient was too ill3"patient felt it was inconvenient, takes too much time4"patient felt it was a violation of privacy5"patient didn’t understand the actual language/illiterate6"administrative failure to distribute the questionnaire to the patient7"other, please specify
The survival and disease status of the patient are also collected on the CRF’s. Initially, weattempted to distinguish between treatment toxicity and disease related symptoms. However, asa nurse or a data manager usually administers the QOL questionnaire it may be difficult for himor her to distinguish between the two.
IDENTIFYING THE TYPES OF MISSINGNESS IN QOL DATA 741
( 1998 John Wiley & Sons, Ltd. Statist. Med., 17, 739—756 (1998)

2a. HYPOTHESIS TESTING FOR MCAR
When likelihood and Bayesian inference is used and when only the measurement model para-meters are of interest then the distinction between MCAR and MAR is of minor concern,although there are still a few issues related to the estimation of standard errors.8 In addition, evenwhen likelihood and Bayesian inference is applied it may be necessary to distinguish betweenMCAR and MAR depending on the research questions. For example, if ½ follows a multivariateGaussian distribution, then under MCAR the mean structure of ½ coincides with the conditionalmean structure of ½ given no dropout, but this is not so under MAR, except in the generallyunrealistic case of uncorrelated ½
j.7 Thus, if the research question involves determining the
conditional mean structure of ½ given no dropout, it is necessary to distinguish between MCARand MAR. Moreover, frequentist techniques, such as generalized estimating equations,9 are onlyvalid under MCAR. It is then crucial to discriminate between both MCAR and MAR.
In the literature a number of methods have been described for testing the hypothesis ofMCAR.10—15 Two methods are presented and discussed in this section. The first method proposedby Ridout is based on a logistic regression,12 whereas the second method, proposed by Park andDavis, is based on an adaptation of weighted least squares (WLS).13 Some applications areprovided in the context of incomplete longitudinal QOL data obtained from internationalmulti-centre cancer clinical trials.
Ridout method
In 1991 Ridout12 proposed a method for testing completely random dropout using a logisticregression.16 This method assumes a monotone pattern of missing data, that is, the baselineassessment is available for all patients and at subsequent assessments a proportion of patientsdrop out and never complete the questionnaire again (see Figure 1). Thus intermittently missingquestionnaires are not taken into account in this method.
For each time point ¹k, identify the subset of patients S
k(collection of patients i such that
i"1,2 , nk) for whom an assessment is available at that time point and identify the subset of
patients skfor whom it is their final assessment before they drop out of the study. The subset of
patients skconsists of the patients i such that n
k`1(i)n
k(see Figure 1). Testing for completely
random dropout involves testing the assumption that the scores from the skpatients are a random
sample of the scores from the Skpatients. The pool of S
k’s constitute the sample for the regression.
The response variable is dropout or not at time k. The logistic regression model is given by:
logit (Pr (dropout))"k#(X, Y)b
where k is the intercept, b is a vector of parameters, X is an array consisting of covariates such astreatment and time of assessment and Y is an array of observed QOL scores. Note that for MCARthe dropout mechanism may depend on the values of fixed covariates. In particular, if thecovariate matrix includes time and/or treatment as a variable then the model allows the dropoutrates to vary over time and/or treatments. This is usually referred to as ‘covariate dependentdropout’.17 A logistic regression may be performed using standard statistical software such as theLOGISTIC procedure in SAS.18
Example
In this example, 177 post-menopausal advanced breast cancer patients were accrued intoa multi-centre randomized phase III trial (SAKK 20/90), which aimed at comparing the
742 D. CURRAN E¹ A¸.
Statist. Med., 17, 739—756 (1998) ( 1998 John Wiley & Sons, Ltd.

Figure 1. A monotone pattern of missing data
effectiveness and toxicity of 4-OH-Androstenedione (arm A, 91 patients) versus megestrol acetate(arm B, 86 patients) as second line hormonal treatment. QOL data were collected to evaluatesecondary endpoints such as impact of treatment on QOL and QOL as a prognostic factor fortime to treatment failure. Patients were continuously treated until treatment failure, that is,disease progression, unacceptable toxicity, death or patient refusal. The clinical visits werescheduled at week 2, months 1, 2, 3, then every 2 months and at treatment failure. QOLassessments were collected during clinical visits at randomization (baseline), months 1, 3, 5, 7,9 and 11. Thus, patients who did not have a premature treatment failure (that is, before month 11)should have completed seven QOL assessments.
QOL was measured by seven linear analogue self-assessment (LASA) scales, ranging from 0 to100, for physical well-being, mood, fatigue, appetite disturbance, hot flushes, dizziness andperceived adjustment to chronic illness (PACIS). Reasons for the missingness of QOL question-naires were documented if available and classified as ‘administrative problems’, ‘patient refusal’,‘language problems’ and ‘others’ (for example, physician refusal, no clinical visit). For this paper,only the PACIS scale was considered. For ease of interpretation the original scores were reversed(100-original score), so that higher scores represent better QOL.
The reasons for missing values for each patient sometimes differed from assessment toassessment. For example, consider a patient who completed assessments at time points 1, 2 and 4.The missing value at time point 3 was intermittent-missing and caused by administrativeproblems, while the missing values at time points 5, 6 and 7 were dropout-missing and caused bypatient refusal, missing PACIS score within the received QOL questionnaire (that is, itemnon-response) and premature treatment failure, respectively.
The dominant type of missingness in this example was dropout. Table I presents the number ofdropouts at each time point and the cumulative dropout rates. About half of the patients droppedout before month 5, which was consistent with the median times to treatment failure of 120 daysin arm A and 111 days in arm B. Most of the dropouts were caused by premature treatmentfailure; however, 20 per cent of patients (17 per cent in arm A and 23 per cent in arm B) droppedout for reasons other than treatment failure. For the latter subgroup Table II lists the number of
IDENTIFYING THE TYPES OF MISSINGNESS IN QOL DATA 743
( 1998 John Wiley & Sons, Ltd. Statist. Med., 17, 739—756 (1998)

Table I. Number of patients with dropout-missing values and cumulative dropout rates (advanced breastcancer)
Arm A (91 patients) Arm B (86 patients) Total (A#B)
Dropouttime
Number of patientsdropped out due to
Cumulative Number of patientsdropped out due to
Cumulative Cumulativedropout dropout dropoutrate (%) rate (%) rate (%)
Treatment Other Treatment Otherfailure reasons failure reasons
Baseline 0 2 2)2 0 6 7)0 4)5Month 1 7 4 14)3 14 2 25)6 19)8Month 3 28 1 46)2 21 1 51)2 48)6Month 5 9 1 57)1 10 1 64)0 60)5Month 7 6 0 63)7 8 2 75)6 69)5Month 9 10 1 75)8 4 1 81)4 78)5Month 11 3 4 83)5 3 5 90)7 87)0
Total 63 13 60 18
Table II. Number of before-treatment-failure dropout-missing values per patient and the causes of theirmissingness among patients who dropped out due to causes other than premature treatment failure
(advanced breast cancer)
Number of dropout- Arm A Arm B Cause of missingness Arm A Arm Bmissing values (13 patients) (18 patients) (18 values) (29 values)per patient
1 8 12 Administrative problems 7 112 5 2 Patient refusal 6 73 0 3 Language problems 2 04 0 1 Others 1 9
Missing PACIS 2 2
dropout-missing values (before treatment failure) per patient and the reasons for missingness.Intermittent-missing values were relatively infrequent. The number of intermittent-missing valuesper patient varied between 0 and 4. Most cases involved missing at baseline. Table III lists thenumber of intermittent-missing values per patient and the reasons for missingness.
Eight patients (2 in arm A and 6 in arm B) did not give any data on their QOL, that is, were notcompliant (see Table I), and thus were excluded from the analysis. The reasons for the missingnessof their QOL questionnaires were ‘administrative problems’ (n"4), ‘patient refusal’ (n"2),‘language problems’ (n"1) and ‘others’ (n"1). To focus on dropouts due to missing question-naires, two further patients who dropped out due to missing items (PACIS) were also excludedfrom the analysis. For patients who had multiple dropout-missing values, only the time and thecause of the first missing value were considered in the analysis.
The approach suggested by Ridout12 and applied in Diggle et al.7 was performed to testcompletely random dropout (MCAR) through a logistic regression. Let k denote the possibletimes for dropping out where k"1, 2,2 , 6 corresponds to months 1, 3, 5, 7, 9 and 11,
744 D. CURRAN E¹ A¸.
Statist. Med., 17, 739—756 (1998) ( 1998 John Wiley & Sons, Ltd.
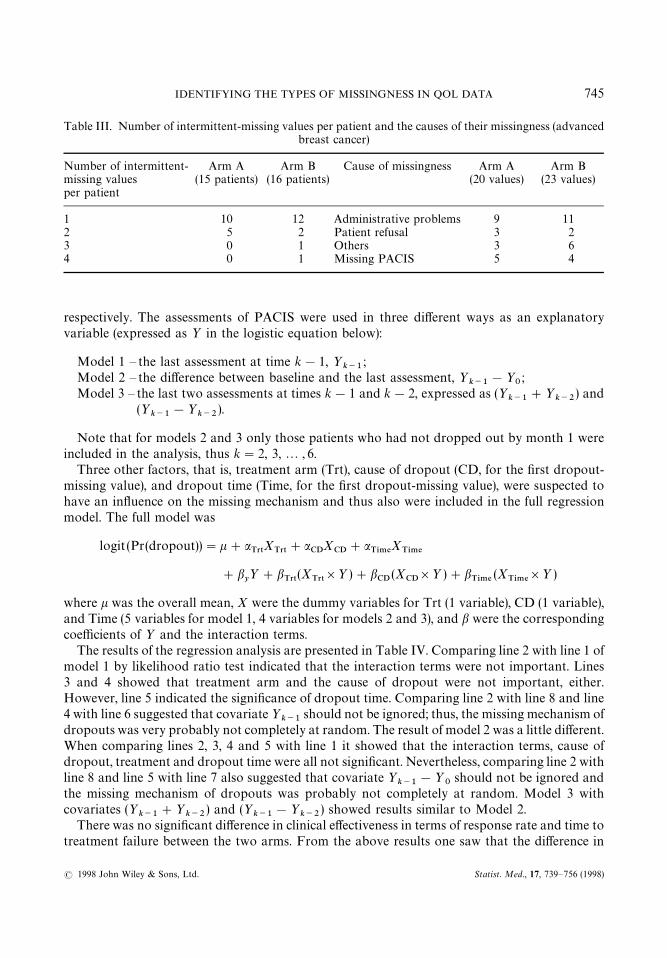
Table III. Number of intermittent-missing values per patient and the causes of their missingness (advancedbreast cancer)
Number of intermittent- Arm A Arm B Cause of missingness Arm A Arm Bmissing values (15 patients) (16 patients) (20 values) (23 values)per patient
1 10 12 Administrative problems 9 112 5 2 Patient refusal 3 23 0 1 Others 3 64 0 1 Missing PACIS 5 4
respectively. The assessments of PACIS were used in three different ways as an explanatoryvariable (expressed as ½ in the logistic equation below):
Model 1 — the last assessment at time k!1, ½k~1
;Model 2 — the difference between baseline and the last assessment, ½
k~1!½
0;
Model 3 — the last two assessments at times k!1 and k!2, expressed as (½k~1
#½k~2
) and(½
k~1!½
k~2).
Note that for models 2 and 3 only those patients who had not dropped out by month 1 wereincluded in the analysis, thus k"2, 3,2 , 6.
Three other factors, that is, treatment arm (Trt), cause of dropout (CD, for the first dropout-missing value), and dropout time (Time, for the first dropout-missing value), were suspected tohave an influence on the missing mechanism and thus also were included in the full regressionmodel. The full model was
logit (Pr(dropout))"k#aT35
XT35
#aCD
XCD
#aT*.%
XT*.%
#by½#b
T35(X
T35]½)#b
CD(X
CD]½ )#b
T*.%(X
T*.%]½ )
where k was the overall mean, X were the dummy variables for Trt (1 variable), CD (1 variable),and Time (5 variables for model 1, 4 variables for models 2 and 3), and b were the correspondingcoefficients of ½ and the interaction terms.
The results of the regression analysis are presented in Table IV. Comparing line 2 with line 1 ofmodel 1 by likelihood ratio test indicated that the interaction terms were not important. Lines3 and 4 showed that treatment arm and the cause of dropout were not important, either.However, line 5 indicated the significance of dropout time. Comparing line 2 with line 8 and line4 with line 6 suggested that covariate ½
k~1should not be ignored; thus, the missing mechanism of
dropouts was very probably not completely at random. The result of model 2 was a little different.When comparing lines 2, 3, 4 and 5 with line 1 it showed that the interaction terms, cause ofdropout, treatment and dropout time were all not significant. Nevertheless, comparing line 2 withline 8 and line 5 with line 7 also suggested that covariate ½
k~1!½
0should not be ignored and
the missing mechanism of dropouts was probably not completely at random. Model 3 withcovariates (½
k~1#½
k~2) and (½
k~1!½
k~2) showed results similar to Model 2.
There was no significant difference in clinical effectiveness in terms of response rate and time totreatment failure between the two arms. From the above results one saw that the difference in
IDENTIFYING THE TYPES OF MISSINGNESS IN QOL DATA 745
( 1998 John Wiley & Sons, Ltd. Statist. Med., 17, 739—756 (1998)

Table IV. Results of logistic regression analysis (advanced breast cancer)
Null hypothesis Model 1 (N"573) Model 2 (N"399) Model 3 (N"399)d.f. !2 log L d.f. !2 log L d.f.s !2 log L
1. Full model 557 606)374 385 458)824 378 452)5602. b
T35"b
CD"b
T*.%*"0 564 608)310 391 468)175 390 463)051
3. aCD
"bT35
"bCD
"bT*.%
*"0 565 609)675 392 472)425 391 465)9894. a
CD"a
T35"b
T35"b
CD"b
T*.%*"0 566 612)155 393 473)030 392 467)256
5. aCD
"aT35
"aT*.%
*"bT35
"bCD
"bT*.%
*"0 571 636)744 397 479)761 396 473)2696. a
CD"a
T35"b
:"b
T35"b
CD"b
T*.%*"0 567 624)598 — — — —
7. aCD
"aT35
"aT*.%
*"by"b
T35"b
CD"b
T*.%*"0 — — 398 484)554 398 484)554
8. by"b
T35"b
CD"b
T*.%*"0 565 621)581 392 474)509 392 474)509
* Corresponding to 5 dummy variables in model 1 and 4 dummy variables in model 2s Because of 2 ½ variables in model 3 the number of b parameters are doubled when compared with model 2
probability of dropping out for PACIS between arms was not significant either. Although 20 percent of the patients dropped out due to other reasons before treatment failure, this was nota significant factor for the missing mechanism of dropouts, which might be explained as beingconfounded with other factors, for example, dropout time. As seen in Table I, the increase incumulative dropout rate between months 1 and 3 was much larger than in other consecutive timeintervals; therefore, it was not a surprise to see the significance of dropout time in model 1.However, for the subset of patients who did not drop out by month 1, the dropout time was nolonger an important factor in models 2 and 3, which implied month 1 was a critical time point fordropout in our patient population. All three models suggested the missing mechanism ofdropouts was probably not completely at random.
Park and Davis method
The weighted least square (WLS) methods proposed by Grizzle et al.19 (GSK) in 1969 have beenfurther developed for the analysis of incomplete longitudinal categorical data.20,21 Thesemethods assume that the missingness mechanism is completely at random (MCAR) in the sense ofRubin.3 When the response variable is categorical (with few response categories), the number ofmeasurement times is small and the sample size is relatively large within each category of thecross-classification of response and time, a general linear models approach based on WLS can beused to produce Wald statistics for testing hypotheses. Park and Davis13 (PD) proposed a simpletest of the missing data mechanism in incomplete repeated categorical data in the framework ofthe GSK method.
The test is an extension of the test of Little10 and uses a test criterion given in general form byWald. The method is briefly summarized here. Consider a single response variable that hasc response categories (including the category for missing or unknown response) and n subjectswith the response variable measured at t time points. Each of the subjects has a response profilebelonging to one of ct!1 possible categories (examples: YYN is a response profile correspondingto response ‘yes’, ‘yes’ and ‘no’ at 3 time points for a binary variable; YNM is a response profile
746 D. CURRAN E¹ A¸.
Statist. Med., 17, 739—756 (1998) ( 1998 John Wiley & Sons, Ltd.

corresponding to response ‘yes’, ‘no’ and ‘missing’ at 3 time points). We may define H strataaccording to the missing data patterns, and for the hth pattern the regression models aredefined as
E [F(ph)]"X
hbh
with phbeing the vector of sample proportions, F (p
h) a vector of u
hfunctions of p
h, X
his a u
h?l
model matrix and bh
is a l?1 vector of unknown parameters. The model allows differentestimators of b
hfor h"1,2 , H.
The missing data mechanism can be examined by testing the homogeneity of model parametersusing the Wald statistic for H
0: b
1"2"b
H. If H
0holds, then the distribution of F
hdoes not
depend on h and the missing data process may be considered MCAR. If H0
does not hold, thenthe distribution of F
his likely to depend on the missing data patterns and the missing data process
is probably not MCAR. In addition to testing the missing data mechanism, the model allowsother linear hypotheses to be tested for b.
The PD method requires at least moderately large samples for each stratum so that theestimates of coefficients are approximately normally distributed. When there are many strataand/or the strata sample sizes are considerably different, it is better to use a two-strata ap-proach (that is, ‘complete’ data at all time points versus ‘incomplete’ with at least one missingobservation). In settings where there is a dominant missing data pattern or a monotonemissing data pattern this may be a reasonable approach. Its advantages are: it is useful for specificmissing data patterns; it is flexible and easy to apply and reduces the number of parameters tobe estimated. PD methodology can be implemented using standard statistical software such asthe CATMOD procedure in SAS.18,22 An application of this approach in longitudinal incom-plete categorical QOL data obtained from an international multi-centre clinical trial is givennext.
Example
A group of 219 patients randomized into International Breast Cancer Study Group (IBCSG)studies VI-14 and participating in an ancillary study of immunological and psychosocial evalu-ation were observed for a minimum of 6 months (during adjuvant chemotherapy and/orendocrine treatment for operable breast cancer).23 Clinical factors (age, menopausal and nodalstatus), sociodemographic factors (level of education, language) and assigned treatment wereinvestigated. Immunological and QOL assessments were planned at day 1 (baseline), months 3, 6,12 and 24. At the time of the clinical visit, patients were given self-administered questionnairesand interviews. The QOL questionnaries included LASA (IBCSG) and a series of orderedcategorical scales.24 Some scales were single-item and others multi-item. We prospectivelyselected for this example: ‘anxiety’ (summary score as an average of 5 items each with 6 orderedresponse categories ranging from 0"no to 5"very much); and ‘burden related to hair loss’ (1item with 6 ordered categories, the same as for anxiety). When an item belonging to a multi-itemscale was missing, the total scale value was defined as missing. The reasons for missing QOLquestionnaires were ‘prospectively’ collected and defined as: ‘local organization problems’,‘patient refusal’, ‘language problems’, ‘health related problems’, ‘relapse/death’ and ‘others’.
In this example 170 patients had node negative (78 per cent) breast cancer, 140 (64 per cent)were pre-menopausal and 163 (74 per cent) were younger than 60 years. Five patients (2 per cent)did not participate in the psychosocial-QOL part of the investigation due to refusal (3), localadministrative (1) or language (1) problems.
IDENTIFYING THE TYPES OF MISSINGNESS IN QOL DATA 747
( 1998 John Wiley & Sons, Ltd. Statist. Med., 17, 739—756 (1998)

The analysis was based on 642 questionnaires covering the QOL assessment in the first6 months. There were few missing QOL questionnaires (18/642, 3 per cent; 4 local problems,5 refusals, 2 health related problems, 6 relapses or deaths and 1 due to other reasons). In thishighly compliant group, the small amount of missing data was a mixture of intermittent-missingquestionnaires and dropouts (due to relapse or death and refusal). Owing to the rather smallamount of missing data, we categorized the two QOL variables as binary outcome (anxious, notanxious) plus a third category for missing and used a two-strata approach: ‘complete’ vs‘incomplete’. We were mainly interested in formally testing if the parameter estimates for the‘complete’ stratum were significantly different from the ‘incomplete’ stratum. We modelled themarginal probability of ‘anxiety’ (defined as a scale score'1) or ‘burden related to hair loss’(defined as a scale score'1) at each time point. The vector of response functions was pi"(p
0#,
p3#
, p6#
, p0*
, p3*
, p6*
) where the subscript ‘c’ is for ‘complete’ data and ‘i’ for ‘incomplete’ data andthe numbers represent the time (months). When the data are incomplete, the components ofp*must be calculated as ratios of sums of the multinomial proportions corresponding to the
response profiles. In PROC CATMOD,18,21 these operations are specified as a series of linear,logarithmic and exponential transformations of the elements of the vector p*i of multinomialproportions. In general
pi"exp(A2 log (A1p*i )).
The matrix A1 has ct rows and as many columns as there are observed response profiles and A2
is a (c!1)t?ct matrix.In both examples, we fitted a saturated model with separate intercepts and linear and quadratic
time effects for the two strata of ‘complete’ and ‘incomplete’. A 3d.f. contrast was used to testwhether the parameter estimates for the ‘complete’ differ significantly from those for the ‘incom-plete’. We did not explore any further model reduction.
The following were the results for the ‘anxiety’ scale (214 patients). Overall, the proportion with‘anxiety’ was 0)48 at baseline (207 patients) and was rather stable for the subsequent twoassessments (0)47 at 3rd and 0)46 at 6th month, respectively). Anxiety scale compliance was notsignificantly associated with clinical or sociodemographic factors. Twenty-four of the 214 (11 percent) patients had at least one missing value in the three QOL assessments and defined thestratum of incomplete data, the other 190 had complete data. Since the outcome measure hadthree possible values (no, yes or missing) and was assessed at 3 time points, there werect!1"27!1"26 possible response patterns (8 for ‘complete’ and 18 for ‘incomplete’). Weobserved 11 missing response patterns (and 5 distinct missing patterns, see Table V) with missingat the 3rd month being the most frequent. The observed proportions with ‘anxiety’ at each timepoint are presented in Table VI and Figure 2(a). Figure 2(a) provides information aboutmissingness; at each time point the proportion with ‘anxiety’ was higher in patients with‘incomplete’ data, in particular at the 3rd month. The saturated model results showed that therewas no significant time effect and the Wald statistic indicated a highly significant differencebetween ‘complete’ and ‘incomplete’ cases (chi square 13)09, 3 d.f., p"0)0044).
We considered also the ‘subjective burden related to hair loss’ scale (214 patients). Overall, theproportion with ‘burden’ was 0)09 at baseline (202 patients) and increased to 0)57 and 0)50 in thesubsequent two assessments. Scale compliance was not significantly associated with clinical orsociodemographic factors. Twenty seven of the 214 (13 per cent) patients had at least one missingvalue and defined the stratum of ‘incomplete’ (11 distinct missing response patterns, see TableVII). Missing at baseline was the most frequent. The observed proportions with ‘burden’ at each
748 D. CURRAN E¹ A¸.
Statist. Med., 17, 739—756 (1998) ( 1998 John Wiley & Sons, Ltd.

Table V. Number of patients by response profiles (anxiety scale: operable breast cancer)
Response category (baseline, 3rd month, 6th month):N"no anxiety, Y"anxiety, M"missing
N N N N Y Y Y Y Y Y Y N N N N M M M MN N Y Y N N Y Y Y M M Y M M M Y Y N NN Y N Y N Y N Y M Y M M Y N M Y N N M
73 10 9 10 16 7 8 57 4 4 3 1 1 3 1 4 1 1 1
Table VI. Proportion with ‘Anxiety’ (operable breast cancer)
Baseline 3rd month 6th month
Incomplete data (n"24) 0)647 0)833 0)643Complete data (n"190) 0)463 0)442 0)442
time point are presented in Table VIII and Figure 2(b). At each time point, except at the 3rdmonth, the proportion with ‘burden’ was similar in patients with ‘complete’ or ‘incomplete’ data.As before, we were interested in modelling the probability of ‘burden’ at different time points inthe two strata. The saturated model results showed that there was a significant time effect and theWald statistic indicated that the parameters for ‘complete’ and ‘incomplete’ cases were notsignificantly different (chi square 1)73, 3 d.f., p"0)63).
2b. HYPOTHESIS TESTING FOR MNAR
Molenberghs et al.25 demonstrated that testing the assumptions of MAR or alternatively ofMNAR is not trivial. The authors suggest that testing will almost always rest on strongassumptions which are often untestable. Glynn et al.26 developed an argument to illustrate theseissues. An illustration of this argument for QOL data is given below.
Suppose in a clinical trial QOL is assessed at two time points, for example, pre-treatment (y1)
and post-treatment (y2). Let R be an indicator variable such that R"1 if only the pre-treatment
assessment is available and R"2 if both assessments are available. Then, with a selectionmodel,17,26 the joint distribution of R and y
1, y
2(suppressing the covariate matrix and parameter
vector b) is given by
f (y1, y
2, R)"f (y
1, y
2) f (R/y
1, y
2). (1)
If a pattern-mixture model16,25 were used then the joint distribution of R and y1, y
2would be
given by
f (y1, y
2, R)"g (y
1, y
2/R) g(R) . (2)
Let n1"g (1) represent the probability of only the first assessment being attained and let
n2"g(2) represent the probability of both assessments being obtained. Then n
1#n
2"1. Thus
f (y1, y
2, 1)"f (y
1, y
2) f (1/y
1, y
2)
"n1g (y
1, y
2/1) (3)
IDENTIFYING THE TYPES OF MISSINGNESS IN QOL DATA 749
( 1998 John Wiley & Sons, Ltd. Statist. Med., 17, 739—756 (1998)

Figure 2. The observed proportions of patients (operable breast cancer), at each time point, with (a) ‘anxiety’, and(b) ‘burden related to hair loss’
750 D. CURRAN E¹ A¸.
Statist. Med., 17, 739—756 (1998) ( 1998 John Wiley & Sons, Ltd.

Table VII. Number of patients by response profiles (burden related to hair loss: operable breast cancer)
Response category (baseline, 3rd month, 6th month):N"no burden, Y"burden, M"missing
N N N N Y Y Y Y Y Y N N N N N M M M MN N Y Y N N Y Y Y M Y N M M M Y Y N NN Y N Y N Y N Y M M M M Y N M Y N Y N
62 15 23 71 4 1 4 7 1 1 3 1 2 4 3 6 2 1 3
Table VIII. Proportion with ‘burden related to hair loss’ (operable breast cancer)
Baseline 3rd month 6th month
Incomplete data (n"27) 0)133 0)706 0)500Complete data (n"187) 0)086 0)562 0)503
and
f (y1, y
2, 2)"f (y
1, y
2) f (2/y
1, y
2)"f (y
1, y
2)M1!f (1/y
1, y
2)N
"n2g (y
1, y
2/2)"(1!n
1)g (y
1, y
2/2). (4)
Thusf (1/y
1, y
2)
1!f (1/y1, y
2)"
n1g (y
1, y
2/1)
(1!n1)g (y
1, y
2/2)
. (5)
Assuming that n1, f (1/y
1, y
2) and g (y
1, y
2/2) are estimable, then g (y
1, y
2/1) would be identifiable
too. However, decomposing g (y1, y
2/1)"g (y
1/1)g (y
2/y
1, 1) it follows that for g (y
2/y
1, 1) there is
no information available in the data. This implies that assumptions have to be made, termed‘identifying restrictions’ (Little 1993). These assumptions are untestable since they refer to datathat are by definition unobserved. This implies that assumptions also intervene in the left handside of (5). The right hand side is a mixture of components that can be estimated from the data anda component g (y
1, y
2/1) for which no information is available and thus so is the left hand side.
The fit of models for n1, f (1/y
1, y
2) and g (y
1, y
2/2) can be assessed by classical goodness-of-fit
tools since they describe nothing but complete data. This is not possible for g (y2/y
1, 1). f (1/y
1, y
2)
describes both observed and unobserved data and thus its fit is only partially verifiable. Thus, iff (1/y
1, y
2) is determined from fitting the selection model in (1), the joint distribution of y
1, y
2and
R is determined and hence g (y1, y
2/1) can be recovered from the alternative pattern-mixture
models. This implies that estimating f (1/y1, y
2) implicitly imposes a form on g (y
1, y
2/1). There-
fore testing for MAR would imply that knowledge of g (y1, y
2/1) is needed. However, this
knowledge is not available. Similarly, fitting a pattern-mixture model in (2) we estimateg (y
1, y
2/2) and we have to assume a form for g (y
1, y
2/1) using a set of ‘identifying restrictions’.
Thus, in fitting a model, assumptions about the relationship of the missing data process and theunobserved data are made. These assumptions are fundamentally untestable.
Let us consider the following example: the EORTC QLQ-C30 includes the question ‘Are youlimited in any way in doing either your work or doing household jobs?’ with possible response
IDENTIFYING THE TYPES OF MISSINGNESS IN QOL DATA 751
( 1998 John Wiley & Sons, Ltd. Statist. Med., 17, 739—756 (1998)

Table IX. Cross-tabulation of QOL scores by dropoutpattern (QLQ-C30 question)
R"2
½2
½1
No Yes
No 12 7Yes 8 19
R"1
½2
½1
Missing
No 3Yes 5
Table X. Predicted counts for the MAR and MNAR models,respectively (QLQ-C30 question)
MAR
½2
½1
No Yes
No 1)89 1)11Yes 1)48 3)52
MNAR
½2
½1
No Yes
No 1)53 1)47Yes 1)02 3)98
categories ‘no’ and ‘yes’. Suppose the QLQ-C30 was assessed at baseline (y1) and post-treatment
(y2). In total, 54 patients are included in the study. Forty-six patients have assessments at both
time points while the remaining eight patients have completed only the first questionnaires. Theresults are presented in Table IX.
Factorizing the joint distribution of y1, y
2and r and fitting a logistic model for the missing data
mechanism yields
f (y1, y
2, r"1)"f (y
1, y
2)
e(b0#b
1y1#b
2y2)
1#e(b0#b
1y1#b
2y2) .
We consider two particular cases: b2"0 (MAR) and b
1"0 (MNAR). Such restrictions are
necessary to ensure a unique solution. Both models are saturated in the sense that the predictedcounts coincide with the observed data. The predicted counts for both the MAR and MNARmodels are given in Table X. Although differences are small in this case, there is no formal way todiscriminate between the two models in terms of observed data.
Little suggests that underidentifiability is a serious problem with non-ignorable missing datamodels.17 There may be a problem in estimating the parameters of the missing data mechanismsimultaneously with the parameters of the complete data model. Molenberghs et al.25 gaveexamples where models provided almost similar fits to the observed data, but yielded completelydifferent predictions for the unobserved data.
DISCUSSION
Solving the problems of incomplete QOL data can be viewed from two very important com-plementary perspectives:
(i) improving collaboration and thus reducing the amount of missingness;(ii) improving methods for statistical analysis of incomplete data.
752 D. CURRAN E¹ A¸.
Statist. Med., 17, 739—756 (1998) ( 1998 John Wiley & Sons, Ltd.
Every effort should be made during the time of study design and management of the study toreduce the amount of missingness. However, even with the most sophisticated infrastructure anddata collection procedures the problem of incomplete data will remain. Therefore, statisticaltechniques need to be developed to facilitate the analysis of incomplete QOL data.
Two approaches of identifying the types of missing data in QOL research have been discussed:(i) collecting information on why the QOL questionnaires were not completed, and (ii) hypothesestesting of the missing data process. Both have their intrinsic difficulties. For example, in the firstapproach it may be difficult to collect information on the clinical CRF’s on why questionnairesare missing. Often clinical CRF’s are completed retrospectively by retrieving data from thepatient’s medical chart. If the information is not recorded in the patient’s chart then it may beirretrievable. In addition, the person responsible for completing the clinical CRF’s is seldomresponsible for administering the QOL questionnaire. Some cancer research organizationsinclude a cover sheet with the QOL questionnaire which includes questions requesting thereasons for missing questionnaires. However, if the patient does not complete the QOL question-naire due to inadequate administrative procedures in the hospital then it is likely that the coversheet will not be completed either.
Two methods for testing between MCAR and MAR have been implemented. The firstmethod, based on a logistic regression analysis, was applied in the setting of post-menopausaladvanced breast cancer where the efficacy of two second line hormonal treatments werecompared. The focus was on the perceived adjustment to chronic illness scale (PACIS). Inthis advanced disease setting where the focus was on a health related scale, the hypothesisof MCAR was rejected, that is, the probability of dropout was dependent on the previousQOL score. The second method, based on an adaptation of WLS, was applied in an adjuvantsetting in patients with operable breast cancer. The focus was on anxiety and burden related tohair loss. In this setting, more anxiety was observed in patients with incomplete data and thusmissingness was related to the anxiety score, that is, data were not likely to be MCAR. However,for the burden of hair loss scale no significant difference was observed between completers andnon-completers, indicating that the hypothesis of MCAR could not be rejected. Thus, one wouldconclude that the missing data mechanism may depend on the scale under investigation. It isimportant to check the assumptions about missingness on the scale level, since on a questionnairelevel there could be more than one coexisting missing data process. The missing data process mayalso vary between disease settings. For example, it may be more likely that missing data areMCAR or MAR in adjuvant settings whereas in advanced diseases the missing data may often beMAR or MNAR.
Heitjan and Basu15 investigated the consequences of misspecifying the missing data mecha-nism. They demonstrated that MCAR and MAR have distinct consequences for data analysis.Distinguishing between the missing data mechanisms is necessary to determine which types ofanalysis are appropriate. For example, in the situation where data is not MCAR, analyses such ascomplete case analyses may be biased. In addition, graphical presentations of summary statistics(for example, means or proportions) of available cases over time may be misleading since scores atlater time periods may be seriously biased. In the logistic regression example the change scorebetween the two previous assessments was predictive of drop out indicating that patients witha decreasing score were more likely to drop out. Thus, in this example imputation methods suchas last value carried forward are not suitable.
Both the logistic regression and PD approaches are based on modelling the missing datamechanism and may be sensitive to the model specification. They are both easy to apply in
IDENTIFYING THE TYPES OF MISSINGNESS IN QOL DATA 753
( 1998 John Wiley & Sons, Ltd. Statist. Med., 17, 739—756 (1998)

practice with existing software. The logistic regression is more suitable if the primary objectiveof the analysis is to investigate the dropout mechanism (for example, dropout or not as in thefirst example). The PD approach allows one to test if the ‘completers’ are different from the‘non-completers’. The PD approach requires at least moderately large samples for each stratum,and thus a two-strata approach, which in fact also requires moderate to large sample sizes, wasused.
In the PD approach the patient setting was represented by a ‘healthy’ patient populationscheduled to attend regular appointments for adjuvant chemotherapy administration or visitsduring adjuvant endocrine therapy. The patient group size and the observed high compliancemay not provide the ideal setting to test hypotheses about the missing data process. In addition,since power may be low, it is important to remember that accepting the H
0of homogeneity of
stratum-specific parameters does not imply its correctness.An alternative two-step WLS approach has been studied by Lipsitz et al.14 The first step
(estimates of multinomial probabilities) uses maximum likelihood. The second step (non-iterativeWLS) is the same as the PD. It has the advantage of not being model dependent, however, it mustbe carried out separately in each covariate stratum. They also provide a test for the nullhypothesis of MCAR versus the alternative of MAR. Stratification according to missing datapatterns has been considered also by Dawson (continuous outcome, stratification of summarystatistic tests).27 He found that stratification of the analysis tends to result in an increase of powerand improves the robustness to violations of missing data.
As was illustrated by Molenberghs et al.25 and Little17 the analysis of repeated measures withmissing data is not trivial. This is especially true in the analysis of QOL data where data may bemissing for several reasons. In the two examples provided above it was shown that in somesituations QOL data were unlikely to be MCAR. This is not surprising as in cancer clinical trials,especially in advanced disease, one would expect patients with a poorer health related QOL tocomplete fewer QOL questionaires because they are too ill or because they drop out of the studyearly. It has been shown that QOL at baseline may be of use as a prognostic factor for clinicaloutcomes, including survival28 and response to treatment,29 that is, patients with better QOLscores survive longer and have a higher probability of responding to treatment. Therefore missingQOL questionnaires at baseline deserves special attention.
Identifying whether data are MAR or MNAR is not trivial. If a sufficient amount of data iscollected relating to why QOL questionnaires have not been filled out, then one may be able todistinguish between the missing data mechanisms. In some cases it may be possible to determinethe QOL scores of a random sample of patients by using alternative modes of administrationsuch as telephone interview or by obtaining proxy scores from members of the patient’s family.
Molenberghs et al. showed that sensitivity to model specification may be a serious problem.25When fitting a model certain assumptions have to be made about the relationship of the missingdata process and the unobserved data. Since these assumptions are fundamentally untestable it isprudent to calculate estimates on a variety of models, rather than rely exclusively on one model,especially when the amount of missingness is considerable.
ACKNOWLEDGEMENTS
The authors would like to thank Heidi Gusset, data manager for SAKK Quality of LifeStudies, and Dr. Christoph Hurny for making the Psycho-immuno project data available forexample 2.
754 D. CURRAN E¹ A¸.
Statist. Med., 17, 739—756 (1998) ( 1998 John Wiley & Sons, Ltd.

REFERENCES
1. Zwinderman, A. H. ‘Statistical analysis of longitudinal quality of life data with missing measurements’,Quality of ¸ife Research, 1, 219—224 (1992).
2. Zee, B. and Pater, J. ‘Statistical analysis of trials assessing quality of life’, in Osoba, D. (ed.), Effects ofCancer on Quality of ¸ife, CRC Press, Florida, 1991.
3. Rubin, D. B. ‘Inference and missing data’, Biometrika, 63, 581—592 (1976).4. Troxel, A. B., Fairclough, D. L., Curran, D. and Hahn, E. A. ‘Statistical analysis of quality of life with
missing data in cancer clinical trials’, Statistics in Medicine, 17, 653—666 (1998).5. Curran, D., Molenberghs, G., Fayers, P. M. and Machin, D., on behalf of the EORTC quality of life
study group. ‘Incomplete quality of life data in randomized trials: missing forms’, Statistics in Medicine,17, 697—709 (1998).
6. Choi, S. and Lu, I. L. ‘Effect of non-random missing data mechanisms in clinical trials’, Statistics inMedicine, 14, 2675—2684 (1995).
7. Diggle, P. and Kenward, M. G. ‘Informative drop-out in longitudinal data analysis’, Applied Statistics,43, 49—93 (1994).
8. Molenberghs, G. and Kenward, M. G. ‘Calculating the appropriate information matrix for log-linearmodels when data are missing at random’, in (Gregoire, T. (ed.), ¸ecture Notes in Statistics, Proceedingsof the Nantucket conference on Modelling ¸ongitudinal and Spatially Correlated Data: Methods, Applica-tions, and Future Directions, Springer-Verlag, New York, 1997.
9. Liang, K. Y. and Zeger, S. L. ‘Longitudinal data analysis using generalized linear models’, Biometrika,73, 13—22 (1986).
10. Little, R. J. A. ‘A test of missing completely at random for multivariate data with missing values’, Journalof the American Statistical Association, 83, 1198—1202 (1988).
11. Diggle, P. J. ‘Testing for random dropouts in repeated measurements data’, Biometrics, 45, 1255—1258(1989).
12. Ridout, M. ‘Testing for random dropouts in repeated measurement data’, Biometrics, 47, 1617—1621(1991).
13. Park, T. and Davis, C. S. ‘A test of the missing data mechanism for repeated categorical data’, Biometrics,49, 631—638 (1993).
14. Lipsitz, S. R., Laird, N. M. and Harrington, D. P. ‘Weighted least square analysis of repeated categoricalmeasurements with outcomes subject to nonresponse’, Biometrics, 50, 11—24 (1994).
15. Heitjan D. F. and Basu S. ‘Distinguishing ‘‘missing at random’’ and ‘‘missing completely at random’’’,American Statistician, 50, 207—213 (1996).
16. Cox, D. R. Analysis of Binary Data, Chapman and Hall, London, 1970.17. Little, J. A. ‘Modeling the drop-out mechanism in repeated-measures studies’’, Journal of the American
Statistical Association, 90, 1112—1121 (1995).18. SAS Institute. SAS/S¹A¹ ºser’s Guide, SAS Institute Inc., North Carolina, 1989.19. Grizzle, J. E., Starmer, C. F. and Koch, G. G. ‘Analysis of categorical data by linear models’, Biometrics,
25, 489—504 (1969).20. Stanish, W. M., Gillings, D. B. and Kock, G. G. ‘An application of multivariate ratio methods for the
analysis of a longitudinal clinical trial with missing data’, Biometrics, 34, 305—317 (1978).21. Woolson, R. F. and Clarke, W. R. ‘Analysis of categorical incomplete longitudinal data’, Journal of the
Royal Statistical Society, Series A, 147, 87—99 (1984).22. Davis, C. S. ‘Analysis of incomplete categorical repeated measures’, in Proceedings of the 17th
Annual SAS ºsers Group International Conference, 1374—1379, North Carolina, SAS Institute Inc.,1992.
23. Sabbioni, M., Hurny, C., Bernhard, J., Castiglione, M., Siegrist, H. P., Bacchi, M., Thurlimann, B.,Bonnefoi, H., Perey, L. and Goldhirsch, A. ‘Interaction between psychosocial factors and immunity inbreast cancer patients’, Annals of Oncology, 7, 13—13 (1996).
24. Herschbach, P. and Henrich, G. ‘Probleme und Problem Bewaeltigung von Tumorpatienten in derstationaeren Nachsorge’, Psychotherapie, Psychosomatik, Medizinische Psychologie, 37, 185—192(1987).
25. Molenberghs, G., Goetghebeur, E. J. T. and Lipsitz, S. R. ‘Non-random missingness in categorical data:limitations’, American Statistician, (submitted).
IDENTIFYING THE TYPES OF MISSINGNESS IN QOL DATA 755
( 1998 John Wiley & Sons, Ltd. Statist. Med., 17, 739—756 (1998)

26. Glynn, R. J., Laird, N. M. and Rubin, D. B. ‘Selection modelling versus mixture modelling withnonignorable nonresponse’, in Wainer, H. (ed.), Drawing Inferences from Self Selected Samples, SpringerVerlag, New York, 1986, pp. 115—142.
27. Dawson, J. D. ‘Stratification of summary statistic tests according to missing data patterns’, Statistics inMedicine, 13, 1853—1863 (1994).
28. Coates, A., Thomson, D., McLeod, G. R. M., Hersey, P., Gill, P. G., Olver, I. N., Kefford, R., Lowenthal,R. M., Beadle, G. and Walpole, E. ‘Prognostic value of quality of life scores in a trial of chemotherapywith or without interferon in patients with metastatic malignant melanoma’, European Journal ofCancer, 9, 1731—1734 (1993).
29. Gralla, R. J., Hollen, P. J., Eberley, S. and Cox, C. ‘Quality of life score predicts both response andsurvival in patients receiving chemotherapy for non-small cell lung cancer’, Supportive Care Cancer, 3,378—379 (1995).
756 D. CURRAN E¹ A¸.
Statist. Med., 17, 739—756 (1998) ( 1998 John Wiley & Sons, Ltd.