ideom identification and evaluation of metabolomics - mzmatch
TRANSCRIPT
1
IDEOM
IDentification and Evaluation of
Metabolomics data from LC-MS
Darren J. Creek
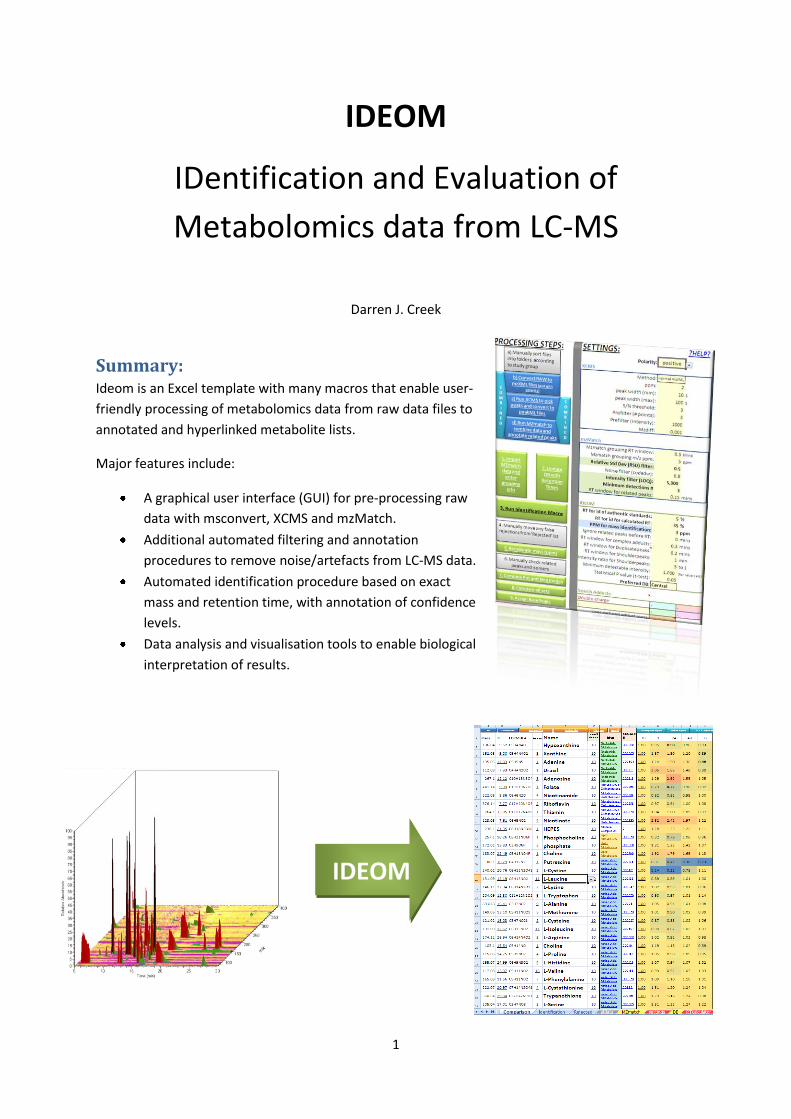
Summary: Ideom is an Excel template with many macros that enable user-
friendly processing of metabolomics data from raw data files to
annotated and hyperlinked metabolite lists.
Major features include:
A graphical user interface (GUI) for pre-processing raw
data with msconvert, XCMS and mzMatch.
Additional automated filtering and annotation
procedures to remove noise/artefacts from LC-MS data.
Automated identification procedure based on exact
mass and retention time, with annotation of confidence
levels.
Data analysis and visualisation tools to enable biological
interpretation of results.
IDEOM

2
Quick Start Guide:
Installation:
The Ideom template doesn’t require any installation, and can be loaded directly in a recent
version of Microsoft Excel (2007 or 2010). (or Excel for Mac 2011)
For full functionality users require a current installation of R (www.r-project.org) and
proteowizard tools (http://proteowizard.sourceforge.net/downloads.shtml).
Hyperlinks to Xcalibur (Thermo) and web browsers are included, however these programs
are not required for successful implementation of Ideom.
Getting Started: i. Open the Ideom.xlsb file in MS Excel and ‘Save As’ with your study name (e.g. mystudy1.xlsb)
ii. Enable Macros by clicking the ‘Options’ button in the ‘Security Warning’ ribbon. Select
‘Enable this content’. Click OK.
iii. (First time only) Install all required R packages by clicking the appropriate blue button in the
help section at the bottom of the page. (You may need to scroll down to row 57 to find this).
The blue buttons execute functions in R (not within Excel), you may be prompted to select
the ‘Rgui.exe’ file on your computer. Please agree to any Windows security warnings.
iv. All settings for XCMS, mzMatch and Ideom processing are located in column E.
v. (optional) Up to 10 internal/external standards may be entered into cells U2:AD2.
vi. (optional) Red sheets contain advanced settings and databases
3
Automated Data Processing
- All automated data processing steps can be executed by clicking the blue and green buttons
in columns A and B of the settings sheet.
- Parameters can be optimised by adjusting the values in column E before running macros.
Data Processing from raw LC-MS files - Ideom provides a graphical user interface to allow processing of raw files by other
command-line based open source software: msconvert (proteowizard.sourceforge.net),
xcms (metlin.scripps.edu/xcms) and mzmatch.R (mzmatch.sourceforge.net).
- Before processing it is recommended (though not essential) to sort raw (or mzxml) files into
folders that classify samples according to study group (e.g. controls, treatments, blanks, etc).
- Commence processing by clicking the blue buttons for steps (b), (c) and (d), skip step (b) if
using mzXML files. To avoid errors it is recommended to use the ‘combined’ buttons to
automatically execute these steps sequentially. Some of these steps may be time-consuming
and desktop PC’s usually complete these steps overnight. An “mzmatch_output.peakml” and
“mzmatchoutput.txt” file should be generated after completion of these steps.
- The R script for the processing method is saved as a text file in your Ideom folder. This allows
advanced users to process the raw files on a more powerful computer (for large studies), or
to include/adjust specific features within XCMS or mzmatch.R if required.
Data Processing from peak lists (mzmatch output) 1. Import mzMatch (or mzmine) peak list by clicking step 1 (green button) and follow prompts.
2. Click step 2: Updates metabolite database with retention times based on observed standard
retention times. Standard retention times can be imported from another Excel file, or
generated by the Ideom functions on the ‘Targeted’ sheet(s).
3. Click step 3: Runs Ideom filtering and identification macros.
4. (optional): Manually check the ‘rejected’ sheet for false-rejections of known compounds.
5. Click step 5: Recalibrates mass based on putative identifications.
6. (optional): Use the information summarised on the ‘Identification’ sheet to manually remove
false-identifications.
7. (optional): For Orbitrap Exactive (Thermo) data process both positive and negative modes
separately (steps 1-6), then Click step 7 to combine the data.
8. Click step 8: Summarises metabolite levels relative to the ‘control’ group. The ‘control’ group
may be changed before running this step if required. Use data on the ‘Comparison’ sheet to
directly evaluate metabolomics data and to export to statistical/biochemical websites.
9. (optional) Click step 9 to update the Base-peaks list to attempt to identify unknown peaks
that may be of interest.

4
IDEOM HELP, TUTORIAL AND DOCUMENTATION
Summary: ................................................................................................................................................ 1
Quick Start Guide: ................................................................................................................................... 2
Installation: ......................................................................................................................................... 2
Getting Started:................................................................................................................................... 2
Automated Data Processing ............................................................................................................... 3
Data Processing from raw LC-MS files ................................................................................................ 3
Data Processing from peak lists (mzmatch output) ............................................................................ 3
General Information ............................................................................................................................... 6
Processing steps ...................................................................................................................................... 7
Raw data processing ........................................................................................................................... 7
a) Manually sort files into folders according to study group .......................................................... 7
b) Convert RAW to mzXML files and split polarity .......................................................................... 7
c) Run XCMS (and mzmatch) to pick peaks and convert to peakML files ....................................... 8
d) Run MZmatch to combine data and annotate related peaks ..................................................... 8
Ideom processing .............................................................................................................................. 10
1. Import MZmatch data and enter grouping info ........................................................................ 10
2. Update DB with Retention Times .............................................................................................. 11
3. Run Identification Macro .......................................................................................................... 12
4. Manually move any false rejections from 'Rejected' list to 'Identification' list (optional) ....... 14
5. Recalibrate mass (ppm) ............................................................................................................ 14
6. Manually check related peaks and isomers (optional) ............................................................. 15
7. Combine Pos and Neg modes (optional) .................................................................................. 16
8. Compare all sets ........................................................................................................................ 16
9. Assign BasePeaks (optional) ...................................................................................................... 17
Other Tools ........................................................................................................................................... 18
Targeted Analysis .............................................................................................................................. 18
Isotope search ................................................................................................................................... 18
Annotate DB ...................................................................................................................................... 19
Alternative peak list import options ................................................................................................. 19
Trim File Size ..................................................................................................................................... 19
zFormulagenerator ........................................................................................................................... 20

5
Xcaliburlink ........................................................................................................................................ 20
Excel Functions .................................................................................................................................. 21
Exact Mass: ................................................................................................................................... 21
Mass error (ppm) calculation: ....................................................................................................... 21
Formula match from exact mass: ................................................................................................. 21
Formula validity check: ................................................................................................................. 21
Theoretical Isotope Abundance Calculator: .................................................................................. 21
Positive charge (average): ............................................................................................................. 22
Negative charge (average): ........................................................................................................... 22
Definitions ............................................................................................................................................. 23
Set Types (Groups) ............................................................................................................................ 23
Column definitions for results sheets ............................................................................................... 24
Description of columns in Identification, Rejected, Alldata and allBasepeaks sheets ................. 24
Description of columns in Comparison sheet ............................................................................... 25
Hyperlinks and shortcuts from results sheets .................................................................................. 26
Shortcuts by double-clicking in columns of Results sheets (Identification, Rejected,
allBasepeaks) ................................................................................................................................. 26
Additional shortcut for Rejected sheet ......................................................................................... 26
Shortcuts by clicking in columns of Comparison sheet ................................................................. 26
Tutorial Videos ...................................................................................................................................... 26
Frequently Asked Questions (FAQ’S) .................................................................................................... 27
I have a list of metabolites... how do I interpret this data? .......................................................... 27
How is metabolite identification confirmed?: .............................................................................. 27
What test should I use to find the most significant metabolites? ................................................ 27
Many of my expected metabolites are being rejected? ............................................................... 28
R scripts don't run on my computer ............................................................................................. 28
How do you deal with Polarity?: ................................................................................................... 28
Which file to use for the retention time updater? ....................................................................... 28
It runs slowly? ............................................................................................................................... 29
TROUBLESHOOTING .............................................................................................................................. 31
Known bugs: .................................................................................................................................. 31
mzMatch and R help ..................................................................................................................... 31
Contact details .............................................................................................................................. 31
Appendix A: Evaluating Metabolomics Data with Ideom ..................................................................... 33

6
General Information Save the template with a new filename when starting to process data (Ensure you save it as
a macro-enabled workbook. ‘.xlsb’ Excel binary format is recommended). It is recommended
to save the file before running each step.
Macros are activated by clicking the coloured buttons.
In-cell hyperlinks in Excel are activated by double-click. (weblinks by single-click).
The Ideom template includes a number of Excel ‘sheets’
Most functions are on the Settings, Identification and Comparison sheets:
o Settings: is the home page and the starting point for all analysis. It contains many
basic settings, help documentation and the main macro buttons for processing data.
Default settings are suitable for 4.6 mm ZIC-HILIC chromatography (with formic
acid/ACN/H2O, 0.3 mL/min) coupled to the Exactive Orbitrap.
o MZmatch: is a blank sheet to allow import of the peak list from mzMatch (or other)
o Results sheets are initially empty, but will be written with data and annotations
during step 3 (Identification Macro). Results sheets include:
Alldata: Information about every peak set in the peak list is written to this
sheet
Rejected: Peak sets with putative identification, but confidence below 5, are
copied to this sheet. Most of these peaks are noise or artefacts, but users
may wish to scan them manually for false rejections.
Identification: All identified metabolites with confidence of 5 or above are
copied to this sheet.
allBasepeaks: All Base Peaks (from mzMatch related peaks function) are
copied to this sheet unless the peaks are not significant in any group (less
than blank).
Comparison: Comparative peak intensity data is placed here after running
the ‘Compare all sets’ macro. Many functions for evaluation and
visualisation are available on this sheet.
o DB: contains the full metabolite database and associated metadata. If required,
additional metabolites may be added to the bottom of the list, or additional
property columns to the right of existing columns. Additional information may also
be added to existing columns, but do not insert new columns between existing data.
o RTcalculator and Fragments: contain important tables of information required for
the Ideom macros. Advanced users may wish to update these tables with
instrument-specific values.
o Targeted: allows a targeted analysis of specific metabolites
o Tools: demonstrates the utilisation of Ideom’s user-defined Excel functions
o Method and Samples: Extra sheets to allow you to upload experiment metadata

7
Processing steps
Raw data processing
a) Manually sort files into folders according to study group
- Please use Windows Explorer ('My Computer') to create folders for each group of replicates in your study (eg. WT, RES, KO, BLANK, QC, etc), and move relevant raw files into these folders
- ** If using ReAdW to convert, you will need to sort out the mzXML files again after step B in order to keep positive and negative mode files in separate folders
- ** You may skip this step and process all files without grouping, but if you want mzmatch to group and/or run RSDfilter you will need to put the peakml files into these folders before running step (d)
- ** Avoid spaces in folders and filenames... R will make a mess of them - good idea to re-name any folders that have spaces in the name. Underscore is OK, for example; use “IDEOM_trial” rather than “IDEOM trial”. Don’t work in folders within “My Documents” or “Program Files”.
b) Convert RAW to mzXML files and split polarity
- Run step (b) (click blue button) if you are dealing with raw files. (Skip this step if you already have mzxml files.)
- This step uses msconvert or ReAdW (through R) to convert raw LC-MS files to the .mzXML format. Msconvert is preferred.
- The location of either msconvert.exe or ReAdW.exe on your computer needs to be assigned, and can be stored in cell E43.
- **msconvert.exe needs to be in the same folder as the Pwiz dll files (keep all Pwiz files together). ReAdW requires zlib1.dll to be in your windows directory to work correctly
- The split polarity option for ReAdW uses the mzMatch split function to separate Exactive files that contain both positive and negative polarity. See mzmatch help for further information
- If Waters raw files fail to convert, try removing the ‘ionisation mode’ filter from the script (otherwise use masswolf)
- TIC CHECKER: Available in the R script menu at the bottom of the page allows users to run this additional script in R. It is not essential, but lets you check signal reproducibility of the mzXML files. (Provided by Gavin Blackburn)
8
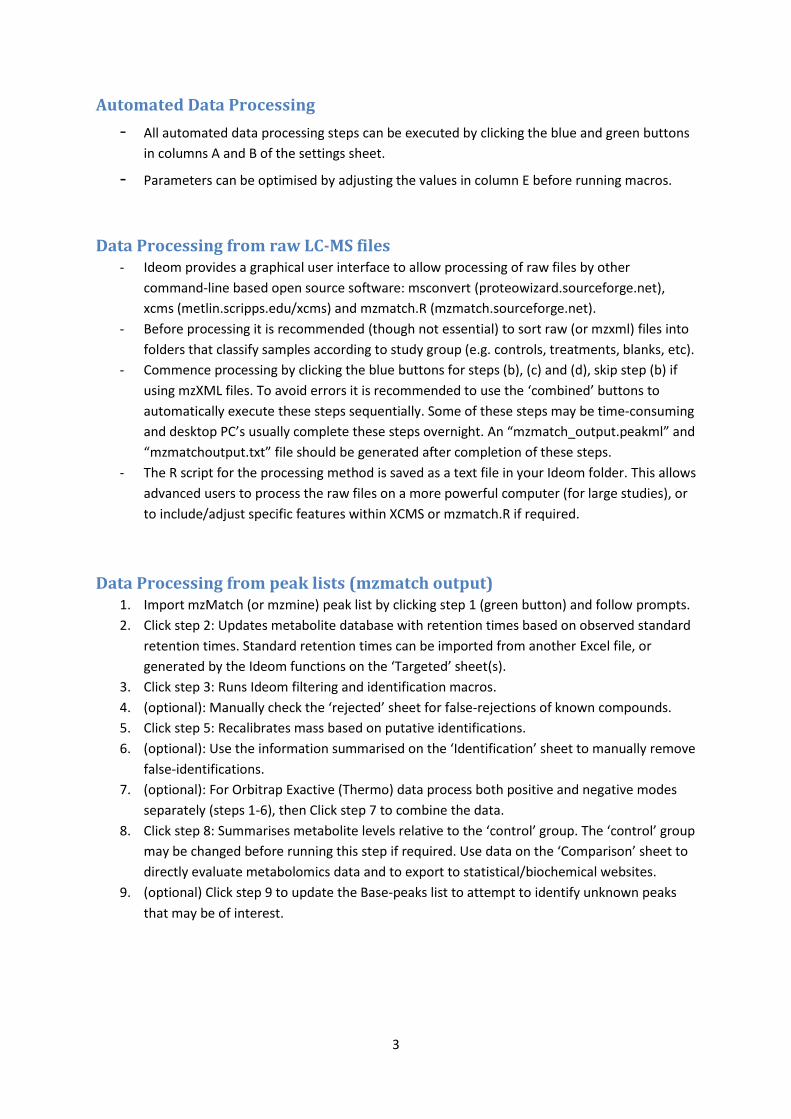
c) Run XCMS (and mzmatch) to pick peaks and convert to peakML files
- This step uses the Centwave function in xcms (through R) to pick peaks, then mzmatch converts each individual file to peakml format
- Settings for the Centwave function can be changed in cells E4-E11 of the Settings sheet - for full documentation see xcms help (metlin.scripps.edu/xcms). Briefly, parameters are:
o PPM: mass deviation from scan to scan
o Peakwidth: range for baseline peakwidth
o S/N threshold: Signal to Noise ratio o Prefilter: number of scans greater
than a given intensity threshold
- To process negative files that were converted with ReAdW you need to use the 'mzData
alternate' method (cell E4), which first converts mzXML to mzData format before processing. This method is much more memory intensive and if you have more than 20 files you may need to process it in parts, or transfer to a server for processing. (Hence msconvert is preferred for conversion of raw files).
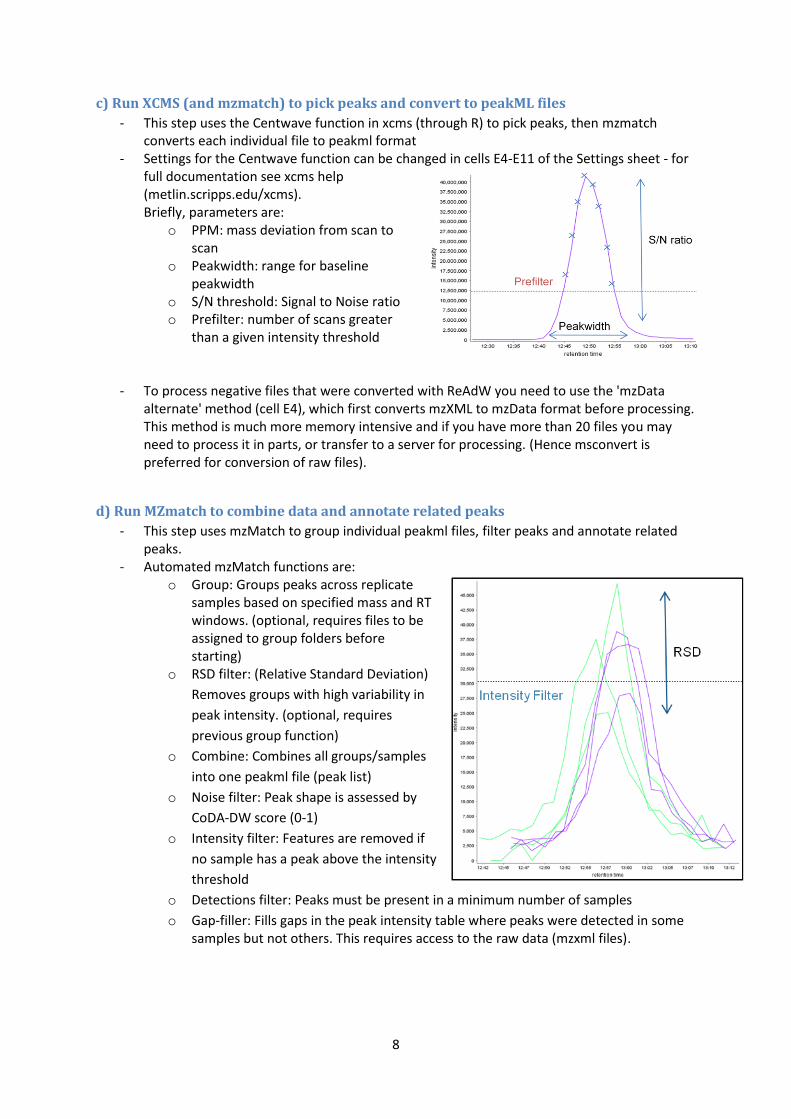
d) Run MZmatch to combine data and annotate related peaks
- This step uses mzMatch to group individual peakml files, filter peaks and annotate related peaks.
- Automated mzMatch functions are: o Group: Groups peaks across replicate
samples based on specified mass and RT windows. (optional, requires files to be assigned to group folders before starting)
o RSD filter: (Relative Standard Deviation)
Removes groups with high variability in
peak intensity. (optional, requires
previous group function)
o Combine: Combines all groups/samples
into one peakml file (peak list)
o Noise filter: Peak shape is assessed by
CoDA-DW score (0-1)
o Intensity filter: Features are removed if
no sample has a peak above the intensity
threshold
o Detections filter: Peaks must be present in a minimum number of samples
o Gap-filler: Fills gaps in the peak intensity table where peaks were detected in some samples but not others. This requires access to the raw data (mzxml files).
9
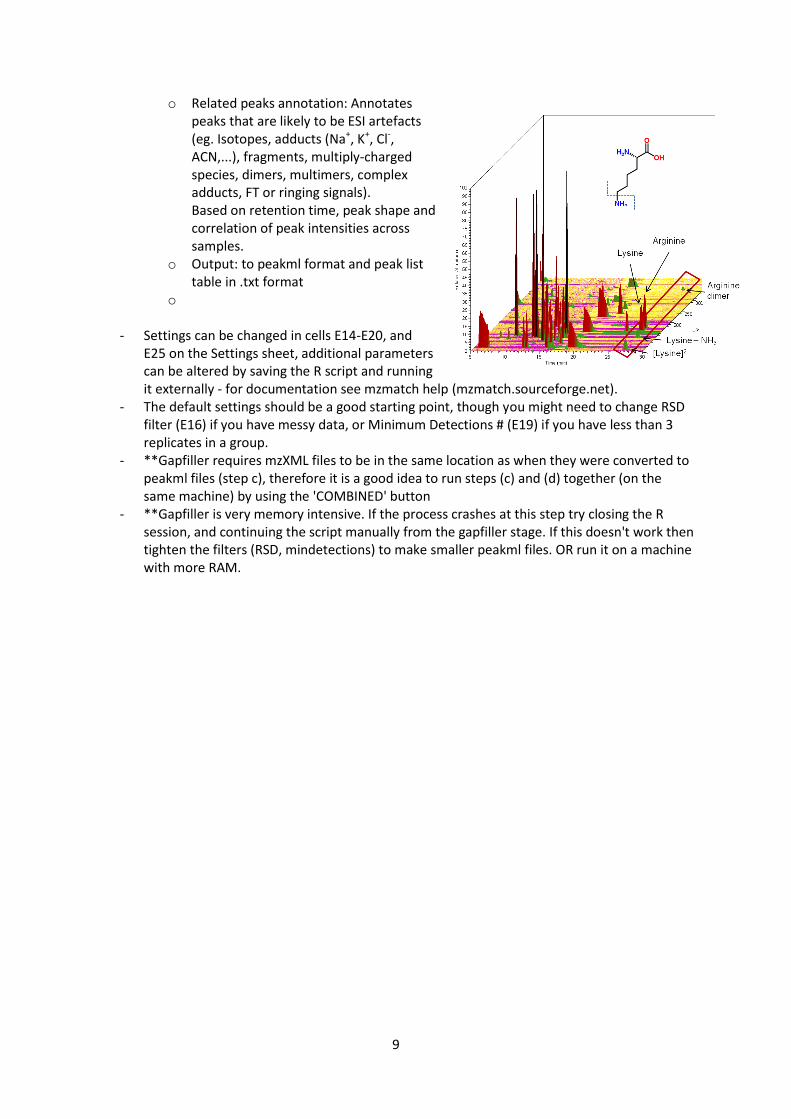
o Related peaks annotation: Annotates peaks that are likely to be ESI artefacts (eg. Isotopes, adducts (Na+, K+, Cl-, ACN,...), fragments, multiply-charged species, dimers, multimers, complex adducts, FT or ringing signals). Based on retention time, peak shape and correlation of peak intensities across samples.
o Output: to peakml format and peak list table in .txt format
o
- Settings can be changed in cells E14-E20, and E25 on the Settings sheet, additional parameters can be altered by saving the R script and running it externally - for documentation see mzmatch help (mzmatch.sourceforge.net).
- The default settings should be a good starting point, though you might need to change RSD filter (E16) if you have messy data, or Minimum Detections # (E19) if you have less than 3 replicates in a group.
- **Gapfiller requires mzXML files to be in the same location as when they were converted to peakml files (step c), therefore it is a good idea to run steps (c) and (d) together (on the same machine) by using the 'COMBINED' button
- **Gapfiller is very memory intensive. If the process crashes at this step try closing the R session, and continuing the script manually from the gapfiller stage. If this doesn't work then tighten the filters (RSD, mindetections) to make smaller peakml files. OR run it on a machine with more RAM.

10
Ideom processing
Whilst most Ideom processing is automated, some study-specific input is required from the user. Optimal results are achieved by clicking steps 1-9 (green buttons) and following the on-screen prompts.
Steps 1 and 2 can be run in any order, but must both be completed before running the main processing macro (step 3).
1. Import MZmatch data and enter grouping info
- Use this function to import data from the mzMatchoutput.txt file produced by mzMatch. If you have already entered data manually, or by the 'import example data' or 'import Mzmine data' buttons, you may press cancel at the import file screen to skip this step.
- The second part of this function asks the user to enter grouping information. 'autofill' can be used if the prefix of the sample names refers to the grouping, otherwise manually select groups using the 'add' buttons.
- Set-Type needs to be selected for each group using the drop-down lists: always set one group as 'Treatment' and another as 'Control' to allow comparisons
- If you have more than 15 groups there is a second tab with space for 15 more groups.
- Ideom currently supports a maximum of 30 groups

11
- The third part of this function plots average sample intensities to allow a quick check of whether the data is consistent. Internal (external) standards will also be plotted if you have entered them in U2-AD2 of the settings sheet
- The fourth part gives the option of normalising the data either by TIC, median, or user-defined values (column R on settings sheet). Normalisation is not routinely recommended for LC-MS data due to non-linear responses and the unpredictability of ion-suppression.
- If you subsequently decide to normalise the data, you may re-run the whole step 1 any time before running step 3 (Identification Macro).
- ** mzMatch output data needs to have replicates in adjacent columns. Please adjust this (by changing column order in the txt file) prior to import. This should automatically happen if your samples are labelled by group, and/or you used the mzMatch grouping function.
2. Update DB with Retention Times
- This function enters standard retention times into the database (DB sheet), and (optional) enters predicted retention times for other metabolites.
- A list of retention times from authentic standards is required (create this list either using the Targeted Sheet, or externally using Toxid, Xcalibur or similar)
- The list of standard RTs may be either imported from any excel readable file, or entered directly into columns A and B on the 'RTcalculator' sheet
- If importing .csv files of retention times: "_" in metabolite names will be replaced with "," - All authentic standards (column A) must have names that exactly match those in the DB
sheet. - RT calculator uses physico-chemical properties in the DB sheet to predict retention times
based on a multiple linear regression model with the authentic standards. (QSPR approach)
- You have the opportunity to check the model fit before annotating all metabolites in the database.
- If there is no good prediction model you can still use this function to upload standard retention times for those metabolites where you have authentic standards.
- Rtcalculator sheet: The column (cell O8) and dead volume (mins) should be entered before running this macro (cell O9). Other data in columns N-U show the accuracy of the current RT prediction model.
- Rtcalculator sheet: The mass range for application of the prediction model is defined in cells O10 and Q10. The default model is accurate for the Formic Acid:ZIC-HILIC method from MW 70-400
- Rtcalculator sheet: Columns W:X allow standard retention times to be uploaded to the database without being included in the prediction model. (e.g. for large metabolites outside the validated mass range)
12
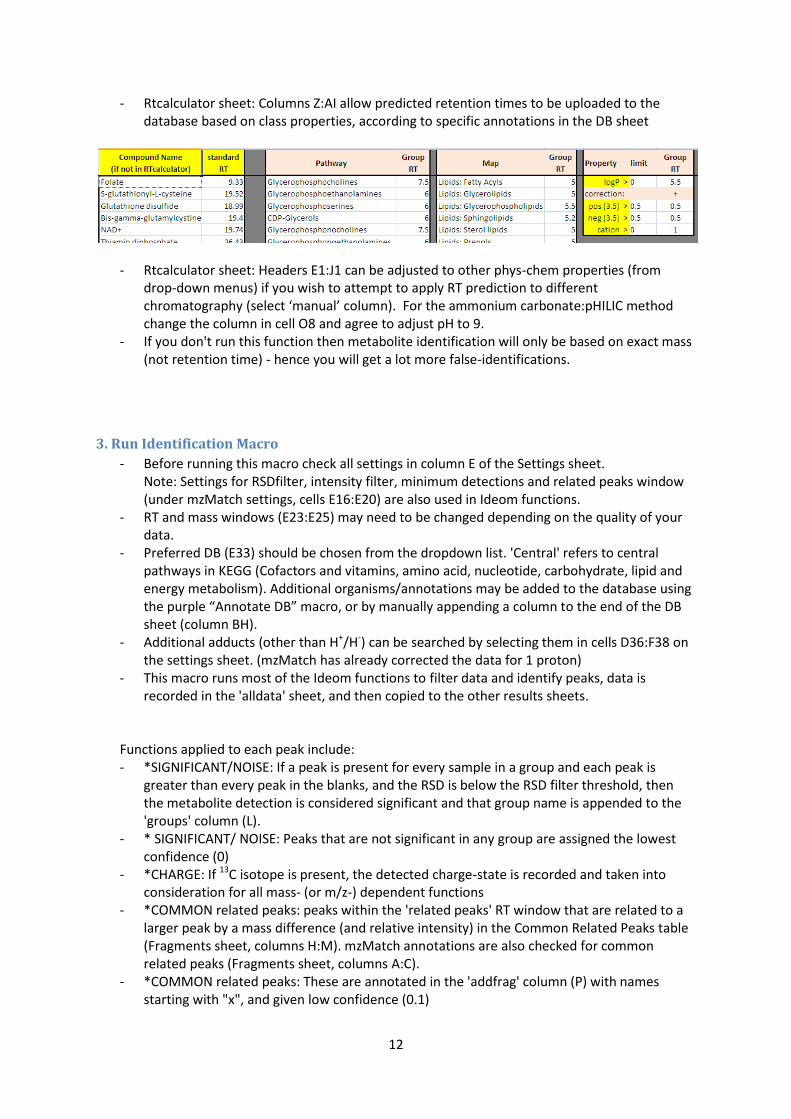
- Rtcalculator sheet: Columns Z:AI allow predicted retention times to be uploaded to the database based on class properties, according to specific annotations in the DB sheet
- Rtcalculator sheet: Headers E1:J1 can be adjusted to other phys-chem properties (from drop-down menus) if you wish to attempt to apply RT prediction to different chromatography (select ‘manual’ column). For the ammonium carbonate:pHILIC method change the column in cell O8 and agree to adjust pH to 9.
- If you don't run this function then metabolite identification will only be based on exact mass (not retention time) - hence you will get a lot more false-identifications.
3. Run Identification Macro
- Before running this macro check all settings in column E of the Settings sheet. Note: Settings for RSDfilter, intensity filter, minimum detections and related peaks window (under mzMatch settings, cells E16:E20) are also used in Ideom functions.
- RT and mass windows (E23:E25) may need to be changed depending on the quality of your data.
- Preferred DB (E33) should be chosen from the dropdown list. 'Central' refers to central pathways in KEGG (Cofactors and vitamins, amino acid, nucleotide, carbohydrate, lipid and energy metabolism). Additional organisms/annotations may be added to the database using the purple “Annotate DB” macro, or by manually appending a column to the end of the DB sheet (column BH).
- Additional adducts (other than H+/H-) can be searched by selecting them in cells D36:F38 on the settings sheet. (mzMatch has already corrected the data for 1 proton)
- This macro runs most of the Ideom functions to filter data and identify peaks, data is recorded in the 'alldata' sheet, and then copied to the other results sheets.
Functions applied to each peak include: - *SIGNIFICANT/NOISE: If a peak is present for every sample in a group and each peak is
greater than every peak in the blanks, and the RSD is below the RSD filter threshold, then the metabolite detection is considered significant and that group name is appended to the 'groups' column (L).
- * SIGNIFICANT/ NOISE: Peaks that are not significant in any group are assigned the lowest confidence (0)
- *CHARGE: If 13C isotope is present, the detected charge-state is recorded and taken into consideration for all mass- (or m/z-) dependent functions
- *COMMON related peaks: peaks within the 'related peaks' RT window that are related to a larger peak by a mass difference (and relative intensity) in the Common Related Peaks table (Fragments sheet, columns H:M). mzMatch annotations are also checked for common related peaks (Fragments sheet, columns A:C).
- *COMMON related peaks: These are annotated in the 'addfrag' column (P) with names starting with "x", and given low confidence (0.1)
13
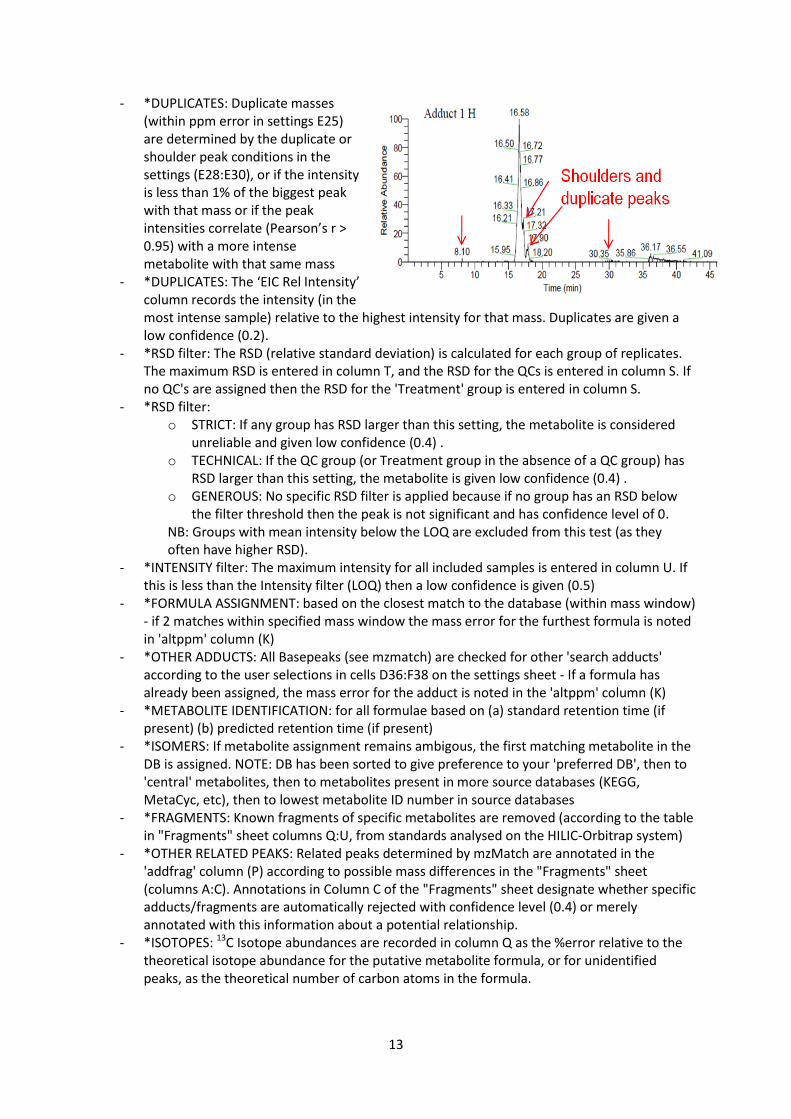
- *DUPLICATES: Duplicate masses (within ppm error in settings E25) are determined by the duplicate or shoulder peak conditions in the settings (E28:E30), or if the intensity is less than 1% of the biggest peak with that mass or if the peak intensities correlate (Pearson’s r > 0.95) with a more intense metabolite with that same mass
- *DUPLICATES: The ‘EIC Rel Intensity’ column records the intensity (in the most intense sample) relative to the highest intensity for that mass. Duplicates are given a low confidence (0.2).
- *RSD filter: The RSD (relative standard deviation) is calculated for each group of replicates. The maximum RSD is entered in column T, and the RSD for the QCs is entered in column S. If no QC's are assigned then the RSD for the 'Treatment' group is entered in column S.
- *RSD filter: o STRICT: If any group has RSD larger than this setting, the metabolite is considered
unreliable and given low confidence (0.4) . o TECHNICAL: If the QC group (or Treatment group in the absence of a QC group) has
RSD larger than this setting, the metabolite is given low confidence (0.4) . o GENEROUS: No specific RSD filter is applied because if no group has an RSD below
the filter threshold then the peak is not significant and has confidence level of 0. NB: Groups with mean intensity below the LOQ are excluded from this test (as they often have higher RSD).
- *INTENSITY filter: The maximum intensity for all included samples is entered in column U. If this is less than the Intensity filter (LOQ) then a low confidence is given (0.5)
- *FORMULA ASSIGNMENT: based on the closest match to the database (within mass window) - if 2 matches within specified mass window the mass error for the furthest formula is noted in 'altppm' column (K)
- *OTHER ADDUCTS: All Basepeaks (see mzmatch) are checked for other 'search adducts' according to the user selections in cells D36:F38 on the settings sheet - If a formula has already been assigned, the mass error for the adduct is noted in the 'altppm' column (K)
- *METABOLITE IDENTIFICATION: for all formulae based on (a) standard retention time (if present) (b) predicted retention time (if present)
- *ISOMERS: If metabolite assignment remains ambigous, the first matching metabolite in the DB is assigned. NOTE: DB has been sorted to give preference to your 'preferred DB', then to 'central' metabolites, then to metabolites present in more source databases (KEGG, MetaCyc, etc), then to lowest metabolite ID number in source databases
- *FRAGMENTS: Known fragments of specific metabolites are removed (according to the table in "Fragments" sheet columns Q:U, from standards analysed on the HILIC-Orbitrap system)
- *OTHER RELATED PEAKS: Related peaks determined by mzMatch are annotated in the 'addfrag' column (P) according to possible mass differences in the "Fragments" sheet (columns A:C). Annotations in Column C of the "Fragments" sheet designate whether specific adducts/fragments are automatically rejected with confidence level (0.4) or merely annotated with this information about a potential relationship.
- *ISOTOPES: 13C Isotope abundances are recorded in column Q as the %error relative to the theoretical isotope abundance for the putative metabolite formula, or for unidentified peaks, as the theoretical number of carbon atoms in the formula.
14
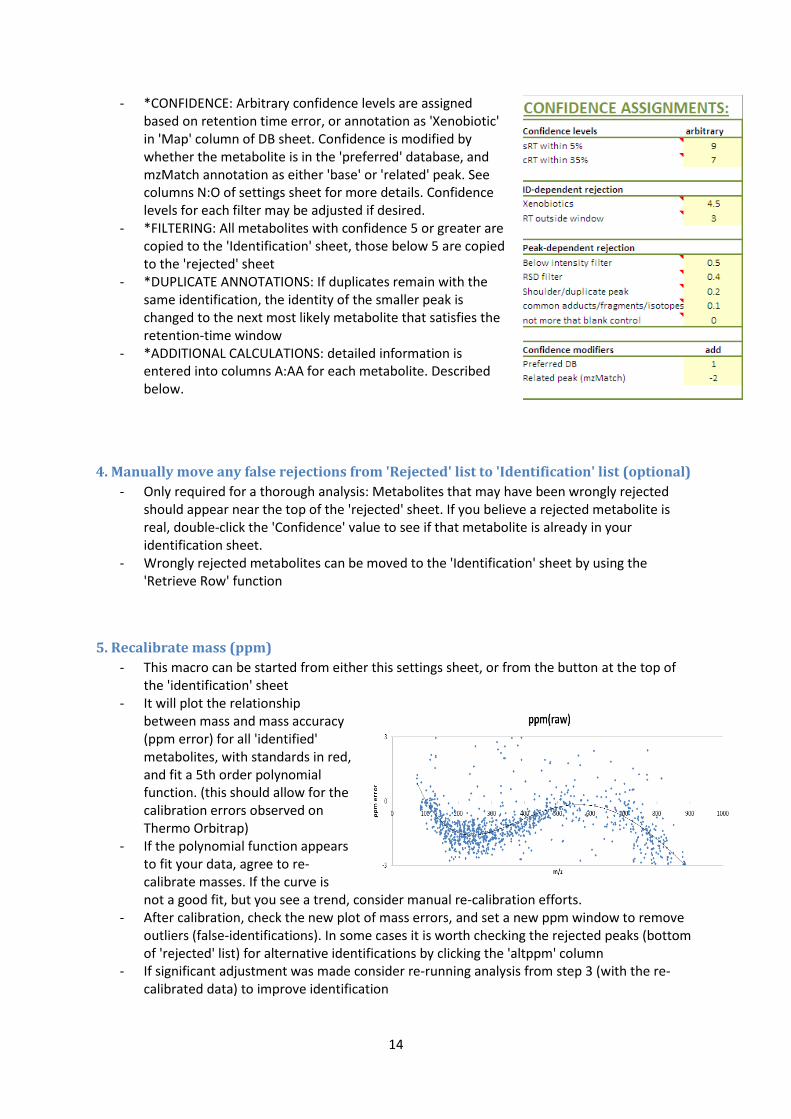
- *CONFIDENCE: Arbitrary confidence levels are assigned based on retention time error, or annotation as 'Xenobiotic' in 'Map' column of DB sheet. Confidence is modified by whether the metabolite is in the 'preferred' database, and mzMatch annotation as either 'base' or 'related' peak. See columns N:O of settings sheet for more details. Confidence levels for each filter may be adjusted if desired.
- *FILTERING: All metabolites with confidence 5 or greater are copied to the 'Identification' sheet, those below 5 are copied to the 'rejected' sheet
- *DUPLICATE ANNOTATIONS: If duplicates remain with the same identification, the identity of the smaller peak is changed to the next most likely metabolite that satisfies the retention-time window
- *ADDITIONAL CALCULATIONS: detailed information is entered into columns A:AA for each metabolite. Described below.
4. Manually move any false rejections from 'Rejected' list to 'Identification' list (optional)
- Only required for a thorough analysis: Metabolites that may have been wrongly rejected should appear near the top of the 'rejected' sheet. If you believe a rejected metabolite is real, double-click the 'Confidence' value to see if that metabolite is already in your identification sheet.
- Wrongly rejected metabolites can be moved to the 'Identification' sheet by using the 'Retrieve Row' function
5. Recalibrate mass (ppm)
- This macro can be started from either this settings sheet, or from the button at the top of the 'identification' sheet
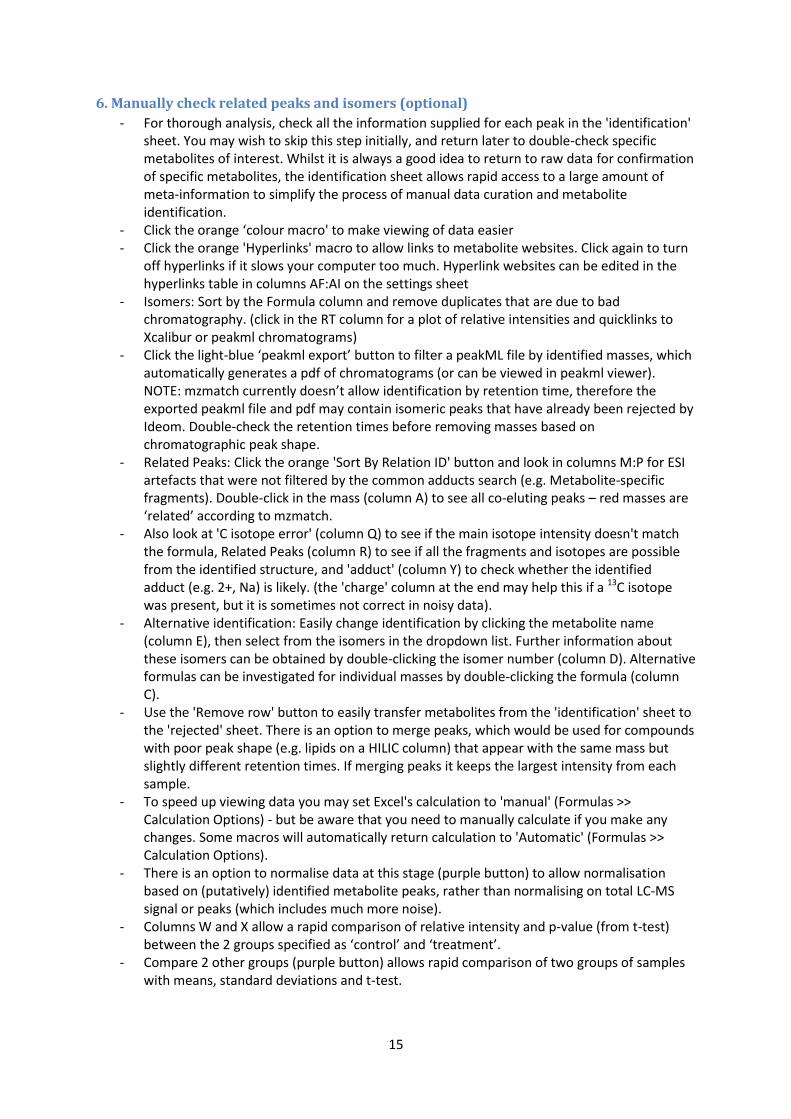
- It will plot the relationship between mass and mass accuracy (ppm error) for all 'identified' metabolites, with standards in red, and fit a 5th order polynomial function. (this should allow for the calibration errors observed on Thermo Orbitrap)
- If the polynomial function appears to fit your data, agree to re-calibrate masses. If the curve is not a good fit, but you see a trend, consider manual re-calibration efforts.
- After calibration, check the new plot of mass errors, and set a new ppm window to remove outliers (false-identifications). In some cases it is worth checking the rejected peaks (bottom of 'rejected' list) for alternative identifications by clicking the 'altppm' column
- If significant adjustment was made consider re-running analysis from step 3 (with the re-calibrated data) to improve identification
15
6. Manually check related peaks and isomers (optional)
- For thorough analysis, check all the information supplied for each peak in the 'identification' sheet. You may wish to skip this step initially, and return later to double-check specific metabolites of interest. Whilst it is always a good idea to return to raw data for confirmation of specific metabolites, the identification sheet allows rapid access to a large amount of meta-information to simplify the process of manual data curation and metabolite identification.
- Click the orange ‘colour macro' to make viewing of data easier - Click the orange 'Hyperlinks' macro to allow links to metabolite websites. Click again to turn
off hyperlinks if it slows your computer too much. Hyperlink websites can be edited in the hyperlinks table in columns AF:AI on the settings sheet
- Isomers: Sort by the Formula column and remove duplicates that are due to bad chromatography. (click in the RT column for a plot of relative intensities and quicklinks to Xcalibur or peakml chromatograms)
- Click the light-blue ‘peakml export’ button to filter a peakML file by identified masses, which automatically generates a pdf of chromatograms (or can be viewed in peakml viewer). NOTE: mzmatch currently doesn’t allow identification by retention time, therefore the exported peakml file and pdf may contain isomeric peaks that have already been rejected by Ideom. Double-check the retention times before removing masses based on chromatographic peak shape.
- Related Peaks: Click the orange 'Sort By Relation ID' button and look in columns M:P for ESI artefacts that were not filtered by the common adducts search (e.g. Metabolite-specific fragments). Double-click in the mass (column A) to see all co-eluting peaks – red masses are ‘related’ according to mzmatch.
- Also look at 'C isotope error' (column Q) to see if the main isotope intensity doesn't match the formula, Related Peaks (column R) to see if all the fragments and isotopes are possible from the identified structure, and 'adduct' (column Y) to check whether the identified adduct (e.g. 2+, Na) is likely. (the 'charge' column at the end may help this if a 13C isotope was present, but it is sometimes not correct in noisy data).
- Alternative identification: Easily change identification by clicking the metabolite name (column E), then select from the isomers in the dropdown list. Further information about these isomers can be obtained by double-clicking the isomer number (column D). Alternative formulas can be investigated for individual masses by double-clicking the formula (column C).
- Use the 'Remove row' button to easily transfer metabolites from the 'identification' sheet to the 'rejected' sheet. There is an option to merge peaks, which would be used for compounds with poor peak shape (e.g. lipids on a HILIC column) that appear with the same mass but slightly different retention times. If merging peaks it keeps the largest intensity from each sample.
- To speed up viewing data you may set Excel's calculation to 'manual' (Formulas >> Calculation Options) - but be aware that you need to manually calculate if you make any changes. Some macros will automatically return calculation to 'Automatic' (Formulas >> Calculation Options).
- There is an option to normalise data at this stage (purple button) to allow normalisation based on (putatively) identified metabolite peaks, rather than normalising on total LC-MS signal or peaks (which includes much more noise).
- Columns W and X allow a rapid comparison of relative intensity and p-value (from t-test) between the 2 groups specified as ‘control’ and ‘treatment’.
- Compare 2 other groups (purple button) allows rapid comparison of two groups of samples with means, standard deviations and t-test.

16
- Compare with medium (purple button) gives similar statistics, and also checks whether all sample intensities are greater than all medium intensities.
7. Combine Pos and Neg modes (optional)
If you have data from the Orbitrap Exactive in switching polarity mode, each polarity must be processed separately up to this point.
The step combines all data from ‘Identification’, ‘Rejected’ and ‘allBasepeaks’ sheets. (but not the alldata sheets)
If a metabolite gives peaks in both polarities (same formula and RT within 'duplicatepeaks' window setting), the one with the highest maximum intensity is chosen.
8. Compare all sets
This macro takes the data from the 'identification' sheet, and summarises it in the 'Comparison' sheet. An option exists to also include all significant BasePeaks (regardless of their identification) to allow analysis of unidentified metabolites.
It also makes the metabolite names in the 'identification' sheet dependent on the name in the 'comparison' sheet. So if you select a different name for a peak in the 'comparison' sheet, it will be reflected in the 'identification' sheet.
Relative Intensities are expressed relative to the 'control' group (from the Settings sheet)
P values are for unpaired t-test against 'control' group. Mean peak intensities, standard deviations, Relative Standards Deviations (RSD) and Fisher ratios are also given
The correlation column gives a rank order that can enable sorting by intensity correlation (across samples) relative to all other metabolites
Correlation Sort allows you to sort the list by intensity correlation (across samples) to a specified metabolite
17
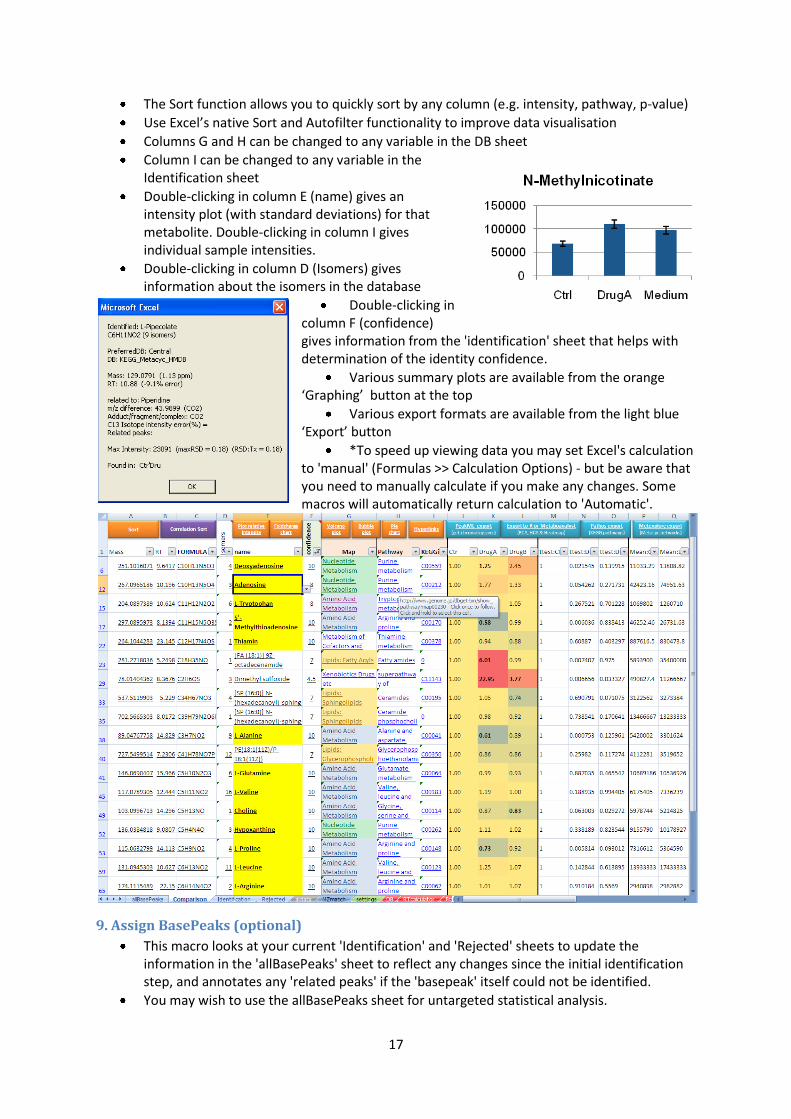
The Sort function allows you to quickly sort by any column (e.g. intensity, pathway, p-value)
Use Excel’s native Sort and Autofilter functionality to improve data visualisation
Columns G and H can be changed to any variable in the DB sheet
Column I can be changed to any variable in the Identification sheet
Double-clicking in column E (name) gives an intensity plot (with standard deviations) for that metabolite. Double-clicking in column I gives individual sample intensities.
Double-clicking in column D (Isomers) gives information about the isomers in the database
Double-clicking in column F (confidence) gives information from the 'identification' sheet that helps with determination of the identity confidence.
Various summary plots are available from the orange ‘Graphing’ button at the top
Various export formats are available from the light blue ‘Export’ button
*To speed up viewing data you may set Excel's calculation to 'manual' (Formulas >> Calculation Options) - but be aware that you need to manually calculate if you make any changes. Some macros will automatically return calculation to 'Automatic'.
9. Assign BasePeaks (optional)
This macro looks at your current 'Identification' and 'Rejected' sheets to update the information in the 'allBasePeaks' sheet to reflect any changes since the initial identification step, and annotates any 'related peaks' if the 'basepeak' itself could not be identified.
You may wish to use the allBasePeaks sheet for untargeted statistical analysis.

18
Other Tools
Targeted Analysis
Targeted analysis for specific metabolites can be undertaken from the ‘Targeted’ sheet. By
following the process indicated by the buttons at the top of the page.
i. Enter the Metabolite names in Column A.
ii. Click step 2 to upload information for each metabolite from the metabolite database
(DB sheet). For unique metabolites and/or masses enter the RT, formula and/or
mass directly.
iii. This step uses msconvert/mzMatch (through R) to process either raw, mzXML or
peakML files and filters the results according to the specified masses. This function
uses the mzMatch peak extraction method (not XCMS), and users are expected to
visually inspect the resulting chromatograms. Output files include a text file, peakml
file and pdf with chromatograms. Parameters are taken from the Setting sheet.
iv. The results from step iii are searched to return results for the specific metabolites to
the targeted page. Alternatively, any text file from mzmatch, or the data on the
mzmatch sheet, can be used for this step. If multiple peaks are present it first takes
the most intense peak within the RT window setting for standard RT (settings sheet;
cell E23), then the most intense peak within the RT window setting for calculated RT
(settings sheet; cell E24). Metabolites with no expected RT are assigned the peak
with the largest intensity.
v. The targeted analysis is commonly used to obtain retention times for authentic
standards, and hence there is an option to export these results to the RT calculator
which is used in the regular untargeted Ideom processing method.
Additional sheets are provided containing the mixtures of standards that Scotmet
uses in our standards mixtures for calibrating retention times.
Isotope search This tool provides an untargeted search for labelled metabolites in data that was obtained
using stable-isotope labelled precursors.
Run this from the ‘tools’ menu in ‘comparison’, ‘allbasepeaks’ or ‘Identification’ sheets to search for isotopes of putatively identified compounds.
The isotope search macro looks within the RT window for related peaks.
The isotope search result is the relative abundance, i.e. the ratio of the isotope peak to the unlabelled peak in each specified sample.
The result is shaded yellow if the relative abundance is more than 10% greater than the expected abundance of the natural isotope of the unlabelled metabolite.
This macro will only find isotopes if they were imported to IDEOM from mzMatch. In some cases isotopes are missed because the peaks were not detected by XCMS. To find these isotopes in raw data use the ‘Targetted Isotopes’ macro in the ‘export’ menu.
Metabolite search This searches for a given metabolite in the dataset, and will also flag up isomers that have been found.
19
Add Chromatograms This allows you to easily import chromatograms from a peakML file as comments in the
mass cells of Ideom (i.e. they appear when you hover the mouse over masses in column A).
This function will work on any results sheet, although is usually used on the ‘Comparison’ sheet.
Running this function (click the light blue button and follow prompts) generates a list peak group identifiers from your current visible metabolite list, and extracts these chromatograms for each metabolite as image files. ** Ensure that you select the same peakML files that you used to obtain the initial mzmatch_output.txt files for Ideom. The chromatogram image files are saved into a new “chromatograms” folder and then automatically uploaded to the Ideom file.
If your computer doesn’t have enough memory to process the peakML file then R may crash or close, and Excel will hang... Hit “Esc” twice to regain control of Excel. For large studies you may upload chromatograms that were generated externally. They must be saved in a folder named ‘chromatograms’ in the same directory as your peakML file. (If processing dual polarity files the negative-mode chromatograms should be in a folder named ‘chromatograms_neg’). The script for generating chromatograms externally can be obtained from the ‘R scripts menu’ on the settings sheet.
This function will work for both single-polarity and dual-polarity datasets.
Annotate DB This allows you to easily add annotations to the database from another Excel-readable file.
Metabolite matching can be based on any column in the DB (eg. name, KEGG ID, INCHIkey), but note that matches must be exact.
You could also use this function to compare results from different files (basically it is a lookup/matching function between two files).
Alternative peak list import options Mzmine input format requires column A = m/z, column B = RT (mins), peak areas in any
other set of adjacent columns (macro looks for a heading with the suffix "peak area")
Other input format (e.g. from MetAlign or other pre-processor) can be manually entered onto the MZmatch sheet in the following format: column A = corrected mass (i.e. m/z - 1.007276), column B = RT (seconds), peak intensities in adjacent columns starting from column C, other data may be included in columns to the right.
Trim File Size Deletes all non-essential information from the Ideom file to make it smaller. Some functions
(e.g. RTcalculator) may not work correctly after running this macro, but most should be fine. Only use this if you are having trouble emailing your results to a collaborator or uploading to a journal site because the file size is too large.
20
zFormulagenerator This macro is activated from the menu obtained by double-clicking a formula cell (or empty
formula cell) in column C of any results sheet.
The mass from column A is copied, and the rCDK package in R is used to determine all
possible theoretical formulas (with some constraints). Results are pasted onto a new sheet
in Ideom and tested for validity by 5 of Kind & Feihn’s heuristic rules, with the most likely
formula appearing at the top, with the option to search for this formula on the Chemspider
website. (Kind & Feihn; BMC BIOINFORMATICS, 8: Art. No. 105 MAR 27 2007
http://www.biomedcentral.com/1471-2105/8/105)
Xcaliburlink Select a cell containing a mass of interest and press “Ctrl-Shift-X” to provide a quick link to
an extracted ion chromatogram in Xcalibur Qualbrowser. (Note: On the first occasion you
will be prompted to open the specific raw file in Xcalibur manually, however once open, this
allows you to check the raw data for multiple metabolites very quickly. Please ensure that
the chromatogram window is active in Qualbrowser, that the mass tolerance (ppm) is
appropriate, and that the mass precision is set to at least 4 decimal places.)
This requires a current installation of Xcalibur, otherwise you may also use this macro to
extract the chromatograms for this specific mass from a peakml file through mzmatch.R
(however this option is not instantaneous).
21
Excel Functions Additional functions are provided which may be used in any cell just like the normal excel functions:
Exact Mass:
fx =ExactMass(Formula, Clabels (optional), Nlabels (optional), Olabels (optional), Dlabels(optional))
Returns the exact mass of a given formula. Only works for the following atoms: C, H, N, O, S,
P, Cl, F, I, Br and Se.
Optional arguments allow exact mass calculation for isotopically labelled compounds with
the specified number of 13C, 15N, 18O or deuterium atoms.
Mass error (ppm) calculation:
fx =ppmcalc(mass, Theoreticalmass (optional), Formula (optional))
Calculates the mass difference (in ppm) between a given mass and a theoretical formula or
mass.
Formula Reactor:
fx =FormulaReactor(Formula1, Formula2 (optional), formulaloss (optional))
Returns the formula that results from the addition of the 2 input formulae.
If the reaction involves the loss of a second product (eg H2O), this must be entered as the
‘formulaloss’. (alternatively this function can determine the fragment resulting from the loss
of ‘formulaloss’ from ‘Formula1’ ).
Only works for the following atoms: C, H, N, O, S, P, Cl, F, I and Br.
e.g. FormulaReactor(C6H12O6, H3PO4, H2O) = C6H13O9P
Formula match from exact mass:
fx =FormulaMATCH(mass, ppm, Masslist, Formulalist)
Finds a matching formula in a database of ascending masses (e.g. the DB sheet).
Masslist and Formulalist need to be selected as columns in a database.
If two masses either side of the search mass are within the allowable ppm error the answer
is italicised.
Formula validity check:
fx =Formulavalid(Formula)
Checks the validity of a proposed chemical formula against 5 of Kind & Feihn's 7 golden rules
(excluding isotope and TMS rules). Kind & Feihn; BMC BIOINFORMATICS, 8: Art. No. 105
MAR 27 2007 http://www.biomedcentral.com/1471-2105/8/105
Theoretical Isotope Abundance Calculator:
fx =IsotopeAbundance(Formula, Atom)
Calculates the theoretical natural isotope abundance of a specified atom in a given formula.
(Only works for 13C, 2H, 15N, 18O, 34S, 37Cl, 81Br).

22
Positive charge (average):
fx =Pos(pH, cation, pka1, pka2 (optional), pka3 (optional), pka4 (optional), pka5 (optional))
Calculates the average number of positive charges on a molecule at a given pH, based on the
formal positive charge (cation) and a list of basic pKa values.
Negative charge (average):
fx =Neg(pH, anion, pka1, pka2 (optional), pka3 (optional), pka4 (optional), ... , pka8 (optional))
Neg: Calculates the average number of negative charges on a molecule at a given pH, based
on the formal negative charge (anion) and a list of acidic pKa values.
23
Definitions
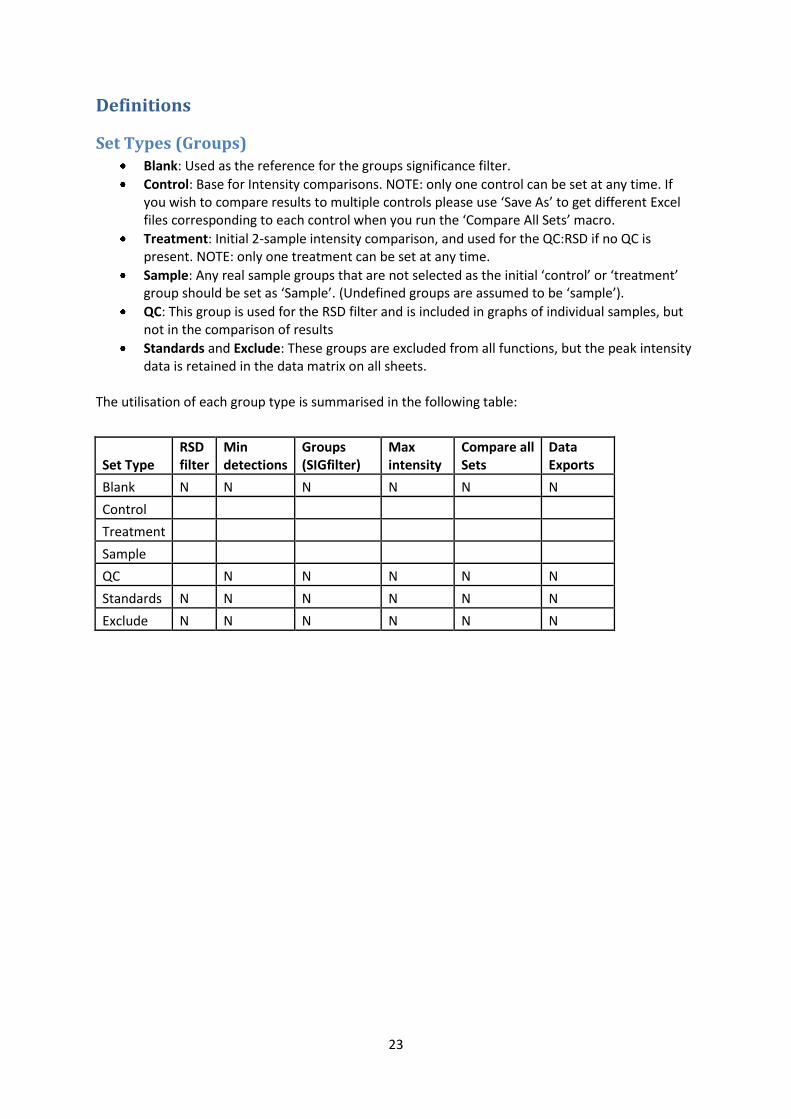
Set Types (Groups)
Blank: Used as the reference for the groups significance filter.
Control: Base for Intensity comparisons. NOTE: only one control can be set at any time. If you wish to compare results to multiple controls please use ‘Save As’ to get different Excel files corresponding to each control when you run the ‘Compare All Sets’ macro.
Treatment: Initial 2-sample intensity comparison, and used for the QC:RSD if no QC is present. NOTE: only one treatment can be set at any time.
Sample: Any real sample groups that are not selected as the initial ‘control’ or ‘treatment’ group should be set as ‘Sample’. (Undefined groups are assumed to be ‘sample’).
QC: This group is used for the RSD filter and is included in graphs of individual samples, but not in the comparison of results
Standards and Exclude: These groups are excluded from all functions, but the peak intensity data is retained in the data matrix on all sheets.
The utilisation of each group type is summarised in the following table:
Set Type
RSD filter
Min detections
Groups (SIGfilter)
Max intensity
Compare all Sets
Data Exports
Blank N N N N N N
Control
Treatment
Sample
QC N N N N N
Standards N N N N N N
Exclude N N N N N N
24
Column definitions for results sheets
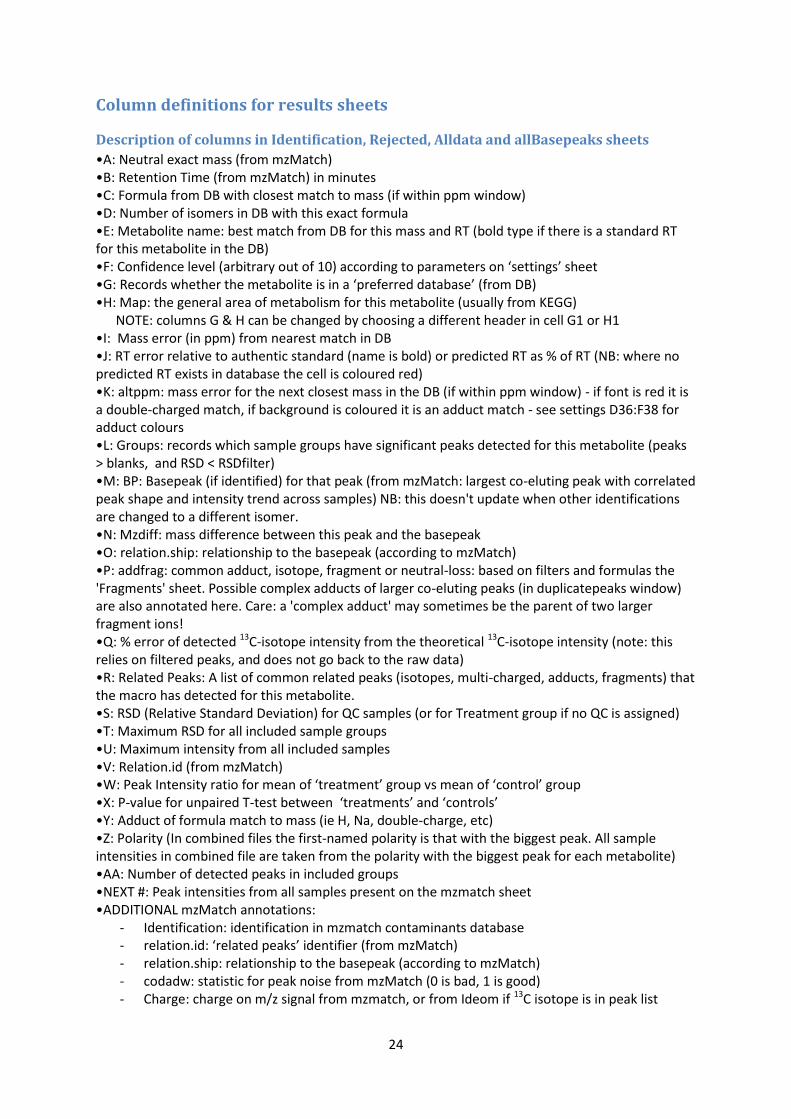
Description of columns in Identification, Rejected, Alldata and allBasepeaks sheets
•A: Neutral exact mass (from mzMatch) •B: Retention Time (from mzMatch) in minutes •C: Formula from DB with closest match to mass (if within ppm window) •D: Number of isomers in DB with this exact formula •E: Metabolite name: best match from DB for this mass and RT (bold type if there is a standard RT for this metabolite in the DB) •F: Confidence level (arbitrary out of 10) according to parameters on ‘settings’ sheet •G: Records whether the metabolite is in a ‘preferred database’ (from DB) •H: Map: the general area of metabolism for this metabolite (usually from KEGG) NOTE: columns G & H can be changed by choosing a different header in cell G1 or H1 •I: Mass error (in ppm) from nearest match in DB •J: RT error relative to authentic standard (name is bold) or predicted RT as % of RT (NB: where no predicted RT exists in database the cell is coloured red) •K: altppm: mass error for the next closest mass in the DB (if within ppm window) - if font is red it is a double-charged match, if background is coloured it is an adduct match - see settings D36:F38 for adduct colours •L: Groups: records which sample groups have significant peaks detected for this metabolite (peaks > blanks, and RSD < RSDfilter) •M: BP: Basepeak (if identified) for that peak (from mzMatch: largest co-eluting peak with correlated peak shape and intensity trend across samples) NB: this doesn't update when other identifications are changed to a different isomer. •N: Mzdiff: mass difference between this peak and the basepeak •O: relation.ship: relationship to the basepeak (according to mzMatch) •P: addfrag: common adduct, isotope, fragment or neutral-loss: based on filters and formulas the 'Fragments' sheet. Possible complex adducts of larger co-eluting peaks (in duplicatepeaks window) are also annotated here. Care: a 'complex adduct' may sometimes be the parent of two larger fragment ions! •Q: % error of detected 13C-isotope intensity from the theoretical 13C-isotope intensity (note: this relies on filtered peaks, and does not go back to the raw data) •R: Related Peaks: A list of common related peaks (isotopes, multi-charged, adducts, fragments) that the macro has detected for this metabolite. •S: RSD (Relative Standard Deviation) for QC samples (or for Treatment group if no QC is assigned) •T: Maximum RSD for all included sample groups •U: Maximum intensity from all included samples •V: Relation.id (from mzMatch) •W: Peak Intensity ratio for mean of ‘treatment’ group vs mean of ‘control’ group •X: P-value for unpaired T-test between ‘treatments’ and ‘controls’ •Y: Adduct of formula match to mass (ie H, Na, double-charge, etc) •Z: Polarity (In combined files the first-named polarity is that with the biggest peak. All sample intensities in combined file are taken from the polarity with the biggest peak for each metabolite) •AA: Number of detected peaks in included groups •NEXT #: Peak intensities from all samples present on the mzmatch sheet •ADDITIONAL mzMatch annotations:
- Identification: identification in mzmatch contaminants database - relation.id: ‘related peaks’ identifier (from mzMatch) - relation.ship: relationship to the basepeak (according to mzMatch) - codadw: statistic for peak noise from mzMatch (0 is bad, 1 is good) - Charge: charge on m/z signal from mzmatch, or from Ideom if 13C isotope is in peak list

25
•ADDITIONAL Ideom annotations: - Order: Unique identifier for each peak set - Fisher Ratio: Measure of difference or significance for treatment vs control.
(meant - meanc)2/(sdt
2 + sdc2)
- EIC Rel Intensity: Maximum peak intensity in this peak set relative to the highest peak for that mass.
- ppm(raw): Mass error before mass re-calibration - Other functions such as ‘Compare with medium’, ‘compare 2 other groups’ and ‘isotope
search’ will add extra columns - Users may add additional columns to the right without affecting macro performance. Please
do not insert columns between existing data.
Description of columns in Comparison sheet
•A: Neutral exact mass (from mzMatch) •B: Retention Time (from mzMatch) in minutes •C: Formula from DB with closest match to mass (if within ppm window) •D: Number of isomers in DB with this exact formula •E: Metabolite name: best match from DB for this mass and RT (bold type if there is a standard RT for this metabolite in the DB) •F: Confidence level (arbitrary out of 10) according to parameters on ‘settings’ sheet •G: Map: the general area of metabolism for this metabolite (usually from KEGG) •H: Pathway: list of biochemical pathways for this metabolite (usually from KEGG) •I: Groups: records which sample groups have significant peaks detected for this metabolite (peaks > blanks, and RSD < RSDfilter) NOTE: columns G,H & I can be changed by choosing a different header in cell G1, H1 or I1 •J-#: Mean intensity of each included group relative to the 'control' group (as set when the 'Comparison' macro was run). Significant (ttest) values are in bold. •NEXT #: P-values for unpaired t-test between each included group and the control •NEXT #: Mean Intensity for each included group •NEXT #: Standard deviation for each included group •NEXT #: Relative Standard deviation for each included group •NEXT #: Fisher ratio for each included group, relative to the control group •LAST: Correlation order: Sort by this column to sort by correlation of intensity trends across the sample groups •ADDITIONAL: Additional columns are added every time you sort by correlation of intensity trends relative to a specific metabolite. You may add your own additional columns to the right of existing data without affecting performance. Please do not insert columns between existing data.
26
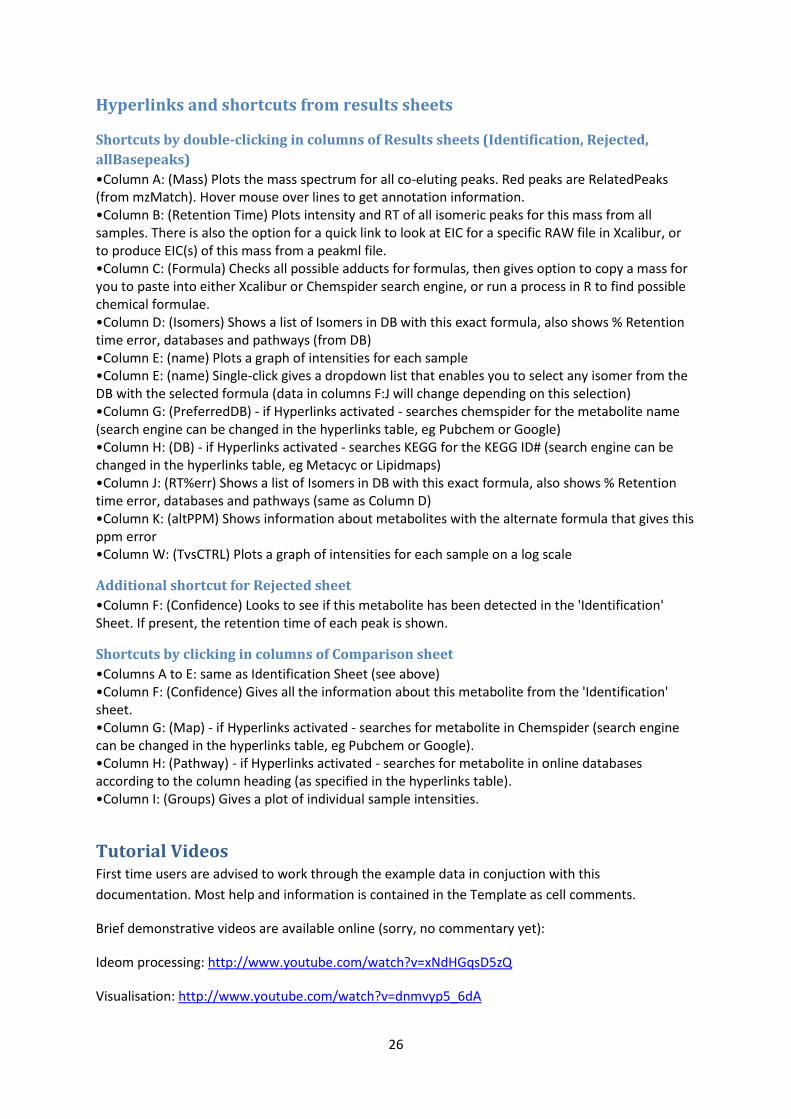
Hyperlinks and shortcuts from results sheets
Shortcuts by double-clicking in columns of Results sheets (Identification, Rejected,
allBasepeaks)
•Column A: (Mass) Plots the mass spectrum for all co-eluting peaks. Red peaks are RelatedPeaks (from mzMatch). Hover mouse over lines to get annotation information. •Column B: (Retention Time) Plots intensity and RT of all isomeric peaks for this mass from all samples. There is also the option for a quick link to look at EIC for a specific RAW file in Xcalibur, or to produce EIC(s) of this mass from a peakml file. •Column C: (Formula) Checks all possible adducts for formulas, then gives option to copy a mass for you to paste into either Xcalibur or Chemspider search engine, or run a process in R to find possible chemical formulae. •Column D: (Isomers) Shows a list of Isomers in DB with this exact formula, also shows % Retention time error, databases and pathways (from DB) •Column E: (name) Plots a graph of intensities for each sample •Column E: (name) Single-click gives a dropdown list that enables you to select any isomer from the DB with the selected formula (data in columns F:J will change depending on this selection) •Column G: (PreferredDB) - if Hyperlinks activated - searches chemspider for the metabolite name (search engine can be changed in the hyperlinks table, eg Pubchem or Google) •Column H: (DB) - if Hyperlinks activated - searches KEGG for the KEGG ID# (search engine can be changed in the hyperlinks table, eg Metacyc or Lipidmaps) •Column J: (RT%err) Shows a list of Isomers in DB with this exact formula, also shows % Retention time error, databases and pathways (same as Column D) •Column K: (altPPM) Shows information about metabolites with the alternate formula that gives this ppm error •Column W: (TvsCTRL) Plots a graph of intensities for each sample on a log scale
Additional shortcut for Rejected sheet
•Column F: (Confidence) Looks to see if this metabolite has been detected in the 'Identification' Sheet. If present, the retention time of each peak is shown.
Shortcuts by clicking in columns of Comparison sheet
•Columns A to E: same as Identification Sheet (see above) •Column F: (Confidence) Gives all the information about this metabolite from the 'Identification' sheet. •Column G: (Map) - if Hyperlinks activated - searches for metabolite in Chemspider (search engine can be changed in the hyperlinks table, eg Pubchem or Google). •Column H: (Pathway) - if Hyperlinks activated - searches for metabolite in online databases according to the column heading (as specified in the hyperlinks table). •Column I: (Groups) Gives a plot of individual sample intensities.
Tutorial Videos First time users are advised to work through the example data in conjuction with this
documentation. Most help and information is contained in the Template as cell comments.
Brief demonstrative videos are available online (sorry, no commentary yet):
Ideom processing: http://www.youtube.com/watch?v=xNdHGqsD5zQ
Visualisation: http://www.youtube.com/watch?v=dnmvyp5_6dA

27
Frequently Asked Questions (FAQ’S)
I have a list of metabolites... how do I interpret this data?
This depends on your study hypothesis... generally the easiest approach for meaningful biochemical
analysis is to look at the ‘Comparison’ sheet (after running the ‘Compare all sets’ function). Sort the
list by relative intensity for each group (columns J, K, etc) to see what changed most. Alternatively
sort by P-values or Fisher ratio’s to find significant changes. The volcano plot, bubble plot and
Foldchange chart may assist with visualisation. The pie chart will show your scope of detected
metabolites, or sort by Map or Pathway. Further information about individual metabolites can be
obtained by double-clicking the underlined cells (mass, RT, formula, Isomers, name, confidence,
map, pathway). For further analysis consider exporting your data to metabolomics-specific websites:
Pathos, Metexplore or Metaboanalyst.
Further information about data analysis for end users is located in Appendix A.
How is metabolite identification confirmed?:
CAUTION: Consider all metabolite identities as putative (level 2: Sumner et al, Metabolomics 2007,
3:211-221). Please note the high probability of false-identification from accurate mass LC-MS data as
shown by the number of peaks that end up in the ‘rejected’ sheet. Ideom applies many checks and
filters to remove most falsely-identified metabolites, however it is expected that a few will remain in
your final list. The confidence levels with help with interpretation, but please check (or get an LC-MS
analyst to check) the metadata for each identified metabolite to rule out possible LC or MS artefacts.
Metabolites with confidence levels of 9 or 10 indicate matching of accurate mass and RT with
authentic standards, and thus can be considered ‘identified‘ if you have entered authentic standard
RT’s analysed under identical experimental conditions to your samples (level 1: Sumner et al,
Metabolomics 2007, 3:211-221). However, note that if isomers are likely to have a similar retention
time it is possible to identify the wrong isomer, hence isomeric standards should be checked to
exclude other possibilities. Ideally, an additional, alternative analytical method is recommended for
absolute identification –particularly for unexpected metabolites. An export feature is included to
create an MS/MS “include list” for masses that require further analysis.
What test should I use to find the most significant metabolites?
Regarding significance: I should first declare that Ideom is not intended to be a high-end statistical
tool. The t-test should give you a rough idea of what is worth looking at more closely, but it is often
not the optimal statistical method (the main reason it is in Ideom is because it is simple and quick to
calculate). Ideom uses the unpaired, unequal variance 2-sample students t-Test, and does not make
corrections for multiple-testing, nor check for normality in the distribution of data.
In many cases just looking at the relative intensity (for fold-changes) may be sufficient. The Fisher
ratio looks at both relative intensity and standard deviation, and is probably the best of the included
data (but also assumes normally distributed data).

28
Many people in metabolomics use multivariate approaches (such as PCA or PLS). Ideom will export
data to R and produce a simple PCA, HCA and heatmap. Alternatively, people less familiar with
multivariate statistics and/or R may prefer to export to metaboanalyst (www.metaboanalyst.ca) for
a more user-friendly statistical interface.
Many of my expected metabolites are being rejected?
The most common reason for rejection of common metabolites is the RSD filter. Most metabolomics
data contains some variability, and if the RSD filter is ‘STRICT’ it only requires one variable study
group (RSD>threshold) to cause a metabolite to be excluded. If this occurs consider re-analysing the
data (step 3) with the ‘GENEROUS’ RSD filter, which only requires one group to be reproducible (and
hence also retains many more variable noise signals).
R scripts don't run on my computer
1. You need to agree to the popup box to allow Excel to load R on your computer.
2. If R is too slow to load the script can occasionally be pasted before it has initialised. Usually this
only happens the first time you load R (try repeating the step). Otherwise, change the setting in cell
E44 so that the macro knows to wait longer for your computer to load R.
How do you deal with Polarity?:
The polarity is automatically corrected by mzMatch.R during the peak picking process, and all
masses that appear in the Template are corrected neutral masses. Ensure that you set the correct
'polarity' option on the 'settings' sheet before running anything. The polarity setting is also useful for
combining positive and negative mode data, and for the quicklink to xcalibur qualbrowser EICs. (i.e.
whether to add or subtract a proton to get from neutral mass back to m/z).
Note: Due to the automatic polarity correction by mzMatch, the masses of cations in the database
have been corrected by one proton. (eg. The mass of choline in the DB is 103, rather than actual
mass of 104).
Which file to use for the retention time updater?
You need to manually generate a list of retention times for authentic standards under the current LC
conditions. This can be done with Ideom using the functions on the ‘Targeted’ sheet, otherwise you
can use ToxID (or similar), or do it manually from raw data.
The retention time updater has been tested on ToxID .csv output files. However, it should work for
any Excel-readable file that has a column for metabolite names and a column for retention times.
(Note: the metabolite name must be identical to the name in the database - the only exception is
that underscore "_" may be used in the place of comma "," to avoid issues with .csv files).
29
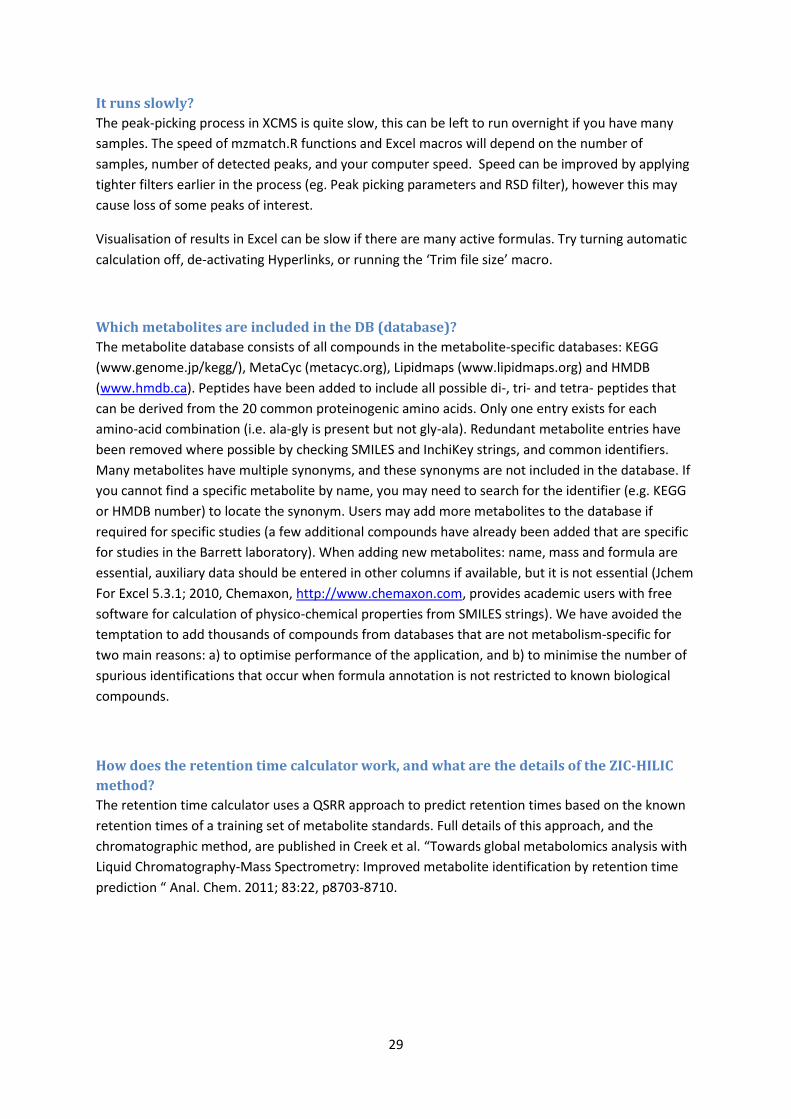
It runs slowly?
The peak-picking process in XCMS is quite slow, this can be left to run overnight if you have many
samples. The speed of mzmatch.R functions and Excel macros will depend on the number of
samples, number of detected peaks, and your computer speed. Speed can be improved by applying
tighter filters earlier in the process (eg. Peak picking parameters and RSD filter), however this may
cause loss of some peaks of interest.
Visualisation of results in Excel can be slow if there are many active formulas. Try turning automatic
calculation off, de-activating Hyperlinks, or running the ‘Trim file size’ macro.
Which metabolites are included in the DB (database)?
The metabolite database consists of all compounds in the metabolite-specific databases: KEGG
(www.genome.jp/kegg/), MetaCyc (metacyc.org), Lipidmaps (www.lipidmaps.org) and HMDB
(www.hmdb.ca). Peptides have been added to include all possible di-, tri- and tetra- peptides that
can be derived from the 20 common proteinogenic amino acids. Only one entry exists for each
amino-acid combination (i.e. ala-gly is present but not gly-ala). Redundant metabolite entries have
been removed where possible by checking SMILES and InchiKey strings, and common identifiers.
Many metabolites have multiple synonyms, and these synonyms are not included in the database. If
you cannot find a specific metabolite by name, you may need to search for the identifier (e.g. KEGG
or HMDB number) to locate the synonym. Users may add more metabolites to the database if
required for specific studies (a few additional compounds have already been added that are specific
for studies in the Barrett laboratory). When adding new metabolites: name, mass and formula are
essential, auxiliary data should be entered in other columns if available, but it is not essential (Jchem
For Excel 5.3.1; 2010, Chemaxon, http://www.chemaxon.com, provides academic users with free
software for calculation of physico-chemical properties from SMILES strings). We have avoided the
temptation to add thousands of compounds from databases that are not metabolism-specific for
two main reasons: a) to optimise performance of the application, and b) to minimise the number of
spurious identifications that occur when formula annotation is not restricted to known biological
compounds.
How does the retention time calculator work, and what are the details of the ZIC-HILIC
method?
The retention time calculator uses a QSRR approach to predict retention times based on the known
retention times of a training set of metabolite standards. Full details of this approach, and the
chromatographic method, are published in Creek et al. “Towards global metabolomics analysis with
Liquid Chromatography-Mass Spectrometry: Improved metabolite identification by retention time
prediction “ Anal. Chem. 2011; 83:22, p8703-8710.

30
How can I make a heatmap of relative abundances directly from what I see on the
‘Comparison’ page?
First optimise the ‘conditional formatting’ in the relative intensity columns. Then “hide” the black numbers by changing the font as follows: 1. reduce the number of decimal places to 0 2. reduce the font size to 1 3. change the font colour to blue 4. change the font to "MT extra" Then re-size your screen by adjusting the zoom (bottom-right corner) and hit ‘Print Screen’ to copy the image. Paste this copied image into any graphics editor for any annotations or adjustments.
How can I combine results from 2 (or more) datasets into 1 Ideom file?
It is not recommended to combine multiple datasets from different untargeted LCMS studies because LCMS is not inherently quantitative – hence there is no feature to combine multiple processed datasets into one file. Being a fully functional Excel file, users are free to copy/paste data between Ideom files to compare
multiple datasets. Consider colouring each set of data with an identifying colour before appending
the data from one study to the data from another, then if you re-sort the list you’ll know which
study each metabolite comes from.
NOTE: we do not provide support for this procedure due to possible differences in response factors
that will invalidate any statistical analyses. If you have multiple datasets that are directly comparable
(i.e. from the same analysis batch) it is recommended to analyse them together in the same Ideom
file (from the beginning).
How is isotope information (natural isotope abundances) recorded and utilised in
Ideom?
Low abundance isotope peaks (e.g. 13C) are ‘rejected’ to remove possible false identifications that could occur by mass-matching of all detected peaks to a metabolite database. However, the isotope information is retained in Ideom as meta-information recorded with the most abundant peak (e.g. 12C) in column Q of the results sheets. Rather than report raw intensities, the 13C isotope intensity is used to calculate the theoretical number of carbons in the empirical formula of each metabolite, and in cases where putative identification is assigned, the error of the experimental isotope abundance is reported as a percentage of the theoretical isotope abundance. The presence of other common isotopes (e.g. 15N, 18O, 34S, 37Cl) is also recorded in column R. Isotopic information is not utilised for automated filtering or metabolite identification (except to look for multiply-charged species) because many low mass and/or low abundance metabolites have isotope peaks below the limit of detection. Nevertheless, the isotope intensity errors reported in column Q allow rapid manual filtering in Excel if desired. All the isotope information (charge-state, number of carbons according to theoretical isotope abundance and presence of isotope peaks for other atoms) is instantly accessible on any Ideom sheet by double-clicking the formula cell (in column C) for each mass.
31
TROUBLESHOOTING If any functions are not performing correctly, save your work and try re-starting Excel (or Windows).
Known bugs:
- If you are unable to cut/copy a chart… deselect it (by clicking another cell), and then select it
again before copying. - If charts are changing after copy-pasting into Word or Powerpoint, you need to break the
link (Office button >> Prepare >> Edit links to files >> select chart and click ‘Break link’).
Alternatively paste it as a picture (.png).
- The native Excel 'sort' function may malfunction on the identification page, use the orange 'sort' button on the appropriate page if this causes a problem. **FIXED
- Occasionally the Numlock will switch on or off during some macros. - Bugs are often due to empty rows at the bottom of the page. If a macro is crashing, try
selecting all the empty rows underneath the data, and delete them by right-click >> Delete (NOTE: pressing the delete button doesn’t actually delete rows, it just clears the data from within the cells).
- If Excel hangs... leave it a few minutes, if no resolution try pressing “Esc” twice to stop any running macros. (this may be required during the Formulagenerator or AddChromatograms macros if R crashes while Excel is waiting for a response from R).
mzMatch and R help
1. Ensure that you have R statistical software installed (http://www.r-project.org/)
2. The location of Rgui.exe on your computer needs to be assigned, and is stored in cell E41 (if
no location is entered you will be prompted to select the Rgui.exe file)
3. The following packages need to be installed in R: xcms, rJava, XML, mzmatch.R, caTools,
bitops, rCDK. (use the Install packages macro button to generate correct script).
4. Further help and documentation for mzMatch.R available at
(http://sourceforge.net/projects/mzmatch/)
5. Further help and documentation for XCMS available at (http://metlin.scripps.edu/xcms/)
6. Some xcms and mzmatch.r functions are very slow and memory intensive. An option exists
to save scripts to run these processes on an external (e.g. Linux or 64bit Windows) machine.
All questions regarding XCMS and mzMatch.R should be directed to the appropriate online forums: mzMatch: http://sourceforge.net/projects/mzmatch/forums/forum/1081877 XCMS: http://groups.google.com/group/xcms
Contact details
If you have read all this documentation and are still having difficulties, please contact: Ideom forum: [email protected] Darren Creek [email protected]

33
Appendix A: Evaluating Metabolomics Data with Ideom This help file is intended for visualisation and evaluation of data that has already been processed
with Ideom.
1. Open the file in Microsoft Excel version 2007 or 2010 (or Mac 2011) and enable macros from
the warning at the top of the screen.
2. The Ideom file contains a lot of information, but the summary on the ‘comparison’ sheet
should be sufficient for most biochemical interpretation.
3. The data is presented as a list of detected peaks, and each peak has been putatively
identified by mass and retention time. Metabolites highlighted yellow (with a confidence
score of 10) are confirmed identities based on authentic standards, all other metabolites are
putative identifications based on our database of 40,000+ possible metabolites, with varying
levels of confidence as shown.
4. Metabolite levels for each experimental group are shown in columns J onwards. Levels are
expressed as mean peak intensity (height) relative to the mean peak intensity of the Control
group. Additional statistical data for each group is recorded in additional columns to the
right hand side. NOTE: The Control group is defined in the ‘settings’ sheet. Groups may be
re-assigned or excluded from analysis in the settings sheet (column H), however for changes
to take effect on the Comparison sheet you need to re-run step 8 (Green button: ‘Compare
all sets’).
5. Metabolite levels are coloured according to relative intensity (blue = low, red = high) and
highlighted in bold type if the p-value (from t-test against Control group) is less than 0.05.
6. The simplest way to evaluate the data is to sort metabolites according to relative intensities
in a specific experimental group (either with the orange Sort button or with the native Excel
sort function). This will group those metabolites that change the most for a particular
experimental condition. Alternatively, metabolites that follow a certain trend across multiple
experimental groups (eg. for a time-course) can be grouped by using the ‘Correlation Sort’
button.
7. Use the native Excel Filter function to focus on specific metabolites of interest. For example
you may wish view only metabolites with high identity confidence (column F), or exclude
peptides and lipids (column G), or only those with significant p-values.
8. Double-click individual metabolite names to get a column chart of raw peak intensities with
standard deviations.
9. Use the orange buttons to plot graphs for visualisation of multiple metabolites (NOTE: you
may wish to apply filters before plotting some graphs to avoid over-complication).
10. Multivariate statistics can be undertaken by the light blue ‘Export to R or Metaboanalyst’
button. The R option will automatically generate a heat map, HCA dendrograms, PCA plot
and csv file with the PCA loadings. The Metaboanalyst option generates a file in the correct
format to upload to this user-friendly website to do your own analysis.
11. Biochemical pathway interpretation can be done by export to Pathos (for KEGG maps) and
Metexplore (for MetaCyc networks). Alternatively, sorting (or filtering) by Map (column G)
and Pathway (column H) will give a good summary of metabolite levels for specific
pathways.
34
Caution: Metabolite identification
- Metabolites identified by mass and retention time (with authentic standards) are highlighted
yellow and given a confidence score of 10, all others are putative identifications.
- Putative identification is by an untargeted method whereby high-resolution LC-MS signals are
matched to a database of theoretical masses and predicted retention times. LC-MS data contains a
lot of noise, and Ideom processing automatically removes as much as possible, but some false
identifications will remain.
- The most common false-identifications are MS in-source artefacts (fragments and adducts). These
can be identified by checking the mass differences to co-eluting compounds (double-click in column
A for spectra or column F for annotations, consider sorting the list by retention time to identify
these).
- Other noise peaks may be identified by looking at the reproducibility of peak intensities across
replicate samples (double-click in column I) or assessment of the LC-MS peak shape (additional files
required).
- Isomeric peaks (formula shown in red text) may be due to genuine isomeric metabolites (real), or
poor chromatography of a single metabolite (false). Check the RT and intensity of isomeric peaks by
double-click in column B (consider sorting the list by mass or formula to group isomeric peaks).
- Putative identification is often difficult in cases where numerous putative isomers exist in the
database for a single mass (formula). The most likely isomer is identified by a complex algorithm,
however you should always check the list of alternative isomers that could correspond to each mass
(double-click in column D). Alternative isomers can be manually selected from the dropdown list that
is activated by a single-click of the metabolite name.
- Unidentified peaks (or unusual identities) can be investigated by double-click in column C. The
yellow box lists possible identifications (with ppm error) for common adducts. You also have the
option to search for a formula (that is not in our database) based on the exact mass (using either
rCDK, Xcalibur or Chemspider).
- Please confirm the identity of any ‘putative identities’ with your LC-MS specialist. Occasionally
interesting-looking peaks can be excluded as noise or artefacts after looking at the raw data.
Example 1: Cidofivir (mass=279.062; RT=18.24) levels appear to change under certain
experimental conditions, yet the microorganism under investigation has not been treated with
this antiviral drug. Closer inspection reveals a similar pattern of peak intensities for cytidine,
which also elutes RT=18.24 mins, and the mass difference of 35.977 corresponds to chlorine.
Therefore the ‘cidofivir’ is actually an in-source chlorine adduct of cytidine.
Example 2: UDP appears twice in a list, so which one should you take? Looking at the retention
times and peak intensities we can conclude that the peak at 18.22 min is probably an in-source
fragment of UDP-glucose (RT=18.22), the peak at 18.44 min is unique and therefore probably
the real UDP peak.