ieee-ps-08
TRANSCRIPT

7/29/2019 IEEE-PS-08
http://slidepdf.com/reader/full/ieee-ps-08 1/11
1836 IEEE TRANSACTIONS ON POWER SYSTEMS, VOL. 23, NO. 4, NOVEMBER 2008
Vulnerability Assessment of Cybersecurityfor SCADA Systems
Chee-Wooi Ten , Student Member, IEEE , Chen-Ching Liu , Fellow, IEEE , and Govindarasu Manimaran , Member, IEEE
Abstract—Vulnerability assessment is a requirement of NERC’scybersecurity standards for electric power systems. The purposeis to study the impact of a cyber attack on supervisory controland data acquisition (SCADA) systems. Compliance of the require-ment to meet the standard has become increasingly challengingas the system becomes more dispersed in wide areas. Interdepen-dencies between computer communication system and the phys-ical infrastructure also become more complex as information tech-nologies are further integrated into devices and networks. Thispaper proposes a vulnerability assessment framework to systemat-ically evaluate the vulnerabilities of SCADA systems at three levels: system, scenarios, and access points. The proposed method is based
on cyber systems embedded with thefirewall andpasswordmodels,the primary mode of protection in the power industry today. Theimpact of a potential electronic intrusion is evaluated by its po-tential loss of load in the power system. This capability is enabledby integration of a logic-based simulation method and a modulefor the power flow computation. The IEEE 30-bus system is usedto evaluate the impact of attacks launched from outside or fromwithin the substation networks.Countermeasures are identified forimprovement of the cybersecurity.
Index Terms—Cyber-physical system, dependability measures,passwords, Petri nets, power systems, vulnerability indices.
I. INTRODUCTION
SECURITY threats against utility assets have been recog-nized for decades. In the aftermath of the terrorist attacks
on September 11, 2001, great attention has been paid to thesecurity of critical infrastructures. Insecure computer systemsmay lead to catastrophic disruptions, disclosure of sensitive in-formation, and frauds. Cyber threats result from exploitation of cyber system vulnerabilities by users with unauthorized access.A potential cyber threat to supervisory control and data acquisi-tion (SCADA) systems, ranging from computer system to powersystem aspects, is recognized [1]. It is shown that an attack canbe executed within an hour once the computer system security
is compromised. The ever increasing power of the Internet facil-itates simultaneous attacks from multiple locations. The highestimpact of an attack is when an intruder gains access to the super-visory control access of a SCADA system and launches controlactions that may cause catastrophic damages.
Manuscript receivedDecember28, 2007; revised April 07,2008. Current ver-sionpublished October 22,2008. Thiswork was supportedby theElectric PowerResearch Center (EPRC) at Iowa State University. Paper no. TPWRS-00963-2007.
The authors are with the Electrical and Computer Engineering Department,Iowa State University of Science and Technology, Ames, IA, 50010 USA(e-mail: [email protected]; [email protected]; [email protected]).
Digital Object Identifier 10.1109/TPWRS.2008.2002298
Since the 1970s, the control center framework has graduallyevolved from a closed monolithic structure to a more opennetworked environment. With the recent trend of using stan-dardized protocols, more utilities are moving toward Internetprotocol (IP)-based system for wide area communication.The compatibility of standards has also leveraged the costof system deployment among the vendors to improve systemupgradeability. However, a tighter integration may also resultin new vulnerabilities. Vulnerability risks associated with theconnection of SCADA systems to the Internet have been known
[2]. The security concern over information exchange betweenvarious power entities is more challenging as the potentialof cyber threats grows [3]. The increasing dependence uponcommunications over the Internet has added to the signifi-cance and magnitude of the problem. Security awareness andpersonnel training concerning supervisory control systems arecrucial [4], [5]. A recent report comparing different securityguidelines and standards has been provided to emphasize thecritical elements of cybersecurity for SCADA systems [6].The cybersecurity technologies identified in [7] address theeffectiveness of defense. Recent research emphasizes securityinterdependency modeling that includes deliberate sabotage,
and the improvement on power system information architectureand communication interaction [8]–[10]. The SCADA test beddevelopment is an effective way to identify vulnerabilities of power infrastructure cybersecurity [11]–[13]. Reference [14]proposes a novel approach using wireless sensor technologyto assess the mechanical health of a transmission system.The development of quantitative techniques for systems in-terdependency is reported in [15]. There are model-basedattack-detection techniques [16] to detect anomaly and torecognize malicious electronic signatures.
Cybersecurity for the power grid is an emerging area of research. Efforts by International Electrotechnical CommissionTechnical Council (IEC TC 57) on power systems management
and associated information exchange have advanced commu-nication protocols with stronger encryption and authenticationmechanisms. Specifically, this has been proposed in IEC62351for data and communication security that assures access tosensitive power equipment and provides higher reliability withaudit capabilities [17]. They allow verification and evaluation of potential threats. Besides the power industry standards, controlsystem standards applicable to oil and gas have been reported[18]. While its importance is well recognized and test bedshave been developed, no systematic modeling and analyticaltechnique exists for the evaluation of critical assets in the powerinfrastructure such as the SCADA system. Moreover, there has
not been an approach to measure the vulnerability of a cyber0885-8950/$25.00 © 2008 IEEE
Authorized licensed use limited to: Iowa State University. Downloaded on January 11, 2009 at 21:05 from IEEE Xplore. Restrictions apply.

7/29/2019 IEEE-PS-08
http://slidepdf.com/reader/full/ieee-ps-08 2/11
TEN et al.: VULNERABILITY ASSESSMENT OF CYBERSECURITY FOR SCADA SYSTEMS 1837
Fig. 1. Cyber network environment of a control center.
system by incorporating the impact on the power system. Themain contribution of this paper is a vulnerability assessmentframework for a systematic analysis incorporating both powerand cyber systems of the control networks. The proposed in-tegration of cyber-power system attack/defense modeling with
the system simulation capability makes it possible to quantifythe potential impact an attack can cause. Some preliminaryconcepts on cyber-physical vulnerability assessment are pre-sented in [19].
The remaining of this paper is organizedas follows. Section IIprovides an overview of the SCADA system security measuresand the vulnerabilities. Section III proposes a cyber-net modelfor evaluation of the system vulnerability. Section IV addressesthe computational issue. Section V provides the simulation re-sults. Section VI gives the conclusion.
II. SYSTEM MODEL AND VULNERABILITIES
The control center cybernet environment, depicted in Fig. 1,describes the connectivity of the corporate networks that arenormally protected by firewalls. The control center networkis connected to other corporate networks and substation andpower plant networks maintained by information technologypersonnel. It is recognized that control center networks arehighly secured and therefore unlikely to be penetrated directly.In this research, the focus is on the intrusion to control centernetworks through other networks such as those networks at thesubstations or power plants.
Through an intranet, each of the geographically dispersedsubstations is set up with a dial-up network for maintenance pur-poses. In addition, wireless networks may be installed for local
communication. Virtual private network (VPN) is a cybersecu-rity technology used to connect with other corporate networks.
Remote logon programs in the VPN provide the capability tocontrol other machines within the networks. These access pointscan be password protected [1], [7], [20]. A successful intrusionto an Ethernet-based substation enables an attacker to performpotential damaging actions, such as opening breakers. This in-
cludes the creation of fake data to cause unwanted operations of protective devices [21].
Convenient access to Internet resources and online search ca-pabilities provide a systematic footprint for hackers to identifyan organization’s security posture. There are increasingly so-phisticated intrusion tools that include [20]:
1) War dialing—It can be executed in the scripts to the sur-rounding numbers to detect potential connection once themain phone number prefix is determined.
2) Scanning—It scans the destination IP addresses to deter-mine the service ports on the machine that are either run-ning or in listening state for connection to potential access
points.3) Traffic sniffing—The network analyzer is used to capturethe packets traversing within a network.
4) Password cracking—A program that repeatedly tries toguess a password in order to gain (unauthorized) access toa network.
With the available information and tools, there are severalpossible ways to penetrate existing connections of a network:1) VPN, 2) dial-up connections, 3) wireless connections, 4) anyremote logon programs, and 5) Trojan horses (on unknown ser-vice ports). Necessary information can be acquired from dif-ferent tools and resources to determine IP addresses in the net-works. Detection of a VPN connection by a hacker indicates
what the defenders are trying to protect. Trojan horses may useunknown service ports to establish a remote connection.
Authorized licensed use limited to: Iowa State University. Downloaded on January 11, 2009 at 21:05 from IEEE Xplore. Restrictions apply.
7/29/2019 IEEE-PS-08
http://slidepdf.com/reader/full/ieee-ps-08 3/11
1838 IEEE TRANSACTIONS ON POWER SYSTEMS, VOL. 23, NO. 4, NOVEMBER 2008
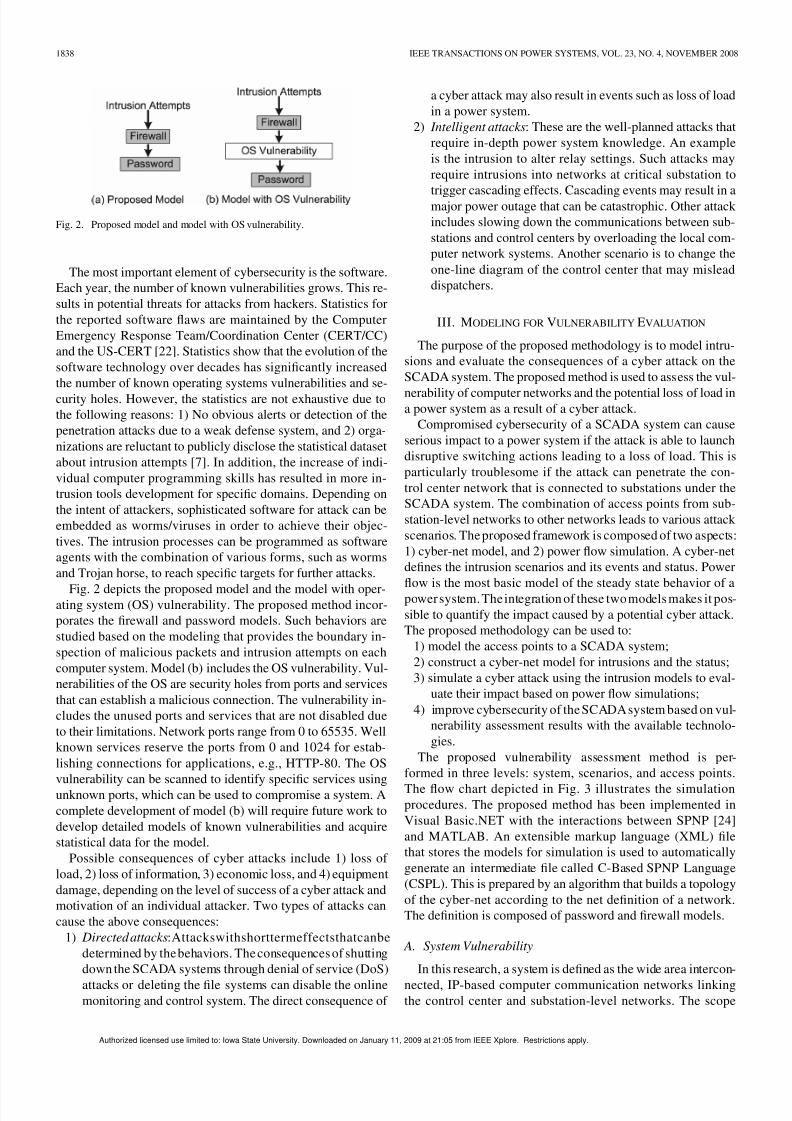
Fig. 2. Proposed model and model with OS vulnerability.
The most important element of cybersecurity is the software.Each year, the number of known vulnerabilities grows. This re-sults in potential threats for attacks from hackers. Statistics forthe reported software flaws are maintained by the ComputerEmergency Response Team/Coordination Center (CERT/CC)and the US-CERT [22]. Statistics show that the evolution of thesoftware technology over decades has significantly increasedthe number of known operating systems vulnerabilities and se-curity holes. However, the statistics are not exhaustive due tothe following reasons: 1) No obvious alerts or detection of thepenetration attacks due to a weak defense system, and 2) orga-nizations are reluctant to publicly disclose the statistical datasetabout intrusion attempts [7]. In addition, the increase of indi-vidual computer programming skills has resulted in more in-trusion tools development for specific domains. Depending onthe intent of attackers, sophisticated software for attack can beembedded as worms/viruses in order to achieve their objec-tives. The intrusion processes can be programmed as softwareagents with the combination of various forms, such as wormsand Trojan horse, to reach specific targets for further attacks.
Fig. 2 depicts the proposed model and the model with oper-ating system (OS) vulnerability. The proposed method incor-porates the firewall and password models. Such behaviors arestudied based on the modeling that provides the boundary in-spection of malicious packets and intrusion attempts on eachcomputer system. Model (b) includes the OS vulnerability. Vul-nerabilities of the OS are security holes from ports and servicesthat can establish a malicious connection. The vulnerability in-cludes the unused ports and services that are not disabled dueto their limitations. Network ports range from 0 to 65535. Wellknown services reserve the ports from 0 and 1024 for estab-lishing connections for applications, e.g., HTTP-80. The OS
vulnerability can be scanned to identify specific services usingunknown ports, which can be used to compromise a system. Acomplete development of model (b) will require future work todevelop detailed models of known vulnerabilities and acquirestatistical data for the model.
Possible consequences of cyber attacks include 1) loss of load, 2) loss of information, 3) economic loss, and 4) equipmentdamage, depending on the level of success of a cyber attack andmotivation of an individual attacker. Two types of attacks cancause the above consequences:
1) Directed attacks:Attackswithshorttermeffectsthatcanbedetermined by thebehaviors. The consequences of shuttingdown the SCADA systems through denial of service (DoS)
attacks or deleting the file systems can disable the onlinemonitoring and control system. The direct consequence of
a cyber attack may also result in events such as loss of loadin a power system.
2) Intelligent attacks: These are the well-planned attacks thatrequire in-depth power system knowledge. An exampleis the intrusion to alter relay settings. Such attacks mayrequire intrusions into networks at critical substation to
trigger cascading effects. Cascading events may result in amajor power outage that can be catastrophic. Other attackincludes slowing down the communications between sub-stations and control centers by overloading the local com-puter network systems. Another scenario is to change theone-line diagram of the control center that may misleaddispatchers.
III. MODELING FOR VULNERABILITY EVALUATION
The purpose of the proposed methodology is to model intru-sions and evaluate the consequences of a cyber attack on theSCADA system. The proposed method is used to assess the vul-
nerability of computer networks and the potential loss of load ina power system as a result of a cyber attack.
Compromised cybersecurity of a SCADA system can causeserious impact to a power system if the attack is able to launchdisruptive switching actions leading to a loss of load. This isparticularly troublesome if the attack can penetrate the con-trol center network that is connected to substations under theSCADA system. The combination of access points from sub-station-level networks to other networks leads to various attackscenarios. The proposed framework is composed of two aspects:1) cyber-net model, and 2) power flow simulation. A cyber-netdefines the intrusion scenarios and its events and status. Power
flow is the most basic model of the steady state behavior of apowersystem. Theintegration of these twomodels makes it pos-sible to quantify the impact caused by a potential cyber attack.The proposed methodology can be used to:
1) model the access points to a SCADA system;2) construct a cyber-net model for intrusions and the status;3) simulate a cyber attack using the intrusion models to eval-
uate their impact based on power flow simulations;4) improve cybersecurity of the SCADAsystem based on vul-
nerability assessment results with the available technolo-gies.
The proposed vulnerability assessment method is per-formed in three levels: system, scenarios, and access points.
The flow chart depicted in Fig. 3 illustrates the simulationprocedures. The proposed method has been implemented inVisual Basic.NET with the interactions between SPNP [24]and MATLAB. An extensible markup language (XML) filethat stores the models for simulation is used to automaticallygenerate an intermediate file called C-Based SPNP Language(CSPL). This is prepared by an algorithm that builds a topologyof the cyber-net according to the net definition of a network.The definition is composed of password and firewall models.
A. System Vulnerability
In this research, a system is defined as the wide area intercon-
nected, IP-based computer communication networks linkingthe control center and substation-level networks. The scope
Authorized licensed use limited to: Iowa State University. Downloaded on January 11, 2009 at 21:05 from IEEE Xplore. Restrictions apply.

7/29/2019 IEEE-PS-08
http://slidepdf.com/reader/full/ieee-ps-08 4/11
TEN et al.: VULNERABILITY ASSESSMENT OF CYBERSECURITY FOR SCADA SYSTEMS 1839
Fig. 3. Flowchart for proposed vulnerability assessment framework.
of this research is defined based on the following practicalconsiderations.
• Each intrusion scenario through a substation-level networkis an independent event that has no correlation with intru-sion scenarios on other substations.
• A “direct” connection through local access to the (highly-secured) control center network is unlikely. However, aconnection to the control center from substation-level net-works can be established through VPN or other remote
logon systems.As shown in the following, system vulnerability, , is deter-
mined the maximum vulnerability level over a set of scenariosrepresented by :
(1)
B. Scenario Vulnerability
An intrusion scenario consists of the steps taken by an at-tempted attack from a substation-level network through a local
or outside network that is targeted at the SCADA system in thecontrol center. Substation-level networks in a power system are
connected to generator and/or load. These substation-level net-works areassociatedwith substation automation systems, powerplant control systems, or distribution operating centers.
The total set of scenarios depends on the number of substa-tions that are installed with the IP-based system for communi-cations. For a given scenario associated with a substation, there
are three cases depending on the supervisory control privileges:1) substation with no load or generator, 2) substation with load,and 3) substation with load and generator. These cases are con-sidered in the logic- and power flow-based evaluations of eachscenario. Each specific scenario is evaluated to determine theimpact based on the potential loss of load. The total set of sce-narios includes all attack scenarios through access points inthe networks. The scenario vulnerability is defined by
(2)
where is the number of intrusion scenarios to be evaluated.
C. Access Point Vulnerability
An access point provides the port services to establish a con-nection for an intruder to penetrate the SCADA computer sys-tems. The vulnerability of a scenario , , through an accesspoint is evaluated to determine its potential impact. For a setof access points to the SCADA system , the scenario vulner-ability is a weighted sum of the potential damages over the set
. The scenario vulnerability for a scenario is defined by
(3)
where is the steady state probability that a SCADA systemis attacked through a specific access point , which is linked tothe SCADA system. The impact factor, , represents the levelof impact on a power system when a substation is removed, i.e.,electrically disconnected, by switching actions due to the attack.The impact caused by an attack through an access point willbe evaluated by a logic- and power flow-based procedure. Thesteady state probabilities will be determined from a cyber-netmodel. They will be discussed further later in this section.
Since attacks occur randomly, a stochastic process is neededfor the model. In this study, the intrusion and cyber-net are mod-
eled by a generalized stochastic Petri net (GSPN) model [23].The states of the stochastic process are the status of intrusions toa network that are inferred from the abnormal activities. Theseinclude malicious packets flowing through predefined firewallrules and failed logon password on the computer system. Tran-sition probabilities are obtained from the abnormal activity datain the system.
A GSPN consists of two different transition classes: imme-
diate and timed transitions. As depicted in Fig. 4, which is anillustration of a firewall model that will be elaborated later, astatus node is represented by a circle. An arrow head denotesa transition of the system status. An immediate transitionis shown as a solid bar. Immediate transitions are assigned
probability values. Timed transitions denoted by empty barshave delay times associated with the response that an attacker
Authorized licensed use limited to: Iowa State University. Downloaded on January 11, 2009 at 21:05 from IEEE Xplore. Restrictions apply.

7/29/2019 IEEE-PS-08
http://slidepdf.com/reader/full/ieee-ps-08 5/11
1840 IEEE TRANSACTIONS ON POWER SYSTEMS, VOL. 23, NO. 4, NOVEMBER 2008
Fig. 4. Firewall model with malicious rules.
receives from the system. Tokens (dots inside a circle) are usedto model the number of intrusion attempts where an attackstarts. Token passing describes the change of each transition, ormarking.
SCADA systems typically have specially designed firewallrules and password policies to achieve a high level of com-puter security. There are two submodels in a cyber-net: Fire-
wall model and Password model. These models support the highlevel of abstractions on penetration transitions for each scenario.
The transition probability and rates for each submodel will bedetailed.
1) Firewall Model: A firewall is a technology of cybersecu-rity defense that regulates the packets flowing between two net-works. As there may be different security trust levels betweennetworks, a set of firewall rules is configured to filter out unnec-essary traffic. These rules are written with the following criteriafor acceptance or rejection:
1) type of protocols;2) incoming and outgoing traffic;3) specific port service or a port service range;4) specific IP address or an IP address range.
These audit fields are recorded in a firewall and are used offlineby a system administrator to analyze malicious behaviors. Dueto the high volume of daily network traffic, it is not practical fora system administrator to monitor the network with the avail-able datasets. Thus, an add-on commercial firewall analyzer isimplemented to detect anomalies in these datasets.
The malicious packets flowing through a firewall must beidentified. Together with the traffic denied by the firewall, suchdata can determine the probability of cyber attack occurrenceseither being granted access or being attempted. These datasetscan be analyzed from the firewall logs in two ways:
1) the number of records rejected compared to the totalnumber of firewall traffic records, and
2) the number of malicious records bypassing compared withtotal records for each rule.
The firewall model depicted in Fig. 4 includes paths corre-sponding to rules in the firewall model. The attacker receivesresponses from the system through the feedback paths startingwith the circles representing rules. The paths vertically passingthe circles representing rules are successful attempts.
This model consists of two terminals that can be connected to
other submodels. For instance, a network that consists of threezones, including a demilitarized zone (DMZ), can be modeledby connecting two firewall models in series. The construction of the model conforms to the number of rules that are implementedin the firewall. In case the number of firewall rules is large, onlya subset of rules considered potentially malicious are includedin the formulation. The submodel consists of circles that arethe states representing the denial or access of each rule. Eachsolid bar is assigned a firewall penetration probability that canbe calculated from firewall logs. The transition probability of malicious packets going through a firewall with respect to anindividual rule can be evaluated by
(4)
In the above equation, only the malicious packets travelingthrough any policy rule on each firewall are taken intoaccount. The probability of malicious packets traveling througha firewall rule policy is the ratio of and , where
denotes the frequency of malicious packets through the
firewall rule, and is the total record of firewall rule .
Similarly, the probability of the packets being rejectedcan be evaluated by the ratio of to , where is thenumber of rejected packets and denotes the total numberof packets in the firewall logs. The empty bars represent timeddelay transitions for the firewall execution rate and averageresponse rate. The firewall execution rate, , is the number of instructions executed per second. This value estimates the timerequired to validate the rules traveling through the firewall.The average response rate depends on the network trafficcondition that can be estimated using commands.
2) Password Model: The password model is used to evaluatepenetration attempts based on repeatedly failed logons without
establishing authentication credentials. The mechanism forstoring these failed logon trials, or other security-relevantevents, is embedded in the computer system for analysis, e.g.,security logs from event viewer in the Windows platform. Thismodel includes two components: failed logon probability andthe response rate. The probability is evaluated by the number of failed logons. The response rate is the central processing unit(CPU) clock rate, which represents the performance of a com-puter system that validates the credentials of a user. These twocomponents provide a means for evaluating intrusion attemptbehavior with respect to how fast each attempt can be madeon each machine. In addition, the anomaly profile, discernedstatistically from failed authentication, enables an estimation of
the expected behavior (attempted intrusions) that has occurredover time.
Authorized licensed use limited to: Iowa State University. Downloaded on January 11, 2009 at 21:05 from IEEE Xplore. Restrictions apply.

7/29/2019 IEEE-PS-08
http://slidepdf.com/reader/full/ieee-ps-08 6/11
TEN et al.: VULNERABILITY ASSESSMENT OF CYBERSECURITY FOR SCADA SYSTEMS 1841
Fig. 5. Password model.
The password model shown in Fig. 5 consists of two statusnodes and two types of transitions representing the intrusionstatus to a computer system. The intrusion attempt to a machineis modeled by a transition probability associated with a solid
bar. An empty bar represents the processing execution rate thatresponds to the attacker. To model this behavior as a defense, anaccount lockout feature, with a limited number of attempts, canbe simulated by initiating the number of tokens (passwordpolicy threshold). The tokens are independent of the user typesand privileges.
The transition probability can be estimated by
(5)
For a computer system , the probability is evaluated based onthe number of intrusion attempts and the total number of observed records . A successful logon within a specifiedtime interval, i.e., a minute after two failed logons, does notcount toward the number of intrusion attempts; they are consid-ered typographical errors from authorized users. The responserate is the time delay of iterative logons to estimate the nextattempt, assuming there is a tool that automates the process.
D. Quantitative Analysis of Cyber-Net
A cyber-net is a composite model that is formulated by the
combination of the firewall and password models. These sub-models are used for the analysis of a compromised SCADAsystem. A cyber-net based on the computer network connec-tivity is illustrated in Fig. 7. The cyber-net contains modulesrepresenting several networks located at the power plant (bold-faced in Fig. 7), substation, distribution operating center, and acontrol center. Within each module, the firewall and passwordmodels for that network are shown.
An example given in Fig. 6 illustrates a cyber-net (shownon right side) representing a substation network (shown on leftside). The settings of each IED are configured on the computersthat are mapped to the data points for communication purposes.For a successful intrusion to the network, the steps for a cyber at-
tack involve 1) identification of the availability of the computersystem in the network, 2) attempt to intrude into the computer
Fig. 6. Formulation of cyber-net with firewall and password models.
systems, and 3) learning how to perform an attack through theSCADA system.
Since these computers provide supervisory control capabil-ities, it is important to model these with password models. Inthis setup, a cyber-net is the composite of a firewall model andtwo password models for analysis of the malicious behaviors.Suppose the (fictitious) probabilities for each firewall rule are
, and packet rejection. An estimated 10% failed logons is assumed
for both machines. The rates are assumed to be by, and . These values are ob-
tained by random number generators. The reachability graph of this example is shown in Fig. 6. The 7 reachable states are ob-tained by initiating a token from the top in Fig. 6. A label of
inside a circle in Fig. 8 indicates a reachable state. The transi-tion probabilities and rates are the given parameters assigned oneach directed arc.
Overall, the transition probabilities can be composed into ma-trix with respect to the marking sets for immediate and timedtransitions in the following:
(6)
The matrix corresponds to markings induced by immediate
transitions; submatrix moves from immediate to immediatemarkings and submatrix moves from immediate to timedmarkings. The second row of the block matrix has similarproperties where its submatrix moves from timed transitionsto immediate transitions and submatrix represents mark-ings within timed transitions. Using parameter values of theexample, the matrix is constructed as follows. Since thereare 4 for this example, the dimensions of , , , are 4by 4, 4 by 3, 3 by 4 and 3 by 3, respectively. The columnsare the markings sorted in this order where , , , ,are induced by immediate transitions and , , areinduced by timed transitions. The first row of represents thetransitions from to , , , (immediate) and ,
, (timed). The probability or rate for each transitioncan be computed by the weighted sum of probabilities or
Authorized licensed use limited to: Iowa State University. Downloaded on January 11, 2009 at 21:05 from IEEE Xplore. Restrictions apply.

7/29/2019 IEEE-PS-08
http://slidepdf.com/reader/full/ieee-ps-08 7/11
1842 IEEE TRANSACTIONS ON POWER SYSTEMS, VOL. 23, NO. 4, NOVEMBER 2008
Fig. 7. Construction of cyber-net based on substation with load and generator (model 3).
rates, e.g., ,, and
The solution of the linear system is expressed as [23]
(7)
where and are the marking sets for immediate and timedtransitions, respectively. The vector denotes steady state prob-abilities for the states of the embedded Markov chain (EMC).This is interpreted in terms of the number of state transitions.Using the fact that the time spent for each marking induced byan immediate transition is zero, can be reduced to a smallermatrix, , where only quantities directly related to timed tran-sitions is of interest. To reduce the state transition probabilityof EMC, it can be rewritten as in the following form [23]:
(8)
where is needed by the probabilitiesmoving within the markings from immediate transitions instep. For the value of , can be obtained as
Solving the linear equation ; andyields , indicating that . The steady stateprobabilities can be obtained by weighting each entry withthesojourn time of corresponding markings [23]. Themean timethat a process spends in state between the visits to is
given by
(9)
where and denote the enabled transition markings andtransition, respectively. The time units spent, on the average, instate is the mean cycle (recurrence) time that follows:
(10)
Authorized licensed use limited to: Iowa State University. Downloaded on January 11, 2009 at 21:05 from IEEE Xplore. Restrictions apply.
7/29/2019 IEEE-PS-08
http://slidepdf.com/reader/full/ieee-ps-08 8/11
TEN et al.: VULNERABILITY ASSESSMENT OF CYBERSECURITY FOR SCADA SYSTEMS 1843
Fig. 8. Reachability graph of cyber-net (one-firewall-two-machines).
In general, the steady state probabilities of the stochasticprocess can be determined by
(11)
where the mean time spent in marking is divided by themean cycle time. By applying (11) and is de-termined, the steady state distribution for and are both
.The correlation between the historical data and factor is
based on the construction of the composition of cyber-net andthe probabilities associated with the Petri net transitions. The
probability also depends on the rule set corresponding toeach firewall and the number of computers in the network. Theweighted sum of steady-state probabilities among the SCADAsystems in (3) provides a measure of the system vulnerability.
E. Evaluation of Impact Factor
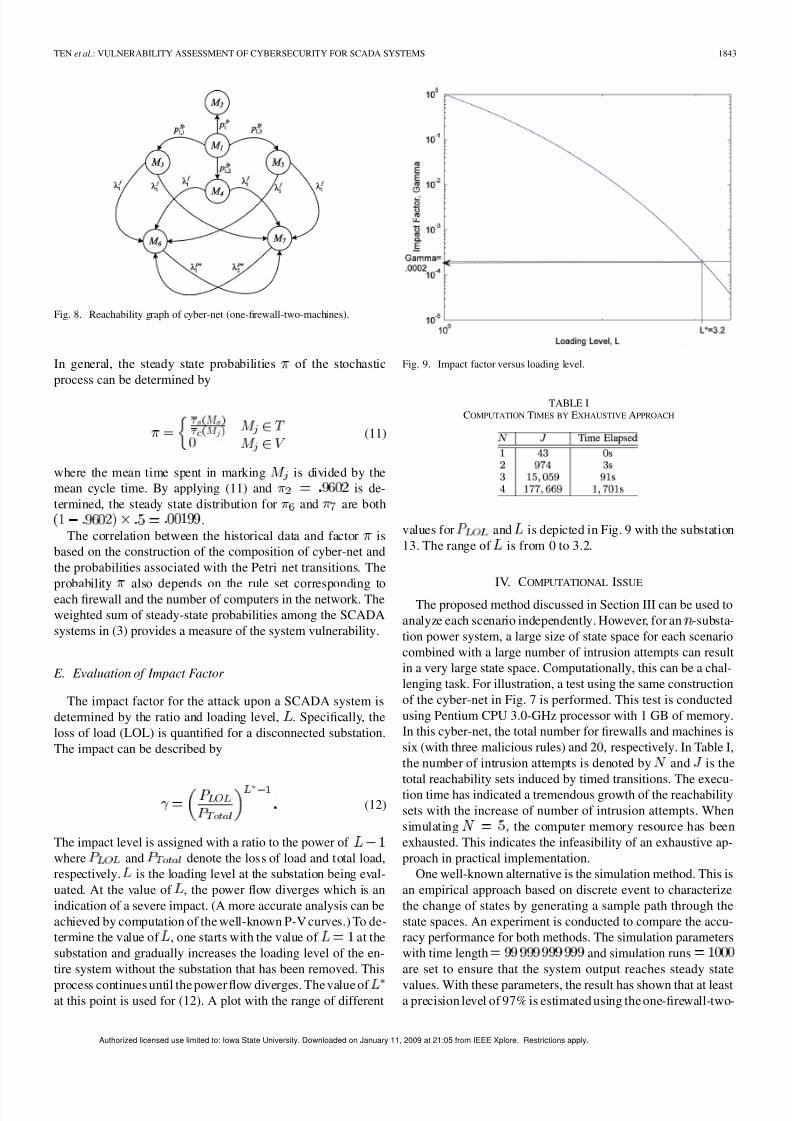
The impact factor for the attack upon a SCADA system isdetermined by the ratio and loading level, . Specifically, theloss of load (LOL) is quantified for a disconnected substation.The impact can be described by
(12)
The impact level is assigned with a ratio to the power of where and denote the loss of load and total load,respectively. is the loading level at the substation being eval-uated. At the value of , the power flow diverges which is anindication of a severe impact. (A more accurate analysis can beachieved by computation of the well-known P-V curves.) To de-termine the value of , one starts with the value of at thesubstation and gradually increases the loading level of the en-tire system without the substation that has been removed. This
process continues until the power flow diverges. The value of at this point is used for (12). A plot with the range of different
Fig. 9. Impact factor versus loading level.
TABLE ICOMPUTATION TIMES BY EXHAUSTIVE APPROACH
values for and is depicted in Fig. 9 with the substation13. The range of is from 0 to 3.2.
IV. COMPUTATIONAL ISSUE
The proposed method discussed in Section III can be used toanalyze each scenario independently. However, for an -substa-tion power system, a large size of state space for each scenariocombined with a large number of intrusion attempts can resultin a very large state space. Computationally, this can be a chal-lenging task. For illustration, a test using the same constructionof the cyber-net in Fig. 7 is performed. This test is conductedusing Pentium CPU 3.0-GHz processor with 1 GB of memory.In this cyber-net, the total number for firewalls and machines issix (with three malicious rules) and 20, respectively. In Table I,the number of intrusion attempts is denoted by and is the
total reachability sets induced by timed transitions. The execu-tion time has indicated a tremendous growth of the reachabilitysets with the increase of number of intrusion attempts. Whensimulating , the computer memory resource has beenexhausted. This indicates the infeasibility of an exhaustive ap-proach in practical implementation.
One well-known alternative is the simulation method. This isan empirical approach based on discrete event to characterizethe change of states by generating a sample path through thestate spaces. An experiment is conducted to compare the accu-racy performance for both methods. The simulation parameterswith time length and simulation runsare set to ensure that the system output reaches steady state
values. With these parameters, the result has shown that at leasta precision level of 97% is estimated using the one-firewall-two-
Authorized licensed use limited to: Iowa State University. Downloaded on January 11, 2009 at 21:05 from IEEE Xplore. Restrictions apply.

7/29/2019 IEEE-PS-08
http://slidepdf.com/reader/full/ieee-ps-08 9/11
1844 IEEE TRANSACTIONS ON POWER SYSTEMS, VOL. 23, NO. 4, NOVEMBER 2008
Fig. 10. Case setup for IEEE 30-bus system.
machines example, i.e.,. The simulation time takes approximately 3–6 min. These
parameters will be used in Section V.
V. VULNERABILITY EVALUATION AND IMPACT STUDIESThe case studies are based on the IEEE 30-bus system. Sim-
ulations are performed to evaluate the scenario vulnerability.
A. IEEE Case Study and Implementations
The wide area communication link between a control centernetwork and substation-level networks is depicted in Fig. 10. Inthis test case, there are 24 substations associated to 30 buses.The link of each substation-level network (denoted as sub. inthe figure) is represented in any of the three models, Model 1–3.Model 3 means that there are three possible access points thatcan be established to the network. Connections can be made toa substation network from a power plant network or a distribu-tion operating center. Models 1 and 2 are set up without othersubnetworks. Connections between any two networks are pro-tected by firewalls. Each model consists of a number of firewalland password models.
B. Simulation Results
The attacks launched from different locations will result indifferent levels of vulnerability. Two cases for vulnerabilityevaluations are considered:
1) an attack from outside the substation-level networks;2) an attack from within the substation networks.
Case 1 is initiated by hackers from outside of the network who
are trying to reach one of the substation networks. Case 2 can becaused by an inadequate physical defense around the substation.
TABLE IISTEADY STATE PROBABILITIES FOR SUB. 1 AND SUB. 22
The simulation showing the substation itself is demonstratedby shifting the token, where it starts from A to C in Fig. 7, toindicate where the intrusion attempts are launched, i.e., withinthe substation network. The purpose here is to determine theexisting vulnerability level for both cases and identify measures
for improvement.The following table is the steady state probabilities for intru-sion scenario of sub. 1 in Fig. 10. Each probability is a steadystate value for each computer system under supervisory controllocated at different locations. The analysis includes calculationsof the steady state probabilities from both outside and inside thesubstation. Given the steady state probabilities for an intrusionscenario, the scenario vulnerability from outside can be com-puted using (3) as follows:
This evaluation involves two parts: the attack of sub. 1 networkand the attack of control center from the networks (denoted as
) where and are the sets of machines at each network;and . The
steady state probabilities for each network are evaluated sep-arately, corresponding to different impacts. Likewise, the sce-nario vulnerability from inside is .9230. Using the same evalu-ation, the complete set of scenario vulnerability is evaluated inTable II. The first and second columns are the substation andassociated buses. As shown in Table III, each bus corresponds
to a substation except for sub. 4, sub. 6, and sub. 22. Column3 indicates the expected loss of load for each substation underattack, column 4 is the maximum loading level, and column 5is the impact factor.
To support an intuitive judgment, Table II shows steady stateprobabilities for an attack through sub. 1 (Model 3) comparedwith another attack through sub. 22 (Model 1). The two substa-tions use different models, i.e., Model 1 and Model 3 in Fig. 10,for the purpose of comparison. Assuming that comparable com-puter systems are used, the use of a smaller scale substationcomputer network can lead to a higher level of vulnerability.This is due to the fact that on a smaller scale computer network itmay be easier to identify the target for attack. The scenario vul-
nerability indices for substations 22 and 1 are .2329 and .1513,respectively, indicating that substation 22 is more vulnerable.
Authorized licensed use limited to: Iowa State University. Downloaded on January 11, 2009 at 21:05 from IEEE Xplore. Restrictions apply.
7/29/2019 IEEE-PS-08
http://slidepdf.com/reader/full/ieee-ps-08 10/11
TEN et al.: VULNERABILITY ASSESSMENT OF CYBERSECURITY FOR SCADA SYSTEMS 1845
TABLE IIIIMPACT FACTOR FOR EACH SUBSTATION
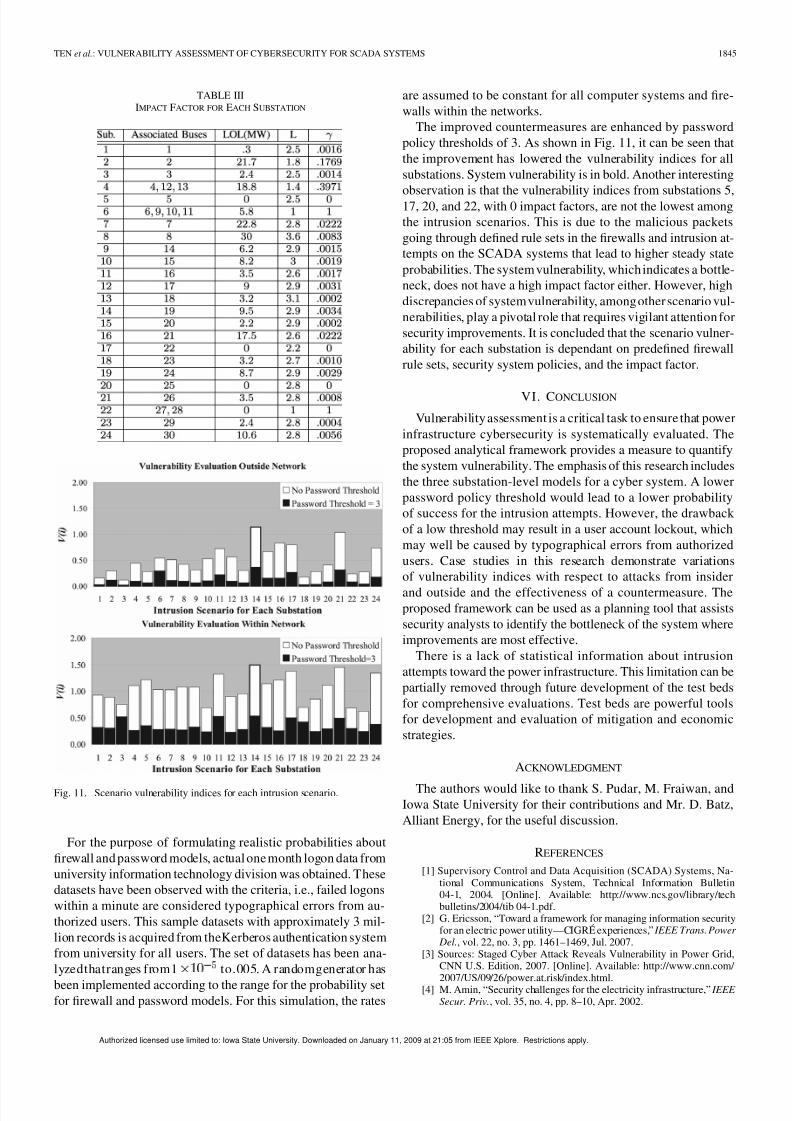
Fig. 11. Scenario vulnerability indices for each intrusion scenario.
For the purpose of formulating realistic probabilities aboutfirewall and password models, actual onemonth logon data fromuniversity information technology division was obtained. Thesedatasets have been observed with the criteria, i.e., failed logonswithin a minute are considered typographical errors from au-thorized users. This sample datasets with approximately 3 mil-lion records is acquired from theKerberos authentication systemfrom university for all users. The set of datasets has been ana-lyzedthatranges from1 to.005. A randomgenerator has
been implemented according to the range for the probability setfor firewall and password models. For this simulation, the rates
are assumed to be constant for all computer systems and fire-walls within the networks.
The improved countermeasures are enhanced by passwordpolicy thresholds of 3. As shown in Fig. 11, it can be seen thatthe improvement has lowered the vulnerability indices for allsubstations. System vulnerability is in bold. Another interesting
observation is that the vulnerability indices from substations 5,17, 20, and 22, with 0 impact factors, are not the lowest amongthe intrusion scenarios. This is due to the malicious packetsgoing through defined rule sets in the firewalls and intrusion at-tempts on the SCADA systems that lead to higher steady stateprobabilities. The system vulnerability, whichindicates a bottle-neck, does not have a high impact factor either. However, highdiscrepancies of systemvulnerability, amongotherscenario vul-nerabilities, play a pivotal role that requires vigilant attention forsecurity improvements. It is concluded that the scenario vulner-ability for each substation is dependant on predefined firewallrule sets, security system policies, and the impact factor.
VI. CONCLUSION
Vulnerability assessment is a critical task to ensure that powerinfrastructure cybersecurity is systematically evaluated. Theproposed analytical framework provides a measure to quantifythe system vulnerability. The emphasis of this research includesthe three substation-level models for a cyber system. A lowerpassword policy threshold would lead to a lower probabilityof success for the intrusion attempts. However, the drawbackof a low threshold may result in a user account lockout, whichmay well be caused by typographical errors from authorizedusers. Case studies in this research demonstrate variationsof vulnerability indices with respect to attacks from insider
and outside and the effectiveness of a countermeasure. Theproposed framework can be used as a planning tool that assistssecurity analysts to identify the bottleneck of the system whereimprovements are most effective.
There is a lack of statistical information about intrusionattempts toward the power infrastructure. This limitation can bepartially removed through future development of the test bedsfor comprehensive evaluations. Test beds are powerful toolsfor development and evaluation of mitigation and economicstrategies.
ACKNOWLEDGMENT
The authors would like to thank S. Pudar, M. Fraiwan, andIowa State University for their contributions and Mr. D. Batz,Alliant Energy, for the useful discussion.
REFERENCES
[1] Supervisory Control and Data Acquisition (SCADA) Systems, Na-tional Communications System, Technical Information Bulletin04-1, 2004. [Online]. Available: http://www.ncs.gov/library/techbulletins/2004/tib 04-1.pdf.
[2] G. Ericsson, “Toward a framework for managing information securityfor an electric power utility—CIGRÉ experiences,” IEEE Trans. Power
Del., vol. 22, no. 3, pp. 1461–1469, Jul. 2007.[3] Sources: Staged Cyber Attack Reveals Vulnerability in Power Grid,
CNN U.S. Edition, 2007. [Online]. Available: http://www.cnn.com/
2007/US/09/26/power.at.risk/index.html.[4] M. Amin, “Security challenges for the electricity infrastructure,” IEEE
Secur. Priv., vol. 35, no. 4, pp. 8–10, Apr. 2002.
Authorized licensed use limited to: Iowa State University. Downloaded on January 11, 2009 at 21:05 from IEEE Xplore. Restrictions apply.

7/29/2019 IEEE-PS-08
http://slidepdf.com/reader/full/ieee-ps-08 11/11
1846 IEEE TRANSACTIONS ON POWER SYSTEMS, VOL. 23, NO. 4, NOVEMBER 2008
[5] Twenty-One Steps to Improve Cybersecurity of SCADA Net-works. [Online]. Available: http://www.tswg.org/tswg/ip/21 StepsSCADA.pdf.
[6] “Security for Information Systems and Intranets for Electric PowerSystems,” ELECTRA Tech. Brochure, vol. 231, no.317,pp. 70–81, Apr.2007.
[7] Information Security: Technologies to Secure Federal Systems,Government Accountability Office (GAO) Report to Congressional
Requesters, 2004. [Online]. Available: http://www.gao.gov/cgibin/ getrpt?GAO-04-467.[8] G. Dondossola, G. Deconinck, F. D. Giandomenico, S. Donatelli, M.
Kaaniche, and P. Verissimo, “Critical utility infrastructural resilience,”in Proc. Complex Network and Infrastructure Protection, Rome, Italy,Mar. 28-29, 2006.
[9] Z.Xie,G.Manimaran,V.Vittal,A.G.Phadke,andV.Centeno,“Anin-formation architecture for future power system and its reliability anal-ysis,” IEEE Trans. Power Syst., vol. 17, no. 3, pp. 857–863, Aug. 2002.
[10] K. Schneider, C.-C. Liu, and J.-P. Paul, “Assessment of interactionsbetween power and telecommunications infrastructures,” IEEE Trans.
Power Syst., vol. 21, no. 3, pp. 1123–1130, Aug. 2006.[11] C. M. Davis, J. E. Tate, H. Okhravl, C. Grier, T. J. Overbye, and D.
Nicol, “SCADA cybersecurity test bed development,” in Proc. 38th North Amer. Power Symp., Sep. 2006, pp. 483–488.
[12] J. Tang, R. Hovsapian, M. Sloderbeck, J. Langston, R. Meeker, P. G.McLaren, D. Becker, B. Richardson, M. Baca, J. Trent, Z. Hartley,
and R. P. Smith, “The CAPS-SNL power system security test bed,”in Proc. CRIS, 3rd Int. Conf. Critical Infrastructures, Alexandria, VA,Sep. 2006.
[13] R. E. Carlson, J. E. Dagle, S. A. Shamsuddin, and R. P. Evans,Nation Test Bed: A Summary of Control System Security Stan-dards Activities in the Energy Sector, 2005. [Online]. Avail-able: http://inl.gov/scada/publications/d/a_summary_of_con-trol_system_security _standards_activities_in_the_energy_sector.pdf.
[14] R. A. León, V. Vittal, and G. Manimaran, “Application of sensornetwork for secure electric energy infrastructure,” IEEE Trans. Power
Del., vol. 22, no. 2, pp. 1021–1028, Apr. 2007.[15] D. M. Nicol, W. H. Sanders, and K. S. Trivedi, “Model-based eval-
uation from dependability to security,” IEEE Trans. Depend. Secure
Comput., vol. 1, no. 1, pp. 48–65, Jan.–Mar. 2004.[16] N. Ye, J. Giordano, and J. Feldman, “A process control approach to
cyber attack detection,” Commun. ACM , vol. 44, no. 8, pp. 76–82, Aug.2001.
[17] F. Cleveland, “IEC TC57 security standards for power system’s in-formation infrastructure—Beyond simple encryption,” in Proc. IEEE
Power Eng. Soc. General Meeting, Tampa, FL, 2007.[18] R. E. Carlson, J. E. Dagle, S. A. Shamsuddin, and R. P. Evans, “A
summary of control system security standards activities in the energysector,” DOE Office of Electricity Delivery and Energy Reliability, Oct.2005.
[19] C.-W.Ten, C.-C. Liu, and G. Manimaran, “Vulnerability assessment of cybersecurity for SCADA systems using attack trees,” in Proc. IEEE
Power Eng. Soc. General Meeting 2007 , Jun. 24–28, 2007, pp. 1–8.[20] S. McClure,J. Scambray, andG. Kurtz , Hacking Exposed: Network Se-
curity Secrets and Solutions, 4th ed. Emeryville, CA: McGraw-Hill/ Osborne, 2003.
[21] S. Su, W.-L. Chan, K.-K. Li, X. Duan, and X. Zeng, “Context informa-tion-based cybersecurity defense of protection system,” IEEE Trans.
Power Del., vol. 22, no. 3, pp. 1477–1481, Jul. 2007.
[22] Computer Emergency Response Team/Coordination Center(CERT/CC) Statistics, Carnegie Mellon Univ. [Online]. Avail-able: http://www.cert.org/stats/fullstats.html.
[23] F. Bause and P. S. Kritzinger , Stochastic Petri Nets: An Introduction to
the Theory, 2nd ed. Braunschweig, Germany: Vieweg & Sohn Ver-lagsgesellschaft mbH, 2002.
[24] G. Ciardo, J. Muppala, and K. Trivedi, User Manual for SPNP: Sto-chastic Petri Net Package. [Online]. Available: http://www.ee.duke.edu/~chirel/MANUAL/manual.pdf.
Chee-Wooi Ten (S’00) received the B.S.E.E. andM.S.E.E. degrees from Iowa State University, Ames,in 1999 and 2001, respectively. He is currentlypursuing the Ph.D. degree at Iowa State University.
He was an Application Engineer with Siemens En-ergy Management and Information System (SEMIS)in Singapore from 2002 to 2005. His research inter-ests include interdependency modeling and applica-tions for power infrastructure.
Chen-Ching Liu (F’94) received the Ph.D. degreefrom the University of California, Berkeley.
He is currently Palmer Chair Professor of Elec-trical and Computer Engineering at Iowa State Uni-versity, Ames. During 1983–2005, he was a Professorof Electrical Engineering at the University of Wash-ington, Seattle, where he also served as an AssociateDean of Engineering from 2000–2005.
Dr. Liureceivedan IEEE Third Millennium Medalin 2000 and the IEEE Power Engineering SocietyOutstanding Power Engineering Educator Award
in 2004. He served as Chair of the Technical Committee on Power SystemAnalysis, Computing, and Economics (PSACE), IEEE Power EngineeringSociety.
Govindarasu Manimaran (M’99) received thePh.D. degree in computer science and engineeringfrom the Indian Institute of Technology (IIT)Madras, India, in 1998.
He is currently an Associate Professor in the De-partment of Electrical and Computer Engineering atIowa State University (ISU), Ames. His research ex-pertise is in theareasof resource management in real-time systems and networks, overlay networks, net-work security, and their applications to critical in-frastructures such as electric grid. He has published
over 100 peer-reviewed research publications and is the coauthor of Resource
Management in Real-Time Systems and Networks (Cambridge, MA: MIT Press,2001). He has given tutorials on Internet infrastructure security in conferences,such as IEEE Infocom 2004and IEEEComSoc Tutorials Now (2004) andserved
as workshops cochair, symposium cochair,and session chairon many occasions.Dr. Manimaran received the Young Engineering Research Faculty Award atISU in 2003.