iese cities in motion methodology and … · in recent decades, national and international entities...
TRANSCRIPT

IESE CITIES IN MOTIONMETHODOLOGY AND MODELINGINDEX 2014
Center forGlobalizationand Strategy

ST-335-E
May 2014
Cities in Motion - Index 2014 Methodology and Modeling
About Us
IESE Cities in Motion Strategies is a research platform launched jointly by the Center for
Globalization and Strategy and the Department of Strategy at the IESE Business School.
The initiative unites a worldwide network of experts on cities and specialized private companies
with local administrations from around the world, with the objective of developing valuable ideas
and innovative tools that can lead to more sustainable, smarter cities and promote changes at the
local level.
The platform’s mission is to promote the model of Cities in Motion, which includes an innovative
approach to the governance of cities and a new urban model for the twenty-first century based on
four main factors: a sustainable ecosystem, innovative activities, equality among citizens and a
well-connected territory.

2 IESE Business School-University of Navarra
Cities in Motion - Index 2014 ST-335-E
Sponsors
Work Team
Academic Team
Professor Pascual Berrone, Schneider Electric Chair of Sustainability and Strategy
Professor Joan Enric Ricart, Carl Schroeder Chair of Strategic Management
Carlos Carrasco, research assistant
Roger Ricart, research assistant
Consulting Team
Juan Manuel Barrionuevo, president of the Advisory Board of the IESE Cities in Motion
platform
Technical Team
David Augusto Giuliodori, Econfocus Consulting
Franco Boneu, Econfocus Consulting
María Andrea Giuliodori, independent researcher
3 IESE Business School-University of Navarra
Cities in Motion - Index 2014
ST-335-E
Table of Contents
Introduction 4
Background Information 4
Critical Analysis of Indicators 5
Cities in Motion: A Synthetic Indicator 8
Selection of Techniques for Calculation of the Synthetic Indicators 11
Calculation Methodologies 13
1. Indicators 13
Governance 13
Urban Planning 13
Public Management 14
Technology 14
The Environment 15
International Outreach 15
Social Cohesion 16
Mobility and Transportation 16
Human Capital 16
The Economy 17
2. Base Period 20
3. Standardization of Variables 20
4. Assignment of Missing Values. Clusters. 20
Calculation Process 21
I. Initial Stage: Missing Values 21
City Clusters: 22
Country Clusters: 22
a) Simple Weighting Method: Calculation 22
Stage I: Standardization 22
Stage II: Calculation of the Synthetic Index for Each Dimension 22
Stage III: Calculation of the ICIM 22
b) DP2 Technique: Calculation 23
Stage I: Calculation of the Synthetic Index for the Dimension 23
Stage II: Calculation of the ICIM 24
c) Mixed DP2-Participatory Method: Calculation 24
II. Final Stage: Changing the Scale of the Indicators 25
Stage III: Selection of Cities to Include in the Calculation 25
Sensitivity Analysis 26
Bibliographic References 36

4 IESE Business School-University of Navarra
Cities in Motion - Index 2014 ST-335-E
Introduction: The Need for a Global Vision
The purpose of this document is to develop a
model for the creation of a compound index
that makes it possible to measure the future
sustainability of the largest cities in the world
and their inhabitants’ standard of living. The
theoretical model of this compound indicator
includes 10 dimensions which, once
synthesized and weighted into a single value,
allow us to perform a comparison between
cities in terms of their sustainability and
standard of living, as well as the changes in
each city over time.
In this study, we have taken into account the
10 dimensions listed below. They encompass
various aspects that make a city sustainable
and improve the standard of living for its
people:
1. Governance and Citizen Participation
2. Urban Planning
3. Public Management
4. Technology
5. The Environment
6. International Outreach
7. Social Cohesion
8. Mobility and Transportation
9. Human Capital
10. The Economy
Research into the aspects that characterize
cities as a social collective, both in the present
and for the future, shows that the above
dimensions, though they may not include
every factor in the complex life of cities, do
encompass the aspects that we intend to
measure in this study to a great extent. The
methodology for creating and selecting the
model, the dimensions and the indicators is
described in the following sections.
The period examined in the study includes the
years 2011, 2012 and 2013 for all of the cities.
This time interval was selected on the basis of
the availability and quality of the data needed
to create the index. The selected base year is
2011, a choice that responded to its relative
economic and social stability and to the fact
that a greater amount of information was
available for that year, compared with other
years.
The compound or synthetic Cities in Motion
Index (ICIM) focuses on the population of
capital cities and other important cities in the
largest countries around the world. The
inclusion of cities is directly related to the size
of the population and to criteria of economic
and cultural relevance within the international
arena, so as to determine which cities to
include in the study and how much significant
information is available.
The indicators representing each of the
different dimensions in the ICIM are selected
based on a theoretical perspective, in order to
determine their relevance for the specific
dimension we intend to measure, and from a
practical perspective, to ensure that the
available information has an acceptable level
of quality.
The following section provides a description
and a critical analysis of the inputs used to
create comparable indicators at the
international level.
Background Information
In recent decades, national and international
entities have performed studies focused on the
definition, creation and use of indicators with
various objectives in mind. In each of them,
the definition of the indicators and the process
for their creation are determined by the
features of each study, by the statistical and
econometric techniques that are best adapted
to the theoretical model and available data,
and the analysts’ preferences. Due to this large
heterogeneity, which makes it clear that there
is not just one single procedure for creating
synthetic indicators, in this report we highlight
certain methodologies with the objective of
selecting the techniques that are best adapted
to the ICIM study from within them.
Cities in Motion - Index 2014
ST-335-E
5 IESE Business School-University of Navarra
At present, there are a large number of
“urban” indicators, though many of them have
not been standardized or they are not
consistent or comparable among cities.
In the past, numerous attempts have been made
to develop indicators for cities, on a national,
regional or international scale. However, few
have been sustainable in the medium term,
because they were derived from studies
intended to meet the specific information needs
of certain entities whose existence depended on
how long their financing might continue. In
other cases, the system of indicators depended
upon the political agenda of the moment, so its
creation came to a halt when political priorities
changed or new authorities came into power.
However, there are also indicators specifically
created by international entities that aim to
achieve the consistency and strength necessary
for comparing cities. The most notable ones
are as follows:
a. Indicators created by the UN Global
Urban Observatory (GUO) on the basis
of two main factors: the Millennium
Development Goals and the Habitat
Agenda.
b. Global City Indicators, by the World
Bank, which are a complement to the
preceding indicators.
c. The World Health Organization (WHO)
system of indicators: Healthy Cities
project.
d. UNESCO’s indicators for evaluating
municipal policies aimed at fighting
racism and discrimination.
e. The City Mayors website: an
independent project developed by
international experts.
f. Other indices sponsored by consulting
firms (such as Mercer and McKinsey)
and private companies (such as the
Green City Index, by Siemens).
With the goal of building an indicator that
“surmounts” these difficulties, in the sense that
its thoroughness, properties and comparability,
and the quality and objectivity of the
information included, make it capable of
measuring the sustainability of the largest
world cities with an eye to the future, as well
as their inhabitants’ standard of living, we
briefly point out the characteristics of some of
the indicators from the past that have
attempted to achieve similar objectives. The
next chapter will discuss the methodological
aspects used to create the methodology that
was designed specifically for Cities in Motion.
Critical Analysis of Indicators
a. Indicators created by the UN Global
Urban Observatory (GUO) on the basis of
two main factors: the Millennium
Development Goals and the Habitat
Agenda. One of the purposes of the
Urban Observatories, created by the UN
and coordinated by UN-Habitat, is to
“generate data and information and
stimulate integrated analysis so that this
agreement of role-players can move
proactively towards surmounting urban
poverty, in a close relationship with the
Millennium Development Goals and the
gradual implementation of the Habitat
Agenda and Agenda 21.” Within this
framework, UN-Habitat considers urban
indicators to be a set of management
tools that make it possible to identify the
urban reality and serve as a foundation
for determining policies, programs and
projects that can improve it on an
ongoing, sustainable basis. The set of
urban indicators is currently created on
the basis of two analytical guidelines:
the Millennium Development Goals and
the Habitat Agenda.
The Millennium Development Goals,
agreed upon in the year 2000, are
monitored on the basis of 35 sector-
based indicators. UN-Habitat is in
charge of performing the tracking of
Target 11 of Goal 7, which establishes
the commitment to “substantially
improve, up to the year 2020, the living
conditions of at least one hundred
million people who are living in
precarious settlements (slums).”

Cities in Motion - Index 2014 ST-335-E
6 IESE Business School-University of Navarra
As for the tracking indicators of the
Habitat Agenda, they are subdivided
into seven dimensions: generalities,
socioeconomics, housing, services, the
environment, local management and
transportation.
As for the indicators related to the
Millennium Goals, it has been observed
that they are measurements with very
specific objectives related only to Target
11 of Goal 7, which involves just one
very specific aspect of the problems of
cities, that of precarious settlements
(slums). The tracking indicators of the
Habitat Agenda include important
dimensions in the life of cities, but they
are not sufficient to perform a
comparison of the future sustainability
of cities and their inhabitants’ standard
of living. Though this section of our
proposal is not intended to be
comprehensive, we might point out that
certain aspects of society are not
included in the dimensions of these
indicators, such as culture, or creating
and retaining talented people; also
relevant is the analysis of innovative
activities in the local economic sub-
system, technology and aspects of
urban planning. These are not
considered among the indicators
monitored in the Habitat Agenda. The
aspects excluded by these indices are
fundamental when it comes to
evaluating the sustainability and
standard of living in cities.
b. Global City Indicators, by the World
Bank. The World Bank program that
advocates the creation of these
indicators is based on a considerable
number of existing works, above all the
previously mentioned UN-Habitat Urban
Indicators Program, through the Global
Urban Indicators Database and the
GUOs, to which we refer in the
preceding section. The program
proposes the creation of an index based
on these and other programs in order to
promote the development of a set of
standardized urban indicators. This
program focuses mainly on cities with
populations of approximately 100,000
inhabitants. The indicators are proposed
for cities with the first and most direct
level of municipal government. The
program is arranged around 22 “topics”
which are, in turn, divided into two
broad categories: urban services and
standard of living. The first includes
services that are usually considered to
be public goods and are therefore
provided by local governments or third
parties: education, energy, fire and
emergency response, governance, health
care, entertainment, security, social
services, solid waste disposal,
transportation, urban planning, sewers
and drinking water. The second
category includes aspects related to
citizen participation, culture, the
economy, the environment, housing,
social equality, subjective welfare, and
technology and information. This
program is Internet based, with
participation from the local
governments of the cities taking part,
who are invited to share their indicator
programs as well as their results in the
categories of urban services and
standard of living. Each participating
city is responsible for making
contributions and updating its own
indicators, using the website created for
this purpose. In principle, this program
can be considered “complete” in terms
of the dimensions it covers, though
work could be put toward a proposal for
improvement that would also include
aspects of a city’s “international
heritage.” Moreover, aspects related to
the city’s competitiveness and energy
use are not taken into account. One
important problem with this program –
despite the fact that, to a certain extent,
this may be beneficial for building new
databases – is that the data is provided
directly by governments or local entities
on the website, which may be a
hindrance to the indicator’s
sustainability in the medium to long
term, given that, in some ways, the
Cities in Motion - Index 2014
ST-335-E
7 IESE Business School-University of Navarra
responsibility of uploading the data
produced in each city ends up
depending on temporary political
decisions.
Along these same lines, the contribution
of indicators by local governments may
be counterproductive in terms of the
quality of the information and the
comparison of cities, due to the
particularities and differences in the
manner and means used to gather data,
which, in the best of cases, will require
very high monitoring and verification
costs. The lack of standards and the
disparity in the availability of
information is no minor aspect. For
instance, the gathering of data tends to
be of higher quality in developed cities,
and therefore there is bias in any
indicator that is meant to be
comparable.
c. The World Health Organization (WHO)
system of indicators: Healthy Cities
Project. These are local indicators on
the population’s health and the health
system, which include more than 1,400
cities and towns, mainly in Europe. The
WHO establishes target values in order
for a city to be considered as “healthy,”
and it periodically monitors these cities
and towns. In this case, it involves the
measurement of just one dimension in a
city’s reality, with the advantage that it
is comparable among jurisdictions. The
disadvantage of this system of
indicators lies in the fact that the
information is available for cities that
are located, for the most part, only on
the continent of Europe. However, in
addition to this, it includes no selection
criteria for cities, and therefore there are
indicators for both small cities and large
cities. Comparing aggregate dimensions
and relative importance levels that are
so distant may make sense only if we
manage to study the health conditions
of a population and its sustainability in
this respect. However, it is not so if we
are talking about an integrated
indicator of a city’s standard of living
and future prospects.
d. UNESCO’s indicators for evaluating
municipal policies aimed at fighting
racism and discrimination. This is an
important aspect in terms of local
governments’ public policies, though
they are indicators of just one aspect of
society. This may be included to
measure a city’s standard of living and
is very relevant when comparing
different cities around the world.
e. The City Mayors website: an
independent project by international
experts. This site promotes strong cities
with good local governments; it has a
system of 40 indicators divided into five
categories: stability, health, culture, the
environment, education and
infrastructure. However, the number of
indicators grows year after year.
The cities used in these indicators are
located in more than 200 countries,
including their capital cities and the
most important cities in each of them.
However, these indicators do not foresee
all of the relevant dimensions in cities
in terms of comparing their
sustainability and their inhabitants’
standard of living. Moreover, there is no
compound or aggregate indicator for
each city. In terms of the data sources,
one must bear in mind that they are not
official in certain cases. The objective of
these indicators is to promote good
governance, and they are developed
only with a view to that goal.
The index proposed in this report is
intended to be more complete and not
to focus exclusively on aspects that
make a local government more capable.
Instead, it is focused on a good standard
of living in cities and on their
sustainability in the long term.
Cities in Motion - Index 2014 ST-335-E
8 IESE Business School-University of Navarra
f. Other indices sponsored by consulting
firms and private companies: The Urban
Sustainability Index (McKinsey &
Company) and the Quality of Living
Survey (Mercer). Among those
developed and sponsored by companies
or organizations, with the objective of
analyzing certain aspects that define a
city’s “intelligence,” such as the cost of
living, sustainability, standard of living
or investment in green spaces, are the
following: Green City Index (Siemens),
Eco2 Cities (World Bank), The Global
City Competitiveness Index (Citi for
Cities, by Citigroup), Global Liveability
Ranking and Report (Economist
Intelligence Unit), The Livable Cities
Index (C40 Cities Climate Leadership
Group), CDP Cities (Carbon Disclosure
Project) and the Global City Indicators
Facility. Each of these indicators differs
in terms of focus, areas covered and
methodology. In no case do they offer a
broad overview of the different
dimensions that make up a city, as is
the case with the ICIM.
In addition to these indicators at the
worldwide and continental levels, there are
certain systems of indicators that are relevant
at the level of the main cities in a particular
country or region. In general, these indicators
measure the performance of an urban
aggregate related to one single dimension - or
at most four - usually related to the
environment, technology, public finance, the
economy and demographic or health-related
indicators. The most important of these
indicators include: Toronto Economic
Indicators, Urban Indicators of Bogotá, British
Columbia, Toronto Municipal Performance,
Bristol Performance Plan, Cool Indicators
Mississauga, Financial Indicators, Berkeley
Indicators, Salisbury Performance, Liverpool
Performance Office, Prague Indicators,
Albuquerque Indicator Office, American City
Indicators, Finance Best Practices and Dallas
Indicators.
Cities in Motion: A Synthetic Indicator
The indicator that is the subject of this study,
the ICIM, is synthetic and as such it is a
function of the partial indicators that are
available.
The basic model on which the process for
creating the indicator is based is the weighted
aggregation of partial indicators representing
each of the 10 dimensions that make up the
ICIM. These dimensions were selected to
describe the reality of the cities in terms of
their sustainability and their inhabitants’
standard of living, both in the present and for
the future. The 10 dimensions are as follows:
Governance and Citizen Participation
(hereafter referred to as “Governance”), Urban
Planning, Public Management, Technology,
The Environment, International Outreach,
Social Cohesion, Mobility and Transportation,
Human Capital and The Economy.
The partial indicators that make up each
dimension also fall within the category of
synthetic indicators, defined as “weighted
aggregates of all the selected indicators
representing different factors within each
dimension.”
The function for calculating the synthetic
indicators, including both the sub-indicators
representing each dimension and the ICIM
overall, should possess certain desirable
properties in order to serve as an ideal model
(Pena, 2009); this must be taken into
consideration when selecting the calculation
methodology and the techniques used therein:
a) Existence of the indicator and determination
for the full set of partial indicators.
b) Monotonicity with respect to the
variations in the partial components; in
other words, given a positive change in
one of the partial indicators, all else being
equal, the synthetic indicator must
display movement in the same direction.

Cities in Motion - Index 2014
ST-335-E
9 IESE Business School-University of Navarra
c) Uniqueness for the partial components, in
such a manner that, given a specific
situation, the synthetic indicator leads to
a single result, for which purpose the
property of non-variance must be
fulfilled.
d) Homogeneity of degree one, in such a
manner that, when multiplying each
partial indicator by a constant, the
synthetic indicator is multiplied by that
same constant.
e) Transitivity, such that, given a set of
indicator values for three different
situations, if situation one is better than
situation two, and situation two is better
than situation three (the highest
indicator), then situation one is better
than situation three.
f) Completeness, in terms of making use of
the information provided by the partial
indicators, thereby avoiding duplication
of the information.
In the upcoming sections, alternative
calculation methodologies for the ICIM are
described, as well as the indicators used in
each of the dimensions and the techniques for
standardizing variables and replacing variable
values that are identified as missing for a
specific city or set of cities due to the non-
availability of data.
The cities for which the ICIM was completed
are shown in Table 1 by regions.

Cities in Motion - Index 2014 ST-335-E
10 IESE Business School-University of Navarra
Table 1 Geographic Areas Covered
Africa Asia Eastern Europe
Alexandria-Egypt Beijing-China Linz-Austria
Cairo-Egypt Chongqing-China Vienna-Austria
Cape Town-South Africa Guangzhou-China Brussels-Belgium
Durban-South Africa Harbin-China Copenhagen-Denmark
Johannesburg-South Africa Shanghai-China Helsinki-Finland
Pretoria-South Africa Shenyang-China Lille-France
Western Europe Shenzhen-China Lyon-France
Sofia-Bulgaria Suzhou-China Marseille-France
Herzegovina-Sarajevo-Bosnia Tianjin-China Nice-France
Prague-Czech Republic Wuhan-China Paris-France
Budapest-Hungary Jakarta-Indonesia Berlin-Germany
Riga-Latvia Osaka-Japan Cologne-Germany
Warsaw-Poland Tokyo-Japan Duisburg-Germany
Wroclaw-Poland Kuala Lumpur-Malaysia Frankfurt am Main-Germany
Ljubljana-Slovenia Manila-Philippines Hamburg-Germany
Ankara-Turkey Moscow-Russia Munich-Germany
Bursa-Turkey St Petersburg-Russia Stuttgart-Germany
Istanbul-Turkey Busan-South Korea Athens-Greece
Latin America Daegu-South Korea Dublin-Ireland
Buenos Aires-Argentina Daejeon-South Korea Florence-Italy
Córdoba-Argentina Seoul-South Korea Milan-Italy
Rosario-Argentina Kaohsiung-Taiwan Naples-Italy
La Paz-Bolivia Taichung-Taiwan Rome-Italy
Belo Horizonte-Brazil Tainan-Taiwan Turin-Italy
BrasIlia-Brazil Taipei-Taiwan Amsterdam-Netherlands
Curitiba-Brazil Bangkok-Thailand Eindhoven-Netherlands
Fortaleza-Brazil Middle East Oslo-Norway
Porto Alegre-Brazil Haifa-Israel Lisbon-Portugal
Recife-Brazil Tel Aviv-Israel Porto-Portugal
Rio de Janeiro-Brazil Doha-Qatar Barcelona-Spain
Salvador-Brazil Jeddah-Saudi Arabia- Madrid-Spain
Sao Paulo-Brazil Riyadh-Saudi Arabia Seville-Spain
Santiago-Chile Abu Dhabi-United Arab Emirates Valencia-Spain
Bogota-Colombia Dubai-United Arab Emirates Gothenburg-Sweden
Cali-Colombia North America Stockholm-Sweden
Medellín-Colombia Montreal-Canada Basel-Switzerland
Santo Domingo-Dominican Republic Ottawa - Gatineau-Canada Geneva-Switzerland
Quito-Ecuador Toronto-Canada Zurich-Switzerland
Guadalajara-Mexico Vancouver-Canada Birmingham-United Kingdom
Mexico City-Mexico Baltimore-USA Glasgow-United Kingdom
Monterrey-Mexico Chicago-USA Leeds-United Kingdom
Lima-Peru Dallas-USA Liverpool-United Kingdom
Montevideo-Uruguay Houston-USA London-United Kingdom
Caracas-Venezuela Los Angeles-USA Manchester-United Kingdom
Oceania Minneapolis-Saint Paul-USA Nottingham-United Kingdom
Melbourne-Australia New York-USA-
Sydney-Australia Philadelphia-USA
Auckland-New Zealand

Cities in Motion - Index 2014
ST-335-E
11 IESE Business School-University of Navarra
Selection of Techniques for Calculation of the Synthetic Indicators
Based on a thorough study of the available
methodologies, as well the background
information at the worldwide level regarding
the calculation of synthetic indicators, and
bearing in mind their desirable properties,
three alternative calculation techniques have
been selected, each with its own advantages
and disadvantages:
a. Indicators of simple weighting factors
b. Participatory
c. DP2 Technique
a) Indicators of Simple Weighting Factors
At present, a significant portion of the work
aimed at creating synthetic indicators uses
one-dimensional linear projections that
generate simple weighted averages, some being
different from others only in terms of the
technique used for the standardization of the
sub-indicators that comprise the indicator. This
methodology is very widespread due to its
simplicity of use and interpretation. In this
type of method, each sub-indicator is assigned
the same relative weight and the weighting
and aggregation are performed in stages. In
the case of the ICIM, the indicators were
aggregated in each dimension using identical
weighting factors that add up to one; in the
subsequent stage, these indicators were also
weighted using equivalent weighting factors
for the creation of the ICIM.
Therefore, the indicator for a dimension i
calculated using this methodology would be
defined as follows:
(1)
in which w = 1/ , the weight assigned to the
standardized indicators; is the
standardized value of the indicator j for
dimension i; and nl is the number of indicators
in dimension i.
Likewise, all of the sub-dimensions are to be
aggregated:
(2)
in which q = 1/m is the weight assigned to the
standardized indicators; Si is the value of the
synthetic indicator for dimension i; and m is the
number of dimensions, which in this case is 10.
The main problem with this method, aside
from the fact that it does not allow for
assigning different weights to the indicators or
the dimensions, is that the real weight that is
assigned to each indicator may not be equal –
as was intended – because, if the number of
indicators in each sub-dimension is different,
then the weight of each individual indicator in
the synthetic indicator will also differ
(Domínguez Serrano et al., 2011). Therefore, in
the case of equation (1), it could occur, for
instance, that and therefore the
relative weight of each of the indicators within
dimension one will be less than the value of
dimension two, when the index is created
using equation (2). In accordance with this, by
assigning the same importance to all of the
indicators, one cannot do away with the risk
that, if there are variables with strong
correlations between them, there may be a
duplication of information that could distort
the model.
As one might conclude, the use of this
technique necessarily entails the
standardization of variables; the techniques
used for standardization will be described in
the next section of this document.
The inclusion of this methodology in the
study, despite the disadvantages mentioned
above, has the practical justification that it
serves as a parameter for comparing the
indicators’ sensitivity to the application of
more sophisticated techniques, which include,
for example, methods to eliminate duplicated
information or to place greater importance on
specific dimensions.
Cities in Motion - Index 2014 ST-335-E
12 IESE Business School-University of Navarra
b) Participatory Methods
The methodologies based on participatory
methods propose the creation of synthetic
indicators defined as weighted sums, in which the
relative weights or weighted factors are created
on the basis of subjective evaluations undertaken
by a set of reference individuals. Among the most
widespread participatory methods, the most
notable are the public opinion method and the
panel of experts method (Jesinghaus, 1997;
Hermans, Bossche and Wets, 2007). In both, the
weighted factors are determined on the basis of
scores assigned by the group of individuals, either
from the community or experts, whichever is
appropriate. Last of all, the synthetic indicator is
calculated by aggregating the indicators and the
dimensions using the relative weights that have
been calculated.
The formulas for calculation are as follows in
this case:
(3)
in which is the weight assigned to the
standardized indicators; is the
standardized value of indicator j for dimension
i; and is the number of indicators in
dimension i.
And:
(4)
in which = is the weight assigned to the
standardized indicators; is the value of the
synthetic indicator for dimension i; and m is the
number of dimensions, which in this case is 10.
For the case studied herein, any of these
techniques could be applicable in principle,
bearing in mind the disadvantages associated
with this type of technique. The first
inconvenience involves the reliability of the
weighting factors, given the subjectivity
inherent in personal evaluations; and the
second involves the consistency of the
individual scores, because it has been
demonstrated that it is impossible to assign
scores to a system of more than 10 indicators
simultaneously without falling prey to
inconsistencies (Sajeva et al., 2005).
c) DP2 Technique
The DP2 technique is a methodology based on
distances: in other words, the difference
between one given value of an indicator and
another value used as a reference or target.
Such techniques solve the problem of
measurement unit heterogeneity. The use of
some distance techniques requires that the
aforementioned indicators fulfill some of the
main properties.
Among these techniques, the most commonly
used at the international level, and the most
appropriate given the type of indicator to be
calculated and the available data, is the DP2
technique.
This technique attempts to correct the
dependence among partial indicators, which
would artificially increase the indicator’s
sensitivity to variations in one specific partial
value. The correction consists of applying the
same factor to each partial indicator, assuming
a linear dependence function.
Given the partial indicators, the correction
factors are determined by the complement of
the coefficient of determination (R2) of each
indicator with respect to the remaining partial
indicators.
For instance, if x1, x2, x3,…, xn are the partial
indicators, and d1, d2, d3,…, dn, are the
distances between the value of the indicator
and a reference value of that indicator, then
the indicator calculated using this technique
will be determined by the following formula:
) (5)
in which is the distance between the value
of indicator j of dimension i and the unit of
reference established for indicator j of the
same dimension; is the standard deviation
of indicator j; is the multiple
coefficient of determination of the linear
regression of indicator Ij with respect to the
indicators that precede it in the order of input
Is, in which s ϵ {j-1, j-2, …,1}, and .
Cities in Motion - Index 2014
ST-335-E
13 IESE Business School-University of Navarra
Similarly, the dimensions are to be aggregated
in order to calculate the synthetic indicator:
) (6)
The advantages of this technique, the most
commonly used for the indicators presented
herein, are as follows:
1. It does not require a procedure for
standardization of variables because, when
dividing the distance between the standard
deviation of each indicator, the values are
expressed in a non-dimensional scale, such
that the contribution of each distance to the
value of the index is inversely proportional
to its dispersion.
2. The correction factor weights the differences
between the indicators and their reference
values by the proportion of “new”
information that each indicator provides
upon being included within a dimension (or
a dimension of the synthetic indicator).
3. It is not variable in different reference
situations.
4. It is easy to interpret the results.
However, when using this methodology, the
value of the synthetic indicator is affected by
the order in which the indicators are
introduced, which may be solved by way of an
iterative process that makes it possible to
establish an order on the basis of the amount
of information they provide.
Calculation Methodologies
1. Indicators
Governance
Governance, a term commonly used to refer to
the effectiveness, quality and proper orientation
of state intervention, is represented by the
following indicators in this report: the Strength
of Legal Rights Index (SLR) and the Corruption
Perceptions Index (CPI), the latter having been
calculated by the organization Transparency
International. The SLR was included with a
positive bearing. It is a function that national or
local states cannot delegate, whose purpose is to
create the proper conditions or to pursue the
effective fulfillment of the people’s rights and
those of the companies located in their territory.
The perception of the fulfillment of legal rights
influences every aspect of a country’s or a city’s
life, such as the business climate, incentives for
investment and legal security, among others.
As for the Corruption Perceptions Index, it is a
way of measuring the quality of governance in
that, if society has a high perception of
corruption in public bodies, it is an indication
that the state’s intervention is not efficient
from the perspective of social economics,
because public services – understood in a
broad sense – bear greater costs compared
with those they would entail if corruption did
not exist. Moreover, the incentives to invest or
settle in countries or cities with a high
perception of corruption will be less than in
others with low levels, thereby exerting a
negative influence on the country’s or city’s
sustainability. In the case of the ICIM, it is
used as an explanatory indicator of the
dimension of Governance, with a positive
bearing, due to the manner in which the index
is calculated by the organization Transparency
International, which assigns a value of zero for
countries with a high corruption level and 100
for very transparent countries.
Urban Planning
A city’s urban planning involves various sub-
dimensions and is closely related to a city’s
sustainability. Deficient urban planning leads
to a decrease in people’s standard of living in
the medium term and also has a negative
effect on investment incentives, because a city
that has not been planned or is poorly planned
creates difficulties and increases the costs of
logistics and employee transportation, as well
as affecting other factors.
On the basis of the information available, the
measurement of Improved Sanitation Facilities
(ISF), which is highly correlated with urban
planning, is included as an indicator in this
dimension, because it can be demonstrated that
Cities in Motion - Index 2014 ST-335-E
14 IESE Business School-University of Navarra
deficient planning unavoidably leads to health
care problems in the short and long term.
Furthermore, from an urban planning or
residential point of view, a city with adequate
urban planning displays few or no problems of
overcrowding in households in general,
because housing policies, in keeping with
estimated urban population growth, are
normally a decisive factor in urbanization
plans. For this reason, the number of
occupants per household (OCC) was considered
among the explanatory indicators of this
dimension, with a negative bearing.
Public Management
In this report, public management is
understood to be highly correlated with a
city’s or a country’s state of public finance. In
this sense, public accounts have a decisive
effect on people’s standard of living and on
the sustainability of a city, insofar as it
determines the level of present and future
taxes that the people and system of production
must pay, the expected increase in the general
level of prices, the potential public investment
in basic social infrastructure and the
incentives aimed at private investment.
Moreover, if the state has a need for funds as a
result of a weak public finance system, it will
compete with the private sector for the funds
available in the financial system, thereby
affecting investment.
The indicators that represent this dimension in
this report are the ratio of taxes in relation to
commercial profits, the level of central bank
reserves and the level of reserves per capita.
The indicator related to the taxation system,
with a negative bearing on the value of the
synthetic indicator of this dimension,
encompasses aspects of the status of public
finance because the greater the relative tax
pressure is, the weaker a city’s public accounts
will become.
As for the level of total reserves, it is an
indicator of the short- to medium-term
strength of the public finance system, its
ability to deal with changing economic cycles
and the strength and sensitivity of the
economic structure as regards the state.
Technology
Technology, as a dimension of the ICIM, is an
aspect of society that improves the current
standard of living, and its level of development or
widespread usage is an indicator of a society’s
achieved or potential quality of life. Moreover,
technological development is a dimension that
allows cities to be sustainable over time, and to
maintain or expand the competitive advantages
of their production system and the quality of
employment. A city that is technologically
outdated has comparative disadvantages with
other cities, both from the standpoint of safety,
education and health – which are fundamental
aspects in a society’s sustainability – and from
the standpoint of the productive system, which
ends up with outmoded production tasks that
make it difficult to achieve competitiveness
without protectionism, a factor that has a
negative effect on the city’s ability to consume
and to invest, in addition to reducing productivity
in the workplace.
The indicators selected to measure the cities’
performance in terms of the scope of technology
and its growth in cities are the number of fixed
broadband Internet subscribers per 100
inhabitants (FIS) and the Innovation Cities Index
published by the Innovation Cities Program (IIC).
The first of these figures has a strong correlation
with a city’s general technological advancement,
because it implies the technological development
of applications and devices for efficient use. As
for the IIC index, it is calculated by carrying out
assessments on the basis of several factors
involving technological innovation in cities in
sectors such as health care, the economy or the
population in general, as well as others. It is
currently the most thorough indicator for
measuring cities’ degree of development in terms
of innovation, divided methodologically into
three aspects or dimensions: cultural assets,
human infrastructure and interconnected
markets.

Cities in Motion - Index 2014
ST-335-E
15 IESE Business School-University of Navarra
The Environment
Sustainable development in a city may be
defined as “development that meets the needs
of the present without jeopardizing the ability
of future generations to meet their own
needs.”1 In this sense, the environment is very
important because sustainability over time,
which makes it possible for future generations
to meet their needs, is very closely related to
this dimension. As the ICIM also intends to
measure the sustainability of cities, the
environment is included as one of the aspects
to be measured.
The indicators selected for this dimension are
CO2 emissions, improved water sources as a
percentage of the total urban population with
access (H2O), PM10 particles, the EPI index and
methane emissions (MET).
As can be deduced, the first two indicators
selected include measurements of air pollution
sources and the quality of water in cities,
which are indicators of their inhabitants’
standard of living, as well as the sustainability
of their production system and urban
planning. CO2 and methane emissions are the
main measurements regularly used to
determine the degree of air pollution because
these substances are closely linked to the
greenhouse effect. In fact, a decrease in the
values of these indicators is included as an
objective in the Kyoto Protocol.
Another very important indicator of air
pollution in cities is PM10, the name given to
small solid or liquid particles consisting of
dust, ash, soot, metallic particles, cement or
pollen dispersed into the atmosphere with a
diameter of less than 10 micrometers. They are
mainly made up of inorganic compounds such
as silicates and aluminates, heavy metals and
organic material associated with carbon
particles (soot). This indicator is used a great
deal in the indices that attempt to measure the
status of environmental pollution.
1 Definition used in 1987 by the United Nations World
Commission on Environment and Development, created in 1983.
Last of all the EPI (Environmental Performance
Index), calculated by Yale University, is an
indicator based on two overall dimensions
related to the environment: environmental
health and ecosystem vitality. The first is
divided into three sub-dimensions: the effects of
air pollution on human health, the effect of
water quality on human health and the
environmental burden of diseases. Ecosystem
vitality has seven sub-dimensions: the effects of
air pollution on the ecosystem; the effects of
water quality on the ecosystem; biodiversity
and habitat; forestation; fish; agriculture; and
climate change. Given the thorough nature of
this indicator – as it includes nearly all of the
aspects involving the measurement of a city’s
environmental status and changes in a city’s
environment, complemented by the other four
indicators that are included in the ICIM – the
dimension of The Environment is considered to
have been represented in a well-proportioned
manner.
The indicators that represent PM10 particles
and CO2 and methane emissions are considered
to have a negative bearing on this dimension,
whereas the remaining indicators have a
positive effect on The Environment.
International Outreach
Cities may have greater or lesser international
outreach when compared with cities in other
countries, but this factor is not independent
from the degree of the country’s openness.
This dimension attempts to include these
differences and measure the cities’
international outreach on the basis of
international tourism and the potential that
each city offers for holding congresses and
meetings of an international nature, given the
restricted nature of current information.
In this sense, the following indicators have
been included: international tourist arrivals
(ITA), number of airline passengers (AEP), and
number of meetings (MIT), according to data
from the International Congress and
Convention Association. This last figure is an
important indicator of a city’s international
outreach, bearing in mind that such events
regularly take place in cities that have

Cities in Motion - Index 2014 ST-335-E
16 IESE Business School-University of Navarra
international hotel and restaurant services,
rooms especially prepared for such purposes,
good frequency of international flights and
adequate security measures.
Social Cohesion
Social Cohesion is a sociological dimension of
cities, defined as the degree of consensus of the
members of a social group or the perception of
belonging to a common project or situation. It
is a measurement of the intensity of social
interaction within the group. We decided to
measure social cohesion through the use of the
different indicators that are available, having
selected the following: the number of deaths per
1,000 inhabitants (QEP); the Gini coefficient
(GIN); the unemployment rate (UER); and the
consumer expenditure on housing per capita, in
millions of constant dollars per inhabitant in
2013 (CEV).
This selection of indicators attempts to include
all of the sociological sub-dimensions that
Social Cohesion contains. For example, health
and the future expectations of society are, in
this case, measured using the number of
deaths for every 1,000 inhabitants, with a
negative bearing. Employment is a
fundamental aspect within societies, to such
an extent that the lack thereof may break the
implicit consensus or social contract,
according to historical evidence, and therefore
the unemployment rate is included with a
negative bearing when creating the indicator
of this dimension. GIN is a measurement of
social inequality, which takes values ranging
from zero in the case of a perfectly equitable
income distribution, to one in the case of a
very inequitable income distribution, and
therefore it is included within the indicator of
the dimension Social Cohesion with a negative
bearing, because a higher value of this index
(in other words, greater social inequality) has a
negative influence on cohesion, in a manner
similar to what occurs with unemployment.
As for the per-capita consumer spending on
housing, it bears a positive relationship with
the indicator of this dimension because the
possibility of gaining access to a higher
consumption level, above subsistence values,
increases the incentives for belonging to the
society of a specific city. In turn, if similar
cities are compared, higher spending on
housing is an indication of the degree to which
people feel rooted in the city and have a sense
of belonging to the city where they have
decided to locate their households.
Mobility and Transportation
Mobility and Transportation – in terms of both
highway and road infrastructure and the
automobile fleet and public transportation –
affect the standard of living of a city’s
inhabitants and may be vital to the
sustainability of cities over time. However,
perhaps the most important is not this, but
rather the externalities that are produced in the
productive system due both to the labor force’s
need to commute and the need for production
output. As a result, and always on the basis of
the available indicators, the indices of logistical
performance – in terms of both commercial
aspects and the infrastructure related to trade
(LGT) and to logistics overall (LGP) – are
considered representative of this dimension, as
shown in Table 1. These indicators provide a
measurement of the effects that this dimension
could have on the production process and, as a
result, on people’s income and standard of
living. As a measurement of the efficiency and
safety of highways and public transportation –
which, if it is effective and has a good
infrastructure, promotes a decrease in vehicular
traffic on highways – we included, with a
negative bearing, the number of deaths due to
traffic accidents according to the World Health
Organization (WHO), after weighting by the
number of inhabitants and vehicles in each city.
Human Capital
Used as representative in this dimension are the
indicators related to the international flow of
mobile students in each city or country (IFS), the
consumer expenditure on leisure and recreation
(CER) and the highest level of studies completed.
Although the Human Capital dimension includes
factors that make it much too broad to be
measured using these indicators, there is an
international consensus that educational level and
access to culture are very useful factors for rating

Cities in Motion - Index 2014
ST-335-E
17 IESE Business School-University of Navarra
human capital. In fact, one of the foundations of
human development is human capital, and if we
bear in mind that the Human Development Index
published annually by the United Nations
Development Program (UNDP) includes education
and culture as dimensions, it is valid to use these
indicators as explanatory of the differences in
human capital in a city or country.
In the case of the ICIM, the factors of
population by higher educational attainment
(HEP) and secondary educational attainment
(SEP), along with IFS are included with a
positive bearing, and with a negative bearing,
the population with only primary educational
attainment (PEP) is figured in. Moreover, as a
measure of access to culture, the spending on
entertainment goods and services was
considered, bearing a direct relationship to the
indicator.
The Economy
The indicators used to represent the economic
performance of the cities are as follows: the
time required to open a business, measured in
days; the gross domestic product (GDP) in
millions of dollars at constant prices of 2012;
labor productivity, measured in dollars
according to the labor force (LPR); and total
early-stage entrepreneurial activity (TEA),
defined as the percentage of the population
between the ages of 18 and 64 who are
incipient entrepreneurs or who are
proprietors/administrators of a new business
(no more than 42 months old).
Bearing in mind that the ICIM attempts to
measure the future sustainability of the largest
cities in the world and the standard of living
of their inhabitants through many different
dimensions, real GDP is one measurement of a
city’s economic power and the income of its
inhabitants, which, in turn, is an important
measurement of the quality of life in cities. In
numerous studies, GDP is considered to be the
only measurement or the most important
measurement of a city’s or a country’s
performance. However, in this report, it is not
considered to be exclusive or the most relevant
factor, rather it is considered to be one further
indicator among the 10 dimensions included in
the ICIM. Therefore, its share in the total is
similar to that of other indicators, if not the
same, depending upon the technique that is
applied. For example, if a city with a high or
relatively high GDP does not have a good
performance level in other indicators, it may
not be placed among the top ranks. For
instance, a highly productive city that has
problems with transportation, inequality, weak
public finance or production processes that use
polluting technology will probably not occupy
a top position in the ranking.
As for LPR, it is a measurement of the strength,
efficiency and technological level of the
production system, which, as regards local and
international competitiveness, will obviously
affect real salaries, the return on capital and
business profits – all reasons why it is very
important to include it within the dimension of
The Economy, because different productivity
levels may explain differences in the standard of
living of a city’s workforce – and the
sustainability of the productive system over time.
The other two indicators selected as being
representative of this dimension make it possible
to measure certain aspects of a city’s business
world, such as the time required to open a
business or the entrepreneurial capabilities and
potential of the city’s inhabitants (such as TEA).
These last two indicators measure the city’s
capacity for sustainability over time as well as
its potential for improving its inhabitants’
standard of living.
Described in Table 2, in the form of a
summary, are the indicators used in each of
the dimensions, a description thereof, the units
of measurement and the sources of
information from which they were taken.

Cities in Motion - Index 2014 ST-335-E
18 IESE Business School-University of Navarra
Table 2 Indicators
Indicator Abbreviation Unit of Measurement/Description
Dimension/Cluster Source
Time required to start a business
TSB Days The Economy World Bank
Total GDP GDP Millions of USD at prices of 2012 The Economy Passport
Labor productivity LPR USD/occupied person The Economy Passport
Total early stage entrepreneurial activity
TEA Percentage of the population aged 18-64 years
The Economy Global Entrepreneurship Monitor
International flows of mobile students at the tertiary level
IFS Number of people Human Capital UNESCO
Population by educational attainment [higher]
HEP Thousands of people Human Capital Passport
Population by educational attainment [secondary]
SEP Thousands of people Human Capital Passport
Population by educational attainment [primary]
PEP Thousands of people Human Capital Passport
Consumer expenditure on leisure and recreation per capita
CER Millions of USD/inhabitant at prices of 2012
Human Capital/Country Cluster
Passport
Strength of Legal Rights Index SLR Index (from 0 = low, to 10 = high) Governance World Bank
Corruption Perceptions Index CPI Index (from 0 = very corrupt, to 100 = very transparent)
Governance Transparency International
Fixed broadband Internet subscribers
FIS Number of new subscriptions/100 inhabitants
Technology World Bank
Innovation Cities Index IIC Index (from 0 = no innovation, to 60 = much innovation)
Technology Innovation Cities Program
Road traffic deaths per capita, by car
RTD Number of deaths in accidents/inhabitant/vehicle
Mobility and Transportation
Global Health Observatory
Logistics Performance Index: overall
LGP Index (from 1 = low, to 5 = high) Mobility and Transportation
World Bank
Logistics Performance Index: trade
LGT Index (from 1 = low, to 5 = high) Mobility and Transportation
World Bank
CO2 emissions (kt) CO2 kt The Environment World Bank
PM10 24-hour mean micrograms per cubic meter
PM10 Micrograms per cubic meter (daily measurement)
The Environment Passport
Methane emissions MET Equivalent kt of CO2 The Environment World Bank
Improved water source, urban (% of urban population with access)
H2O Percentage of the total urban population with access
The Environment World Bank
Environmental Performance Index
EPI Index (from 1 = bad, to 100 = good)
The Environment Yale University
Unemployment rate UER Percentage of population that is active
Social Cohesion Passport
Gini Index GIN Index (from 0 to 100) Social Cohesion Passport
Consumer expenditure on housing per capita
CEV Millions of USD/inhabitant at prices of 2012
Social Cohesion/Country Cluster
Passport
Death QEP Thousands of people Social Cohesion Passport
Airline passengers AEP Thousands of passengers International Outreach Passport

Cities in Motion - Index 2014
ST-335-E
19 IESE Business School-University of Navarra
Indicator Abbreviation Unit of Measurement/Description
Dimension/Cluster Source
International tourist arrivals ITA Thousands of tourists International Outreach Passport
Numbers of meetings MIT Number of meetings International Outreach International Congress and Convention Association
Improved sanitation facilities (% of population with access)
ISF Percentage of population with access
Urban Planning World Bank
Occupants per household OCC Number of people/household Urban Planning Passport
Total reserves RBCT Millions of current USD Public Management World Bank
Total reserves per capita RBCH Millions of current USD /inhabitant Public Management World Bank
Total tax rate (% of commercial profits)
TAX Percentage of commercial profits Public Management World Bank
Consumer expenditure on hotels and catering per capita
CEH Millions of USD/inhabitant at prices of 2012
Country Cluster Passport
Annual disposable income DIN Millions of USD at prices of 2012 City Cluster Passport
Households HOU Thousands of households City Cluster Passport
Average household annual disposable income by decile (decile 1)
DE1 USD 2012 City Cluster Passport
Average household annual disposable income by decile (decile 2)
DE2 USD 2012 City Cluster Passport
Average household annual disposable income by decile (decile 3)
DE3 USD 2012 City Cluster Passport
Average household annual disposable income by decile (decile 4)
DE4 USD 2012 City Cluster Passport
Average household annual disposable income by decile (decile 5)
DE5 USD 2012 City Cluster Passport
Average household annual disposable income by decile (decile 6)
DE6 USD 2012 City Cluster Passport
Average household annual disposable income by decile (decile 7)
DE7 USD 2012 City Cluster Passport
Average household annual disposable income by decile (decile 8)
DE8 USD 2012 City Cluster Passport
Average household annual disposable income by decile (decile 9)
DE9 USD 2012 City Cluster Passport
Average household annual disposable income by decile (decile 10)
DE10 USD 2012 City Cluster Passport
Employment rate EMP Percentage Country Cluster Passport
Consumer expenditure on education per capita
CEE Millions of USD/inhabitant at prices of 2012
Country Cluster Passport
Consumer expenditure on health goods and medical services per capita
CEM Millions of USD/inhabitant at prices of 2012
Country Cluster Passport

Cities in Motion - Index 2014 ST-335-E
20 IESE Business School-University of Navarra
2. Base Period
On the basis of the available information and
criteria of economic and social stability, the
year 2011 was selected as the base period.
3. Standardization of Variables
In the event that the technique used requires
the standardization of variables to unify the
units of measurement of the full set of
variables included in the model, the indicators
are then converted to a common scale with a
mean of zero and a standard deviation of one.
In the case of the DP2 technique, as can be
deduced from the description of the technique
provided in the previous section,
standardization is not necessary because the
method itself is based on relative distances,
thereby standardizing the values of the
variables on its own.
4. Assignment of Missing Values.
Clusters.
Because the ICIM is an index of cities
calculated for a series of years, three potential
non-existent or “missing” values may exist:
a. Non-existent values of a variable for one
city or a specific set of cities, in one specific
year, but with valid values for other years
in the series being considered. In this case,
the assignment of the missing values is
performed by way of a simple linear
extrapolation by average value or an
interpolation of the values of all the cities
for which the problem exists, using the data
on the same variable for the periods in
which data does exist.
b. Non-existent values of a variable for any
city, but with valid values at the level of the
country in which each city is
geographically located, as is the case of
those variables whose source is the World
Bank database. In these cases, depending
upon the variable in question, the same
variable value is assigned at the country
level for each of the cities, or it is
distributed among the cities in each country
using some other theoretically related
variable.2
c. Non-existent values of a variable for one
city or a specific set of cities throughout the
entire period being considered. In this case,
two situations may arise:
I. The missing values correspond to a
variable for which there is valid data for
another set of cities.
II. The missing values correspond to a
variable for which there is valid data at
the country level.
In both cases, the cluster analysis that is
described below will be used to assign values,
with the difference that, in Case II, the
technique described in point b must later be
applied.
Weighted-average hierarchical cluster analysis
is used to assign values in the cases of point c.
Hierarchical cluster methods consist of
grouping clusters together and forming a new
cluster or dividing one already in existence to
form another two, in such a way that, if this
process is carried out successively, some
distance is minimized or some measure of
similarity is maximized so as to assign an
average value of the same variable to the
missing value for “similar cities,” in
accordance with the clustering criteria.
Hierarchical methods are subdivided into
divisive and agglomerative types, with a large
number of strategies or variants in each of
these subdivisions.
For the case studied here, the agglomerative
hierarchical technique will be used. It begins
with as many agglomerates as there are cities,
and the clusters are gradually formed in an
ascending order based on the criteria of
minimizing the distances between the elements
that make up each cluster, until one single
group is created. By doing this, one can create
2 This is the case with entertainment consumption,
household consumption, traffic accidents and the city’s
financial reserves.
Cities in Motion - Index 2014
ST-335-E
21 IESE Business School-University of Navarra
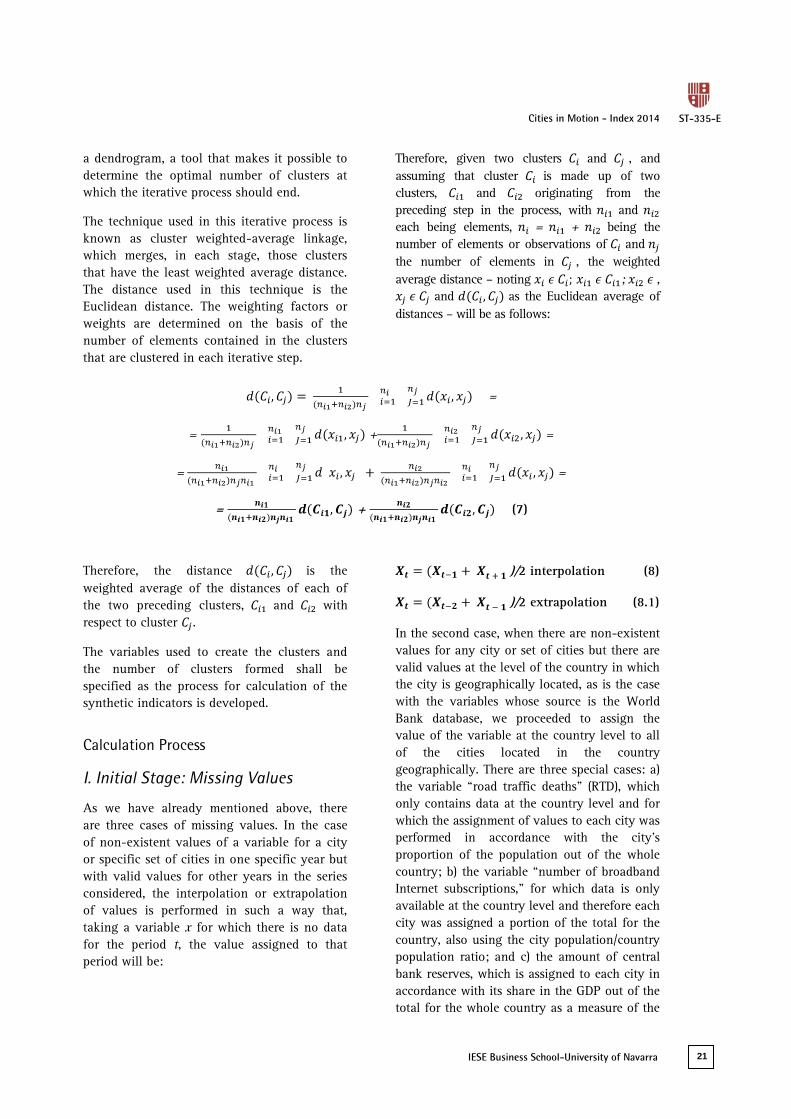
a dendrogram, a tool that makes it possible to
determine the optimal number of clusters at
which the iterative process should end.
The technique used in this iterative process is
known as cluster weighted-average linkage,
which merges, in each stage, those clusters
that have the least weighted average distance.
The distance used in this technique is the
Euclidean distance. The weighting factors or
weights are determined on the basis of the
number of elements contained in the clusters
that are clustered in each iterative step.
Therefore, given two clusters and , and
assuming that cluster is made up of two
clusters, and originating from the
preceding step in the process, with and
each being elements, = + being the
number of elements or observations of and
the number of elements in , the weighted
average distance – noting ; ,
and as the Euclidean average of
distances – will be as follows:
=
= + =
= =
= + (7)
Therefore, the distance is the
weighted average of the distances of each of
the two preceding clusters, and with
respect to cluster .
The variables used to create the clusters and
the number of clusters formed shall be
specified as the process for calculation of the
synthetic indicators is developed.
Calculation Process
I. Initial Stage: Missing Values
As we have already mentioned above, there
are three cases of missing values. In the case
of non-existent values of a variable for a city
or specific set of cities in one specific year but
with valid values for other years in the series
considered, the interpolation or extrapolation
of values is performed in such a way that,
taking a variable x for which there is no data
for the period t, the value assigned to that
period will be:
)/2 interpolation (8)
)/2 extrapolation (8.1)
In the second case, when there are non-existent
values for any city or set of cities but there are
valid values at the level of the country in which
the city is geographically located, as is the case
with the variables whose source is the World
Bank database, we proceeded to assign the
value of the variable at the country level to all
of the cities located in the country
geographically. There are three special cases: a)
the variable “road traffic deaths” (RTD), which
only contains data at the country level and for
which the assignment of values to each city was
performed in accordance with the city’s
proportion of the population out of the whole
country; b) the variable “number of broadband
Internet subscriptions,” for which data is only
available at the country level and therefore each
city was assigned a portion of the total for the
country, also using the city population/country
population ratio; and c) the amount of central
bank reserves, which is assigned to each city in
accordance with its share in the GDP out of the
total for the whole country as a measure of the

Cities in Motion - Index 2014 ST-335-E
22 IESE Business School-University of Navarra
economic importance of each subnational
division.
In the third case of missing values, when there
are non-existent values of a variable for a
specific city or set of cities throughout the
entire period considered, the clustering
technique described above was used. The
variables used to form each cluster, to
determine whether the cities belonged to each
cluster, or their similarity, were as follows:
City Clusters:
Annual disposable income for the base
year, at constant value in millions of dollars
(DIN), at 2012 prices, per capita.
Average household annual disposable
income for each one of the deciles in
constant dollars (10 variables: DE1-DE10).
Number of households (HOU), in thousands,
per capita.
Country Clusters:
Unemployment rate (UER).
Consumer expenditure on education, per
capita (CEE).
Consumer expenditure on health goods and
medical services, per capita (CEM).
Consumer expenditure on hotels and food
services, per capita (CEH).
Expenditure on housing, per capita (CEC).
Consumer expenditure on leisure and
recreation, per capita (CER).
Once the clusters were formed, the average of
the variable that contains the missing value is
assigned to the cluster that includes the city
for which no valid value existed for that same
variable. It should be pointed out that this
process of calculation is the same for all of the
methods.
a) Simple Weighting Method: Calculation
The methodology for calculating the index
using this method is completed in stages,
which are described below:
Stage I: Standardization
As pointed out above, the method of simple
weighting factors first requires the
standardization of variables. In this case, the
z-scores technique was used:
(9)
in which is the standardized value of variable
x, is the average of the variable x for all of the
cities and years available and is the
standard deviation of the variable x.
Stage II: Calculation of the Synthetic
Index for Each Dimension
Once the values were standardized, we
proceeded to calculate the synthetic indicators
of each dimension for each of the cities, using
equal weighting factors to weight each
variable as explained above; in other words,
the weighting factor of each variable will be
1/nd, in which nd is the number of indicators
contained by the synthetic index for
dimension d. The formula applied for the
indicator on the z-scores scale for the period t
is as follows:
(10)
in which is the synthetic indicator on the
z-scores scale, for dimension d in period t,
is the variable i of dimension d and is the
identical weighting factor for each variable in
dimension d.
Stage III: Calculation of the ICIM
Once the 10 synthetic indicators were calculated
for each of the dimensions in the ICIM on the z-
scores scale, we proceeded to perform its
calculation as a weighted sum of the indicators
in the dimensions , the relative weights of
which will be identical and equal to 0.10. For
instance, the formula for calculating the
synthetic indicator for period t is:
(11)
Cities in Motion - Index 2014
ST-335-E
23 IESE Business School-University of Navarra
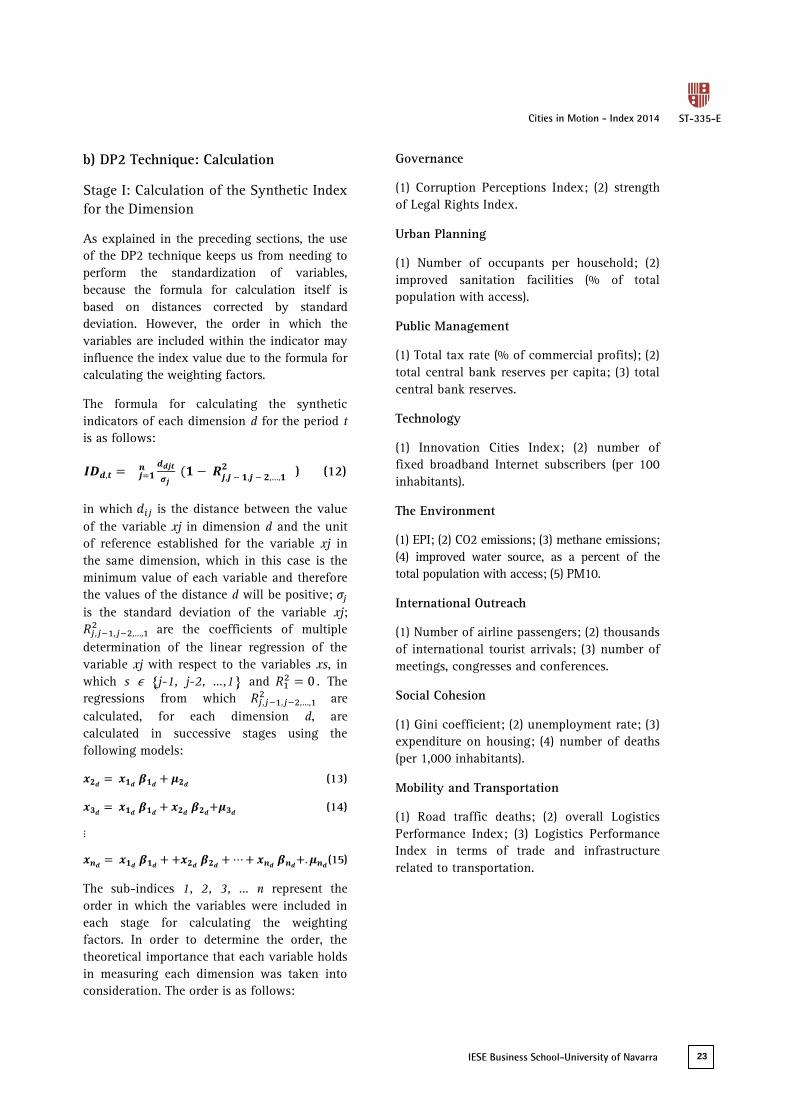
b) DP2 Technique: Calculation
Stage I: Calculation of the Synthetic Index
for the Dimension
As explained in the preceding sections, the use
of the DP2 technique keeps us from needing to
perform the standardization of variables,
because the formula for calculation itself is
based on distances corrected by standard
deviation. However, the order in which the
variables are included within the indicator may
influence the index value due to the formula for
calculating the weighting factors.
The formula for calculating the synthetic
indicators of each dimension d for the period t
is as follows:
) (12)
in which is the distance between the value
of the variable xj in dimension d and the unit
of reference established for the variable xj in
the same dimension, which in this case is the
minimum value of each variable and therefore
the values of the distance d will be positive;
is the standard deviation of the variable xj;
are the coefficients of multiple
determination of the linear regression of the
variable xj with respect to the variables xs, in
which s ϵ {j-1, j-2, …,1} and . The
regressions from which are
calculated, for each dimension d, are
calculated in successive stages using the
following models:
(13)
(14)
(15)
The sub-indices 1, 2, 3, … n represent the
order in which the variables were included in
each stage for calculating the weighting
factors. In order to determine the order, the
theoretical importance that each variable holds
in measuring each dimension was taken into
consideration. The order is as follows:
Governance
(1) Corruption Perceptions Index; (2) strength
of Legal Rights Index.
Urban Planning
(1) Number of occupants per household; (2)
improved sanitation facilities (% of total
population with access).
Public Management
(1) Total tax rate (% of commercial profits); (2)
total central bank reserves per capita; (3) total
central bank reserves.
Technology
(1) Innovation Cities Index; (2) number of
fixed broadband Internet subscribers (per 100
inhabitants).
The Environment
(1) EPI; (2) CO2 emissions; (3) methane emissions;
(4) improved water source, as a percent of the
total population with access; (5) PM10.
International Outreach
(1) Number of airline passengers; (2) thousands
of international tourist arrivals; (3) number of
meetings, congresses and conferences.
Social Cohesion
(1) Gini coefficient; (2) unemployment rate; (3)
expenditure on housing; (4) number of deaths
(per 1,000 inhabitants).
Mobility and Transportation
(1) Road traffic deaths; (2) overall Logistics
Performance Index; (3) Logistics Performance
Index in terms of trade and infrastructure
related to transportation.
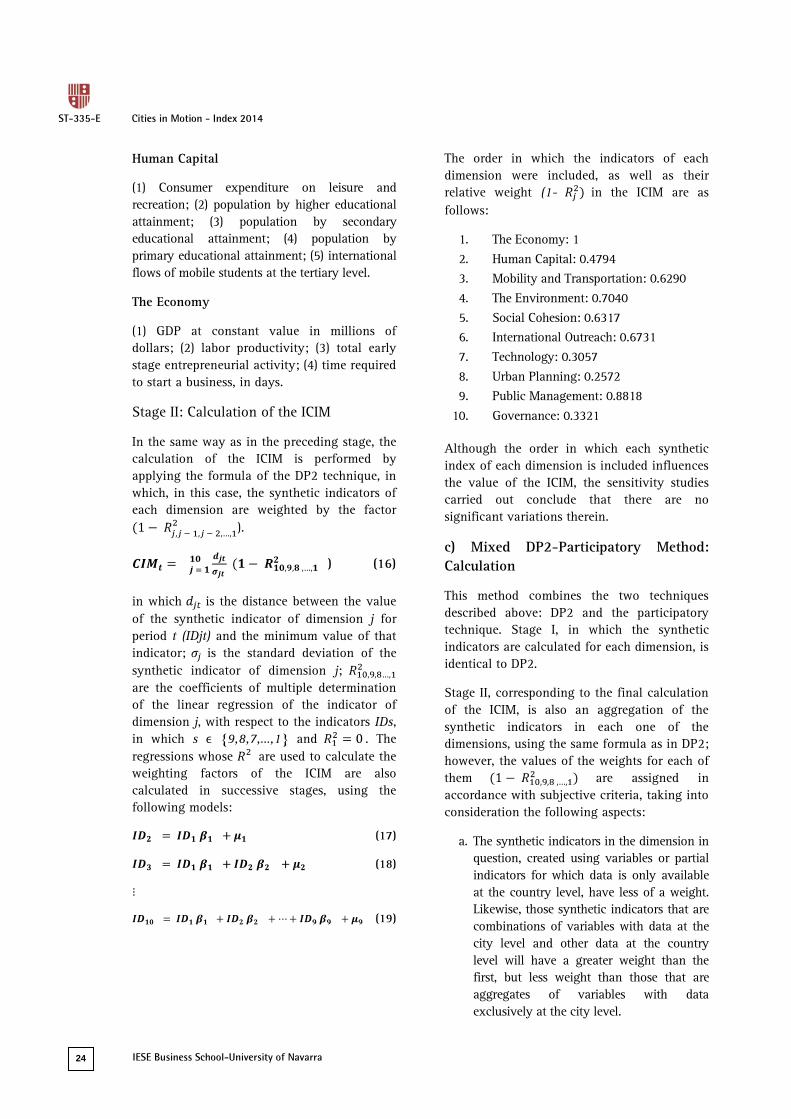
Cities in Motion - Index 2014 ST-335-E
24 IESE Business School-University of Navarra
Human Capital
(1) Consumer expenditure on leisure and
recreation; (2) population by higher educational
attainment; (3) population by secondary
educational attainment; (4) population by
primary educational attainment; (5) international
flows of mobile students at the tertiary level.
The Economy
(1) GDP at constant value in millions of
dollars; (2) labor productivity; (3) total early
stage entrepreneurial activity; (4) time required
to start a business, in days.
Stage II: Calculation of the ICIM
In the same way as in the preceding stage, the
calculation of the ICIM is performed by
applying the formula of the DP2 technique, in
which, in this case, the synthetic indicators of
each dimension are weighted by the factor
).
) (16)
in which is the distance between the value
of the synthetic indicator of dimension j for
period t (IDjt) and the minimum value of that
indicator; is the standard deviation of the
synthetic indicator of dimension j;
are the coefficients of multiple determination
of the linear regression of the indicator of
dimension j, with respect to the indicators IDs,
in which s ϵ {9,8,7,…,1} and . The
regressions whose are used to calculate the
weighting factors of the ICIM are also
calculated in successive stages, using the
following models:
(17)
(18)
(19)
The order in which the indicators of each
dimension were included, as well as their
relative weight (1- in the ICIM are as
follows:
1. The Economy: 1
2. Human Capital: 0.4794
3. Mobility and Transportation: 0.6290
4. The Environment: 0.7040
5. Social Cohesion: 0.6317
6. International Outreach: 0.6731
7. Technology: 0.3057
8. Urban Planning: 0.2572
9. Public Management: 0.8818
10. Governance: 0.3321
Although the order in which each synthetic
index of each dimension is included influences
the value of the ICIM, the sensitivity studies
carried out conclude that there are no
significant variations therein.
c) Mixed DP2-Participatory Method:
Calculation
This method combines the two techniques
described above: DP2 and the participatory
technique. Stage I, in which the synthetic
indicators are calculated for each dimension, is
identical to DP2.
Stage II, corresponding to the final calculation
of the ICIM, is also an aggregation of the
synthetic indicators in each one of the
dimensions, using the same formula as in DP2;
however, the values of the weights for each of
them are assigned in
accordance with subjective criteria, taking into
consideration the following aspects:
a. The synthetic indicators in the dimension in
question, created using variables or partial
indicators for which data is only available
at the country level, have less of a weight.
Likewise, those synthetic indicators that are
combinations of variables with data at the
city level and other data at the country
level will have a greater weight than the
first, but less weight than those that are
aggregates of variables with data
exclusively at the city level.

Cities in Motion - Index 2014
ST-335-E
25 IESE Business School-University of Navarra
b. The larger the number of variables with full
information within a dimension, the greater
the weight of the synthetic indicator that
represents it in the calculation of the ICIM.
In accordance with these criteria, the relative
weights used for this calculation are as
follows:
1. The Economy: 1.00
2. Human Capital: 0.70
3. Mobility and Transportation: 0.90
4. The Environment: 0.60
5. Social Cohesion: 0.90
6. International Outreach: 0.50
7. Technology: 0.90
8. Public Management: 0.05
9. Urban Planning: 0.80
10. Governance: 0.50
II. Final Stage: Changing the Scale of
the Indicators
As a result of the procedures selected, which
are described above, both the synthetic
indicators of each dimension and the ICIM are
expressed in values corresponding to the
standardizations (z-scores, in the case of the
indicators calculated using the simple
weighting factor method, and in the case of
the DP2 technique, the distance with respect to
the minimum value corrected by standard
deviation). However, it is recommendable to
express them on a scale that makes it possible
to note the differences between each value of
the indicator more intuitively, thereby
facilitating interpretation of the results and
values, as well as the differences existing
between the values of the indicators among
the various cities and their changes over time.
In order to modify the scale of each indicator,
its maximum value for the base year (2011)
was considered and it was assigned the
number 100, with the number zero assigned to
the minimum value of the same indicator for
the same period.
The transformation of the scale for the synthetic
indicator of dimension d, for city i, is carried
out by way of the following successive stages:
(1) Auxiliary values are calculated for the
indicators, in such a way that:
= (20)
In other words, the auxiliary value of each
indicator in dimension d, for city i and the
base year, is equal to the value of the indicator
of the same dimension for the same city and
year, expressed on a standardized scale, plus
the absolute value of the minimum value that
indicator takes on in the base year.
(2) On the basis of this auxiliary indicator, the
final value is calculated for the indicator :
(21)
in which is the final synthetic indicator of
dimension d, for city i in the base period;
is the indicator of dimension d, for city i,
calculated in accordance with (19) and is
the maximum value taken on by the indicator
in standardized values for the base year, in
dimension d. This is also common to all of the
techniques for calculation of the index.
Stage III: Selection of Cities to Include in
the Calculation
During the process prior to calculating the
indicators, sufficiency and completeness tests
were carried out so that the inclusion of cities
would be performed in a way that ensures the
quality of the end product, in addition to the
analysis of the cities’ relevance, in accordance
with the criteria described in Chapter I.
Information was analyzed on 851 cities for
which there was data for at least one variable
for the base year, regardless of whether it was
later selected for the calculation.

Cities in Motion - Index 2014 ST-335-E
26 IESE Business School-University of Navarra
As a first measure, criteria for the selection of
cities were applied based on population size
and the economic, political or cultural
importance of the cities within the countries
where they are located. If, as a result of this
process, any city was excluded for which there
was sufficient and complete data, the city was
included in the study universe once again.
After this, a prior cluster analysis was carried
out to assign the missing values of the
variables selected for the calculation, and on
the basis thereof cities were excluded when
there was no data for any of them, or they
could not be assigned using agglomerative
techniques, because there were no cities with
the valid data in the cluster in which they were
included when using the optimal cluster size,
not even by making it flexible to acceptable
limits.
As a result of this process, 135 cities were
included in this study.
Cities in Motion Index
Methodology of calculation DP2
Number of dimensions 10
Number of variables 49
Number of cities 135
Period 2011, 2012 and 2013
Sensitivity Analysis
In order to analyze the sensitivity of the
indicator to different calculation
methodologies and mainly to the diverse
values of the weighting factors used on the
different indicators, modifications were made
in the indicators of the various dimensions.
Furthermore, the index was recalculated without
including the dimensions of The Economy,
Governance and Urban Planning, because these
three dimensions exert a strong influence upon
the variables at the country level.
(1) Cities in Motion: Methodology of
Simple Weighting Factors
Comparing the results of the ICIM calculated
by the method of simple weighting factors, one
can see that there are differences compared
with the DP2 index in terms of both the
relative rank of each of the cities and the
average values of the indicators. For instance,
one can see in Tables 3 and 4 that the
proportion of cities with “high” and “relatively
high” performance, which amounts to 28.8%,
is higher than that found using the DP2
Technique. In the medium and low ranges, the
percentage of cities included is reduced,
slightly increasing the number of cities with a
“very low” performance rating. It is important
to bear in mind that this indicator does not
eliminate the problem of duplicate
information, and therefore the result described
was predictable.
However, in the top places within the ranking,
there were no significant changes, with Tokyo,
London, New York, Paris and Zurich remaining
in those positions. The only change took place
in the city that ranked fourth, which is Paris if
we use this methodology, pushing Zurich back
one place to the fifth position.

Cities in Motion - Index 2014
ST-335-E
27 IESE Business School-University of Navarra
Table 3
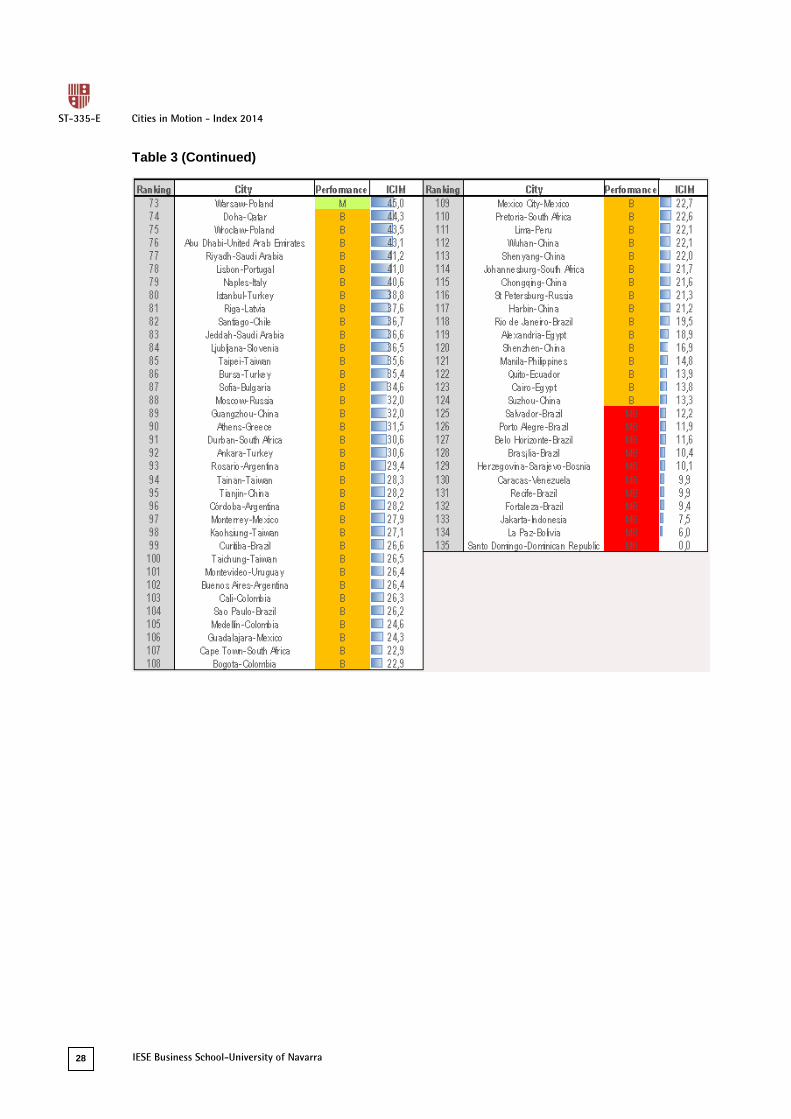
Cities in Motion - Index 2014 ST-335-E
28 IESE Business School-University of Navarra
Table 3 (Continued)
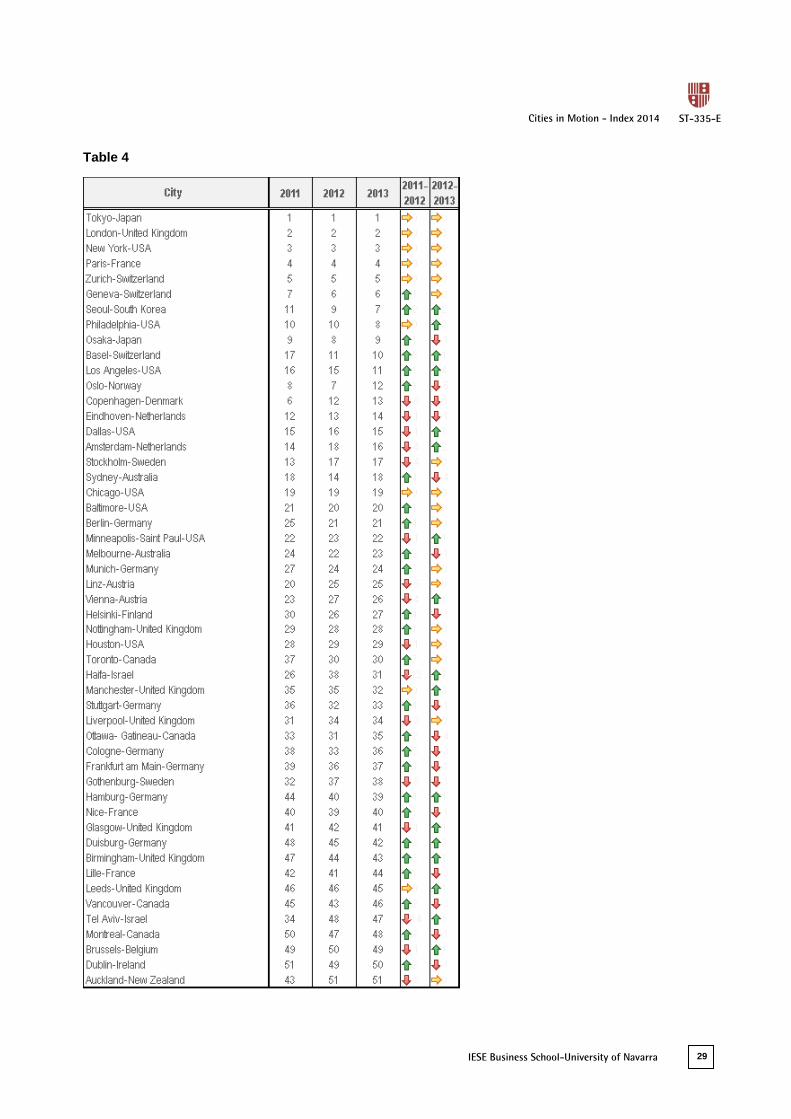
Cities in Motion - Index 2014
ST-335-E
29 IESE Business School-University of Navarra
Table 4

Cities in Motion - Index 2014 ST-335-E
30 IESE Business School-University of Navarra
(2) Cities in Motion: Mixed Methodology
This methodology combines the two
techniques described above: the DP2 technique
and the participatory technique. Stage I, in
which the synthetic indicators are calculated
for each dimension, is identical to DP2.
Stage II, corresponding to the final calculation
of the ICIM, is also an aggregation of the
synthetic indicators in each of the dimensions
using the same formula as in the DP2
technique, but the values for the weights
assigned to each of them are
assigned in accordance with subjective criteria,
bearing in mind the following aspects:
a. The synthetic indicators of the dimension,
created using variables or partial
indicators for which data is only available
at the country level, are weighted less.
Likewise, those synthetic indicators that
are combinations of variables, with data
at the city level and others at the country
level, will have a greater weight than the
first, but less weight than those that are
aggregates of variables with data
exclusively at the city level.
b. The greater the number of variables with
complete information within a dimension,
the greater the weight of the synthetic
indicator that represents it in the
calculation of the ICIM.
The results, which are shown in Tables 5 and
6, reflect the changes in the value of the ICIM
caused by the change in the weights assigned
to the dimensions’ indices, when maintaining
the weighting factors of each variable among
the dimensions.
One can observe an increase in the value of
the CIM Index for most of the cities, and a
notable increase in the number of cities with a
“high” or “very high” performance and a
decrease in those rated as having a
performance of “medium” or “very low.”

Cities in Motion - Index 2014
ST-335-E
31 IESE Business School-University of Navarra
Table 5
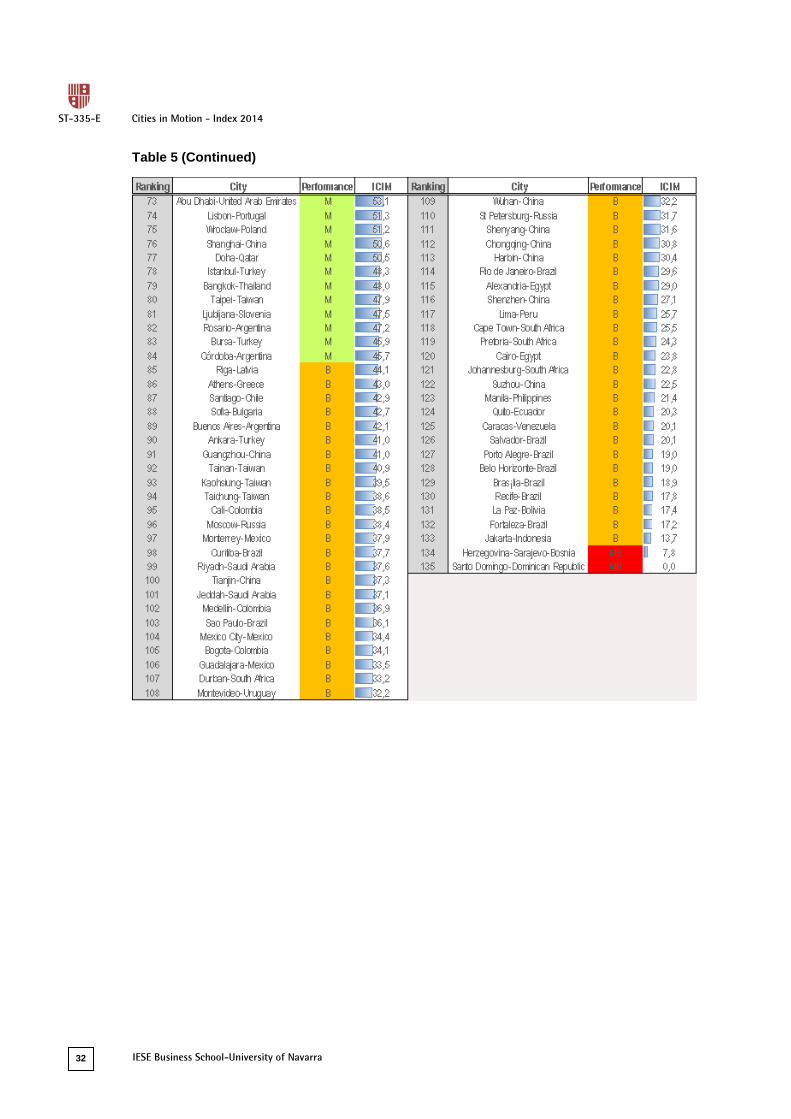
Cities in Motion - Index 2014 ST-335-E
32 IESE Business School-University of Navarra
Table 5 (Continued)

Cities in Motion - Index 2014
ST-335-E
33 IESE Business School-University of Navarra
Table 6

Cities in Motion - Index 2014 ST-335-E
34 IESE Business School-University of Navarra
(3) Alternative Calculation with Seven
Dimensions
Using this sensitivity analysis, we attempt to
see the variation that occurs in the calculation
of the index when certain dimensions are
lacking. To do so, we excluded The Economy,
Governance and Urban Planning, given the
large weight these variables hold at the
country level.
Table 7 shows the index with seven
dimensions.
Table 7

Cities in Motion - Index 2014
ST-335-E
35 IESE Business School-University of Navarra
Table 7 (Continued)
As you can see, the greatest variation occurs
in the cities of Switzerland, which show
significant variation within the ranking.
However, there are no relevant changes in the
lowest positions.
Cities in Motion - Index 2014 ST-335-E
36 IESE Business School-University of Navarra
Bibliographic References
Cattell, R. B. (1965), “Factor Analysis: An Introduction to Essentials,” Biometrics, 21, pp. 190-215.
Cherchy, L., et al. (2006), “Creating Composite Indicators with DEA and Robustness Analysis: The Case
of the Technology Achievement Index,” Public Economics Working Paper Series, n.º ces 0613, Centrum
voor Economische Studiën, Katholieke Universiteit Leuven.
European Commission, OECD, Statistics Directorate and the Directorate for Science, Technology and
Industry, and the Econometrics and Applied Statistics Unit of the Joint Research Centre (2008),
Handbook on Constructing Composite Indicators: Methodology and User Guide.
Domínguez Serrano, M., et al. (2011), “Una revisión crítica para la construcción de indicadores
sintéticos,” Revista de métodos cuantitativos para la economía y la empresa, 11, pp. 41-70.
Hermans, E., F. van den Bossche, and G. Wets (2007), “Impact of Methodological Choices on Model
Safety Ranking,” SAMO 2007, Fifth International Conference on Sensitivity Analysis of Model Output,
Budapest, Hungary, June 18-22.
Instituto Nacional de Estadística de Andalucía (1999), Indicador sintético de bienestar municipal de
Andalucía, Seville.
Jesinghaus, J. (1997), “Sustainability Indicators,” in B. Moldan and S. Billharz (eds.), Sustainability
Indicators: Report on the Project on Indicators of Sustainable Development, pp. 84-91.
Pena, J. B. (1977), Problemas de la medición del bienestar y conceptos afines, Instituto Nacional de
Estadística, Madrid.
Pena, J. B. (1978), “La distancia P: un método para la medición del nivel de bienestar,” Revista
española de economía, 8(1), pp. 49-89.
Pena, J. B. (2009), “La medición del bienestar social: una revisión crítica,” Estudios de la economía
aplicada, 27(2), pp. 229-324.
Sajeva, M., et al. (2005), “Methodology Report on European Innovation Scoreboard 2005,” discussion
paper for the Innovation/SMEs Program, European Commission.
Sharma, S. (1996), Applied Multivariate Techniques, John Wiley & Sons.
Wang, C. H. (2005), “Constructing Multivariate Process Capability Indices for Short-Run Production,”
The International Journal of Advanced Manufacturing Technology, 26, pp. 1306-1311.


Av. Pearson, 2108034 Barcelona, SpainTel.: +34 93 253 42 00
www.iese.edu
Camino del Cerro del Águila, 328023 Madrid, SpainTel.: +34 91 211 30 00
165 W. 57th StreetNew York, NY 10019-2201 USATel.: +1 646 346 8850
Center forGlobalizationand Strategy