ifls c-reactive protein data user guide · ifls laboratory was able to maintain its assay quality...
TRANSCRIPT

WORKING PAPER
IFLS C-Reactive Protein Data User Guide
Perry Hu, Elizabeth Henny Herningtyas, John Strauss, Eileen Crimmins, Jung Ki Kim, and Bondan Sikoki
RAND Labor & Population
WR-675/7
October 2013
This paper series made possible by the NIA funded RAND Center for the Study of Aging (P30AG012815) and the NICHD funded RAND Population Research Center (R24HD050906).
RAND working papers are intended to share researchers’ latest findings and to solicit informal peer review. They have been approved for circulation by RAND Labor and Population but have not been formally edited or peer reviewed. Unless otherwise indicated, working papers can be quoted and cited without permission of the author, provided the source is clearly referred to as a working paper. RAND’s publications do not necessarily reflect the opinions of its research clients and sponsors. RAND® is a registered trademark.
IFLS C-Reactive Protein Data User Guide
Perry Hu University of California, Los Angeles
Elizabeth Henny Herningtyas
Gadjah Mada University
John Strauss University of Southern California
Eileen Crimmins
University of Southern California
Jung Ki Kim University of Southern California
Bondan Sikoki Survey METER
September 2013
Preface
This document describes the design and implementation of dried blood spot assays for high sensitivity C-reactive protein (hs CRP) undertaken as part of IFLS4.
The Indonesia Family Life Survey is a continuing longitudinal socioeconomic and health survey. It is based on a sample of households representing about 83% of the Indonesian population living in 13 of the nation’s 26 provinces in 1993. The survey collects data on individual respondents, their families, their households, the communities in which they live, and the health and education facilities they use. The first wave (IFLS1) was administered in 1993 to individuals living in 7,224 households. IFLS2 sought to re-interview the same respondents four years later. A follow-up survey (IFLS2+) was conducted in 1998 with 25% of the sample to measure the immediate impact of the economic and political crisis in Indonesia. The next wave, IFLS3, was fielded on the full sample in 2000. IFLS4 was fielded in late 2007 and early 2008 on the same 1993 households and their splitoffs; 13,535 households and 44,103 individuals were interviewed.
IFLS4 was a collaborative effort of RAND, the Center for Population and Policy Studies (CPPS) of the University of Gadjah Mada and Survey Meter. Funding for IFLS4 was provided by the National Institute on Aging (NIA), grant 1R01 AG026676, the National Institute for Child Health and Human Development (NICHD), grant 1R01 HD050764 and grants from the World Bank, Indonesia and AUSAID. Partial support for the validation and assessment of the CRP assay was provided by the National Institute on Aging, grant P30 AG017265.

Chronic Inflammation and CRP
There is strong evidence supporting that chronic inflammation plays an important role in
the process of aging and age-related diseases (Singh & Newman 2011). Persistently elevated
level of CRP, a biomarker for systemic inflammation, is associated with increased risk of
cardiovascular disease, functional decline, and higher mortality in older adults. Therefore, DBS-
based CRP assay has been increasingly incorporated into community-based surveys. Compared
to venous blood samples, DBS specimens are easier to collect, and do not need to be processed
and frozen immediately.
Method of DBS-based CRP Assay
For the DBS-based CRP assay, IFLS collaborated with the laboratory at the Clinical
Pathology Department, Gadjah Mada University, Yogyakarta, Indonesia. This laboratory is part
of the network that is performing DBS-based assays for the World Health Organization (WHO)’s
Study on Global Aging and Adult Health (SAGE) project. The laboratory head, Dr. Henny
Herningtyas, was trained for DBS-based assays, including CRP, in a training course organized
by the SAGE. She participated and supervised the laboratory work for IFLS. Three technicians
worked under her, while her laboratory measured CRP levels on IFLS specimens.
CRP concentrations in DBS specimens were measured using validated ELISA method
(McDade et al, 2004). Optic densities (OD) of all samples were measured using an automated
ELISA reader. The detection limit of this CRP assay is 0.028 mg/L. The intra-assay coefficient
of variation (CV) is reported to be 5.8% and the inter-assay CV is 8.2% (McDade et al, 2004).
The IFLS laboratory used the reagents from the same manufacturers specified in the assay
protocol. Some of the reagents were not available locally. Therefore, we worked with the WHO

(SAGE project) to purchase and ship these reagents into Indonesia, under shipping conditions
specified by the manufacturers.
Validation and Quality Control of DBS-based CRP Assay
1. Pretest
Venous and DBS specimens for the pre-test were collected from 67 volunteers who were
recruited through the USC/UCLA Center on Biodemography and Population Health (CBPH).
Serum samples were sent to the laboratory at Department of Laboratory Medicine, University of
Washington (UW), for high-sensitivity CRP (hsCRP) assay (Laboratory director: Alan Potter,
PhD). Two DBS cards were collected from each volunteer via direct finger prick, with two
blood spots on each card. One set of DBS cards were sent to UW for DBS-based hsCRP assay,
while the other set were sent to the laboratory at Gadjah Mada University, Indonesia. Validation
samples for both laboratories were shipped with dry ice. Duration of shipment to Indonesia was
approximately 48 hours.
Fifteen validation samples and 79 IFLS study samples were measured for CRP levels
during the pretest, which was conducted in December of 2011 and lasted for 5 days. Fourteen
validation samples had DBS-based CRP values from the ILFS laboratory as well as both DBS-
based and serum-based values from UW. For calculation purpose, results with undetectable CRP
levels were assigned a value of 0.001 mg/L. The correlation coefficients for CRP results were
0.98 between the IFLS DBS and UW DBS, 0.97 between the IFLS DBS and serum, and 0.97
between the UW DBS and serum. The average differences were 0.11 mg/L (standard deviation:
0.54 mg/L), 0.14 mg/L (standard deviation: 0.60 mg/L) and -0.21 (standard deviation: 0.61

mg/L), respectively. IFLS also had repeated measurements of CRP levels on 10 samples from
study participants. The correlation coefficient between the test-retest results was 0.998.
2. Ongoing assay quality control with validation samples
The IFLS research team, led by Dr. Peifeng (Perry) Hu, established regular
communication with the laboratory and reviewed the CRP results from study samples on a
biweekly basis. All CRP standards, controls, and study samples were measured in duplicate.
Individual samples with duplicate CV above 10% were re-tested, unless both concentrations
were less than 0.2 mg/L. When inter-assay variability exceeded 10%, which was based on
control values, the entire microwell plate would be rerun.
During the testing of study samples, IFLS included 8 validations on every 40th
microplate, approximately every 1,500 study samples: A total of 48 validation samples were
measured over a 6-month period. Using serum-based CRP levels as the gold standard, the results
from IFLS and UW were comparable. For each batch of 8 validation samples, the correlation
coefficients between DBS-based and serum-based values were all above 0.95 in both
laboratories.
Summary statistics from the DBS CRP readings from both the Indonesian and UW labs
are shown in Table 1. Serum equivalents are also shown as is the serum-based readings from the
UW lab. Regressions of the UW results on the Indonesian lab results for DBS serum equivalents
and Bland-Altman plots are shown in Figure 1. Figure 2 shows the same for the Indonesian DBS
serum equivalents and the UW serum samples and Figure 3 for the UW serum samples and the
UW DBS serum equivalents. The R2s are all above 0.90, and the plots, including the Bland
Altman plots look good.
The results from validation samples have showed that DBS-based CRP values from IFLS
had excellent correlations with serum-based values and/or DBS-based results from UW. The
IFLS laboratory was able to maintain its assay quality during the testing of actual study samples.
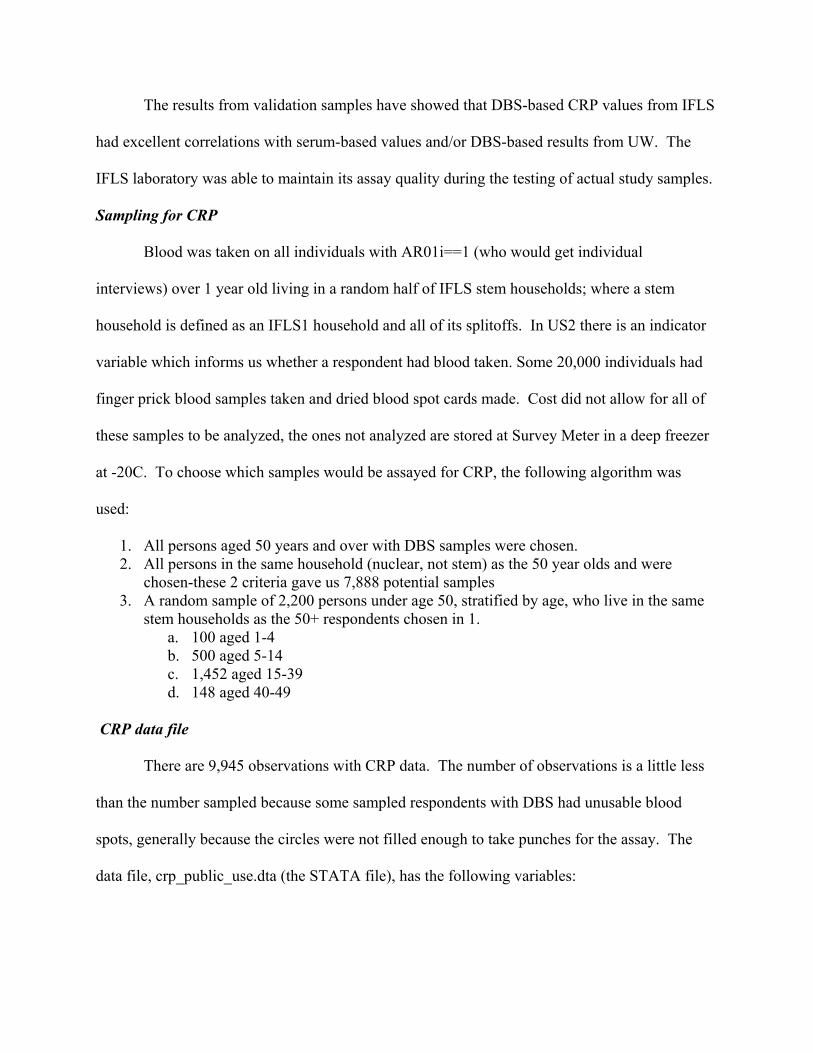
Sampling for CRP
Blood was taken on all individuals with AR01i==1 (who would get individual
interviews) over 1 year old living in a random half of IFLS stem households; where a stem
household is defined as an IFLS1 household and all of its splitoffs. In US2 there is an indicator
variable which informs us whether a respondent had blood taken. Some 20,000 individuals had
finger prick blood samples taken and dried blood spot cards made. Cost did not allow for all of
these samples to be analyzed, the ones not analyzed are stored at Survey Meter in a deep freezer
at -20C. To choose which samples would be assayed for CRP, the following algorithm was
used:
1. All persons aged 50 years and over with DBS samples were chosen. 2. All persons in the same household (nuclear, not stem) as the 50 year olds and were
chosen-these 2 criteria gave us 7,888 potential samples 3. A random sample of 2,200 persons under age 50, stratified by age, who live in the same
stem households as the 50+ respondents chosen in 1. a. 100 aged 1-4 b. 500 aged 5-14 c. 1,452 aged 15-39 d. 148 aged 40-49
CRP data file
There are 9,945 observations with CRP data. The number of observations is a little less
than the number sampled because some sampled respondents with DBS had unusable blood
spots, generally because the circles were not filled enough to take punches for the assay. The
data file, crp_public_use.dta (the STATA file), has the following variables:
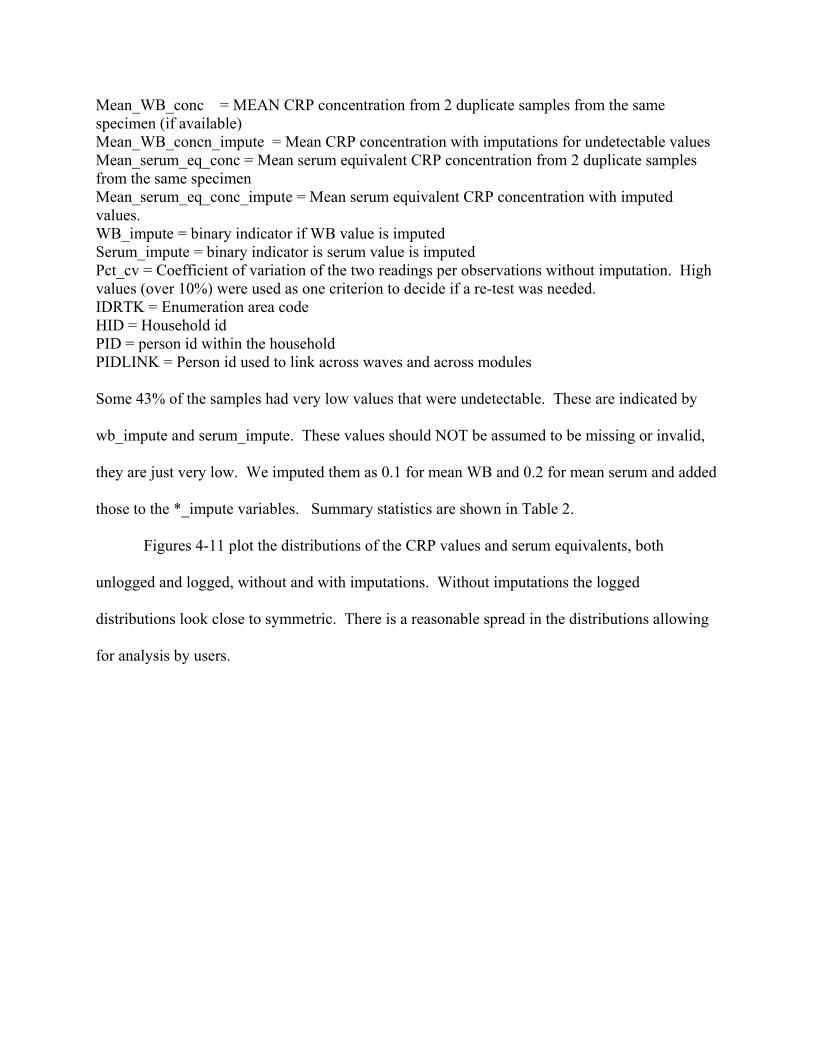
Mean_WB_conc = MEAN CRP concentration from 2 duplicate samples from the same specimen (if available) Mean_WB_concn_impute = Mean CRP concentration with imputations for undetectable values Mean_serum_eq_conc = Mean serum equivalent CRP concentration from 2 duplicate samples from the same specimen Mean_serum_eq_conc_impute = Mean serum equivalent CRP concentration with imputed values. WB_impute = binary indicator if WB value is imputed Serum_impute = binary indicator is serum value is imputed Pct_cv = Coefficient of variation of the two readings per observations without imputation. High values (over 10%) were used as one criterion to decide if a re-test was needed. IDRTK = Enumeration area code HID = Household id PID = person id within the household PIDLINK = Person id used to link across waves and across modules Some 43% of the samples had very low values that were undetectable. These are indicated by
wb_impute and serum_impute. These values should NOT be assumed to be missing or invalid,
they are just very low. We imputed them as 0.1 for mean WB and 0.2 for mean serum and added
those to the *_impute variables. Summary statistics are shown in Table 2.
Figures 4-11 plot the distributions of the CRP values and serum equivalents, both
unlogged and logged, without and with imputations. Without imputations the logged
distributions look close to symmetric. There is a reasonable spread in the distributions allowing
for analysis by users.

Table 1 Indonesia and UW Validation Samples Summary Statistics
N Mean SD Min Max Median DBS_INDONESIA 46 1.31 1.28 0.0005 6.026 0.95 DBS_SERUM_EQUI_INDONESIA 46 2.62 2.56 0.001 12.052 1.89 DBS_UW 46 2.64 2.54 0.13 9.38 2.01 DBS_UW_SERUM_EQUI 46 2.41 2.17 0.11 7.90 1.70 SERUM_UW 46 2.34 2.42 0.00 9.5 1.50

Figure 1 Regression and Bland-Altman Plot of UW Serum Equivalent on IFLS Serum Equivalent-Validation Samples
N=46 Equation
DBS_UW_Serum_Equi = 0.29868 + 0.80540*DBS_Serum_Equi_Indonesia
R2 .9009
Figure 2 Regression and Bland-Altman Plot of UW Serum on IFLS Serum Equivalent
CRP, mg/L (Plasma Eq-Mean)
0
2
4
6
8
10
12
14
DBS_Serum_Equi_Indonesia
0 2 4 6 8 10 12 14
Diff b/w UW Serum Equi & IFLS Serum Equi
-2-1
01
2
34
56
Average of UW Serum Equi & IFLS Serum Equi
0 2 4 6 8 10 12
Bland-Altman Plot

Validation Samples
N=46 Equation
Serum_uw = -0.06608 + 0.91602*DBS_Serum_Equi_Indonesia
R2 .9392
serum_uw
0
2
4
6
8
10
12
14
DBS_Serum_Equi_Indonesia
0 2 4 6 8 10 12 14
Difference b/w UW Serum & IFLS Serum Equi
-4
-2
0
2
4
6
Average of UW Serum & IFLS Serum Equi
-4 -2 0 2 4 6 8 10 12
Bland-Altman Plot
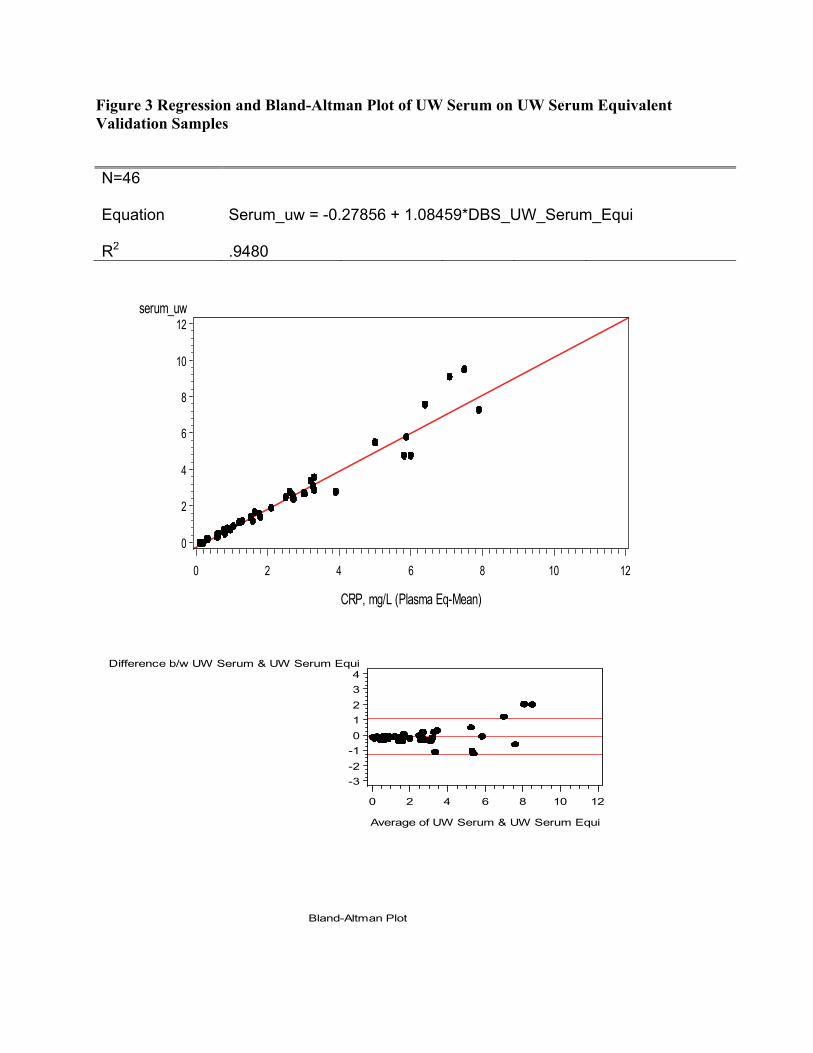
Figure 3 Regression and Bland-Altman Plot of UW Serum on UW Serum Equivalent Validation Samples
N=46 Equation
Serum_uw = -0.27856 + 1.08459*DBS_UW_Serum_Equi
R2 .9480
serum_uw
0
2
4
6
8
10
12
CRP, mg/L (Plasma Eq-Mean)
0 2 4 6 8 10 12
Difference b/w UW Serum & UW Serum Equi
-3
-2
-1
0
1
2
3
4
Average of UW Serum & UW Serum Equi
0 2 4 6 8 10 12
Bland-Altman Plot
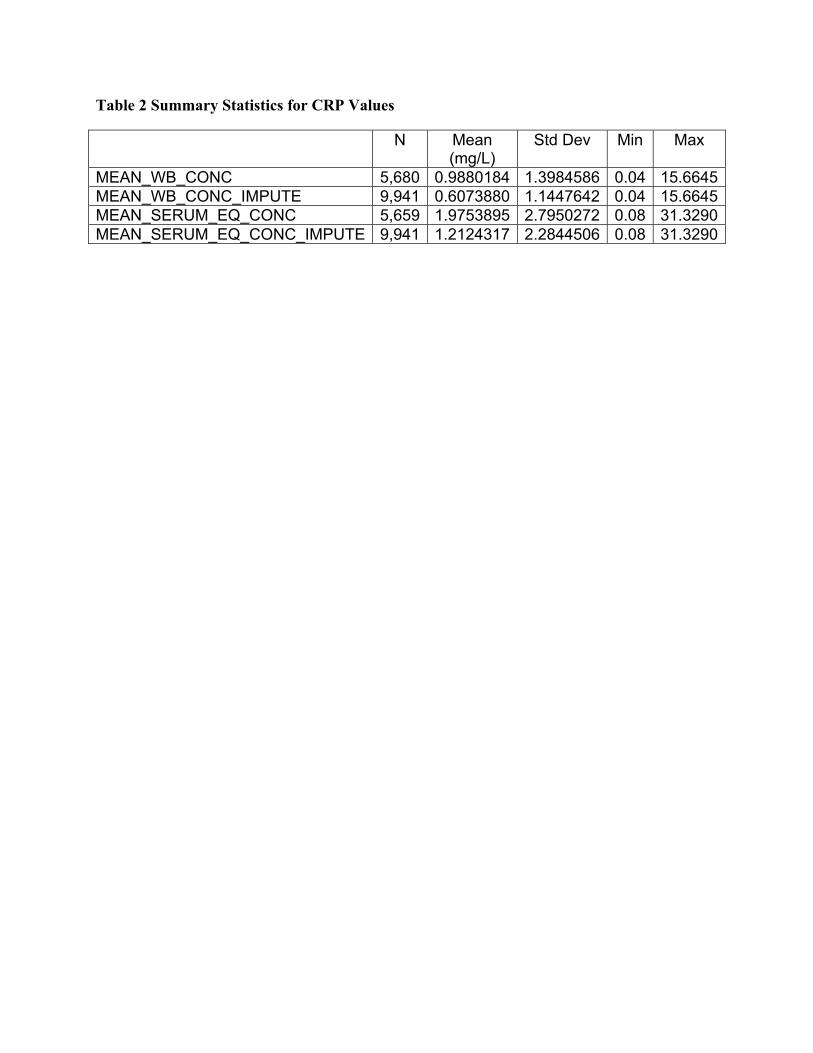
Table 2 Summary Statistics for CRP Values
N Mean (mg/L)
Std Dev Min Max
MEAN_WB_CONC 5,680 0.9880184 1.3984586 0.04 15.6645MEAN_WB_CONC_IMPUTE 9,941 0.6073880 1.1447642 0.04 15.6645MEAN_SERUM_EQ_CONC 5,659 1.9753895 2.7950272 0.08 31.3290MEAN_SERUM_EQ_CONC_IMPUTE 9,941 1.2124317 2.2844506 0.08 31.3290

Figure 4 Mean CRP distribution-without imputations
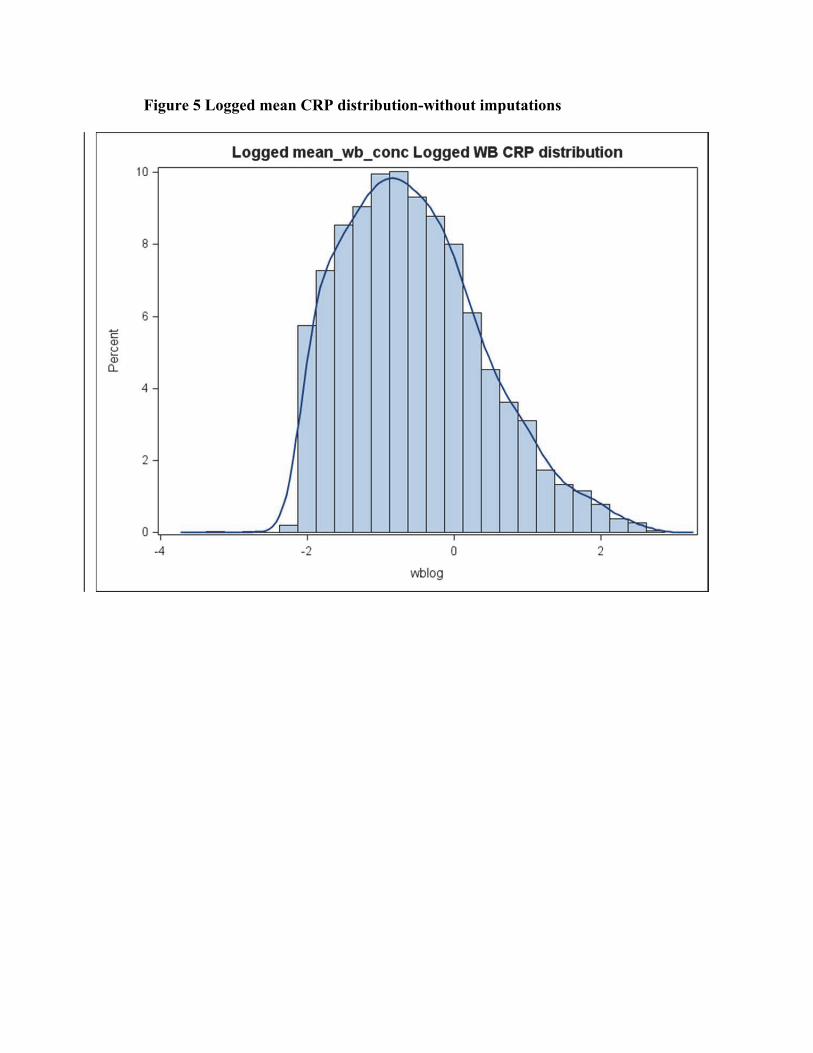
Figure 5 Logged mean CRP distribution-without imputations
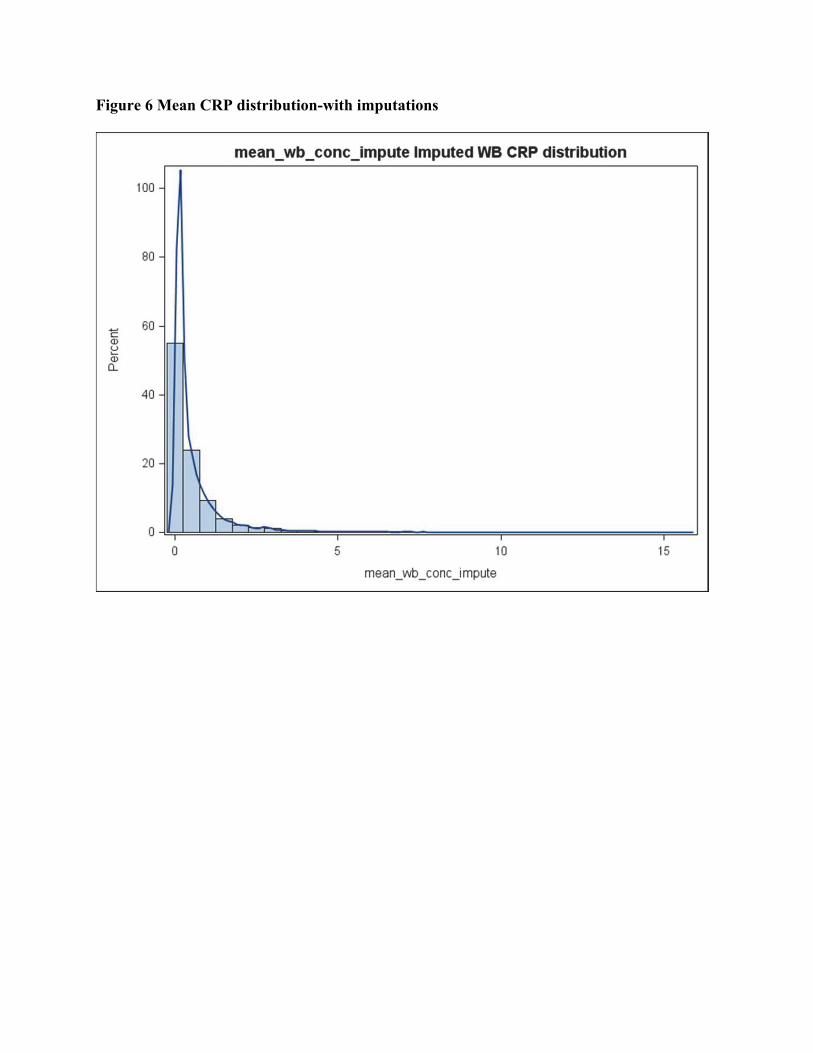
Figure 6 Mean CRP distribution-with imputations
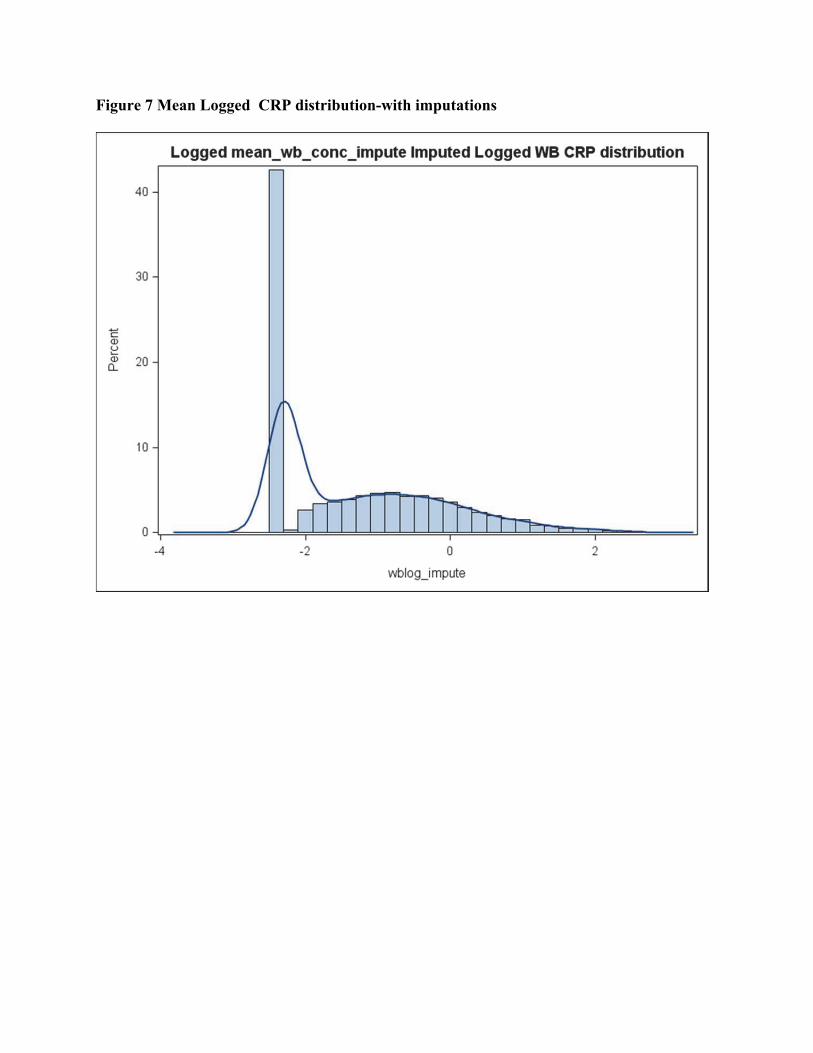
Figure 7 Mean Logged CRP distribution-with imputations

Figure 8 Mean serum-equivalent CRP distribution-without imputations

Figure 9 Mean logged serum-equivalent CRP distribution-without imputations
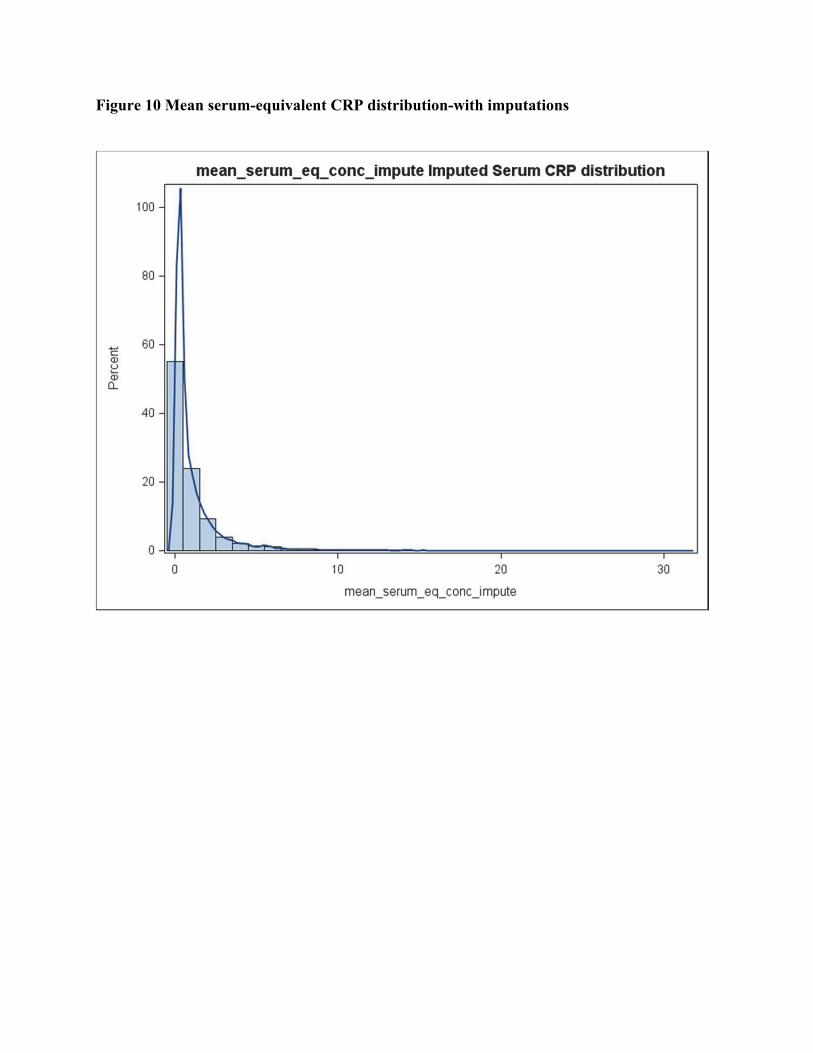
Figure 10 Mean serum-equivalent CRP distribution-with imputations
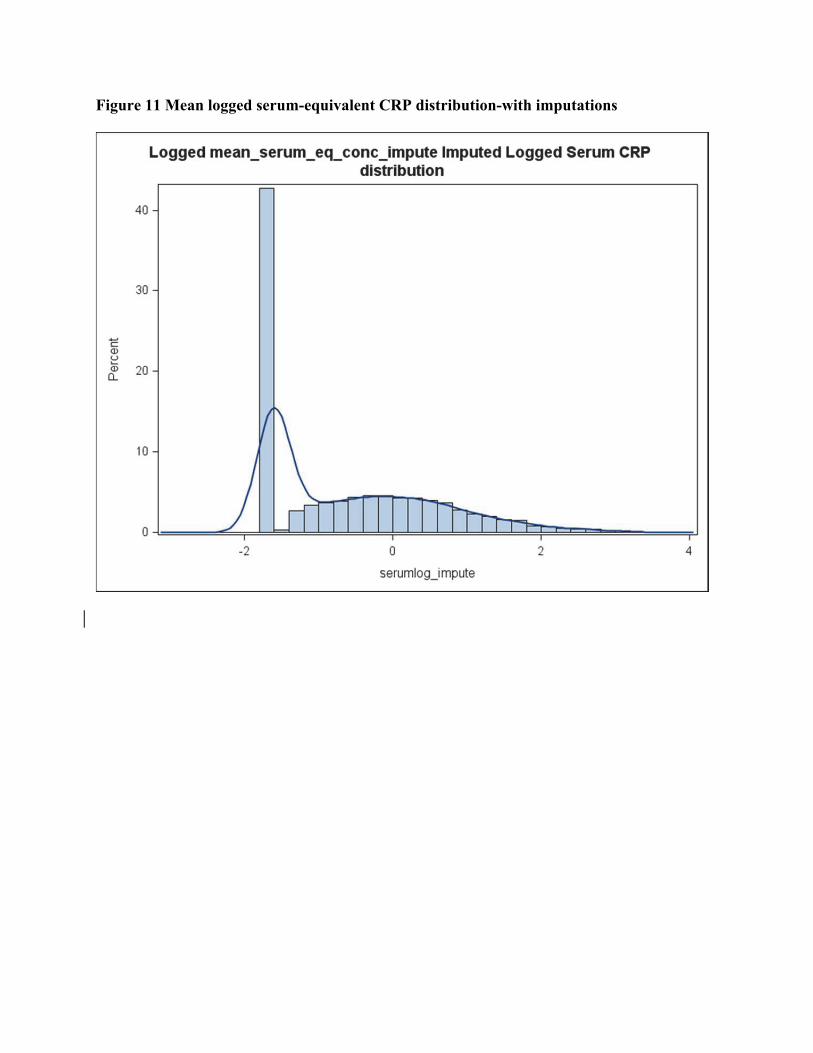
Figure 11 Mean logged serum-equivalent CRP distribution-with imputations

References:
McDade TW, Burhop J, Dohnal J. High-sensitivity enzyme immunoassay for C-reactive protein in dried blood spots. 2004. Clin Chem. 50:652-654. Singh T, Newman AB. Inflammatory markers in population studies of aging. Ageing Res Rev. 2011. doi: 10.1016/j.arr.2010.11.002.