ifpri- food security and research gaps for agriculture development in south asia, p k joshi, ifpri
TRANSCRIPT
Food Security and Research Gaps for Agriculture
Development in South Asia
Challenges and Opportunities
P K Joshi
International Food Policy Research Institute
South Asia Regional Office
New Delhi 110012
Sri Lanka Agricultural Economics Society
Colombo, Sri Lanka
13 December 2014
International Food Policy Research Institute
Outline
Key challenges in South Asian agriculture
Opportunities in changing scenario
Research strategy and priorities
I
Key Challenges in South Asian Agriculture
International Food Policy Research Institute
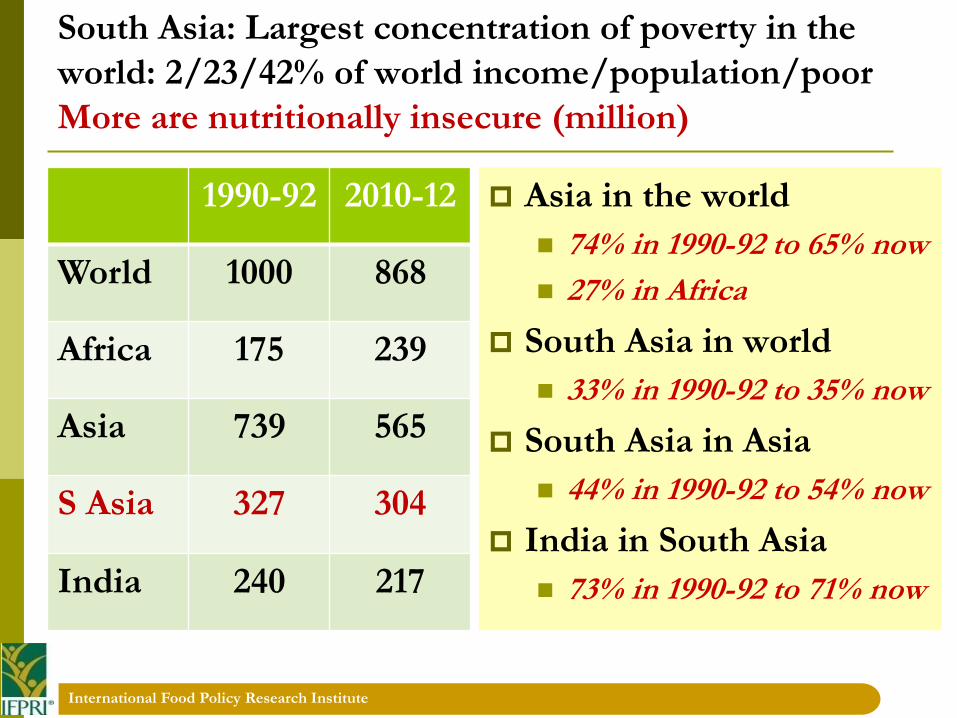
South Asia: Largest concentration of poverty in the
world: 2/23/42% of world income/population/poor
More are nutritionally insecure (million)
1990-92 2010-12
World 1000 868
Africa 175 239
Asia 739 565
S Asia 327 304
India 240 217
Asia in the world
74% in 1990-92 to 65% now
27% in Africa
South Asia in world
33% in 1990-92 to 35% now
South Asia in Asia
44% in 1990-92 to 54% now
India in South Asia
73% in 1990-92 to 71% now
International Food Policy Research Institute
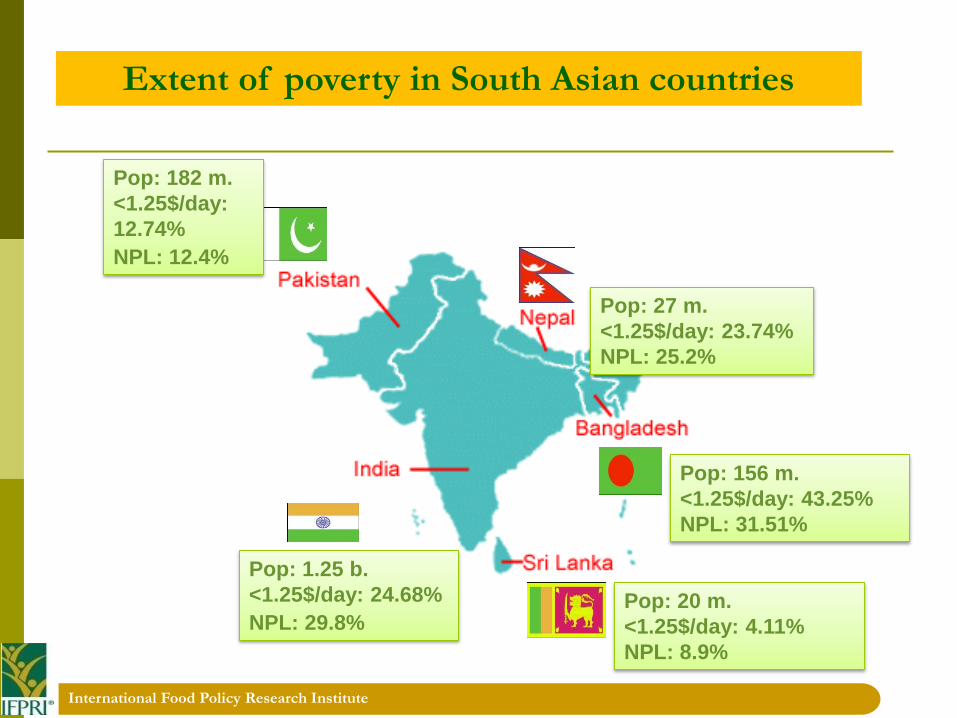
Pop: 182 m.
<1.25$/day:
12.74%
NPL: 12.4%
Pop: 1.25 b.
<1.25$/day: 24.68%
NPL: 29.8%Pop: 20 m.
<1.25$/day: 4.11%
NPL: 8.9%
Pop: 156 m.
<1.25$/day: 43.25%
NPL: 31.51%
Pop: Pop: 27 m.
<1.25$/day: 23.74%
NPL: 25.2%
Extent of poverty in South Asian countries
International Food Policy Research Institute
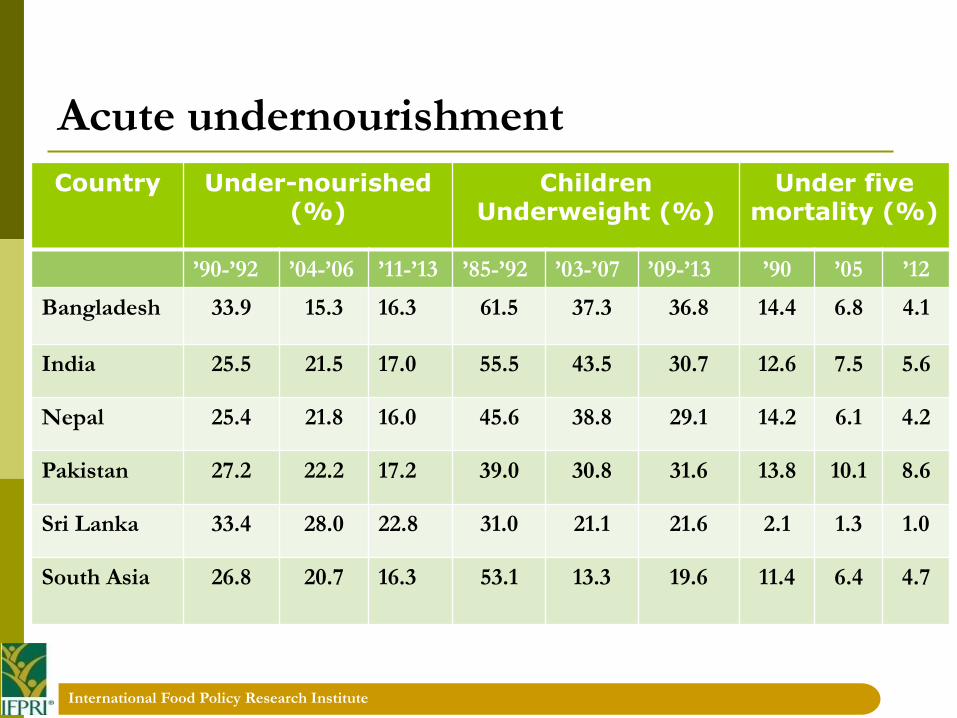
Acute undernourishment
Country Under-nourished(%)
Children Underweight (%)
Under five mortality (%)
’90-’92 ’04-’06 ’11-’13 ’85-’92 ’03-’07 ’09-’13 ’90 ’05 ’12
Bangladesh 33.9 15.3 16.3 61.5 37.3 36.8 14.4 6.8 4.1
India 25.5 21.5 17.0 55.5 43.5 30.7 12.6 7.5 5.6
Nepal 25.4 21.8 16.0 45.6 38.8 29.1 14.2 6.1 4.2
Pakistan 27.2 22.2 17.2 39.0 30.8 31.6 13.8 10.1 8.6
Sri Lanka 33.4 28.0 22.8 31.0 21.1 21.6 2.1 1.3 1.0
South Asia 26.8 20.7 16.3 53.1 13.3 19.6 11.4 6.4 4.7
International Food Policy Research Institute
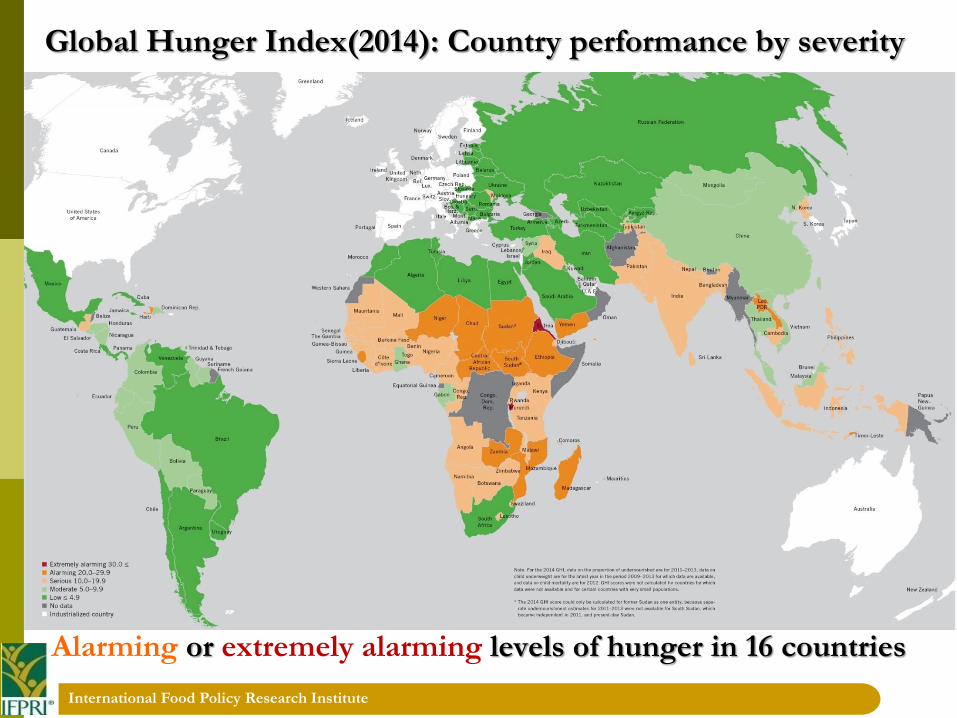
Global Hunger Index(2014): Country performance by severity
Alarming or extremely alarming levels of hunger in 16 countries
International Food Policy Research Institute
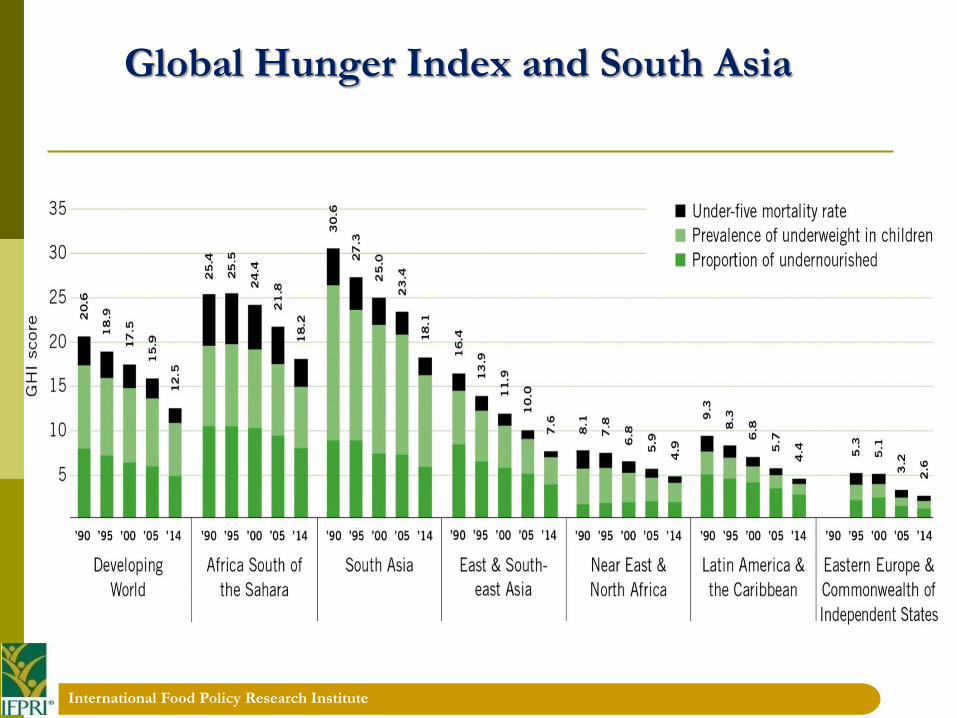
Global Hunger Index and South Asia
International Food Policy Research Institute
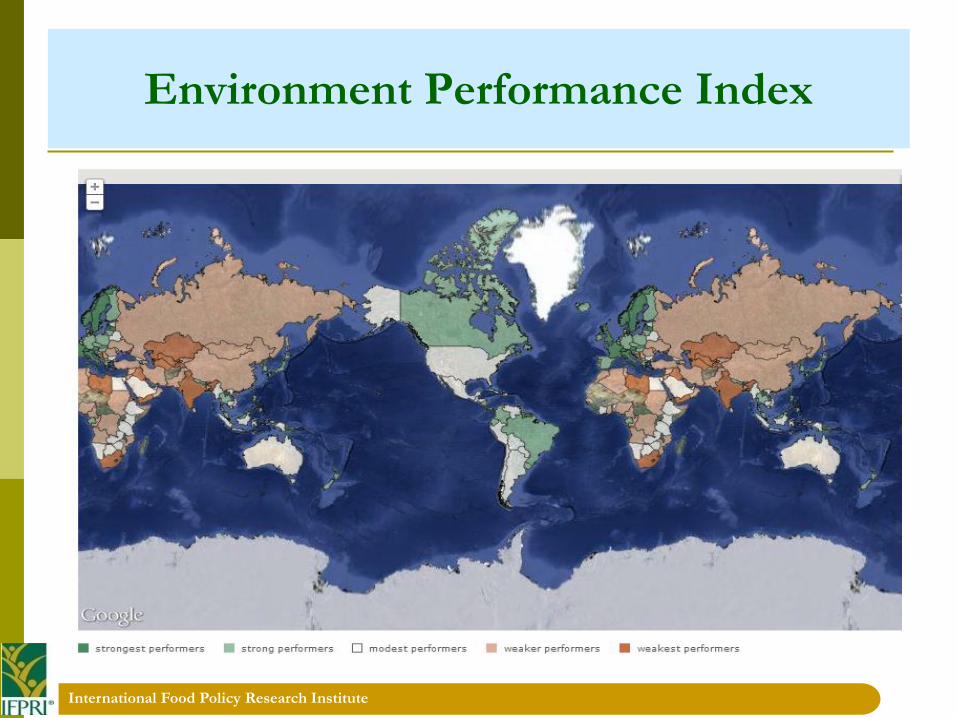
Environment Performance Index
International Food Policy Research Institute
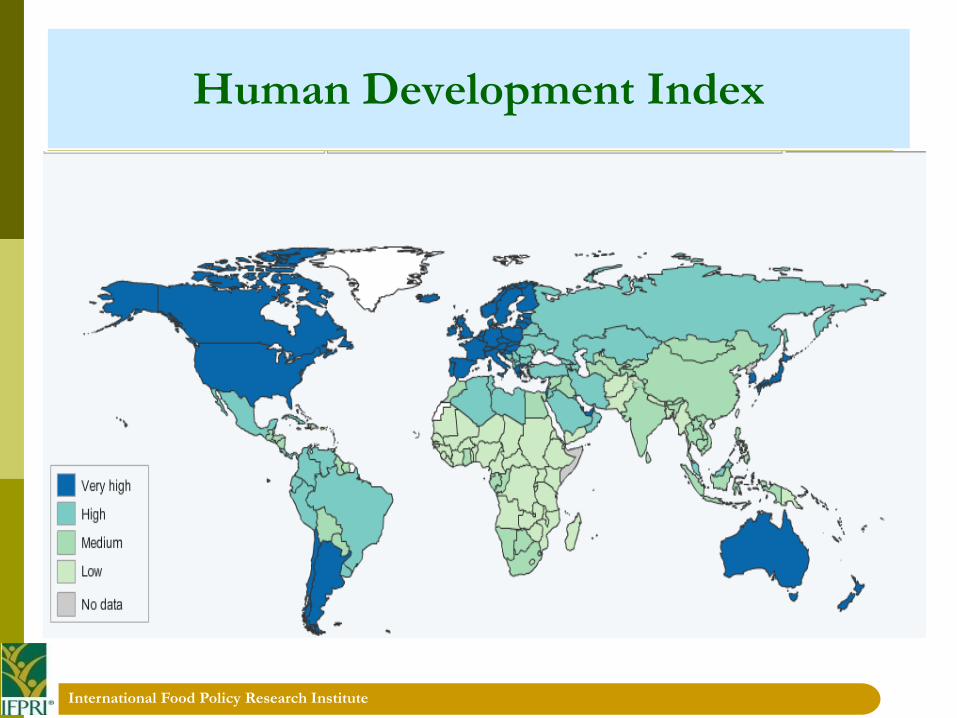
Human Development Index
International Food Policy Research Institute
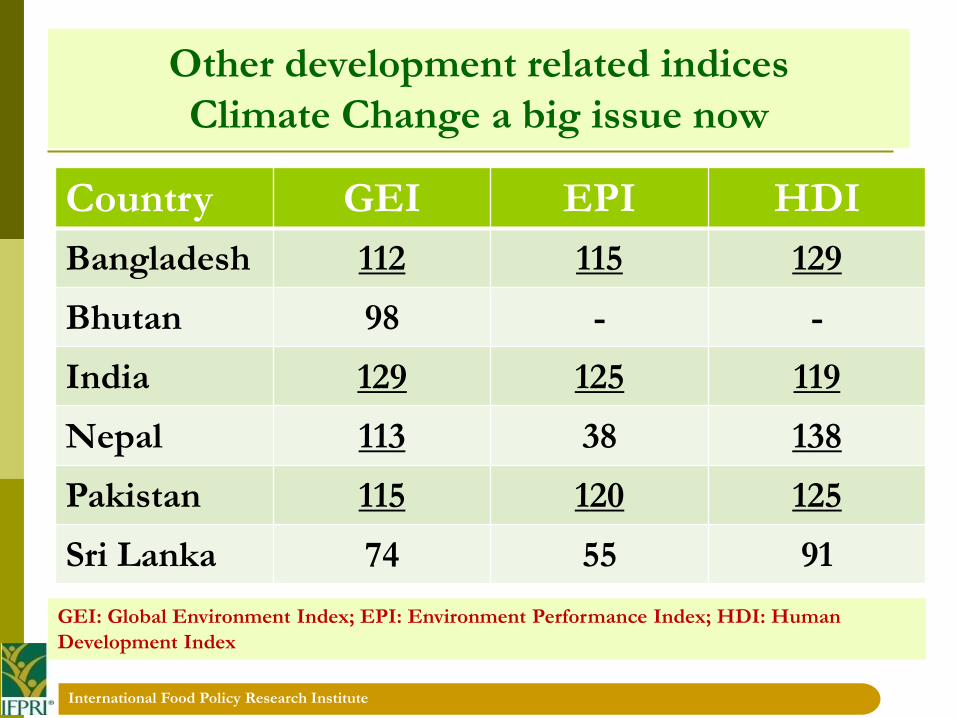
Other development related indices
Climate Change a big issue now
Country GEI EPI HDI
Bangladesh 112 115 129
Bhutan 98 - -
India 129 125 119
Nepal 113 38 138
Pakistan 115 120 125
Sri Lanka 74 55 91
GEI: Global Environment Index; EPI: Environment Performance Index; HDI: Human
Development Index

International Food Policy Research Institute
GDP per capita (constant 2005US$)
Country 1990 2001 2011
Bangladesh 270 362 569
Bhutan 643 1042 1917
India 403 596 1086
Nepal 233 305 385
Pakistan 525 596 756
Sri Lanka 710 1052 1725
E Asia & Pacific 554 3954 5222
International Food Policy Research Institute
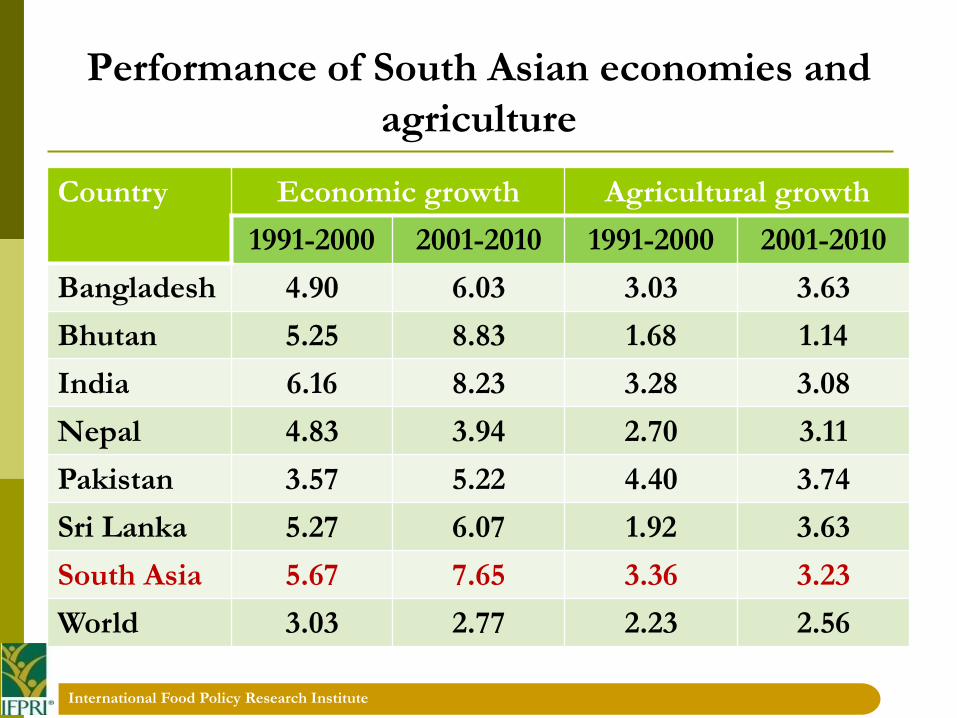
Performance of South Asian economies and
agriculture
Country Economic growth Agricultural growth
1991-2000 2001-2010 1991-2000 2001-2010
Bangladesh 4.90 6.03 3.03 3.63
Bhutan 5.25 8.83 1.68 1.14
India 6.16 8.23 3.28 3.08
Nepal 4.83 3.94 2.70 3.11
Pakistan 3.57 5.22 4.40 3.74
Sri Lanka 5.27 6.07 1.92 3.63
South Asia 5.67 7.65 3.36 3.23
World 3.03 2.77 2.23 2.56
International Food Policy Research Institute
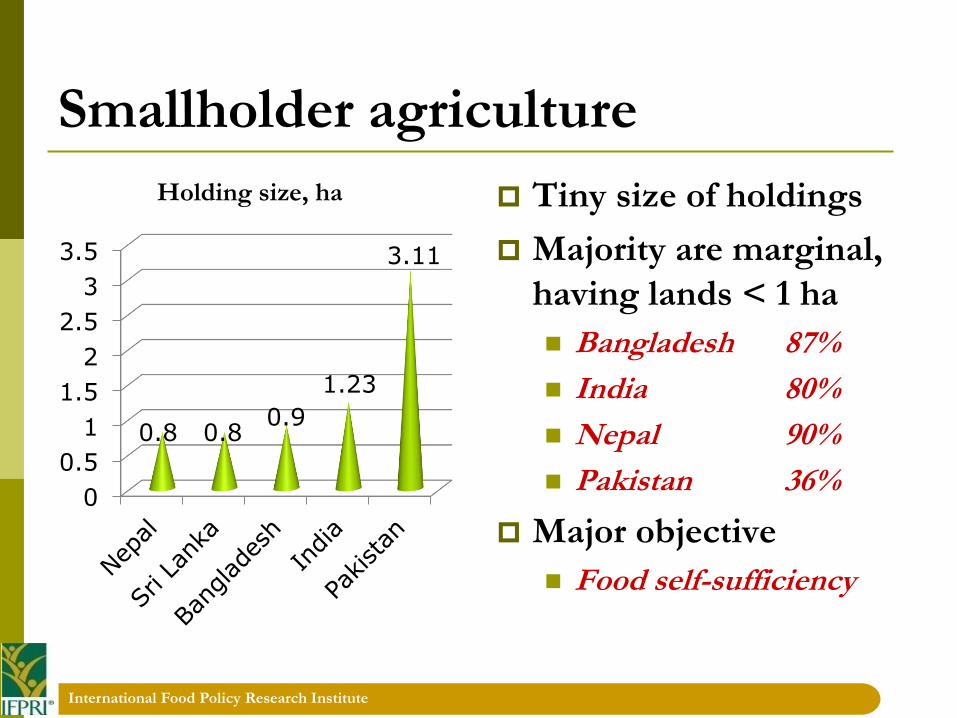
Smallholder agriculture
0
0.5
1
1.5
2
2.5
3
3.5
0.8 0.80.9
1.23
3.11
Holding size, ha Tiny size of holdings
Majority are marginal,
having lands < 1 ha
Bangladesh 87%
India 80%
Nepal 90%
Pakistan 36%
Major objective
Food self-sufficiency
International Food Policy Research Institute
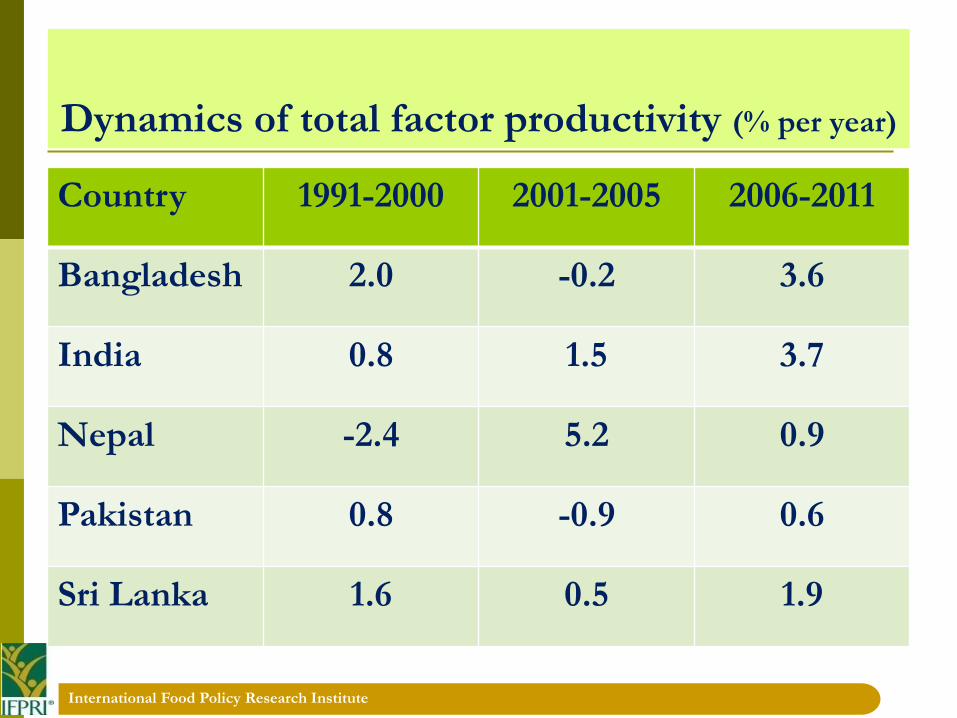
Dynamics of total factor productivity (% per year)
Country 1991-2000 2001-2005 2006-2011
Bangladesh 2.0 -0.2 3.6
India 0.8 1.5 3.7
Nepal -2.4 5.2 0.9
Pakistan 0.8 -0.9 0.6
Sri Lanka 1.6 0.5 1.9
International Food Policy Research Institute
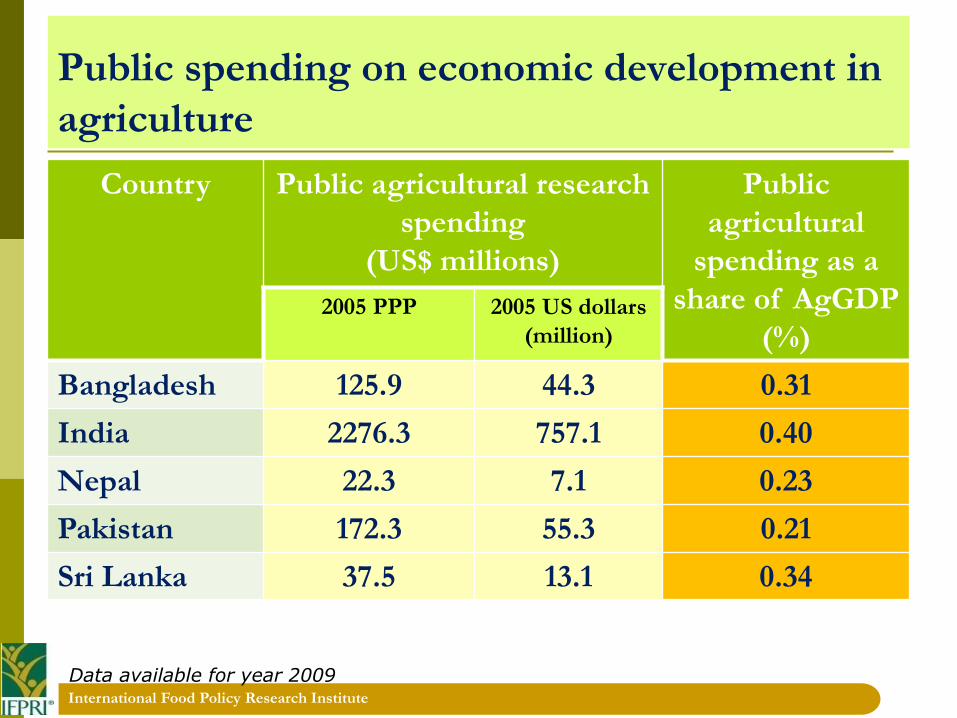
Public spending on economic development in
agriculture
Country Public agricultural research
spending
(US$ millions)
Public
agricultural
spending as a
share of AgGDP
(%)2005 PPP 2005 US dollars
(million)
Bangladesh 125.9 44.3 0.31
India 2276.3 757.1 0.40
Nepal 22.3 7.1 0.23
Pakistan 172.3 55.3 0.21
Sri Lanka 37.5 13.1 0.34
Data available for year 2009
International Food Policy Research Institute
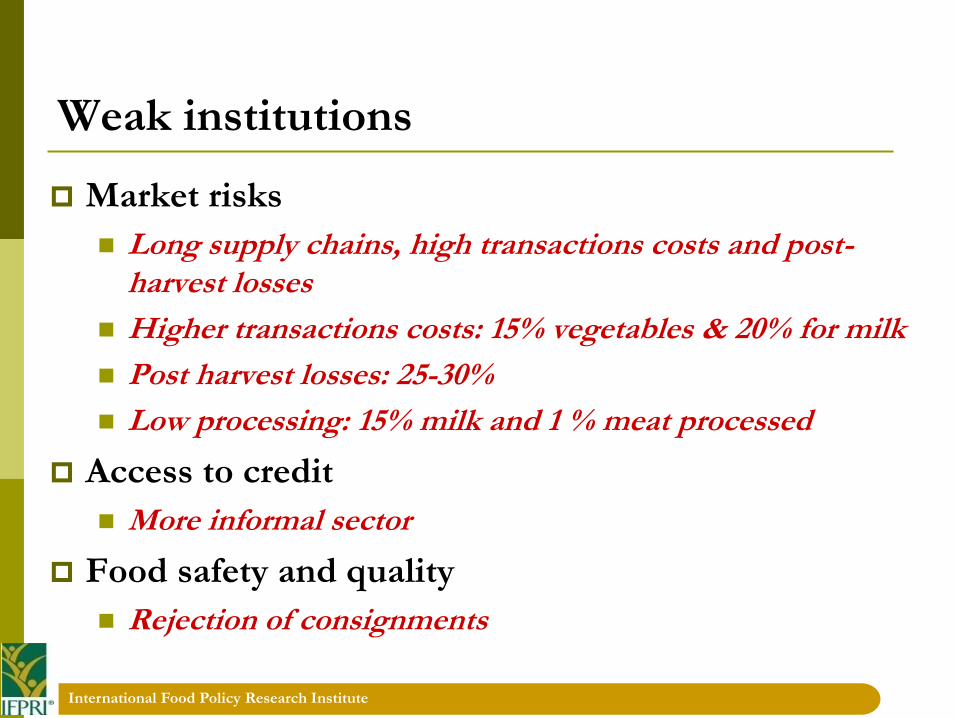
Weak institutions
Market risks
Long supply chains, high transactions costs and post-harvest losses
Higher transactions costs: 15% vegetables & 20% for milk
Post harvest losses: 25-30%
Low processing: 15% milk and 1 % meat processed
Access to credit
More informal sector
Food safety and quality
Rejection of consignments
International Food Policy Research Institute
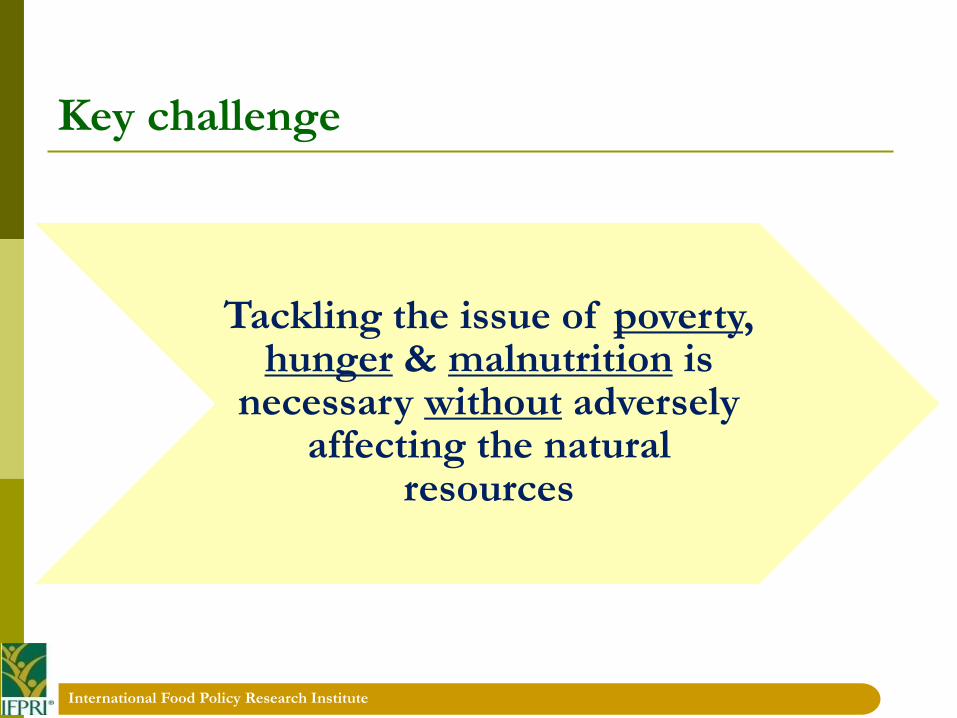
Key challenge
Tackling the issue of poverty, hunger & malnutrition is
necessary without adversely affecting the natural
resources
International Food Policy Research Institute
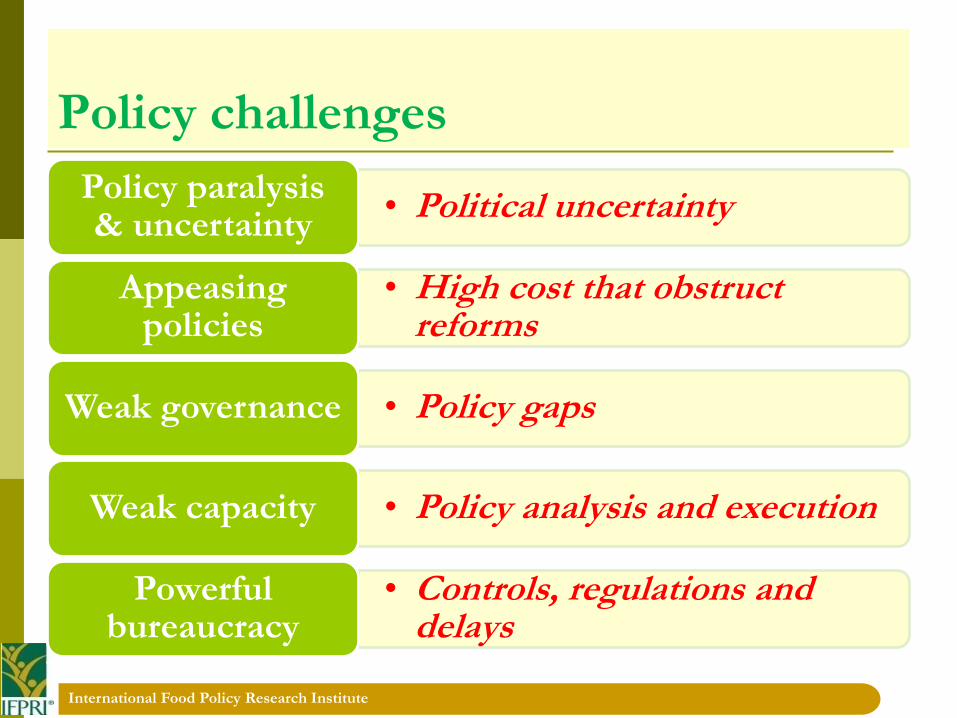
Policy challenges
• Political uncertainty Policy paralysis & uncertainty
• High cost that obstruct reforms
Appeasing policies
• Policy gaps Weak governance
• Policy analysis and execution Weak capacity
• Controls, regulations and delays
Powerful bureaucracy
II
Opportunities in Agriculture Sector in South Asia
International Food Policy Research Institute
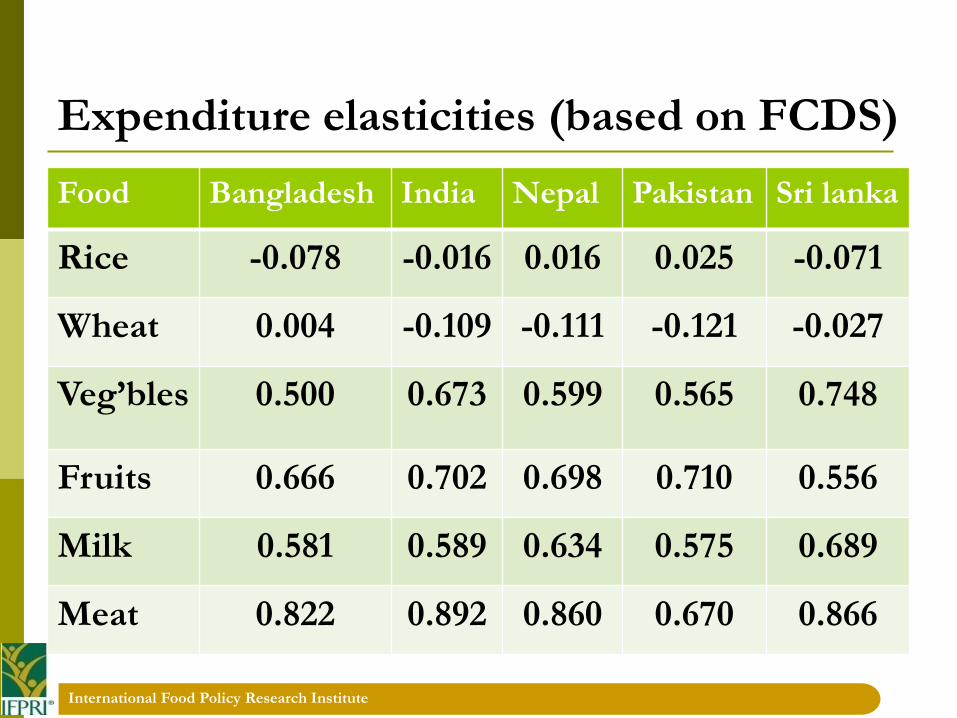
Expenditure elasticities (based on FCDS)
Food Bangladesh India Nepal Pakistan Sri lanka
Rice -0.078 -0.016 0.016 0.025 -0.071
Wheat 0.004 -0.109 -0.111 -0.121 -0.027
Veg’bles 0.500 0.673 0.599 0.565 0.748
Fruits 0.666 0.702 0.698 0.710 0.556
Milk 0.581 0.589 0.634 0.575 0.689
Meat 0.822 0.892 0.860 0.670 0.866
International Food Policy Research Institute
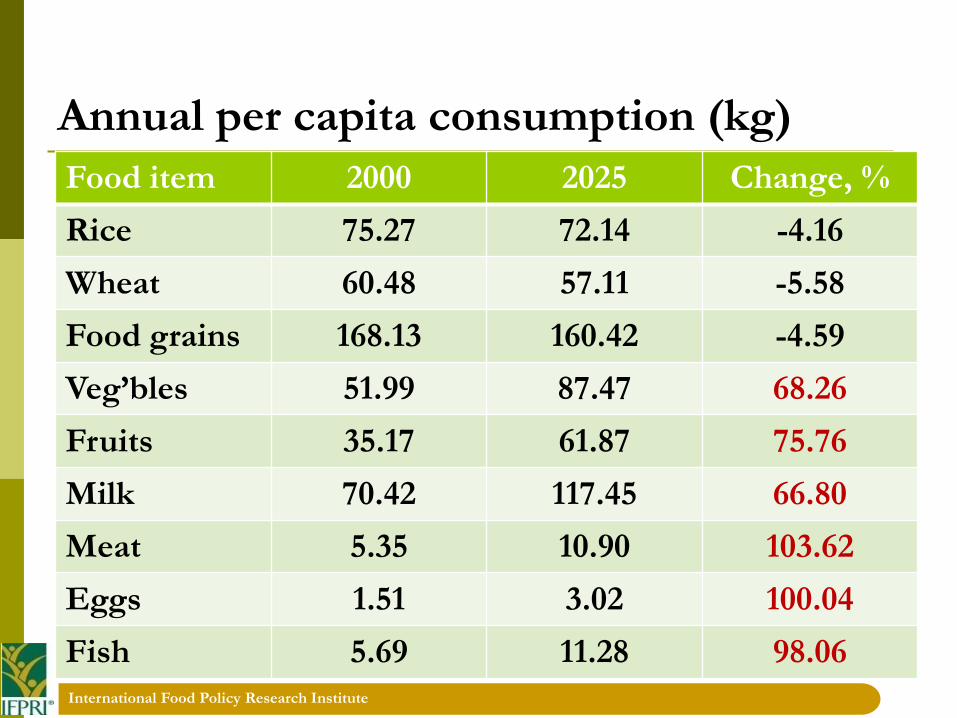
Annual per capita consumption (kg)
Food item 2000 2025 Change, %
Rice 75.27 72.14 -4.16
Wheat 60.48 57.11 -5.58
Food grains 168.13 160.42 -4.59
Veg’bles 51.99 87.47 68.26
Fruits 35.17 61.87 75.76
Milk 70.42 117.45 66.80
Meat 5.35 10.90 103.62
Eggs 1.51 3.02 100.04
Fish 5.69 11.28 98.06
International Food Policy Research Institute
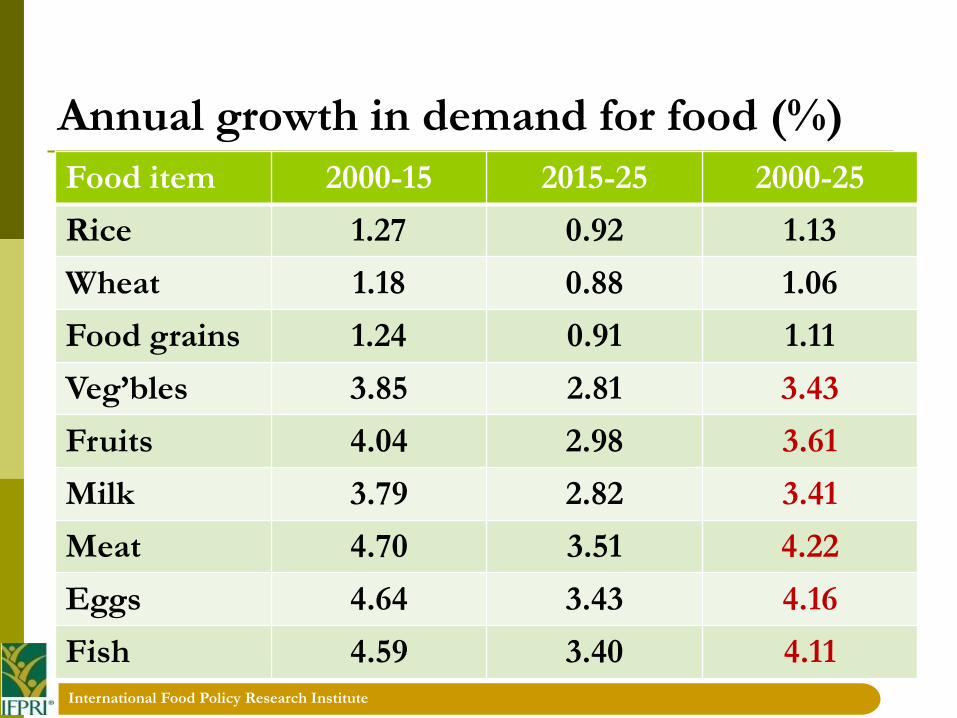
Annual growth in demand for food (%)
Food item 2000-15 2015-25 2000-25
Rice 1.27 0.92 1.13
Wheat 1.18 0.88 1.06
Food grains 1.24 0.91 1.11
Veg’bles 3.85 2.81 3.43
Fruits 4.04 2.98 3.61
Milk 3.79 2.82 3.41
Meat 4.70 3.51 4.22
Eggs 4.64 3.43 4.16
Fish 4.59 3.40 4.11
International Food Policy Research Institute
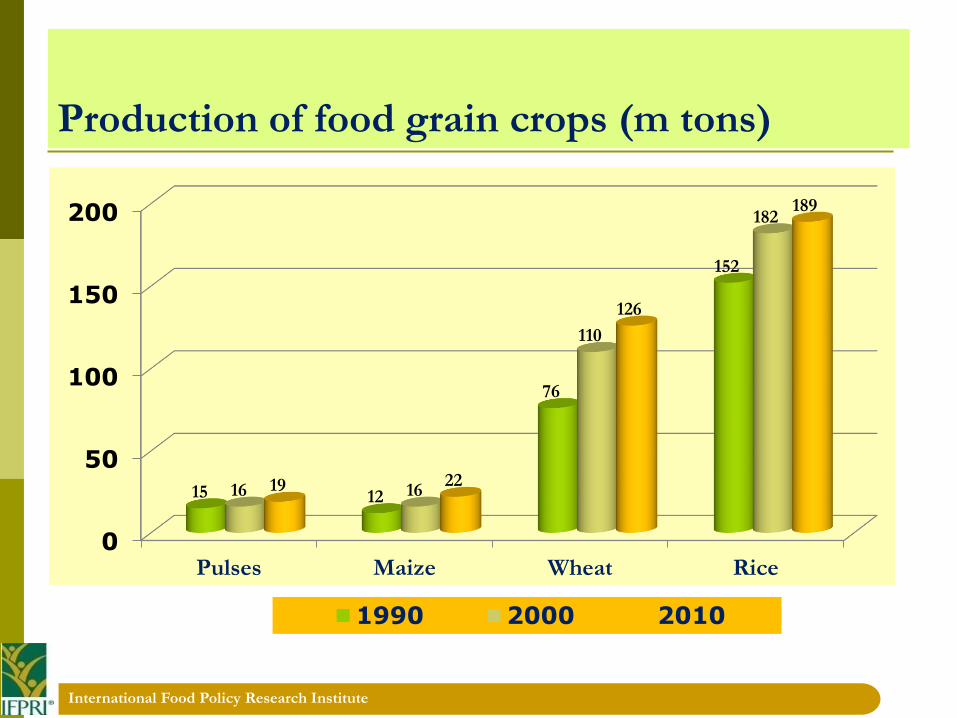
Production of food grain crops (m tons)
0
50
100
150
200
Pulses Maize Wheat Rice
15 12
76
152
16 16
110
182
19 22
126
189
1990 2000 2010
International Food Policy Research Institute
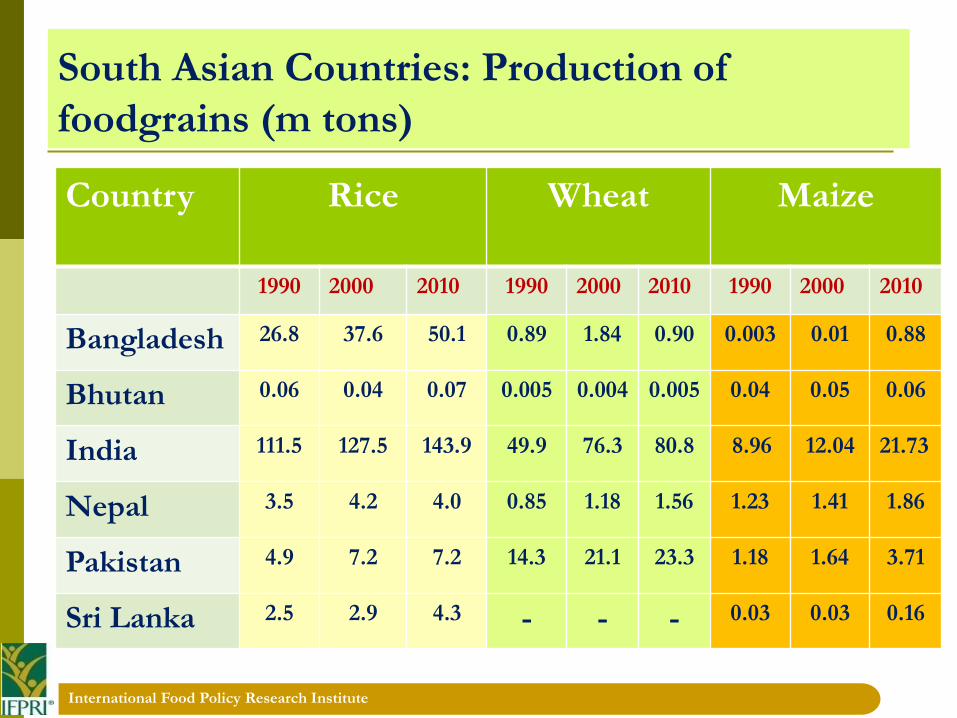
South Asian Countries: Production of
foodgrains (m tons)
Country Rice Wheat Maize
1990 2000 2010 1990 2000 2010 1990 2000 2010
Bangladesh 26.8 37.6 50.1 0.89 1.84 0.90 0.003 0.01 0.88
Bhutan 0.06 0.04 0.07 0.005 0.004 0.005 0.04 0.05 0.06
India 111.5 127.5 143.9 49.9 76.3 80.8 8.96 12.04 21.73
Nepal 3.5 4.2 4.0 0.85 1.18 1.56 1.23 1.41 1.86
Pakistan 4.9 7.2 7.2 14.3 21.1 23.3 1.18 1.64 3.71
Sri Lanka 2.5 2.9 4.3 - - - 0.03 0.03 0.16
International Food Policy Research Institute
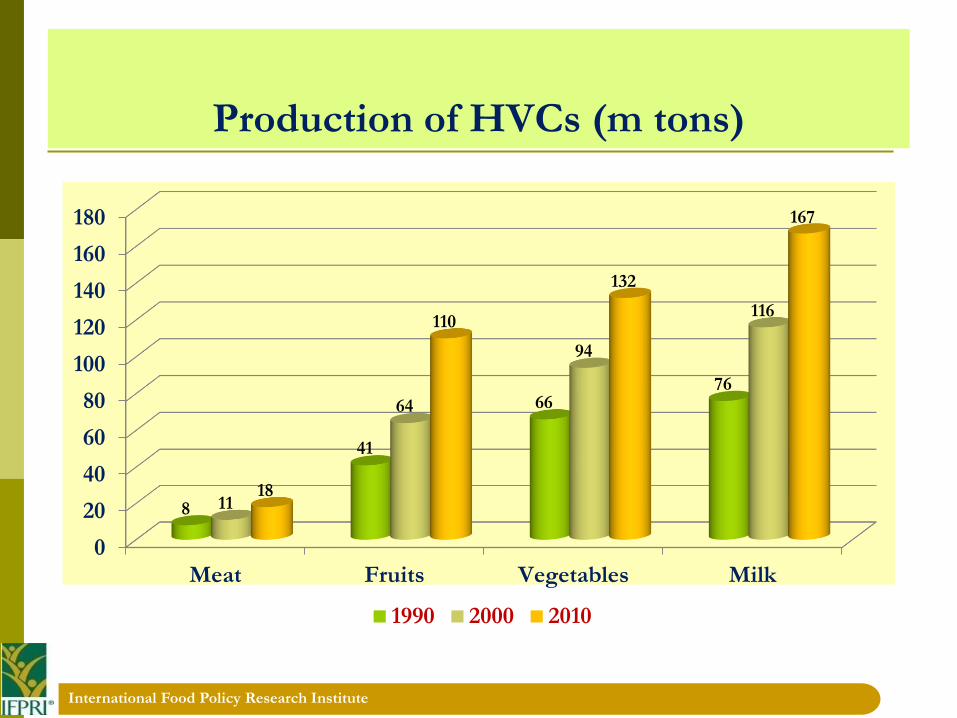
Production of HVCs (m tons)
0
20
40
60
80
100
120
140
160
180
Meat Fruits Vegetables Milk
8
41
6676
11
64
94
116
18
110
132
167
1990 2000 2010
International Food Policy Research Institute
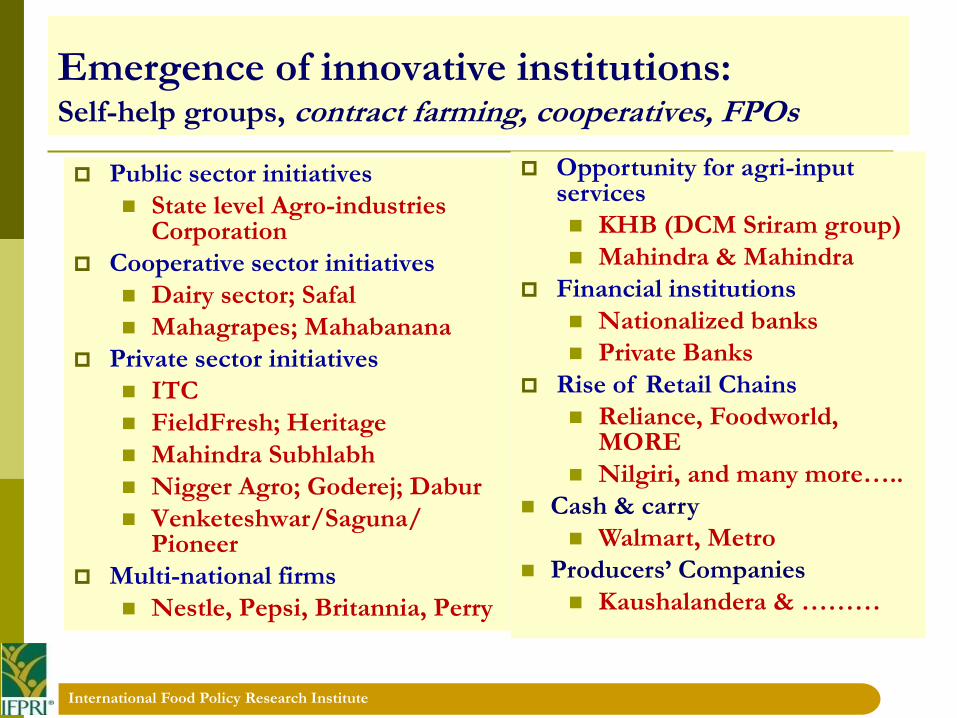
Emergence of innovative institutions: Self-help groups, contract farming, cooperatives, FPOs
Public sector initiatives
State level Agro-industries Corporation
Cooperative sector initiatives
Dairy sector; Safal
Mahagrapes; Mahabanana
Private sector initiatives
ITC
FieldFresh; Heritage
Mahindra Subhlabh
Nigger Agro; Goderej; Dabur
Venketeshwar/Saguna/ Pioneer
Multi-national firms
Nestle, Pepsi, Britannia, Perry
Opportunity for agri-input services
KHB (DCM Sriram group)
Mahindra & Mahindra
Financial institutions
Nationalized banks
Private Banks
Rise of Retail Chains
Reliance, Foodworld, MORE
Nilgiri, and many more…..
Cash & carry
Walmart, Metro
Producers’ Companies
Kaushalandera & ………
International Food Policy Research Institute
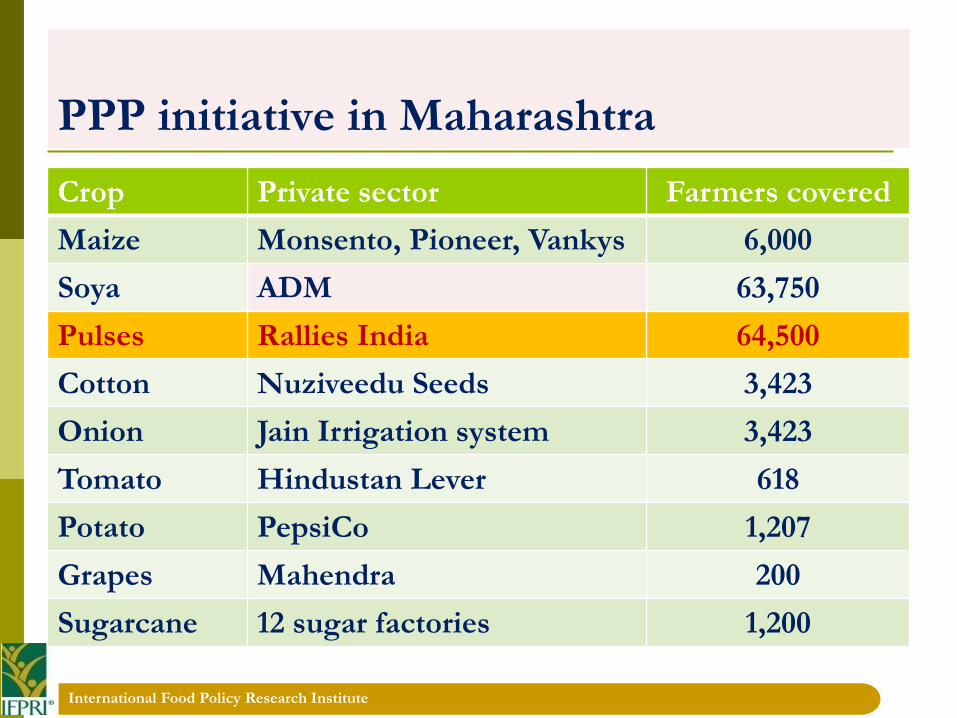
PPP initiative in Maharashtra
Crop Private sector Farmers covered
Maize Monsento, Pioneer, Vankys 6,000
Soya ADM 63,750
Pulses Rallies India 64,500
Cotton Nuziveedu Seeds 3,423
Onion Jain Irrigation system 3,423
Tomato Hindustan Lever 618
Potato PepsiCo 1,207
Grapes Mahendra 200
Sugarcane 12 sugar factories 1,200
International Food Policy Research Institute
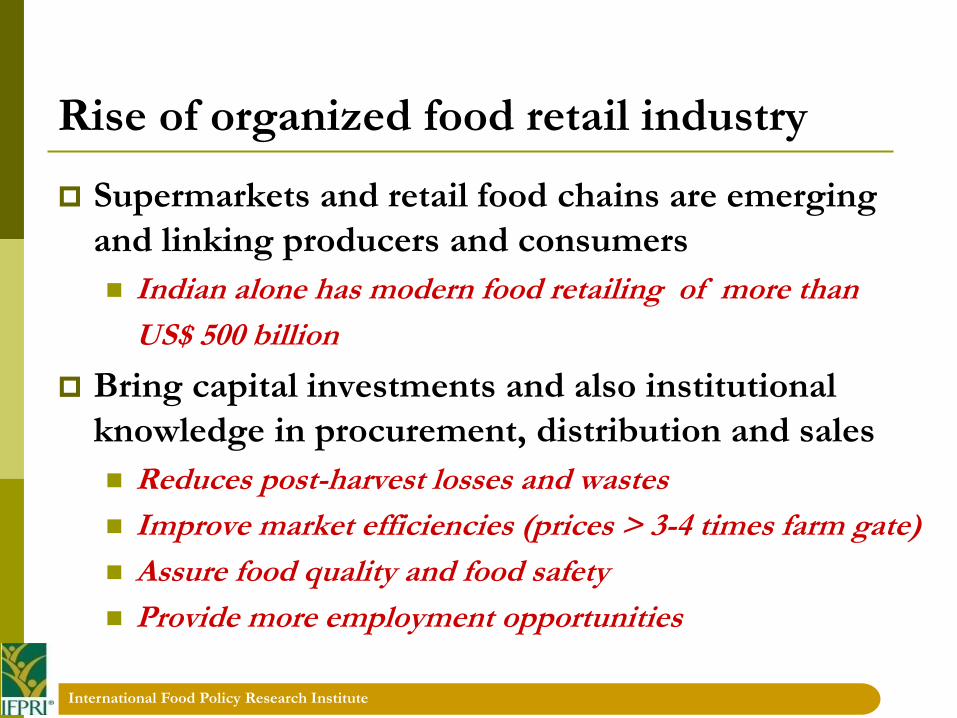
Rise of organized food retail industry
Supermarkets and retail food chains are emerging
and linking producers and consumers
Indian alone has modern food retailing of more than
US$ 500 billion
Bring capital investments and also institutional
knowledge in procurement, distribution and sales
Reduces post-harvest losses and wastes
Improve market efficiencies (prices > 3-4 times farm gate)
Assure food quality and food safety
Provide more employment opportunities
International Food Policy Research Institute
Page 30
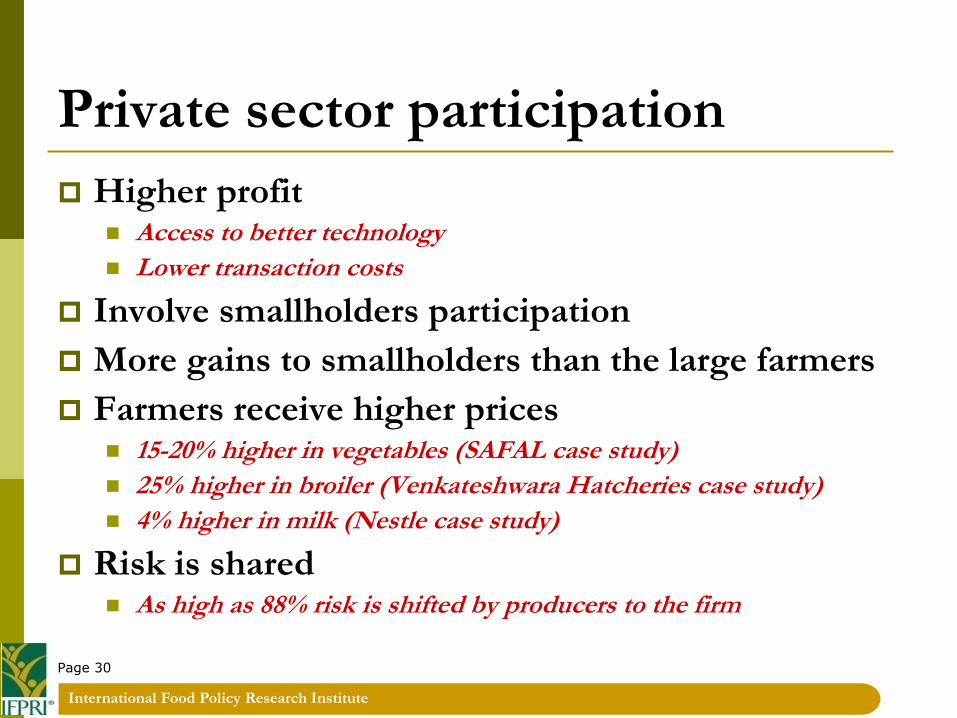
Private sector participation
Higher profit Access to better technology
Lower transaction costs
Involve smallholders participation
More gains to smallholders than the large farmers
Farmers receive higher prices 15-20% higher in vegetables (SAFAL case study)
25% higher in broiler (Venkateshwara Hatcheries case study)
4% higher in milk (Nestle case study)
Risk is shared As high as 88% risk is shifted by producers to the firm
III
Research Strategy and Priorities
International Food Policy Research Institute
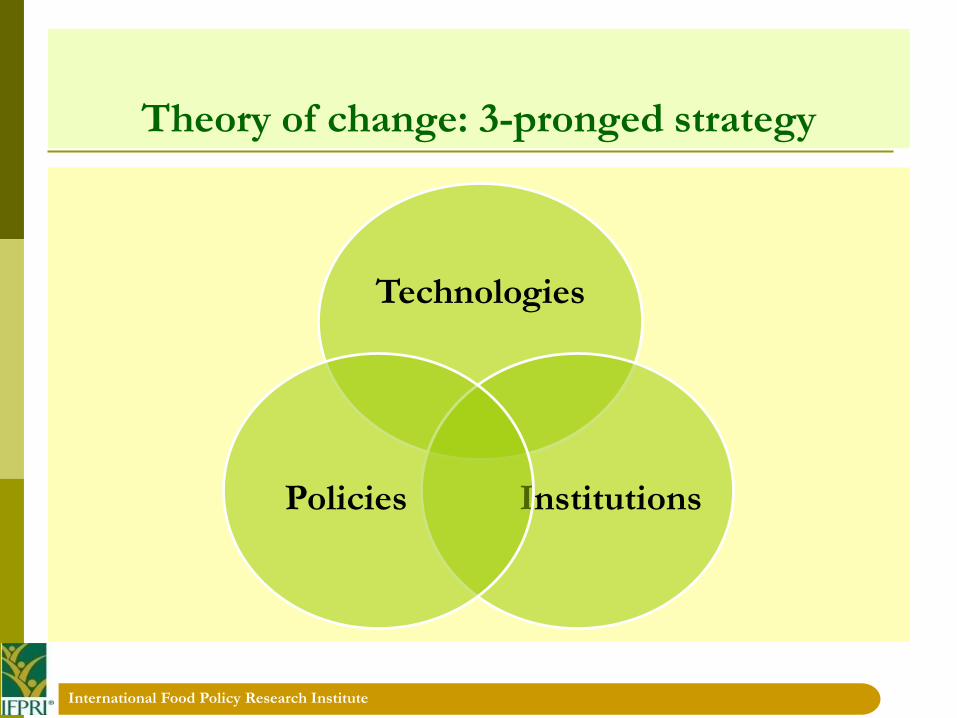
Theory of change: 3-pronged strategy
Technologies
InstitutionsPolicies
International Food Policy Research Institute
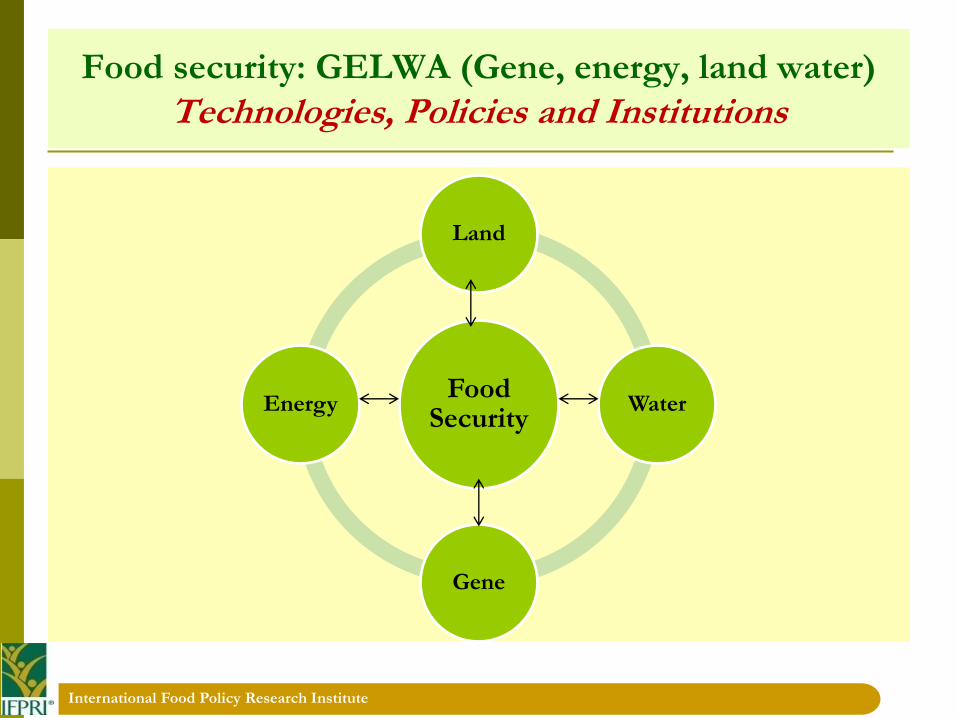
Food security: GELWA (Gene, energy, land water)
Technologies, Policies and Institutions
Food Security
Land
Water
Gene
Energy
International Food Policy Research Institute
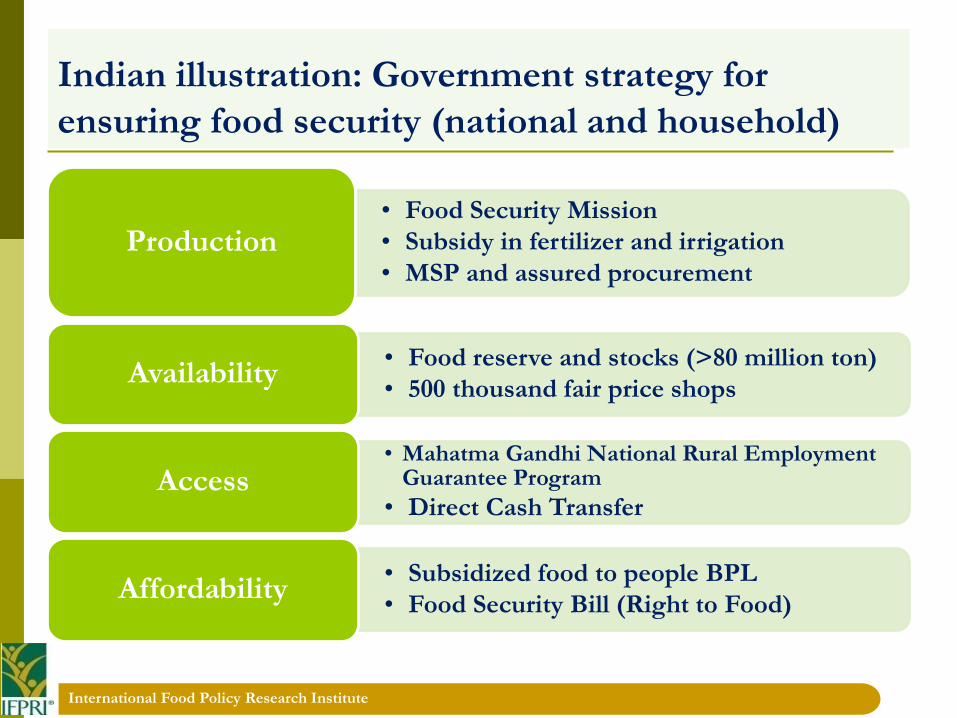
Indian illustration: Government strategy for
ensuring food security (national and household)
• Food Security Mission
• Subsidy in fertilizer and irrigation
• MSP and assured procurementProduction
• Food reserve and stocks (>80 million ton)
• 500 thousand fair price shopsAvailability
• Mahatma Gandhi National Rural Employment Guarantee Program
• Direct Cash TransferAccess
• Subsidized food to people BPL
• Food Security Bill (Right to Food)Affordability
International Food Policy Research Institute
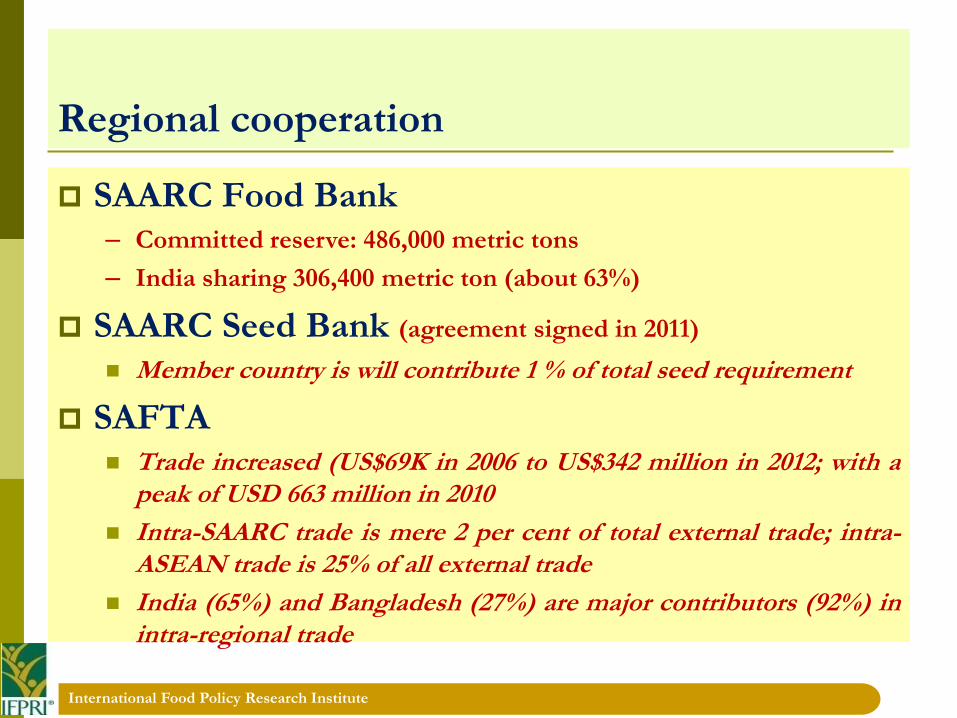
Regional cooperation
SAARC Food Bank– Committed reserve: 486,000 metric tons
– India sharing 306,400 metric ton (about 63%)
SAARC Seed Bank (agreement signed in 2011)
Member country is will contribute 1 % of total seed requirement
SAFTA Trade increased (US$69K in 2006 to US$342 million in 2012; with a
peak of USD 663 million in 2010
Intra-SAARC trade is mere 2 per cent of total external trade; intra-ASEAN trade is 25% of all external trade
India (65%) and Bangladesh (27%) are major contributors (92%) inintra-regional trade
International Food Policy Research Institute
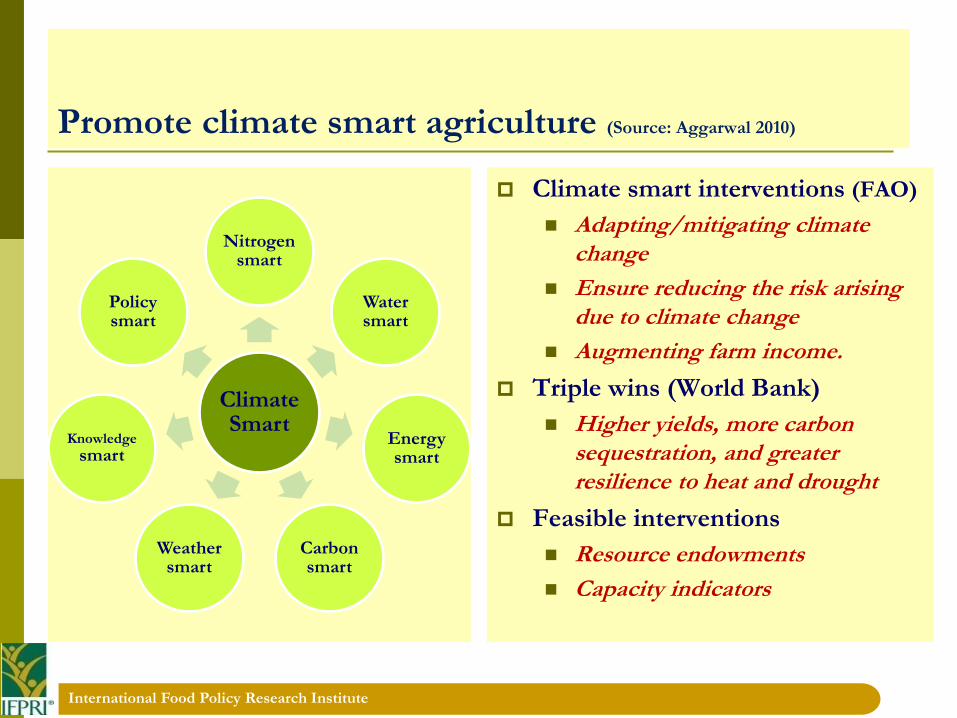
Promote climate smart agriculture (Source: Aggarwal 2010)
Climate Smart
Nitrogen smart
Water smart
Energy smart
Carbon smart
Weather smart
Knowledge
smart
Policy smart
Climate smart interventions (FAO)
Adapting/mitigating climate change
Ensure reducing the risk arising due to climate change
Augmenting farm income.
Triple wins (World Bank)
Higher yields, more carbon sequestration, and greater resilience to heat and drought
Feasible interventions
Resource endowments
Capacity indicators
International Food Policy Research Institute
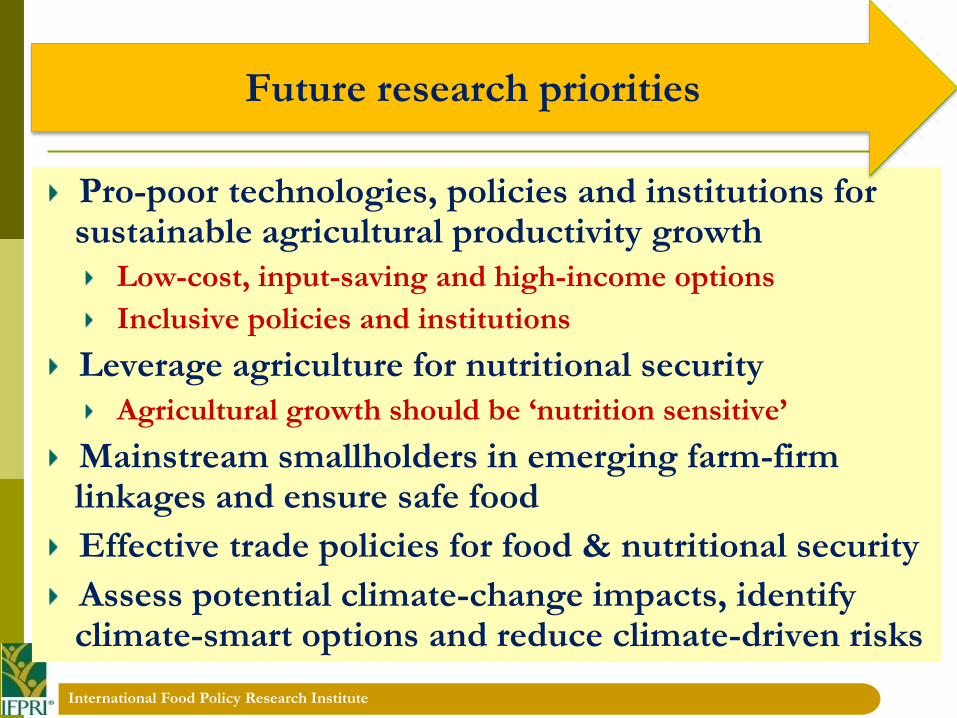
Pro-poor technologies, policies and institutions for sustainable agricultural productivity growth
Low-cost, input-saving and high-income options
Inclusive policies and institutions
Leverage agriculture for nutritional security
Agricultural growth should be ‘nutrition sensitive’
Mainstream smallholders in emerging farm-firm linkages and ensure safe food
Effective trade policies for food & nutritional security
Assess potential climate-change impacts, identify climate-smart options and reduce climate-driven risks
Future research priorities
International Food Policy Research Institute
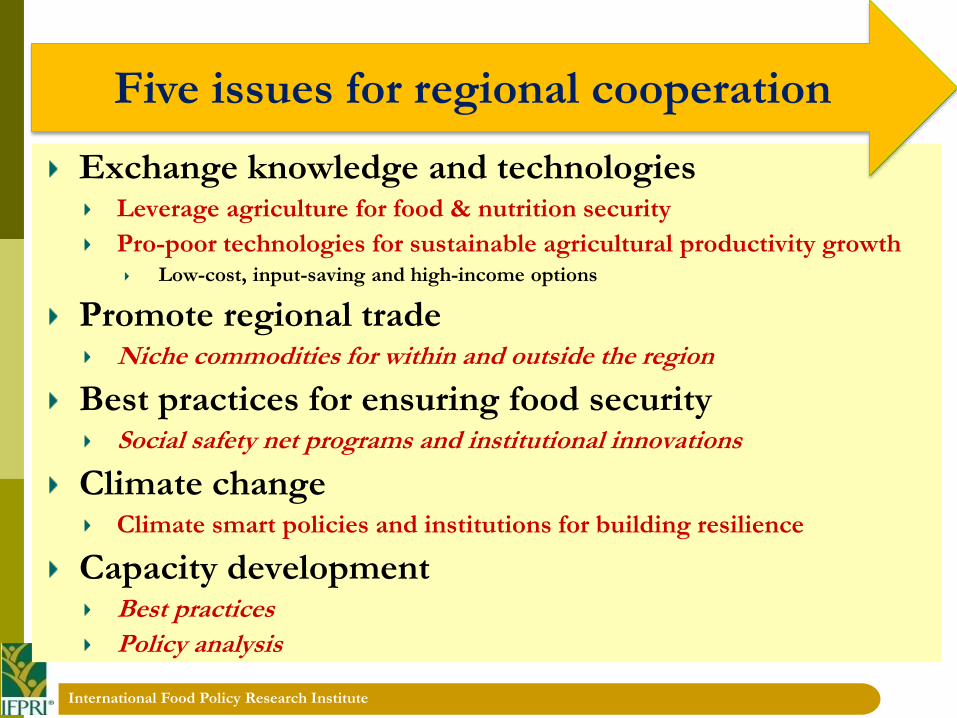
Exchange knowledge and technologiesLeverage agriculture for food & nutrition security
Pro-poor technologies for sustainable agricultural productivity growthLow-cost, input-saving and high-income options
Promote regional tradeNiche commodities for within and outside the region
Best practices for ensuring food securitySocial safety net programs and institutional innovations
Climate changeClimate smart policies and institutions for building resilience
Capacity developmentBest practices
Policy analysis
Five issues for regional cooperation
Thank you