ifrs us$ millions 2q12 2q13 var % 1h12 1h13 var % total … · 2018-09-24 · codelco arbitration:...
TRANSCRIPT

July 31, 2013
E.CL is engaged in the generation, transmission and supply of electricity and the distribution and transportation of natural gas
in the north of Chile. E.CL is the fourth largest electricity generation company in Chile and the largest electricity generation
company in the SING, Chile’s second largest power grid. As of June 30, 2013, E.CL accounted for 54% of the SING’s installed
capacity. E.CL primarily supplies electricity to large mining and industrial customers. In January 2012, E.CL began supplying
the entire electricity needs of EMEL, the sole electricity distribution group in the SING. E.CL is currently 52.77% indirectly
owned by GDF Suez. The remaining 47.23% of E.CL’s shares are publicly traded on the Santiago stock exchange following
Codelco’s sale of its 40% shareholding interest on January 28, 2011. For more information, please refer to www.e-cl.cl.
E.CL REPORTED NET EARNINGS OF US$8.1 MILLION AND EBITDA OF US$117.9 MILLION IN THE
FIRST HALF OF 2013.
DESPITE A 3% INCREASE IN PHYSICAL ENERGY SALES IN THE FIRST HALF OF 2013, OPERATING REVENUES DECREASED 2%,
MAINLY DUE TO LOWER AVERAGE TARIFFS. THE LOWER FIRST-HALF EBITDA IS EXPLAINED BY HIGHER FUEL AND
ENERGY PURCHASE COSTS RELATED TO THE JANUARY CTA AND CTH OUTAGE; MAINTENANCE OF COAL PLANTS BOTH OPERATED BY E.CL AND OTHER GENERATORS IN APRIL AND MAY; AND THE LNG TERMINAL OUTAGE IN JUNE. THIS
RESULTED IN INCREASED LEVELS OF GENERATION WITH MORE EXPENSIVE FUELS, SUCH AS DIESEL OIL, AND AN
INCREASE IN SPOT ENERGY PURCHASES, WHICH HAD A STRONGER IMPACT DURING THE SECOND QUARTER OF 2013.
Operating revenues reached US$307.3 million in the second quarter of 2013, a 4% increase compared to
the same quarter the year before. In the first half of the year, revenues decreased 2% compared to the same
period in 2012 due mainly to lower average realized monomic tariffs for both regulated and unregulated
clients.
Second quarter EBITDA was US$51.1 million, an 11% reduction compared to the second quarter of
2012. In the first half, EBITDA fell 19% compared to the same period in 2012.
In the second quarter, net results were an US$8.5 million loss. In the first half of the year, net income
decreased by 83% to US$8.1 million due to lower operating results and foreign-exchange differences.
IFRS
US$ millions 2Q12 2Q13 Var % 1H12 1H13 Var %
Total operating revenues 296.3 307.3 4% 602.0 592.4 -2%
Operating income 24.8 14.8 -40% 79.1 45.8 -42%
EBITDA 57.2 51.1 -11% 145.2 117.9 -19%
EBITDA margin 19.3% 16.6% -14% 24.1% 19.9% -17%
Non recurring earning 1.1 4.7 327% 1.1 4.7 327%
EBITDA without non recurring earnings 56.1 46.4 -17% 144.1 113.2 -21%
Total non-operating results (13.6) (18.4) 35% (18.3) (26.6) 45%
Net income after tax 9.1 (5.2) -157% 51.1 12.7 -75%
Net income attributed to controlling shareholders 6.5 (8.5) -230% 46.6 8.1 -83%
Net income attributed to minority shareholders 2.6 3.4 29% 4.5 4.6 2%
Earnings per share 0.00 (0.01) -294% 0.04 0.01 -83%
Total energy sales (GWh) 2,336 2,399 3% 4,674 4,805 3%
Total net generation (GWh) 2,452 2,173 -11% 4,536 4,269 -6%
Energy purchases on the spot market (GWh) 378 369 -2% 412 703 71%
Financial Highlights
(in US$ millions)

2
HIGHLIGHTS:
2Q2013:
Dividend payments: On May 16, 2012 E.CL paid dividends in the amount of US$0.0533351281 per share,
as approved by the Ordinary Shareholders’ Meeting held on April 23, 2013. The amount paid was
US$56,178,411.82.
E.CL inaugurated its first photovoltaic plant directly connected to the SING: The 2MW pilot solar
project, El Águila I, located 57 kms. east of Arica, required an investment of approximately US$7 million
and has enough capacity to supply 5% of the electricity demand of the city of Arica.
FIRST HALF 2013:
Shareholders meeting: The Annual Ordinary Shareholders’ Meeting held on April 23, 2013, approved a
dividend payment on account of 100% of 2012’s net income in the amount of US$ 0.0533351281 per share.
A new board was elected during the meeting.
Codelco arbitration: On March 26, 2013, E.CL’s board of directors became aware of an arbitration
proceeding initiated by Codelco against E.CL referred to a PPA signed on November 6, 2009, whereby
Codelco asks the arbitration tribunal to order E.CL to re-calculate the tariffs charged from January 1, 2010
through September 30, 2012. According to Codelco this would presumably result in a US$42.8 million plus
interest credit in its favor. As of this date, the arbitration process remains on course, and the date of
resolution remains uncertain. E.CL is convinced that the proceeding has no grounds and that it will
consequently be rejected.
CTA and CTH plant outages: On January 8, 2013, E.CL posted material public information with the SVS
(Superintendencia de Valores y Seguros) indicating that on January 5 it became aware of water leakages at
the civil works of the cooling systems of its CTA and CTH plants. To avoid further damage and to begin
repair works, both units were taken out of service. The economic impact and potential responsibility of
contractors are under evaluation.
On January 25, 2013, E.CL posted updated material information informing about CTH’s return to service
given the completion of provisional repair works in the unit’s cooling system. It also informed about the
expected return to service of CTA, which was in effect synchronized on January 28, 2013. Both units have
been operating normally since then.
INDUSTRY OVERVIEW
The company operates on the SING Grid (Sistema Interconectado del Norte Grande or ‘Northern Grid’),
Chile’s second largest power grid, which serves the country’s north and a major portion of its mining industry.
Given local conditions, it is a thermoelectric system, with generation based on coal, natural gas, LNG, and diesel
and fuel oil.
During the 1Q13 the SING’s monthly marginal costs averaged US$78.3/MWh, slightly above
US$76.6/MWh recorded in the first quarter of the year before, due to the 20-day unavailability of CTA and CTH.
The 1Q13 average stood slightly below the 4Q12’s US$78.4/MWh average, which at the time reflected increased
demand and lower availability of cost-efficient generation in part due to the CTH outage.

3
In the second quarter of 2013, marginal costs averaged US$76.9/MWh. Due to planned and forced outages
of coal-fired plants and the LNG terminal maintenance between June 1 and June 28 for the connection of its new
onshore storage tank, the system had to meet the shortfall in coal and gas generation with higher cost fuels including
diesel and heavy oils. As a result, the fuel mix used in generation in the SING in the second quarter changed,
increasing the relative weight of oil and decreasing the percentage of gas generation. In April, marginal costs
averaged US$82.2/MWh, a 27% decrease compared to the same month in 2012, but a 24.8% increase compared to
March 2013. In May, marginal costs averaged US$72.6/MWh, representing a 35% reduction compared to the same
month in 2012 and an 11.7% decrease compared to April. Finally, in June, marginal costs averaged US$76/MWh, a
42.9% drop from the same month the year before and a 4.7% increase from the previous month. It should be noted
that these marginal costs do not reflect the system’s generation overcosts ruled under the RM 39 and DS 130
mechanisms, which are paid by the generation companies in proportion to their clients’ demand and partially passed
through to tariffs depending on specific contractual conditions.
In the first half of 2013, marginal costs averaged US$77.6/MWh, a 20.7% decrease compared to the first
half of 2012, when the marginal cost average was US$97.9/MWh.
The following table provides a breakdown of generation in the SING by fuel type:
Fuel Type GWh % of total GWh % of total GWh % of total GWh % of total
Hydro 25 1% 19 0% 21 0% 18 0%
Coal 3,538 86% 3,285 78% 3,497 82% 3,452 82%
Argentine Gas (AES Gener) - - - - - - - -
LNG 486 12% 683 16% 451 11% 323 8%
Diesel / Fuel oil 76 2% 204 5% 251 6% 400 9%
Solar/ cogeneration - - 28 1% 27 1%
Total gross generation SING 4,124 100% 4,190 100% 4,248 100% 4,220 100%
1Q 2012 2Q 2012 1Q 2013
Generation by Fuel Type (in GWh)
2Q 2013
Source: CDEC-SING
The SING’s electricity production broken down by company is as follows:
GWh % of total GWh % of total GWh % of total GWh % of total
Company
AES Gener (Arg. Gas) - - - - - - - -
Norgener / Angamos 1,357 33% 1,178 28% 1,524 36% 1,327 31%
Celta 248 6% 103 2% 265 6% 243 6%
GasAtacama 247 6% 250 6% 156 4% 284 7%
E.CL (with 100% of CTH) 2,261 55% 2,642 63% 2,260 53% 2,322 55%
Other 11 0% 16 0% 42 1% 44 1%
Total gross generation SING……… 4,124 100% 4,190 100% 4,248 100% 4,220 100%
Generation by Company (in GWh)
1Q 20131Q 2012 2Q 20132Q 2012
Source: CDEC-SING
During the second quarter of 2013, E.CL reported a slight increase in electricity generation, remaining as
the industry leader, with 55% of the system’s generation. In the second quarter, both E.CL and other SING
participants reported plant outages. Coal plant maintenance works were concentrated primarily in April and May to
free up coal capacity so as to offset the anticipated lack of gas generation resulting from the LNG terminal’s
scheduled outage in June. Given the lack of LNG availability in June, E.CL carried out the annual maintenance of its
U16 combined cycle plant.

4
Coal plant outages in April and May, including AES Gener’s Angamos I and II units, and the lack of gas
generation in June, caused Gas Atacama to run its combined cycle units with diesel, thus increasing its share of the
system’s generation.
The slight decrease in electricity demand and generation observed in the second quarter is explained by a
slightly lower copper production due to labour strikes at some mines.
MANAGEMENT’S DISCUSSION AND ANALYSIS OF FINANCIAL RESULTS
The following discussion is based on our audited consolidated financial statements for the six-month
periods ended June 30, 2013 and 2012, which have been prepared in U.S. dollars in accordance with IFRS, and
which should be read in conjunction with the financial statements and the notes thereto published by the
Superintendencia de Valores y Seguros (www.svs.cl).
For the purposes of permitting a comparison on a consistent basis, the numbers corresponding to previous
quarters have been adjusted to reflect the consolidation of 100% of Inversiones Hornitos (“CTH”).
Results of Operations
2Q 2013 compared to 1Q 2013 and 2Q 2012
Operating Revenues
Operating Revenues Amount % of total Amount % of total Amount % of total QoQ YoY
Unregulated customers sales………………….. 223.3 81% 222.8 84% 218.9 82% -2% -2%
Regulated customers sales……………………. 40.0 14% 41.4 16% 43.0 16% 4% 7%
Spot market sales……………………………….. 12.9 5% 2.4 1% 4.2 2% 76% -67%Total revenues from energy and capacity
sales…………………………… 276.2 93% 266.5 93% 266.1 87% 0% -4%
Gas distribution sales………………………….. 1.0 0% 0.4 0% 0.9 0% 96% -9%
Other operating revenue………………………. 19.5 7% 18.1 6% 40.3 13% 122% 106%
Total operating revenues…………………. 296.3 100% 285.1 100% 307.3 100% 8% 4%
Physical Data (in GWh)
Sales of energy to unregulated customers (1)
…… 1,853 79% 1,930 80% 1,866 78% -3% 1%
Sales of energy regulated customers…… 412 18% 444 18% 454 19% 2% 10%
Sales of energy to the spot market……………. 71 3% 33 1% 80 3% 145% 13%
Total energy sales…………………………. 2,336 100% 2,406 100% 2,399 100% 0% 3%
Average monomic price unregulated customers(U.S.$/MWh)(2)
…… 122.8 114.7 114.7 0% -7%
Average monomic price regulated customers (U.S.$/MWh)(3)
97 93 94.7 2% -2%
(1) Includes 100% of CTH sales.
(2) Calculated as the quotient between unregulated and spot revenues from energy and capacity sales and unregulated and spot physical energy sales.
(3) Calculated as the quotient between regulated revenues from energy and capacity sales and regulated physical energy sales.
1Q 2013
Quarterly Information
(In US$ millions, except for volumes and percentages)
2Q 2012 % Variation2Q 2013
Electricity sales remained virtually unchanged from the previous quarter at US$266.1 million. The 4%
decrease in electricity sales when compared to the second quarter of last year is explained by lower tariffs for both
regulated and unregulated clients.

5
Sales to unregulated clients amounted to US$218.9 million, a 2% decrease compared to the previous
quarter mainly due to the 3% decrease in demand mainly explained by strikes affecting the operations of the
Chuquicamata and Radomiro Tomic copper mines. The average realized monomic tariff for unregulated clients
remained unchanged from the first quarter. However, when compared to the second quarter of last year, it fell 7%
due to the heavier relative weight of coal in the tariff indexation polynomials for unregulated clients. This explained
a 2% decrease in sales to unregulated clients compared to the second quarter of 2012, despite a 1% increase in
physical sales.
Sales to distribution companies, or regulated clients, amounted to US$43 million, an increase compared to
the immediately preceding quarter, due to a 2% increase in the average monomic tariff. The energy tariff for
regulated clients increased by approximately US$2/MWh in May due to semi-annual tariff review considered in the
PPA. Physical sales to regulated clients increased slightly due to the gradual demand increase normally observed in
the electricity distribution industry.
Physical sales to the spot market increased compared to the previous quarter; however, they remained
insignificant given E.CL’s highly contracted position. It is the level of net spot sales or purchases which is more
relevant at the time of analyzing the company’s financial performance. In the second quarter of 2013, E.CL reported
net spot purchases of approximately 254 GWh, below the first quarter’s 336 GWh mostly explained by the January
CTA and CTH outage. The spot market sales item also includes the retroactive annual firm capacity price and
monthly energy adjustment payments per the reliquidations made by the SING dispatch center (CDEC-SING).
Other operating revenues include transmission tolls, port services, transmission line services and fuel sold
to other generators. In the second quarter of 2013, other operating revenues include US$13 million of non-recurring
income corresponding to insurance compensations for business interruption losses incurred during the CTH outage
in the last quarter of 2012. In the second quarter of 2012, the company reported US$1.1 million in insurance
payments covering a previous loss at Central Tamaya.

6
Operating Costs
Operating Costs Amount % of total Amount % of total Amount % of total QoQ YoY
Fuel and lubricants……………………………… (155.6) 60% (113.5) 47% (114.5) 41% 1% -26%
Energy and capacity purchases on the spot
market………………………………………….. (15.6) 6% (35.9) 15% (51.5) 18% 43% 229%Depreciation and amortization attributable to
cost of goods sold……………………………. (32.2) 12% (35.5) 15% (36.1) 13% 1% 12%
Other costs of goods sold……………………. (56.8) 22% (58.1) 24% (80.2) 28% 38% 41%
Total cost of goods sold……………….. (260.2) 96% (243.1) 96% (282.2) 96% 16% 8%
Selling, general and administrative expenses… (12.3) 5% (11.0) 4% (10.4) 4% -5% -15%
Depreciation and amortization in selling,
general and administrative expenses………… (0.2) 0% (0.3) 0% (0.3) 0% 3% 17%
Other operating revenue/costs………………………. 2.1 -1% 0.2 0% 0.4 0% 85% -80%
Total operating costs….………………. (271.5) 100% (254.1) 100% (292.5) 100% 15% 8%
Physical Data (in GWh)
Gross electricity generation
Coal…………………………………………. 2,004 76% 1,710 76% 1,884 82% 10% -6%
Gas………………………………………….. 548 21% 451 20% 296 13% -34% -46%
Diesel Oil and Fuel Oil……………………. 80 3% 87 4% 106 5% 22% 33%
Hydro………………………………………. 11 0% 12 1% 10 0% -19% -9%
Total gross generation…………………. 2,642 100% 2,260 100% 2,295 100% 2% -13%
Minus Own consumption……………….. (190) -7% (164) -7% (149) -6% -9% -22%
Total net generation……………………. 2,452 99% 2,096 85% 2,146 87% 2% -12%
Energy purchases on the spot market……….. 34 1% 369 15% 334 13% -9% 873%
Total energy available for sale before
transmission losses……………………… 2,486 100% 2,465 100% 2,480 100% 1% 0%
2Q 2013
(In US$ millions, except for volumes and percentages)
Quarterly Information
% Variation2Q 2012 1Q 2013
Gross electricity generation increased 2% in 2Q13 compared to 1Q13. Coal generation recovered by 10%
due to the works at CTA and CTH in 1Q13 to resolve the water leakages in the cooling systems, which had these
units out of service for approximately 20 days in January 2013. In the second quarter, our CTM1, U12 and U16
units were alternately subject to environmental improvement works or maintenance, and efficient plant belonging to
other generation companies were also out for maintenance. Gas generation reported a significant decrease since the
Mejillones LNG terminal was out of service in June for the connection of the new onshore storage tank. Therefore,
diesel oil increased its participation in the fuel mix to compensate for the lack of gas in June. E.CL’s electricity
generation decreased when compared to the second quarter of 2012 as in that quarter E.CL’s generation reached
record levels to make up for the lower production reported by other generation companies as a result of planned and
forced outages. In 2Q13, total electricity demand in the system reported a slight decline, and E.CL had more units in
maintenance than in the same quarter of 2012. Physical electricity purchases on the spot market remained at similar
levels than in the previous quarter, but they were made at higher prices given the heavier weight of diesel generation
resulting from the maintenance of coal plants and the lack of gas generation in June. This also translated into higher
generation overcosts in the system. In 1Q13, despite the CTA/CTH outage, spot prices were lower since other plants
in the system were generally available.
WTI prices, to which diesel and spot prices are linked, averaged US$94.04/bbl during 2Q13. They
decreased by almost 0.1% from the US$94.16/bbl 1Q13 average, and increased by 0.7% compared to US$93.35/bbl
in 2Q12. Coal prices, in turn, did not experience important price variations during the period, although they showed
a declining trend. Gas prices decreased compared to the second quarter of last year because of the start-up of the
LNG supply contract at Henry Hub at the end of 2012. Despite the increased diesel and fuel oil generation, fuel
costs increased by just 1% in 2Q13 compared to 1Q13 given the recovery in coal generation. However, E.CL

7
reported higher spot electricity purchase costs mainly due to higher prices and production overcosts resulting from
the planned and forced outages of coal fired plants in the system and the lack of gas generation in June.
Other operating costs include, among others, transmission tolls and annual maintenance costs. In the
second quarter, these costs increased due to maintenance works at the U12 and CTM1 units. Moreover, this account
includes the repair costs of the water cooling systems of CTA and CTH as well as other repairs at CTH for a
combined cost of US$8.3 million. In the second quarter, other direct operating costs showed an increase of
approximately US$22 million, but these are related to higher fuel sales to other generators, which are offset by
higher revenues. SG&A expenses decreased mainly due to lower advisory costs and the implementation of a cost-
control program.
1Q12 2Q12 6M12 1Q13 2Q13 6M13
Electricity MarginTotal revenues from energy and capacity
sales…………………………………… 288.4 276.2 564.5 266.5 266.1 532.6
Fuel and lubricants………………….. (108.7) (155.6) (264.4) (113.5) (114.5) (228.0)
Energy and capacity purchases on the spot
market…………………………… (39.5) (15.6) (55.1) (35.9) (51.5) (87.4)
Gross Electricity Profit 140.1 104.9 245.0 117.1 100.1 217.2
Electricity Margin 49% 38% 43% 44% 38% 41%
20132012
The electricity margin, or the gross profit from the electricity generation business, decreased in the second
quarter compared to the first quarter. Energy and capacity sales remained virtually unchanged, and there was a
slight margin recovery in the EMEL contract due to tariff increases in March and May. However, generation
overcosts in the SING as a consequence of the maintenance of coal fired plants and the LNG terminal outage in June
had stronger impact in the second quarter. Although both physical energy purchases and average marginal costs in
the system decreased compared to the first quarter, energy purchase costs increased by US$15.6 million as this item
includes the amount that E.CL had to afford on its spot energy purchases as well as its share of the system’s
overcost. On the one hand, the marginal costs in the range of US$77/MWh or US$78/MWh observed during the first
half of the year correspond to averages and not necessarily correspond to the prices prevailing at the time at which
E.CL effectively makes each of its spot energy purchases. On the other, these marginal costs are calculated based on
a theoretical dispatch of power plants and do not include the system’s generation overcosts for reasons such as
security, plants operating in test mode, or plants dispatched at their technical minimum level. Normally, spot energy
purchases at a time of outages of relevant cost-efficient plants are made at higher prices, since the shortfall of coal
and gas generation must be met with more expensive oil generation. In certain cases, this also causes operation
overcosts, which must be borne by generators in proportion to their contracted demand. This overcost can be only
partially transferred to prices. In sum, energy and capacity revenues as well as fuel costs remained flat in the second
quarter, and it was the higher cost of energy purchases the main reason behind the decrease in the electricity margin
in 2Q13.
In the first half of 2013, energy and capacity revenues decreased by US$31.9 million mainly due to lower
average realized tariffs reflecting the lower cost fuel mix, as shown by the US$36 million drop in fuel costs.
Nevertheless, the CTA and CTH January outage, the maintenance of coal fired plants in April and May and the LNG
terminal outage in June derived in an increase in spot energy purchases both in physical and price terms. This
translated into a US$32.3 million cost increase that explains most of the US$27.8 million reduction in the electricity
margin. In percentage terms, the electricity margin reported a similar behavior than in 1H12, with a 2-point
decrease from 43% to 41%.

8
Operating Results
EBITDA
Amount % of total Amount % of total Amount % of total QoQ YoY
Total operating revenues……………………… 296.3 100% 285.1 100% 307.3 100% 8% 4%
Total cost of goods sold…………………… (260.2) -88% (243.1) -85% (282.2) -92% 16% 8%
Gross income…………………………. 36.1 12% 42.0 15% 25.0 8% -40% -31%
Total selling, general and administrative
expenses and other operating income/(costs). (11.3) -4% (11.0) -4% (10.3) -3% -7% -9%
Operating income….………………. 24.8 8% 31.0 11% 14.8 5% n.a. -40%
Depreciation and amortization……...………… 32.4 11% 35.8 13% 36.4 12% 1% 12%
Provision/(reversal) uncollectibles….. - - - - - - n.a n.a.
EBITDA…………….….………………. 57.2 19% 66.8 23% 51.1 17% -24% -11%
2Q 2013
(In US$ millions, except for percentages)
Quarterly Information
% Variation1Q 20132Q 2012
As explained earlier, as a result of higher energy purchase costs and higher maintenance and repair costs,
which were not fully offset by insurance compensations, 2Q13 EBITDA decreased compared to both 1Q13 and
2Q12. The EBITDA margin was 17% in the second quarter, below 23% in the first quarter and 19% in the same
period of last year.
It should be noted that CTH has been 100% consolidated into E.CL’s consolidated financial statements
beginning 2013, whereas it was previously proportionately consolidated at 60%. To facilitate the comparison, we
have adjusted previous periods as if CTH had been 100% consolidated.
Financial Results
Non-operating results Amount % of total Amount % of total Amount % of total QoQ YoY
Financial income………..……………………… 0.5 0% 1.0 0% 0.9 0% -12% 92%
Financial expense………….………………… (11.8) -4% (11.7) -4% (11.7) -4% 0% -1%
Foreign exchange translation, net…………… (1.8) -1% 2.7 1% (6.9) -2% -355% 291%
Other non-operating income/(expense) net… (0.5) 0% (0.2) 0% (0.7) 0% 240% 31%
Total non-operating results……………. (13.6) -5% (8.2) -3% (18.4) -6% 124% 35%
Income before tax……………………. ……… 11.2 4% 22.8 7% (3.6) -1% -116% -132%
Income tax……………………………………… (2.0) -1% (5.0) -2% (1.6) -1% n.a. -21%
Net income after tax ……. 9.2 3% 17.9 6% (5.2) -2% -129% -157%
Net income attributed to controlling
shareholders……. 6.5 2% 16.6 5% (8.5) -3% -151% -230%
Net income attributed to minority
shareholders……….. 2.6 1% 1.2 0% 3.4 1% 172% 29%
Net income to E.CL's shareholders 4.6 2% 16.6 5% (8.5) -3% -151% -284%
Earnings per share…………………….. 0.004 0% 0.017 0% (0.008) 0% -149% -294%
1Q 20132Q 2012 2Q 2013
(In US$ millions, except for percentages)
Quarterly Information
% Variation
Financial expense remained in line with the figures reported in 1Q13, and they decreased when compared
to the same period in 2012, despite the last disbursement under the CTA project finance in October 2012. This was
mainly due to a lower LIBOR and because on July 31, 2012, E.CL acquired CTH’s obligations with its minority
shareholder, thus becoming CTH’s sole lender. In the second quarter of 2012 financial expenses included the

9
interest accrued on CTH’s debt with its minority shareholder, whereas in 2Q13, CTH’s interest expense was
completely netted out in E.CL’s consolidated statements.
Foreign exchange losses reached US$6.9 million in the second quarter, comparing negatively with foreign
exchange earnings of US$2.7 million in the first quarter. The second quarter’s foreign exchange losses had their
origin in the effect of a sudden depreciation of the Chilean peso at the end of May over certain assets in Chilean
pesos. However, part of this loss is merely an accounting loss, with no effects on cash flow.
The tax reform, effective since the end of September 2012, introduced an increase in the income tax rate to
20%. In 2Q12, the effective tax rate was 18.5%.
Lower EBITDA and foreign-exchange losses were the main reasons behind the second quarter’s US$8.5
million loss, which compares negatively to net income of US$16.6 million in the first quarter and US$6.6 million in
2Q12.
First half of 2013 compared to the first half of 2012
Operating Revenues
Operating Revenues Amount % of total Amount % of total Amount %
Unregulated customers sales………………….. 450.3 80% 441.6 83% (8.6) -2%
Regulated customers sales……………………. 86.7 15% 84.3 16% (2.4) -3%
Spot market sales……………………………….. 27.5 5% 6.6 1% (20.9) -76%
Total revenues from energy and capacity
sales…………………………… 564.5 94% 532.6 90% (31.9) -6%
Gas distribution sales………………………….. 1.6 0% 1.3 0% (0.3) -20%
Other operating revenue………………………. 35.9 6% 58.5 10% 22.6 63%
Total operating revenues…………………. 602.0 100% 592.4 100% (9.7) -2%
Physical Data (in GWh)
Sales of energy to unregulated customers (1)
…… 3,658 78% 3,795 79% 137 4%
Sales of energy regulated customers…… 829 18% 898 19% 69 8%
Sales of energy to the spot market……………. 187 4% 112 2% (75) -40%
Total energy sales…………………………. 4,674 100% 4,805 100% 131 3%
Average monomic price unregulated customers(U.S.$/MWh)(2)
124.3 114.7 (9.5) -8%
Average monomic price regulates customers (U.S.$/MWh)(3)
104.6 93.9 (10.7) -10%
(1) Includes 60% of CTH sales.
(2) Calculated as the quotient between unregulated and spot revenues from energy and capacity sales and unregulated and spot physical energy sales.
(3) Calculated as the quotient between regulated revenues from energy and capacity sales and regulated physical energy sales.
6M - 20136M - 2012 Variation
For the 6-month period ended June 30,
(In US$ millions, except for volumes and percentages)
In the first half of 2013, despite a 3% increase in physical energy sales, total operating revenues decreased
2% compared to the first half of 2012.
The decrease in electricity revenues compared to 1H12 resulted from a combination of increased physical
sales with lower average realized tariffs in both the regulated and unregulated client segments. Sales to regulated
clients, which began in 2012, reached US$84.3 million, and sales to unregulated clients amounted to US$441.6
million, representing reductions of 3% and 2%, respectively, as compared to the first half of 2012. This, added to
lower spot energy sales, resulted in a 6% decrease in electricity revenues.
10
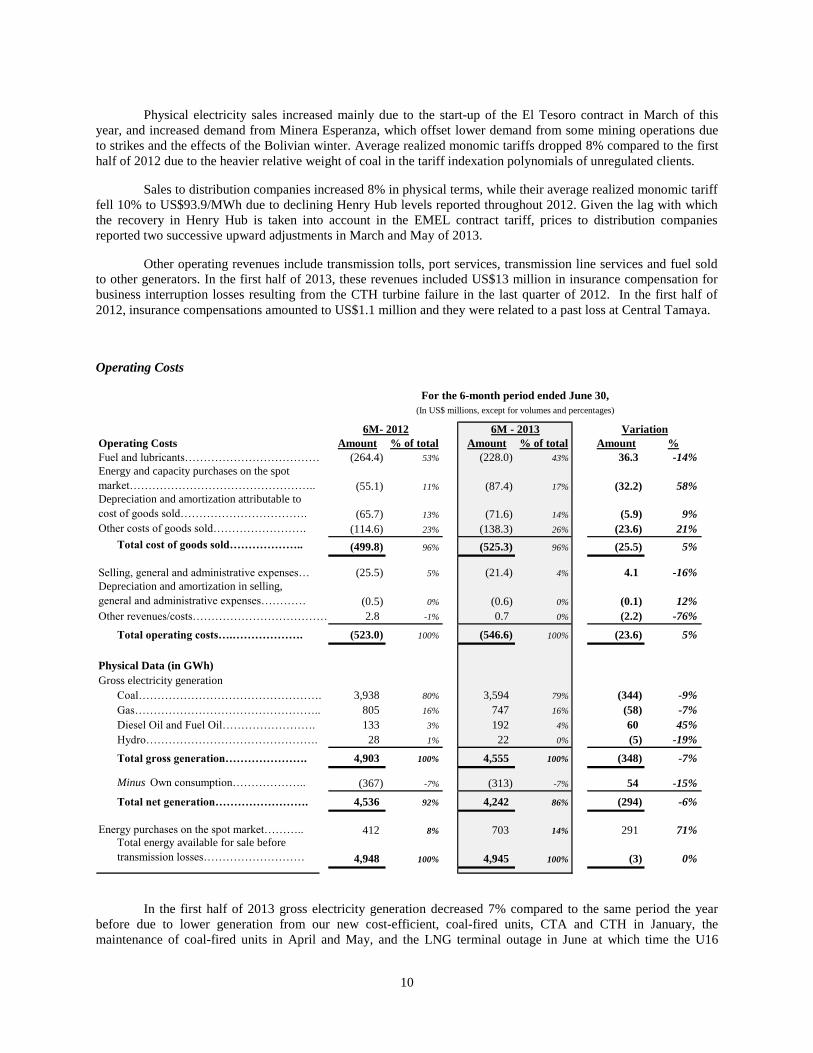
Physical electricity sales increased mainly due to the start-up of the El Tesoro contract in March of this
year, and increased demand from Minera Esperanza, which offset lower demand from some mining operations due
to strikes and the effects of the Bolivian winter. Average realized monomic tariffs dropped 8% compared to the first
half of 2012 due to the heavier relative weight of coal in the tariff indexation polynomials of unregulated clients.
Sales to distribution companies increased 8% in physical terms, while their average realized monomic tariff
fell 10% to US$93.9/MWh due to declining Henry Hub levels reported throughout 2012. Given the lag with which
the recovery in Henry Hub is taken into account in the EMEL contract tariff, prices to distribution companies
reported two successive upward adjustments in March and May of 2013.
Other operating revenues include transmission tolls, port services, transmission line services and fuel sold
to other generators. In the first half of 2013, these revenues included US$13 million in insurance compensation for
business interruption losses resulting from the CTH turbine failure in the last quarter of 2012. In the first half of
2012, insurance compensations amounted to US$1.1 million and they were related to a past loss at Central Tamaya.
Operating Costs
Operating Costs Amount % of total Amount % of total Amount %
Fuel and lubricants……………………………… (264.4) 53% (228.0) 43% 36.3 -14%
Energy and capacity purchases on the spot
market………………………………………….. (55.1) 11% (87.4) 17% (32.2) 58%
Depreciation and amortization attributable to
cost of goods sold……………………………. (65.7) 13% (71.6) 14% (5.9) 9%
Other costs of goods sold……………………. (114.6) 23% (138.3) 26% (23.6) 21%
Total cost of goods sold……………….. (499.8) 96% (525.3) 96% (25.5) 5%
Selling, general and administrative expenses… (25.5) 5% (21.4) 4% 4.1 -16%
Depreciation and amortization in selling,
general and administrative expenses………… (0.5) 0% (0.6) 0% (0.1) 12%
Other revenues/costs………………………………… 2.8 -1% 0.7 0% (2.2) -76%
Total operating costs….………………. (523.0) 100% (546.6) 100% (23.6) 5%
Physical Data (in GWh)
Gross electricity generation
Coal…………………………………………. 3,938 80% 3,594 79% (344) -9%
Gas………………………………………….. 805 16% 747 16% (58) -7%
Diesel Oil and Fuel Oil……………………. 133 3% 192 4% 60 45%
Hydro………………………………………. 28 1% 22 0% (5) -19%
Total gross generation…………………. 4,903 100% 4,555 100% (348) -7%
Minus Own consumption……………….. (367) -7% (313) -7% 54 -15%
Total net generation……………………. 4,536 92% 4,242 86% (294) -6%
Energy purchases on the spot market……….. 412 8% 703 14% 291 71%Total energy available for sale before
transmission losses……………………… 4,948 100% 4,945 100% (3) 0%
For the 6-month period ended June 30,
(In US$ millions, except for volumes and percentages)
6M- 2012 6M - 2013 Variation
In the first half of 2013 gross electricity generation decreased 7% compared to the same period the year
before due to lower generation from our new cost-efficient, coal-fired units, CTA and CTH in January, the
maintenance of coal-fired units in April and May, and the LNG terminal outage in June at which time the U16

11
CCGT was taken out of service for maintenance. Coal generation decreased from 9%, representing 79% of E.CL’s
total electricity generation, down from 80% in 1H12. Gas generation decreased 7%. Lower coal and gas generation
was in part covered by diesel and fuel oil generation. The remainder was covered by a 291 GWh increase in spot
energy purchases. During the first half the U12, U13, U14, U15, and CTM1 coal-fired units were subject to
maintenance and works related to our environmental upgrade CAPEX program, while our U16 gas plant underwent
maintenance works in June. The first half of 2013, particularly the months of April and May, were characterized by
a concentration of plant outages operated by both E.CL and its competitors, seeking to leave as much coal capacity
as possible available during the LNG terminal scheduled outage in June. Although our coal generation decreased in
the first quarter due to the CTA and CTH outage, in the second quarter coal generation recovered by 10%, partially
compensating for the lack of gas generation. All this explained the variation in the mix of fuels used in electricity
generation during the first half of 2013.
Lower fuel costs in the first half of 2013 can be attributed to the lower gross generation and a slightly
declining trend in fuel prices (WTI averaged US$94.1/bbl in 1H13 vs. US$98.17/bbl in 1H12). This offset the
higher cost fuel mix. The cost of spot energy and capacity purchases increased due to higher physical purchases to
compensate for the decrease in E.CL’s own generation.
Other costs of goods sold increased primarily because of the accounting of repair costs related to the CTH
turbine case (US$1.7 million) and repair costs of the CTA and CTH pipe leakages in January 2013 (US$6.6 million).
Operating Results
EBITDA Amount % of Amount % of Amount %
Total operating revenues……………………… 602.0 100% 592.4 100% (9.7) -2%
Total cost of goods sold…………………… (499.8) -83% (525.3) -89% (25.5) 5%
Gross income…………………………. 102.2 17% 67.1 11% (35.1) -34%
Total selling, general and administrative
expenses and other operating income/(costs). (23.2) -4% (21.3) -4% 1.9 -8%
Operating income….………………. 79.1 13% 45.8 8% (33.3) -42%
Depreciation and amortization……...………… 66.2 11% 72.2 12% 6.0 9%
(Provision)/reversal uncollectibles….. - - - n.a.
EBITDA…………….….………………. 145.2 24% 117.9 20% (27.3) -19%
For the 6-month period ended june 30,,
6M 20136M - 2012 Variation
(In US$ millions, except for percentages)
In the first half of 2013, EBITDA was US$117.9 million, a 19% decrease compared to 1H12. Average
realized monomic tariffs decreased due to the cheaper fuel mix used in generation and low Henry Hub prices
incorporated in the tariff charged to regulated clients. Towards the end of the semester, however, the EMEL contract
reported a slight tariff recovery as a result of the semiannual contractual tariff review process. The overall tariff
decrease was largely compensated for by lower fuel costs, in part owing to lower priced LNG purchases. However,
higher diesel generation related to planned and forced outages of plants, not only those operated by E.CL but by
other generators, had heavier impact on E.CL’s spot energy purchase costs in the second quarter of 2013. Moreover,
during the first half of 2013 E.CL reported no sales of gas to the SIC, which had positively impacted operating
income in the first half of 2012.
Depreciation increased by US$5.9 million in the first half due to the U16 overhaul and environmental
upgrade works carried out in our coal-fired plants.

12
Financial Results
Non-operating results Amount Revenues Amount Revenues Amount %
Financial income………..……………………… 1.4 0% 2.0 0% 0.6 39%
Financial expense………….………………… (23.9) -3% (23.5) -3% 0.4 -2%
Foreign exchange translation, net…………… 4.8 1% (4.2) 0% (9.0) n.a.
Other non-operating income/(expense) net… (0.6) 0% (0.9) 0% (0.3) 41%
Total non-operating results……………. (18.3) -2% (26.6) -3% (8.3) 45%
Income before tax……………………..……… 60.8 8% 19.2 2% (41.5) -68%
Income tax……………………………………… (9.6) -1% (6.5) -1% 3.1 -32%
Net income after tax ……. 51.1 6% 12.7 1% (38.5) -75%
Net income attributed to controlling
shareholders……. 46.6 6% 8.1 1% (38.5) -83%
Net income attributed to minority
shareholders……….. 4.5 1% 4.6 1% 0.1 2%
Net income to E.CL's shareholders 46.6 6% 8.1 1% (38.5) -83%
Earnings per share…………………….. 0.04 0% 0.01 0% (0.0) -83%
For the 6-month period ended June 30,
(In US$ millions, except for percentages)
6M - 20136M - 2012 Variation
Net financial expense decreased slightly, despite the US$93.7 million last disbursement of the CTA project
financing in October 2012. This is explained by lower interest paid to third parties as a result of E.CL’s acquisition
of CTH’s debt with its minority shareholder.
The most relevant non-operating item was a US$4.2 million foreign exchange loss resulting from the effect
of a sudden 6% depreciation of the Chilean peso at the end of May on certain assets denominated in pesos. This
compares negatively with foreign exchange earnings reported in the first half of 2012.
Net Earnings
After-tax income decreased by US$38.5 million compared to the first half of last year, reaching US$8.1
million, principally due to lower operating income and foreign exchange losses.
Liquidity and Capital Resources
As of June 30, 2013, E.CL reported cash balances of US$163.7 million, including short-term investments
available for sale; whereas nominal financial debt1 totaled US$764 million, with only US$12.3 million maturing
within one year.
(1) Nominal amounts may differ from the debt amounts recorded under the IFRS methodology in the Financial
Statements.

13
Cash Flow
Net cash flows provided by operating activities… 132.3 75.6
Net cash flows used in investing activities……… (115.2) (11.1)
Net cash flows provided by financing activities.. (75.3) (62.1)
Change in cash………………...…………. (58.2) 2.4
(In US$ millions)
For the 6-month period ended June 30,
2012 2013
Cash Flow from Operating Activities
In the first half of 2013 Cash flow generated from operating activities reached approximately US$76
million. This is made up of purely operating cash flow after paying interest (US$20.6 million) and income taxes
(US$31.3 million).
Cash Flow Used in Investing Activities
Cash flow used in investing activities was US$11.1 million in 1H13. This comprised US$70.9 million in
capital expenditures, which was offset by almost US$30 million received in January in payment for the sale of the
Crucero-Lagunas transmission line and a reduction in short-term financial investments. It should be noted that our
cash flow statement includes short-term investments in mutual funds as Cash flows used in investment activities,
whereas we consider them as available cash in our balance sheet for the purposes of this report.
Our most significant investing activity in the past three years has been related to the CTA and CTH projects
and the transmission assets needed to deliver the energy generated by CTA and CTH to our customers. Beginning in
January 2013, we have started to account for 100% of CTH’s capital expenditures. These projects have been fully
paid; consequently, the main capital expenditures in 2013 are referred to the overhaul of our power plants,
equipment upgrade and refurbishing, and environmental improvement works.
With a total investment of nearly US$170 million, E.CL has been developing an emission-reduction
program (“environmental CAPEX”), an initiative for the purpose of meeting and even surpassing the new
environmental requirements in terms of reducing particulate matter and gas emissions from our thermoelectric
power plants. As of this date, E.CL has installed all six bag filters considered in its particulate matter emission
reduction plan at its CTM1 and CTM2 units in Mejillones and its U12, U13, U14, and U15 units in Tocopilla, The
next stage considers the implementation of systems for the reduction of gas emissions.
Our capital expenditures in the first half of 2013 and 2012, amounted to US$71 million and US$91.3
million, respectively, and included the following:

14
Capital Expenditures
CAPEX
CTA……………………………………………………. 9.9 -
CTH (1)
………………………………………………… 30.6 -
Central Tamaya………………………………………. 2.9
El Cobre substation & Chacaya-El Cobre
transmission line…………………………… 8.0 1.5
Overhaul power plants & equipment maintenance
and refurbishing………………… 13.0 43.9
Environmental improvement works……………… 16.0 13.8
Others…………………………………………… 13.8 9.0
Total capital expenditures………………………. 91.3 71.0
(1) 100% of these capital expenditures are recognized per IFRS.
For the 6-month period ended June 30,
2012 2013
(In US$ millions)
Cash Flow from Financing Activities
Our main financing activities during the first half of 2013 are listed below. However, it should be noted
that interest payments are included in Cash from operations.
On January 15, E.CL paid interest on its 144-A bond in the amount of US$11.25 million.
On June 17, 2013, CTA paid the fifth principal installment of its project financing in the amount
of US$5.8 million plus interest.
On May 16, 2013, E.CL paid dividends in the amount of US$56.2 million on the account of
2012’s net income.
Contractual Obligations
The following table sets forth the maturity profile of our debt obligations as of June 30, 2013. This table
shows the nominal amount of our debt balances, which may differ from the debt amounts recorded under the IFRS
methodology in the Financial Statements:
Total < 1 year 1 - 3 years 3 - 5 years
More than 5
years
Bank debt…………………………… 363.9 12.3 30.2 35.8 285.7
Bonds (144 A/Reg S Notes)……… 400.0 400.0
Leasing obligations……...……… 0.3 0.2 0.0 0.0 0.1
Accrued interest………………… 11.0 11.0
Mark-to-market swaps 19.5 19.5
Total 794.7 23.4 30.2 35.8 705.3
Contractual Obligations as of 06/30/13
(In US$ millions)
Payments Due by Period

15
In the above table, bank debt includes the project financing extended by IFC and KfW to our subsidiary
CTA. As of June 30, 2013, the total principal amount was US$363.9 million, payable in semiannual installments,
ending with a 25% balloon payment on June 15, 2025.
The bonds correspond to our US$400 million 10-year 5.625% 144-A/Reg.S notes maturing January 15,
2021. The proceeds of this issue were used to repay our loans with shareholders and related parties in December
2010.
Other debt includes US$0.3 million in leasing obligations related to transmission assets, as well as a
US$19.5 million mark-to-market provision on interest-rate swaps taken by CTA to hedge its exposure to floating
interest rates. An equivalent amount has been charged to our shareholders’ equity account according to IFRS rules.
Dividend Policy
Our dividend payment policy consists of paying the minimum legal required amounts (30%), although
higher amounts may be approved if the company’s conditions so allow. Our dividend payment for each year is
proposed by our Board of Directors based on the year’s financial performance, the size of our available cash balance
and anticipated financing requirements for capital expenditures and investments in the following years. The dividend
payment proposed by our Board is subsequently approved at a Shareholders’ Meeting as established by law. On
April 23, 2013, our shareholders approved dividends in an amount equivalent to 100% of our 2012 net earnings; that
is, US$56.17 million. This dividend was paid on May 16, 2013.
The record of dividends paid since 2010 is shown in the following table:
Amount
(in US$ millions)
04-May-10 Final (on account of 2009 net income) 77.7 0.07370
04-May-10 Additional (on account of 2009 net income) 1.9 0.00180
May 5, 2011 Final (on account of 2010 net income) 100.1 0.09505
Aug 25 2011 Provisional (on account of 2011 net income) 25.0 0.02373
May 16 2012 Final (on account of 2011 net income) 64.3 0.06104
May 16 2013 Final (on account of 2012 net income) 56.2 0.05333
Cash Dividends paid by E.CL S.A. in 2010, 2011 ,2012 and 2013
Payment Date Dividend Type US$ per share
Hedging Policy
Our hedging policy covers certain risks to which we are exposed, as follows:
Business Risk and Commodity Hedging
Our business is subject to the risk of variations in the availability of fuels and their prices. Our policy is to
hedge as much as possible against these risks through the indexation of the energy tariffs incorporated in our PPAs,
and the fuel mix taken into consideration in the tariffs. The tariff of the EMEL contract, which became effective at
the beginning of 2012, is readjusted semiannually according to the Henry Hub and the U.S. CPI indices. The
company signed a long-term LNG purchase contract indexed to Henry Hub to supply the EMEL PPA; however, the
company did not begin to receive HH-priced LNG until the fourth quarter of 2012. Hence, our company remained
temporarily exposed to the risk of mismatch between Henry Hub and the fuel price or system marginal cost
fluctuations which the company had to face to fulfill its power supply obligations under the EMEL contract. This
mismatch affected our financial results in 2012. In 1H13, there was no such mismatch as both the LNG bought to
supply the EMEL contract and the PPA tariff are readjusted according to the same index. Nevertheless, a mismatch
remains between the Henry Hub index used to define the EMEL tariff (4-month average prior to the tariff fixing,
16
which takes place every six months) and the Henry Hub index prevailing at the time each LNG shipment is made.
This risk is mitigated by the EMEL tariff’s automatic indexation triggered any time the Henry Hub index reports a
fluctuation of 10% or more.
Currency Hedging
Given that most of our revenues and costs are denominated in U.S. dollars and that we seek to incur debt
in U.S. dollars, we face limited exposure to foreign exchange risk. Our main costs denominated in Chilean pesos are
personnel and administrative expenses, which account for approximately 5% of our total operating costs. Our most
significant asset denominated in Chilean pesos consists of value added taxes paid on our purchases of equipment for
our CTA and CTH projects. The amount of this asset has decreased significantly through tax refunds, and we have
occasionally engaged in forward agreements to partially hedge it against foreign currency risk. In the specific case
of the EMEL contract, it is payable in pesos at the prevailing exchange rate at the time of the tariff fixing, which is
adjusted every six months as opposed to other PPAs that are readjusted on a monthly basis. Therefore, the exposure
of this PPA to exchange rate fluctuations is higher.
Interest Rate Hedging
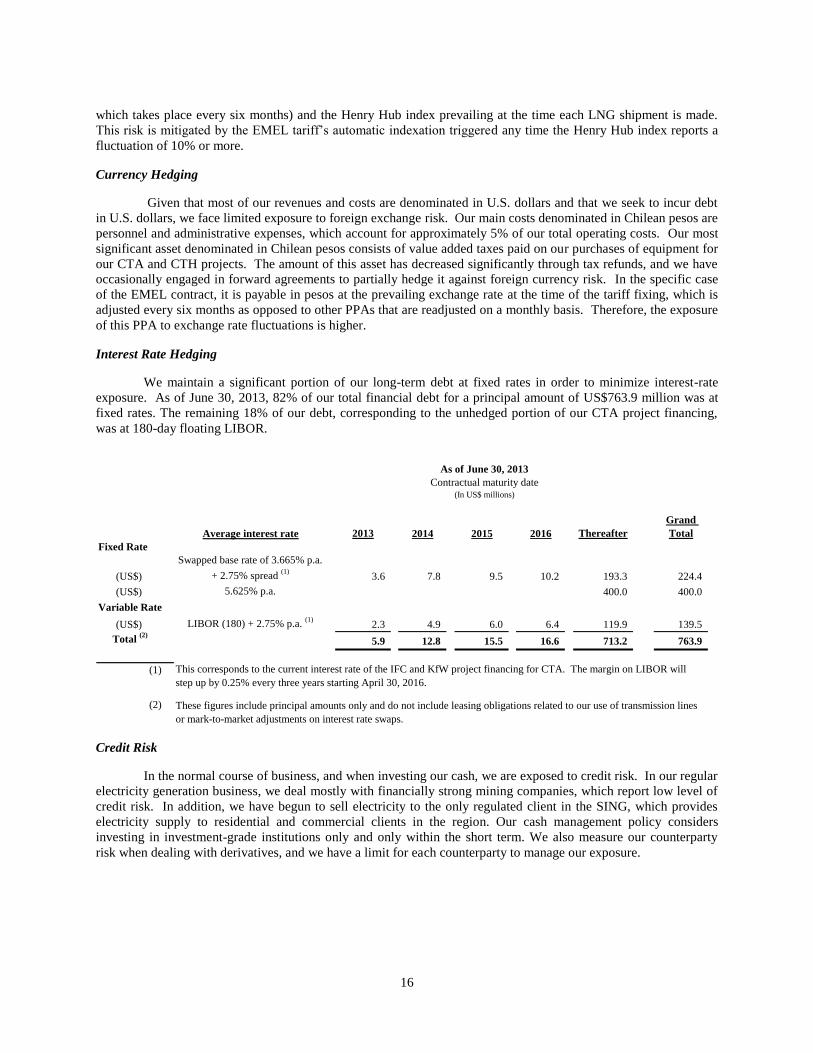
We maintain a significant portion of our long-term debt at fixed rates in order to minimize interest-rate
exposure. As of June 30, 2013, 82% of our total financial debt for a principal amount of US$763.9 million was at
fixed rates. The remaining 18% of our debt, corresponding to the unhedged portion of our CTA project financing,
was at 180-day floating LIBOR.
Average interest rate 2013 2014 2015 2016 Thereafter
Grand
Total
Fixed Rate
(US$)
Swapped base rate of 3.665% p.a.
+ 2.75% spread (1)
3.6 7.8 9.5 10.2 193.3 224.4
(US$) 5.625% p.a. 400.0 400.0
Variable Rate
(US$) LIBOR (180) + 2.75% p.a. (1)
2.3 4.9 6.0 6.4 119.9 139.5
Total (2)
5.9 12.8 15.5 16.6 713.2 763.9
(1)
(2)
This corresponds to the current interest rate of the IFC and KfW project financing for CTA. The margin on LIBOR will
step up by 0.25% every three years starting April 30, 2016.
These figures include principal amounts only and do not include leasing obligations related to our use of transmission lines
or mark-to-market adjustments on interest rate swaps.
As of June 30, 2013
Contractual maturity date(In US$ millions)
Credit Risk
In the normal course of business, and when investing our cash, we are exposed to credit risk. In our regular
electricity generation business, we deal mostly with financially strong mining companies, which report low level of
credit risk. In addition, we have begun to sell electricity to the only regulated client in the SING, which provides
electricity supply to residential and commercial clients in the region. Our cash management policy considers
investing in investment-grade institutions only and only within the short term. We also measure our counterparty
risk when dealing with derivatives, and we have a limit for each counterparty to manage our exposure.

17
OWNERSHIP STRUCTURE AS OF JUNE 30, 2013
No. of Shareholders: 1,919
GDF Suez; 52,77%
Chilean pension funds; 24,56%
Chilean Inst. Inv.; 12,88%
Foreign Inst. inv.; 8,84%
Others; 0,95%
TOTAL NUMBER OF SHARES: 1,053,309,776

18
APPENDIX 1
PHYSICAL DATA AND SUMMARIZED QUARTERLY FINANCIAL STATEMENTS
1Q12 2Q12 6M Total 1Q13 2Q13 6M Total
Physical Sales
Sales of energy to unregulated customers. 1,805 1,853 3,658 1,930 1,866 3,795
Sales of energy to regulated customers 417 412 829 444 454 898
Sales of energy to the spot market……… 116 71 187 33 80 112
Total energy sales…………………………. 2,339 2,336 4,674 2,406 2,399 4,805 -
Gross electricity generation -
Coal…………………………………………. 1,934 2,004 3,938 1,710 1,884 3,594
Gas………………………………………….. 258 548 805 451 296 747
Diesel Oil and Fuel Oil……………………. 53 80 133 87 106 192
Hydro………………………………………. 17 11 28 12 10 22
Total gross generation…………………. 2,261 2,642 4,903 2,260 2,295 4,555
Minus Own consumption……………….. (177.1) (190.3) (367.4) (164.3) (149.0) (313.3)
Total net generation……………………. 2,084 2,452 4,536 2,096 2,146 4,242
Energy purchases on the spot market……….. 378 34 412 369 334 703
Total energy available for sale before
transmission losses……………………… 2,461 2,486 4,948 2,465 2,480 4,945
2012 2013

19
IFRS
Operating Revenues 1Q12 2Q12 1H12 1Q13 2Q13 1H13
Regulated customers sales……………………… 46.8 40.0 86.7 41.4 43.0 84.3
Unregulated customers sales………………….. 226.9 223.3 450.3 222.8 218.9 441.6
Spot market sales……………………………….. 14.7 12.9 27.5 2.4 4.2 6.6
Total revenues from energy and capacity
sales…………………………… 288.4 276.2 564.5 266.5 266.1 532.6
Gas distribution sales………………………….. 1.0 0.7 1.6 0.4 0.9 1.3
Other operating revenue………………………. 16.3 19.5 35.9 18.1 40.3 58.5
Total operating revenues…………………. 305.7 296.3 602.0 285.1 307.3 592.4
Operating Costs
Fuel and lubricants……………………………… (108.7) (155.6) (264.4) (113.5) (114.5) (228.0) Energy and capacity purchases on the spot
market………………………………………….. (39.5) (15.6) (55.1) (35.9) (51.5) (87.4) Depreciation and amortization attributable to
cost of goods sold……………………………. (33.5) (32.2) (65.7) (35.5) (36.1) (71.6)
Other costs of goods sold……………………. (57.9) (56.8) (114.6) (58.1) (80.2) (138.3)
Total cost of goods sold……………….. (239.6) (260.2) (499.8) (243.1) (282.2) (525.3)
Selling, general and administrative expenses… (12.3) (13.2) (25.5) (11.0) (10.4) (21.4)
Depreciation and amortization in selling,
general and administrative expenses………… (0.2) (0.3) (0.5) (0.3) (0.3) (0.6)
Other revenues………...………………………. 0.7 2.1 2.8 0.2 0.4 0.7
Total operating costs….………………. (251.5) (271.5) (523.0) (254.1) (292.5) (546.6)
Operating income….………………. 54.3 24.8 79.1 31.0 14.8 45.8
EBITDA…………….….………………. 88.0 57.2 145.2 66.8 51.1 117.9
Financial income………..……………………… 0.9 0.5 1.4 1.0 0.9 2.0
Financial expense………….………………… (12.1) (11.8) (23.9) (11.7) (11.7) (23.5)
Foreign exchange translation, net…………… 6.6 (1.8) 4.8 2.7 (6.9) (4.2)
Other non-operating income/(expense) net… (0.1) (0.5) (0.6) (0.2) (0.7) (0.9)
Total non-operating results…………… (4.7) (13.6) (18.3) (8.2) (18.4) (26.6)
Income before tax……………………..……… 49.6 11.2 60.8 22.8 (3.6) 19.2
Income tax……………………………………… (7.6) (2.0) (9.6) (5.0) (1.6) (6.5)
Net income after tax ……. 42.0 9.1 51.1 17.9 (5.2) 12.7
Net income attributed to controlling
shareholders………………. 40.1 6.5 46.6 16.6 (8.5) 8.1
Net income attributed to minority
shareholders………………. 1.9 2.6 4.5 1.2 3.4 4.6
Net income to E.CL's shareholders……. 42.0 4.6 46.6 16.6 (8.5) 8.1
Earnings per share…………………….. 0.040 0.004 0.044 0.017 (0.008) 0.008
2012
Quarterly Income Statement (in US$ millions)

20
2013
31-Dec-12 30-Jun-13
Current Assets
Cash and cash equivalents (1) 192.1 163.7
Accounts receivable 176.4 150.8
Recoverable taxes 64.6 52.0
Other current assets 205.1 227.3
Total current assets 638.1 593.8
Non-Current Assets
Property, plant and equipment, net 1,961.2 1,968.1
Other non-current assets 417.6 410.2
TOTAL ASSETS 3,016.9 2,972.1
Current Liabilities
Financial debt 20.6 21.7
Other current liabilities 208.0 202.9
Total current liabilities 228.6 224.6
Long-Term Liabilities
Financial debt (including intercompany) 774.2 752.0
Other long-term liabilities 213.7 211.2
Total long-term liabilities 987.9 963.2
Shareholders' equity1,685.2 1,664.6
Minority' equity 115.2 119.8
Equity 1,800.4 1,784.4
TOTAL LIABILITIES AND
SHAREHOLDERS' EQUITY 3,016.9 2,972.1
(1) Includes short-term investments classified as available for
sale.
2012
Quarterly Balance Sheet
(In U.S.$ millions)

21
Jun-13 Jun-12 Var.
LIQUIDITY Current ratio (veces) 2.64 1.94 36%
(current assets / current liabilities)
Quick ratio (veces) 1.98 1.58 25%
((current assets - inventory) / current liabilities)
Working capital MMUS$ 369.24 309.70 19%
(current assets – current liabilities)
LEVERAGE Leverage (veces) 0.67 0.68 -2%
((current liabilities + long-term liabilities) / networth)
Interest coverage (veces) 5.03 6.09 -17%
((EBITDA / interest expense))
Financial debt –to- LTM EBITDA* (veces) 3.40 2.01 70%
Net financial debt – to - LTM EBITDA* (veces) 2.68 1.51 77%
PROFITABILITY Return on equity* % 1.1% 8.4% -87%
(LTM net income attributed to the controller / net worth attributed to the controller)
Return on assets* % 0.6% 4.7% -87%
(LTM net income attributed to the controller / total assets)
*LTM = Last twelve months
FINANCIAL RATIOS
CONFERENCE CALL 1H13
E.CL is pleased to inform you that it will conduct a conference call to review its results for the period
ended June 30, 2013, on Friday, August 2, 2013, at 10 a.m. (EST) – 10 a.m. (Chilean Time)
hosted by:
Lode Verdeyen, CEO E.CL S.A.
To participate, please dial: +1 (706) 902-4518, international or 12300206168 (toll free Chile).
Passcode I.D.: #16231991, approximately 10 minutes prior to the scheduled starting time.
To access the phone replay, please dial +1 (855) 859- 2056 or (404) 537-3406
Passcode I.D.: #16231991. A conference call replay will be available until August 9, 2013.