iii - ghana statistical services map... · 2015-10-14 · lower manya (28.3) and ayensuano (29.3)...
TRANSCRIPT

ii
iii
Copyright © 2015 Ghana Statistical Service
iv
PREFACE AND ACKNOWLEDGEMENT
The Ghana Statistical Service wishes to acknowledge the contribution of the Government of
Ghana, the UK Department for International Development (UK-DFID) and the World Bank
through the provision of both technical and financial support towards the successful
implementation of the Poverty Mapping Project using the Small Area Estimation Method.
The Service also acknowledges the invaluable contributions of Dhiraj Sharma, Vasco Molini and
Nobuo Yoshida (all consultants from the World Bank), Baah Wadieh, Anthony Amuzu,
Sylvester Gyamfi, Abena Osei-Akoto, Jacqueline Anum, Samilia Mintah, Yaw Misefa, Appiah
Kusi-Boateng, Anthony Krakah, Rosalind Quartey, Francis Bright Mensah, Omar Seidu, Ernest
Enyan, Augusta Okantey and Hanna Frempong Konadu, all of the Statistical Service who
worked tirelessly with the consultants to produce this report under the overall guidance and
supervision of Dr. Philomena Nyarko, the Government Statistician.
Dr. Philomena Nyarko
Government Statistician
v
TABLE OF CONTENTS
PREFACE AND ACKNOWLEDGEMENT ............................................................................. iv
LIST OF TABLES ....................................................................................................................... vi
LIST OF FIGURES .................................................................................................................... vii
EXECUTIVE SUMMARY ......................................................................................................... ix
CHAPTER ONE: INTRODUCTION ......................................................................................... 1
CHAPTER TWO: METHODOLOGY ....................................................................................... 2
CHAPTER THREE: POVERTY AND INEQUALITY ESTIMATES ................................... 6
National Poverty Map ................................................................................................................. 7
Western Region ......................................................................................................................... 13
Central Region........................................................................................................................... 15
Greater Accra Region ................................................................................................................ 18
Volta Region ............................................................................................................................. 20
Eastern Region .......................................................................................................................... 25
Ashanti Region .......................................................................................................................... 27
Brong Ahafo Region ................................................................................................................. 30
Northern Region ........................................................................................................................ 32
Upper East Region .................................................................................................................... 35
Upper West Region ................................................................................................................... 37
CHAPTER FOUR: CONCLUSIONS ....................................................................................... 40
REFERENCES ............................................................................................................................ 41
APPENDICES ............................................................................................................................. 42
APPENDIX 1: Table of results by region ................................................................................. 42
APPENDIX 2: Regional GLS models ...................................................................................... 58
APPENDIX 3: Common variables ............................................................................................ 73
LEAGUE TABLE OF POVERTY INCIDENCE (Po) ............................................................ 75
vi
LIST OF TABLES
Table 3.1: Poverty head count by region (poverty line = GH₵1,314) ....................................... 7
Table A1.1: Poverty and inequality estimates of Western Region by district (Poverty line=
GH₵1,314) ............................................................................................................... 42
Table A1.2: Poverty and inequality estimates of Central Region by district (Poverty line=
GH₵1,314) ............................................................................................................... 43
Table A1.3: Poverty and inequality estimates of Greater Accra Region by district
(Poverty line= GH₵1,314) ....................................................................................... 44
Table A1.4: Poverty and inequality estimates of Volta Region by district (Poverty line=
GH₵1,314) ............................................................................................................... 45
Table A1.5: Poverty and inequality estimates of Eastern Region by district (Poverty line=
GH₵1,314) ............................................................................................................... 46
Table A1.6: Poverty and inequality estimates of Ashanti Region by district (Poverty line=
GH₵1,314) ............................................................................................................... 47
Table A1.7: Poverty and inequality estimates of Brong Ahafo Region by district
(Poverty line= GH₵1,314) ....................................................................................... 48
Table A1.8: Poverty and inequality estimates of Northern Region by district (Poverty line=
GH₵1,314) ............................................................................................................... 49
Table A1.9: Poverty and inequality estimates of Upper East Region by district (Poverty line=
GH₵1,314) .............................................................................................................. 50
Table A1.10: Poverty and inequality estimates of Upper East Region by district (Poverty line=
GH₵1,314) .............................................................................................................. 51
Table A1.11: Rank of Districts by Poverty Indices ...................................................................... 52
Table A3.1: Comparison of 2010 PHC and GLSS6 questions ................................................... 73

vii
LIST OF FIGURES
Figure 3.1: Incidence of poverty ................................................................................................... 9
Figure 3.2: Estimated Number of Poor Persons.......................................................................... 10
Figure 3.3: Depth of Poverty ...................................................................................................... 11
Figure 3.4: Inequality .................................................................................................................. 12
Figure 3.5: Poverty Incidence - Western Region ........................................................................ 13
Figure 3.6: Estimated Number of Poor Persons - Western Region ............................................ 14
Figure 3.7: Poverty Depth - Western Region.............................................................................. 14
Figure 3.8: Poverty Inequality - Western Region ....................................................................... 15
Figure 3.9: Poverty Incidence - Central Region ......................................................................... 16
Figure 3.10: Estimated Number of Poor Persons - Central Region .............................................. 16
Figure 3.11: Poverty Depth - Central Region ............................................................................... 17
Figure 3.12: Poverty Inequality - Central Region ......................................................................... 17
Figure 3.13: Poverty Incidence - Greater Accra Region ............................................................... 18
Figure 3.14: Estimated Number of Poor Persons - Greater Accra Region ................................... 19
Figure 3.15: Poverty Depth – Greater Accra Region .................................................................... 19
Figure 3.16: Poverty Inequality - Greater Accra .......................................................................... 20
Figure 3.17: Poverty Incidence - Volta Region ............................................................................ 21
Figure 3.18: Estimated Number of Poor Persons - Volta Region ................................................. 22
Figure 3.19: Poverty Depth – Volta Region ................................................................................. 23
Figure 3.20: Poverty Inequality - Volta Region............................................................................ 24
Figure 3.21: Poverty Incidence - Eastern Region ......................................................................... 25
Figure 3.23: Estimated Number of Poor Persons - Eastern Region .............................................. 26
Figure 3.23: Poverty Depth – Eastern Region .............................................................................. 26
Figure 3.24: Poverty Inequality - Eastern Region ........................................................................ 27
Figure 3.25: Poverty Incidence - Ashanti Region ......................................................................... 28
Figure 3.26: Estimated Number of Poor Persons - Ashanti Region ............................................. 28
Figure 3.27: Poverty Depth – Ashanti Region .............................................................................. 29
Figure 3.28: Poverty Inequality - Ashanti Region ........................................................................ 29
Figure 3.29: Poverty Incidence – Brong Ahafo Region ............................................................... 30
viii
Figure 3.30: Estimated Number of Poor Persons - Brong Ahafo Region ..................................... 31
Figure 3.31: Poverty Depth – Brong Ahafo Region ..................................................................... 31
Figure 3.32: Poverty Inequality - Brong Ahafo Region ............................................................... 32
Figure 3.33: Poverty Incidence – Northern Region ...................................................................... 33
Figure 3.34: Estimated Number of Poor Persons - Northern Region ........................................... 33
Figure 3.35: Poverty Depth – Northern Region ............................................................................ 34
Figure 3.36: Poverty Inequality - Northern Region ...................................................................... 34
Figure 3.37: Poverty Incidence – Upper East Region ................................................................... 35
Figure 3.38: Estimated Number of Poor Persons - Upper East Region ........................................ 36
Figure 3.39: Poverty Depth – Upper East Region ........................................................................ 36
Figure 3.40: Poverty Inequality - Upper East Region................................................................... 37
Figure 3.41: Poverty Incidence – Upper West Region ................................................................. 38
Figure 3.42: Estimated Number of Poor Persons - Upper West Region ...................................... 38
Figure 3.43: Poverty Depth – Upper West Region ....................................................................... 39
Figure 3.44: Poverty Inequality - Upper West Region ................................................................. 39
ix
EXECUTIVE SUMMARY
Introduction
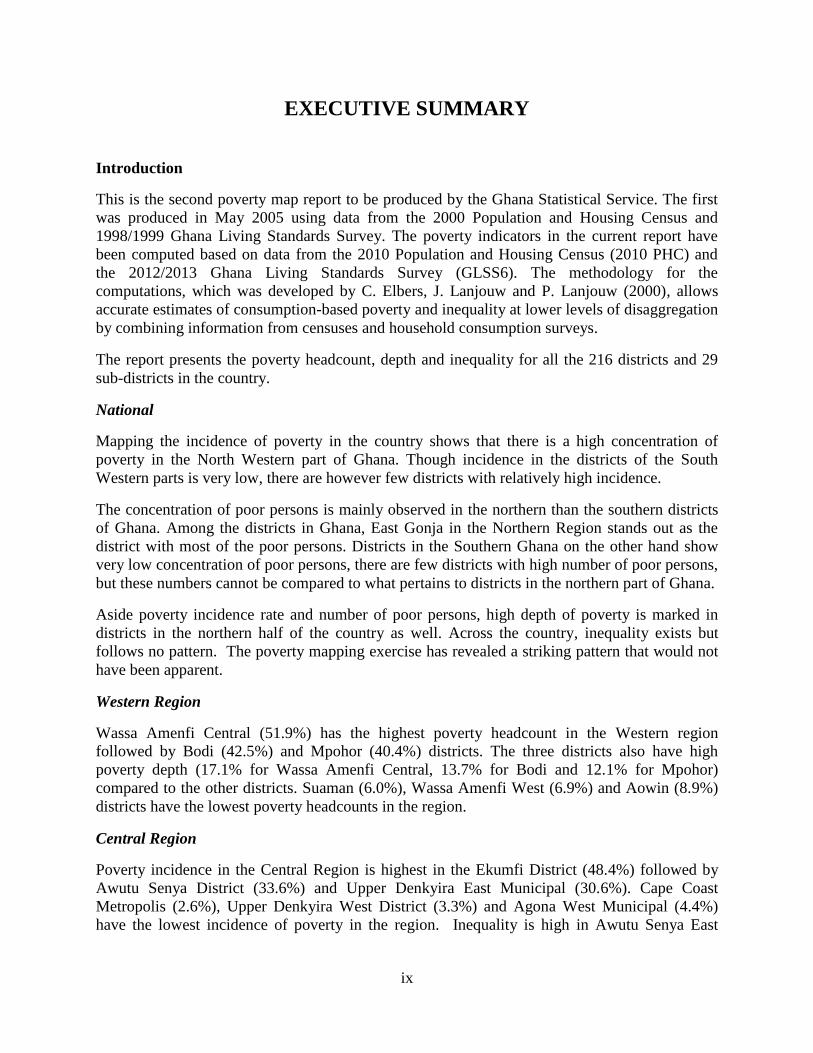
This is the second poverty map report to be produced by the Ghana Statistical Service. The first
was produced in May 2005 using data from the 2000 Population and Housing Census and
1998/1999 Ghana Living Standards Survey. The poverty indicators in the current report have
been computed based on data from the 2010 Population and Housing Census (2010 PHC) and
the 2012/2013 Ghana Living Standards Survey (GLSS6). The methodology for the
computations, which was developed by C. Elbers, J. Lanjouw and P. Lanjouw (2000), allows
accurate estimates of consumption-based poverty and inequality at lower levels of disaggregation
by combining information from censuses and household consumption surveys.
The report presents the poverty headcount, depth and inequality for all the 216 districts and 29
sub-districts in the country.
National
Mapping the incidence of poverty in the country shows that there is a high concentration of
poverty in the North Western part of Ghana. Though incidence in the districts of the South
Western parts is very low, there are however few districts with relatively high incidence.
The concentration of poor persons is mainly observed in the northern than the southern districts
of Ghana. Among the districts in Ghana, East Gonja in the Northern Region stands out as the
district with most of the poor persons. Districts in the Southern Ghana on the other hand show
very low concentration of poor persons, there are few districts with high number of poor persons,
but these numbers cannot be compared to what pertains to districts in the northern part of Ghana.
Aside poverty incidence rate and number of poor persons, high depth of poverty is marked in
districts in the northern half of the country as well. Across the country, inequality exists but
follows no pattern. The poverty mapping exercise has revealed a striking pattern that would not
have been apparent.
Western Region
Wassa Amenfi Central (51.9%) has the highest poverty headcount in the Western region
followed by Bodi (42.5%) and Mpohor (40.4%) districts. The three districts also have high
poverty depth (17.1% for Wassa Amenfi Central, 13.7% for Bodi and 12.1% for Mpohor)
compared to the other districts. Suaman (6.0%), Wassa Amenfi West (6.9%) and Aowin (8.9%)
districts have the lowest poverty headcounts in the region.
Central Region
Poverty incidence in the Central Region is highest in the Ekumfi District (48.4%) followed by
Awutu Senya District (33.6%) and Upper Denkyira East Municipal (30.6%). Cape Coast
Metropolis (2.6%), Upper Denkyira West District (3.3%) and Agona West Municipal (4.4%)
have the lowest incidence of poverty in the region. Inequality is high in Awutu Senya East
x
Municipal (42.6), Upper Denkyira East Municipal (41.8), Assin North Municipal (41.8) and
Awutu Senya District (41.5).
Greater Accra Region
La Dade Kotopon Municipal (1.3%), Accra Metropolis (2.5%) and La Nkwantanang Madina
District (2.8%) have the lowest poverty incidence in the region. The highest incidence of poverty
is observed in Shai Osudoku District (55.1%), followed by Ningo Prampram District (31.2%).
The two districts also have higher poverty depth (23.2% for Shai Osudoku and 10.1% for Ningo
Prampram) compared to the other districts.
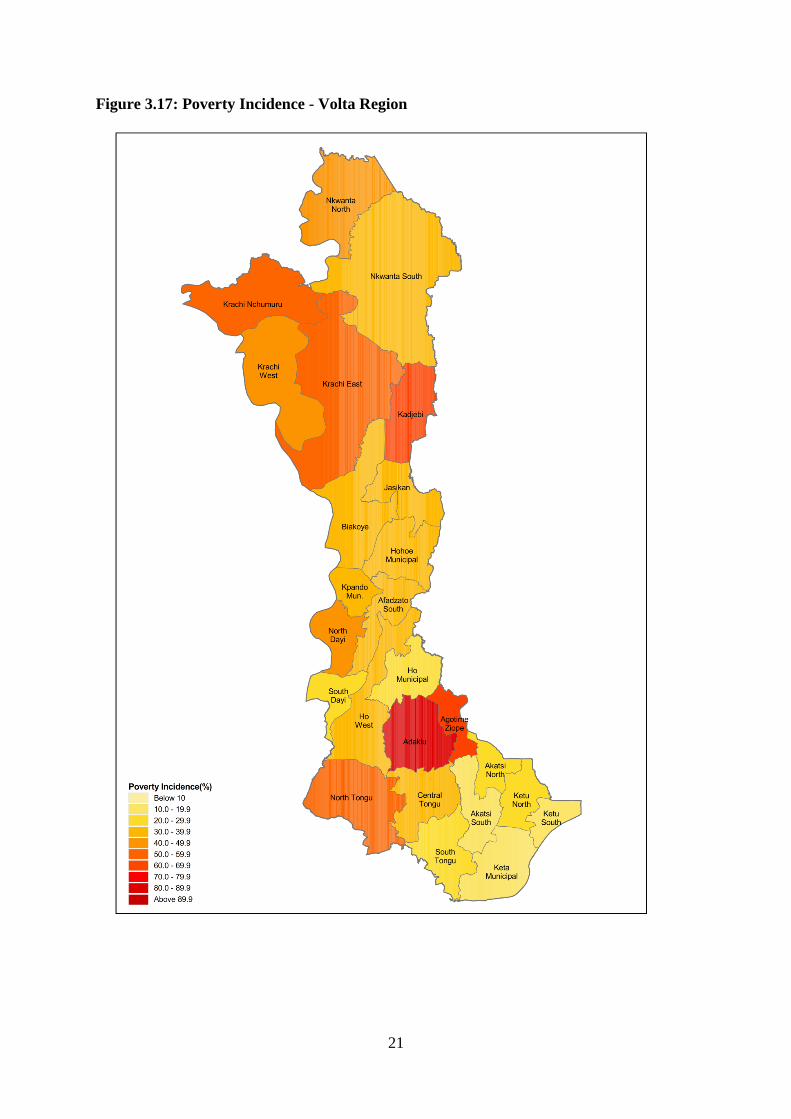
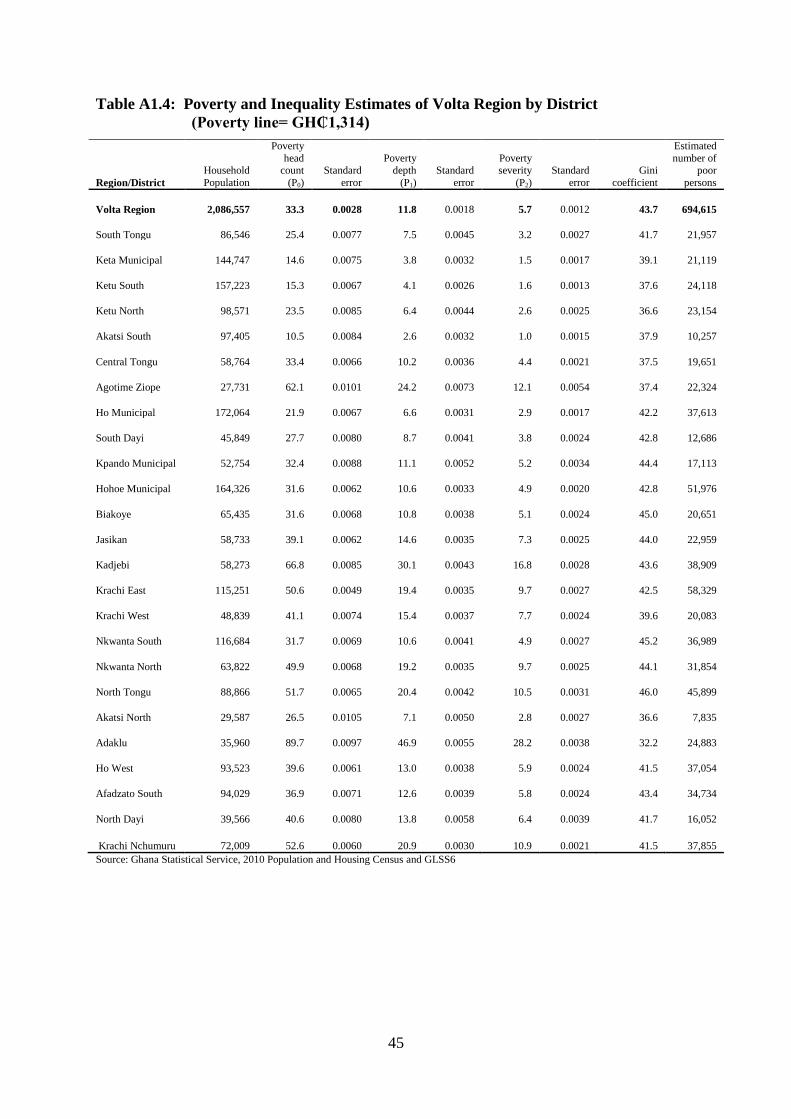
Volta Region
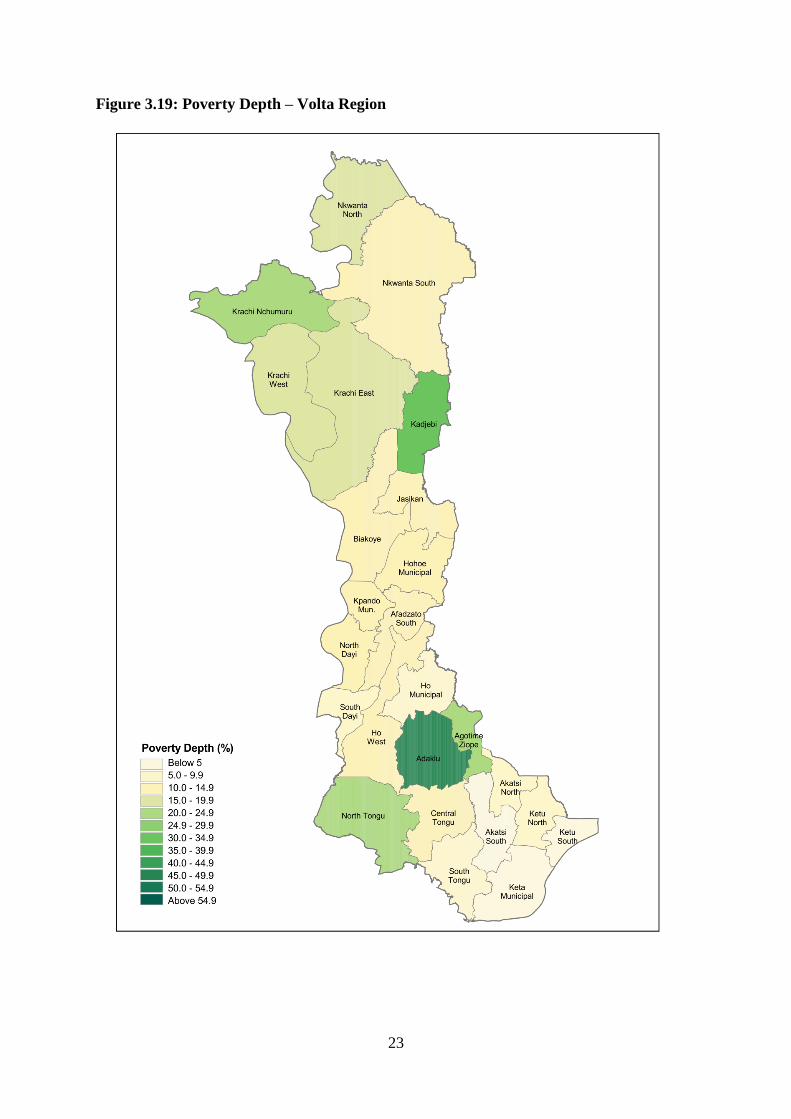
Poverty incidence in the Volta region is highest in the Adaklu District (89.7%) followed by
Kadjebi (66.8%) and Agotime Ziope (62.1%) districts. The depth of poverty for Adaklu (46.9%)
and Agotime Ziope (30.1%) are high compared to the other districts. Akatsi South (10.5%) has
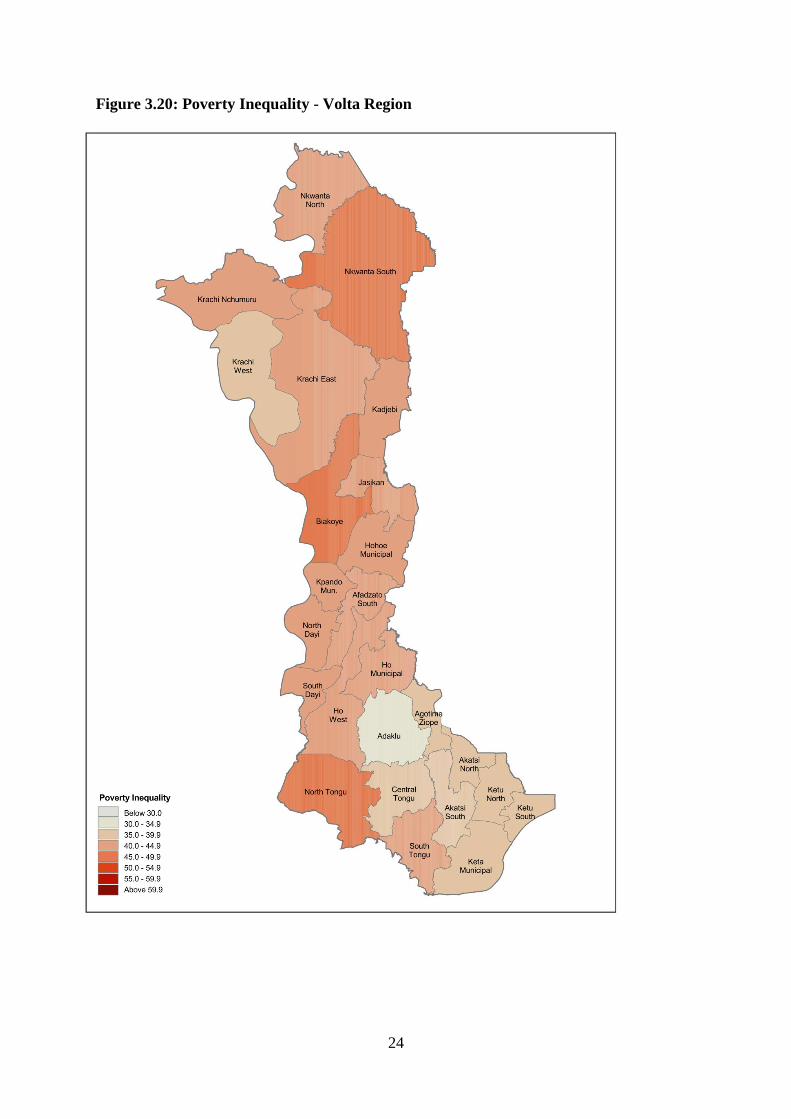
the lowest incidence of poverty. Inequality is highest in North Tongu District (46.0) followed by
Nkwanta South (45.2), Biakoye (45.0) districts and Kpando Municipal (44.4).
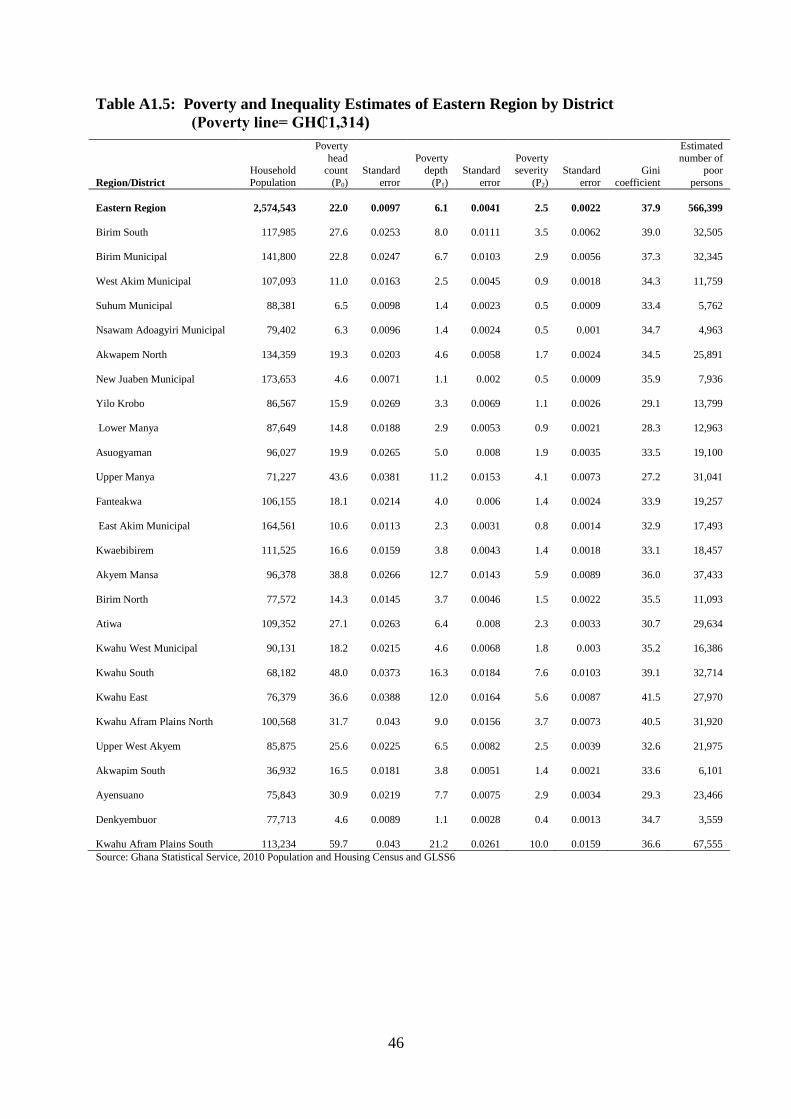
Eastern Region
Kwahu Afram Plains South District (59.7%) has the highest poverty incidence in the Eastern
Region followed by Kwahu South (48.0%) and Upper Manya (43.6%) districts. High poverty
depth is also observed in the three districts (21.2% for Kwahu Afram Plains South, 16.3% for
Kwahu South and 11.2% for Upper Manya). Four districts, New Juaben Municipal (4.6%),
Denkyembour (4.6%), Nsawam Adoagyiri Municipal (6.3%) and Suhum Municipal (6.5%) have
low incidence of poverty. Inequality, on the other hand, is relatively low in Upper Manya (27.2),
Lower Manya (28.3) and Ayensuano (29.3) compared to the other districts in the region.
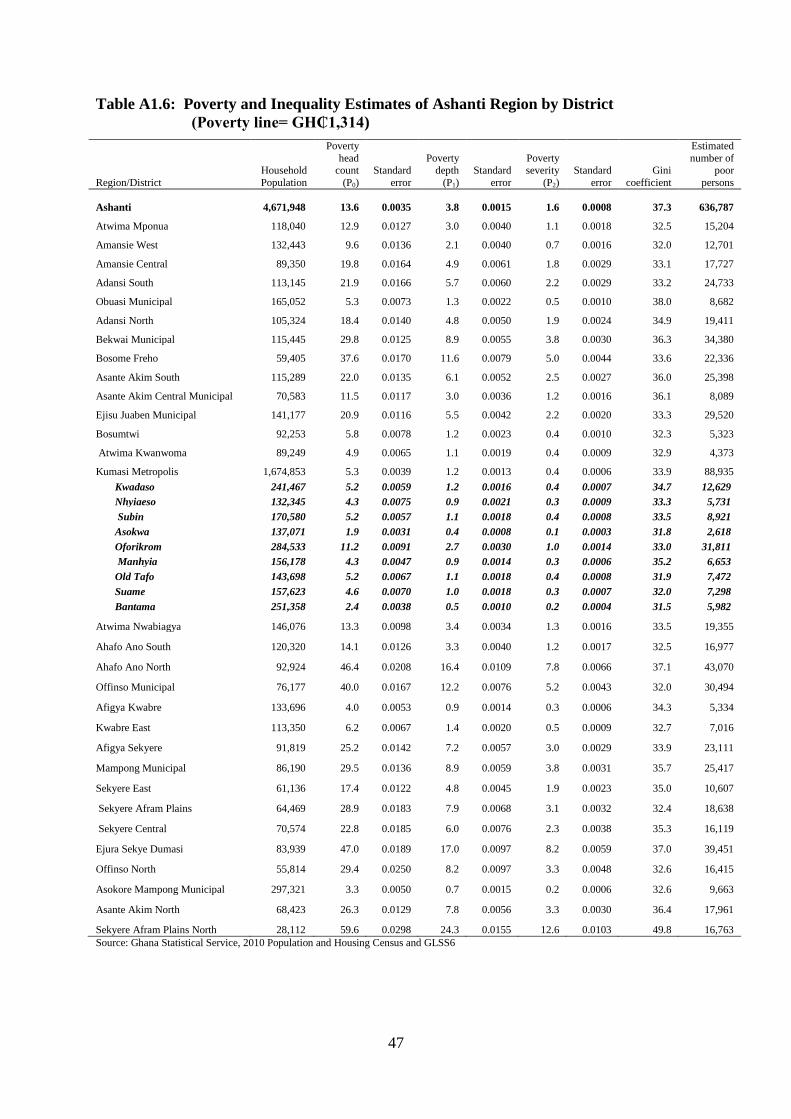
Ashanti Region
Poverty incidence in the Ashanti region is highest in the Sekyere Afram Plains North (59.6%)
followed by Ejura Sekye Dumasi (47.0%) and Ahafo Ano North (46.4%) districts but very low
in Asokore Mampong Municipal (3.3%), Afigya Kwabre (4.0%) and Atwima Kwanwoma
(4.9%) districts. Poverty depth is high in Sekyere Afram Plains North (24.3%), Ejura Sekye
Dumasi (17.0%) and Ahafo Ano North (16.4%) districts. Sekyere Afram Plains North (49.8) is
the only district in the region with inequality higher than the regional average of 37.3.
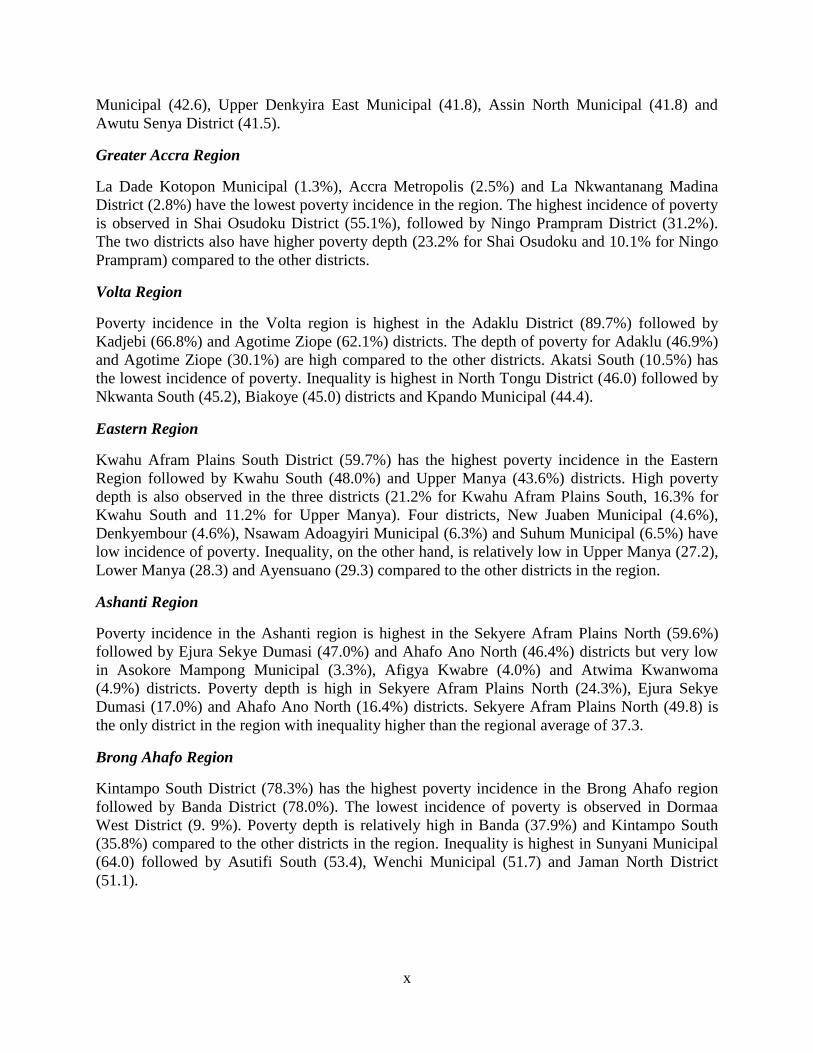
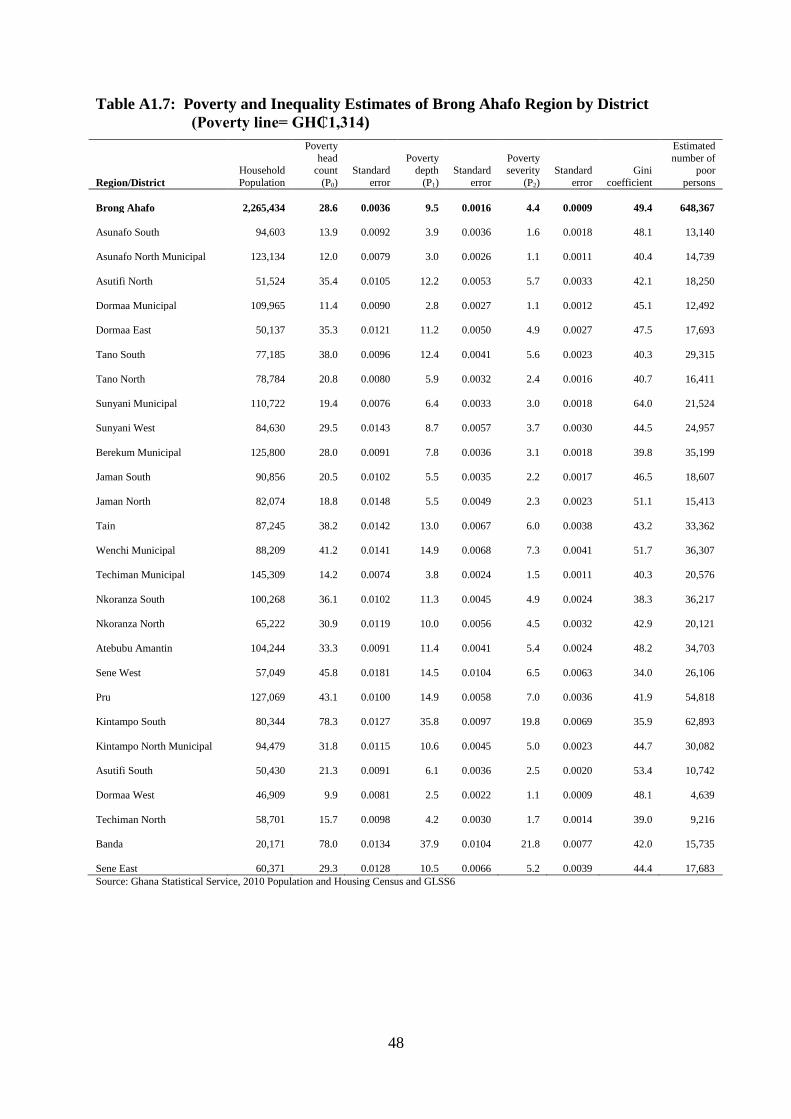
Brong Ahafo Region
Kintampo South District (78.3%) has the highest poverty incidence in the Brong Ahafo region
followed by Banda District (78.0%). The lowest incidence of poverty is observed in Dormaa
West District (9. 9%). Poverty depth is relatively high in Banda (37.9%) and Kintampo South
(35.8%) compared to the other districts in the region. Inequality is highest in Sunyani Municipal
(64.0) followed by Asutifi South (53.4), Wenchi Municipal (51.7) and Jaman North District
(51.1).
xi
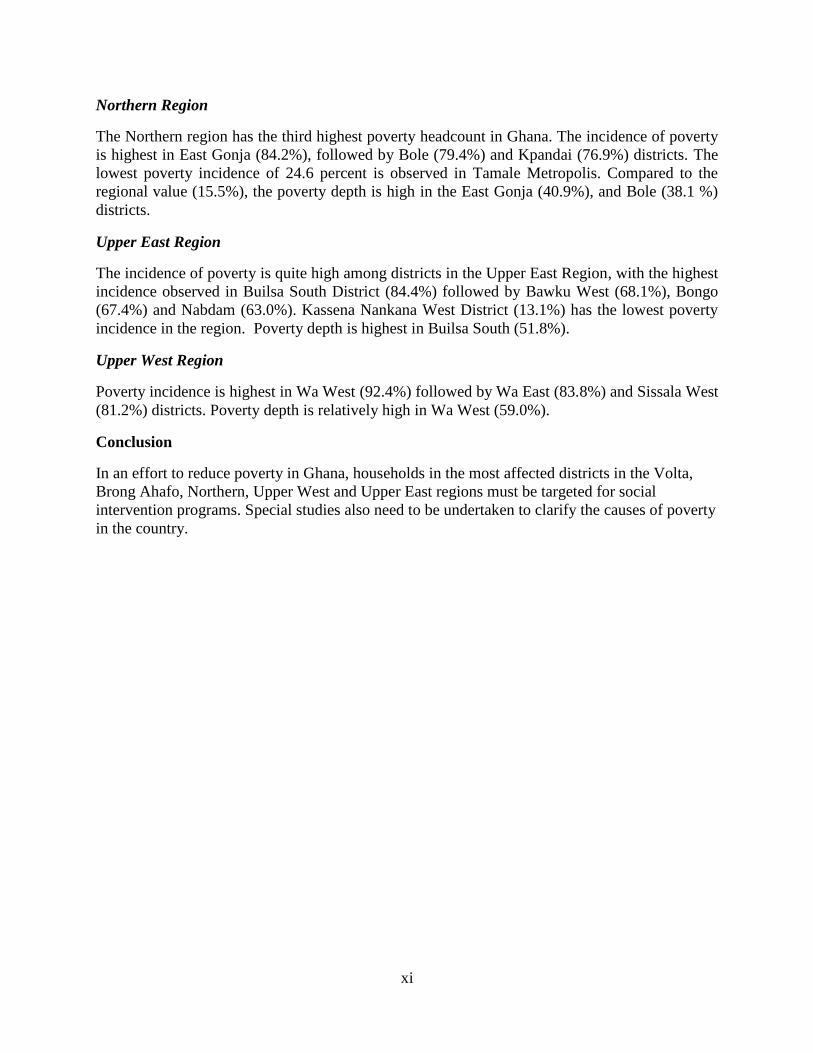
Northern Region
The Northern region has the third highest poverty headcount in Ghana. The incidence of poverty
is highest in East Gonja (84.2%), followed by Bole (79.4%) and Kpandai (76.9%) districts. The
lowest poverty incidence of 24.6 percent is observed in Tamale Metropolis. Compared to the
regional value (15.5%), the poverty depth is high in the East Gonja (40.9%), and Bole (38.1 %)
districts.
Upper East Region
The incidence of poverty is quite high among districts in the Upper East Region, with the highest
incidence observed in Builsa South District (84.4%) followed by Bawku West (68.1%), Bongo
(67.4%) and Nabdam (63.0%). Kassena Nankana West District (13.1%) has the lowest poverty
incidence in the region. Poverty depth is highest in Builsa South (51.8%).
Upper West Region
Poverty incidence is highest in Wa West (92.4%) followed by Wa East (83.8%) and Sissala West
(81.2%) districts. Poverty depth is relatively high in Wa West (59.0%).
Conclusion
In an effort to reduce poverty in Ghana, households in the most affected districts in the Volta,
Brong Ahafo, Northern, Upper West and Upper East regions must be targeted for social
intervention programs. Special studies also need to be undertaken to clarify the causes of poverty
in the country.
1
CHAPTER ONE
INTRODUCTION
The paucity of data on welfare indicators at the district level has been a challenge in the
design, monitoring and evaluation of economic and social programs in Ghana. Although the
2010 Population and Housing Census (2010 PHC) conducted by the Ghana Statistical Service
(GSS) provides comprehensive information on the demographic and socio-economic
characteristics of households and individuals, it does not have the required information for
constructing consumption or income aggregates.
The sixth round of the Ghana Living Standards Survey (GLSS6), conducted during the period
October 2012 to October 2013, produced detailed information on consumption expenditure
which makes it possible to construct reliable consumption-based welfare measures at the
national and regional levels. The GLSS6 was a nationally representative sample survey of
18,000 households, of which 16,772 households were successfully interviewed.
The design of the survey does not allow the estimation of welfare measures at the district and
other lower levels of disaggregation. However, a methodology developed by C. Elbers, J.
Lanjouw and P. Lanjouw (2002) allows accurate estimates of consumption-based poverty and
inequality at lower levels of disaggregation by combining information from censuses and
household consumption surveys.
This methodology involves selecting a set of common and comparable variables in the census
and the survey. The selected variables are then used to estimate a regression model of per
capita consumption based on the survey data. The set of parameter estimates obtained from
the consumption model is applied to similar variables in the census to obtain the predicted per
capita consumption for each census household, which are then used to prepare poverty maps.
A poverty map is a spatial representation and analysis of welfare indicators. In 2005, the first
poverty map was produced by the Ghana Statistical Service from the 1998/1999 Ghana
Living Standards Survey and the 2000 Population and Housing Census. This report is the
second in the series of poverty maps produced in Ghana.
The main objective of this second poverty mapping report is to produce welfare estimates for
the 216 districts and 29 sub-districts in Ghana to inform policies and programmes. The
districts and sub-districts are the lowest levels of administration and decision-making under
the decentralised local government system in the country.
Welfare estimates for the regions based on the census are also provided to enable
comparisons with those obtained directly from the GLSS6. It must be noted that the
estimation was done separately for each region using different sets of common variables.
Fitting different models for each region allows a flexible relationship between per capita
expenditure (the dependent variable) and the selected variables, which leads to better
predictions.
The report consists of four chapters. Chapter one covers the introduction; Chapter two
describes in detail the methodology and sources of data; Chapter three presents the results of
the poverty and inequality estimates for districts and sub-districts and Chapter four provides
some conclusions and recommendations.
2
CHAPTER TWO
METHODOLOGY
This chapter describes in detail the Small Area Estimation (SAE) methodology and sources
of data used for poverty mapping at the district and sub-district levels. This method allows
the imputation of consumption expenditure for census households based on a model
estimated from the household survey by applying the estimated coefficients of the model to
the same variables from the census data. In constructing the consumption model, the
explanatory variables (household and individual characteristics) must exist in both the census
and the survey data. Poverty and inequality statistics for districts and sub-districts are then
calculated with the imputed consumption estimates of census households. The method does
not only estimate poverty indices but also their corresponding standard errors.
The SAE methodology involves three major steps. The first step is to select a set of variables
that are common to a census and a household expenditure survey. The subset of variables that
are found to match (contain the same information) between the census and the survey is used
to estimate a regression model of per capita consumption using the survey data.
At the second step, the set of parameter estimates obtained from the regression model is
applied to the same set of variables identified in the census data to obtain predicted per capita
consumption for each census household.
Finally, based on the estimated level of per capita consumption, estimates of poverty,
inequality and other welfare measures, as well as their standard errors, are calculated for any
geographical unit with sufficient number of households to obtain reliable estimates.
Data sources
Ghana is divided into 10 administrative regions. There are 2161 districts, five of which are
metropolitan. These five metropolitan districts are further divided into 29 sub metropolitan
districts. The country is also divided into three ecological zones namely coastal, forest and
savannah. Some regions (Western, Brong Ahafo and Volta) cut across two ecological zones.
This report is based on data from the sixth round of the Ghana Living Standards Survey
(GLSS6, 2012-2013) and 2010 Population and Housing Census (2010 PHC).
The GLSS6 is an integrated household survey covering topics such as household
consumption and expenditure, education, employment, housing conditions, the operation of
non-farm household enterprises, agricultural activities, assets and agricultural production
expenditures.
As in all probability sample surveys, it is important that each sampling unit in the target
population has a known, non-zero probability of being included in the sample. To achieve
this, an appropriate list or sampling frame of the Primary Sampling Unit (PSU) is required.
The list of standardized census EAs - together with their respective population and household
1 At the time of the 2010 PHC, there were 170 districts. Later 46 additional districts were created out of the
existing districts. The affected districts were re-demarcated and the census data was realigned to reflect the
current 216 districts.
3
sizes - from the 2010 Population and Housing Census (PHC) was used as the sampling frame
for the GLSS6.
To enhance the precision and reliability of the survey results, the EAs were first stratified into
10 main domains according to the ten administrative regions in Ghana. Within each region,
the EAs were further stratified into rural and urban categories, bringing the total number of
substrata to 20. A random sample of 1200 EAs was then selected according to probability
proportional to population size to form the PSUs.
A complete listing of households in the selected PSUs was undertaken to form the Secondary
Sampling Units (SSUs). Subsequently, 15 households from each PSU were selected
systematically, yielding a total sample size of 18,000 households nationwide.
The unit of measurement for the GLSS6 was the population living within individual households.
The institutional population (those who were in schools, hospitals, etc.), which represents a very
small percentage (2.36%) of the 2010 population, was excluded from the frame because they do
not form households.
Weights were computed to reflect the different probabilities of selection in order to obtain the
true contribution of each selected EA in the sample based on the first and second stage
probabilities of selection. The survey successfully interviewed 16,772 households (93% response
rate) and 71,523 individuals.
The results from the GLSS6 show wide disparities in the level of poverty among regions in
the coastal, forest and savannah zones. The dynamics of poverty in Ghana indicate that
poverty is still very much a rural phenomenon and more prominent in rural savannah.
The 2010 PHC collected information on demographic, social, economic and housing
characteristics of the population. The census enumerated 24,658,823 individuals and
5,467,136 households. However, 24,075,944 individuals in 5,467,054 households in
occupied dwelling units were included in the analysis.
Common and comparable variables
Questions from the 2010 PHC and GLSS6 instruments were compared to obtain “candidate”
variables. These variables are those for which the questions were worded the same way in the
survey and the census, including the response options (See Appendix Table A3.1).
Correlates of household welfare (dependency ratio, household size, age of head, proportion of
males in household, highest level of schooling completed, labor market status of head, etc.)
were constructed from the matched variables from both data sources. The data from the
survey was weighted to be nationally representative before the means of the correlates were
compared. Only those variables whose census mean fell within the 95 percent confidence
interval of the survey mean were included in the regression model. Since the survey and
census years did not coincide, the means of some correlates were not statistically equivalent.
Mapping methodology was applied based on the assumption that the estimated relationship
between household welfare and the correlates do not change over time. This assumption is
reasonable given that the census and the survey were conducted within 2-3 years interval.
Some variables were aggregated to the cluster, district and regional levels to reduce intra-
cluster correlation by capturing variations in household welfare as a result of common cluster
level characteristics and location effects. Adding area means helped to explain location
effects and has been shown to improve estimates markedly (Elbers et al., 2002).
4
Modelling and Projection
The model and analysis in this report are done separately for each of the ten regions to
appreciate the effect of spatial correlation between consumption expenditure and the selected
variables within each region. As discussed in the methodology, the second step of SAE is
fitting a relationship between the expenditure and the selected variables. Initially, one model
was estimated for the entire country. Although the national level prediction was quite
accurate, the regional predictions were poor due to disparities in consumption pattern and the
inability of the national model to capture the heterogeneous relationship between the
variables across regions. As a result, separate models were estimated for each region to allow
a flexible relationship. The regional models gave accurate regional level results and led to the
reduction of standard errors associated with the poverty estimates as discussed in chapter
three. Only those variables that were statistically significant at the 5 percent level were used
for prediction.
Ghana’s decentralised administrative system
Ghana is practicing a decentralised system of administration under the local government
system as contained in the 1992 constitution (Local Government Act 1993). This makes the
district assemblies the highest decision making body at the metropolitan, municipal and
district levels. The 216 Metropolitan, Municipal and District Assemblies (MMDAs) prepare
their annual plans and program of activities to fit into the national development framework;
the Ghana Shared Growth and Development Agenda (GSGDA I and II) prepared by the
National Development Planning Commission (NDPC). Data and information are needed by
the district assemblies to inform the preparation of these plans, including the implementation
of programmes towards government efforts at reducing poverty among the vulnerable
population. The preparation of a poverty map at the district level would, therefore, be
necessary to inform the assemblies in the development of their plans and programmes.
Small area estimation
Household surveys that include reasonable measures of income or consumption can be used
to calculate distributional measures. However, at low levels of aggregation, these samples are
rarely representative or of sufficient size to yield statistically reliable estimates. At the same
time, census (or other large sample) data of sufficient size that allow disaggregation at lower
levels either have no information about income or consumption, or measure these variables
poorly. The SAE procedure combines these types of data to take advantage of the detail in
household sample surveys and the comprehensive coverage of census. This report applies the
small area estimation method developed by Elbers, Lanjouw and Lanjouw (ELL; 2002,
2003).
The observed household consumption in the survey is regressed on selected common
variables as
𝒍𝒏(𝒚𝒄𝒉) = 𝑿𝒄𝒉𝜷 + Ω𝒄𝒉 (𝟏)
where ych is the per capita consumption expenditure of household h in sample cluster c,
ln(ych) is the natural log of per capita consumption expenditure of household h in cluster c,
Xch is the vector of selected explanatory variables,
is the vector of regression coefficients, and
5
Ωch , is the vector of disturbances of household h in cluster c.
An initial estimate of in equation (1), obtained from Ordinary Least Squares (OLS)
estimation, gives estimated residuals which can be broken down into two components: a
cluster specific random effect and an uncorrelated household error term:
Ω𝑐ℎ = 𝑐 + 𝜀𝑐ℎ (2)
Where 𝑐 is the cluster-specific random effect, calculated by averaging the within-cluster
residuals and 𝜀𝑐ℎ is the household-specific error term estimated as the overall residual minus
the location component.
The expenditure of a household in the census is predicted as follows:
𝒍𝒏(𝒄𝒉) = 𝑿𝒄𝒉 𝑻 𝜷 + 𝒄 + 𝒄𝒉 (3)
Where ,𝒄 and 𝒄𝒉 are the estimates for , 𝜂𝑐 and 𝜀𝑐ℎ respectively. The point
estimates and standard errors of the welfare indicators are calculated by Monte-Carlo
simulations. In each simulation, a set of values for ,𝒄 , and 𝒄𝒉 are drawn from their
estimated distributions, and an estimate of consumption expenditure and poverty rates are
obtained.
The original ELL method also draws location errors 𝜂𝑐 from their estimated unconditional
distributions. For those target population for which sampled data happen to be available, this
approach does not make optimal use of available information. An approach proposed by
Molina and Rao (2010) combines the simulation-based approach with what is referred to as
Empirical Best, which uses the observed distribution of location error in the sampled data.
With the adjustment that the distribution functions of the errors are estimated non-
parametrically, this approach has been implemented in the PovMap software.
For all ten regional models, and in each simulation, 𝒍𝒏(𝒄𝒉) is trimmed at the observed
minimum and maximum values in the survey. Subsequently, the average point estimate and
standard deviation of 100 simulations of equation (3) is calculated. Finally, predicted
expenditure and poverty estimates for all households in the census were aggregated to
regional and district level estimates. For the calculation of poverty indices, a poverty line of
1,314.00 Ghana Cedis per person per year was used.
6
CHAPTER THREE
POVERTY AND INEQUALITY ESTIMATES
Poverty analysis in Ghana has over the years been based on national and regional level
indicators that are comparable over time. The broad trends that are identified using aggregate
information are useful for monitoring and evaluating the overall performance of poverty
reduction programmes in the country. However, for many policy and research applications,
the information that can be extracted from aggregate indicators is not sufficient, since they do
not reveal significant local variations in living conditions within the country. The detailed
poverty maps for small administrative areas that are the ultimate output of this report provide
information to help address this shortcoming of aggregate poverty analysis. This chapter
provides the poverty and inequality maps at the district level for each of the ten
administrative regions.
The welfare measures presented are the ones commonly known as the Foster-Greer-Thorbeck
(FGT) family of poverty measures. The poverty headcount (P0) is the proportion of
population living below the national poverty line. Depth of poverty (P1), also known as the
poverty gap, is a measure of how far the poor are from the poverty line, and severity of
poverty (P2) is the square of the poverty gap which gives greater attention to the needs of the
poorest. It takes account of the distribution of poverty among the poor, giving greater weight
to the poorest of the poor. The Gini coefficient, a measure of welfare distribution, is used to
measure inequality. Tables presenting the detailed results are found in Appendix 1. The
standard errors of these estimates are also provided as a measure of their level of precision.
How reliable are the poverty estimates?
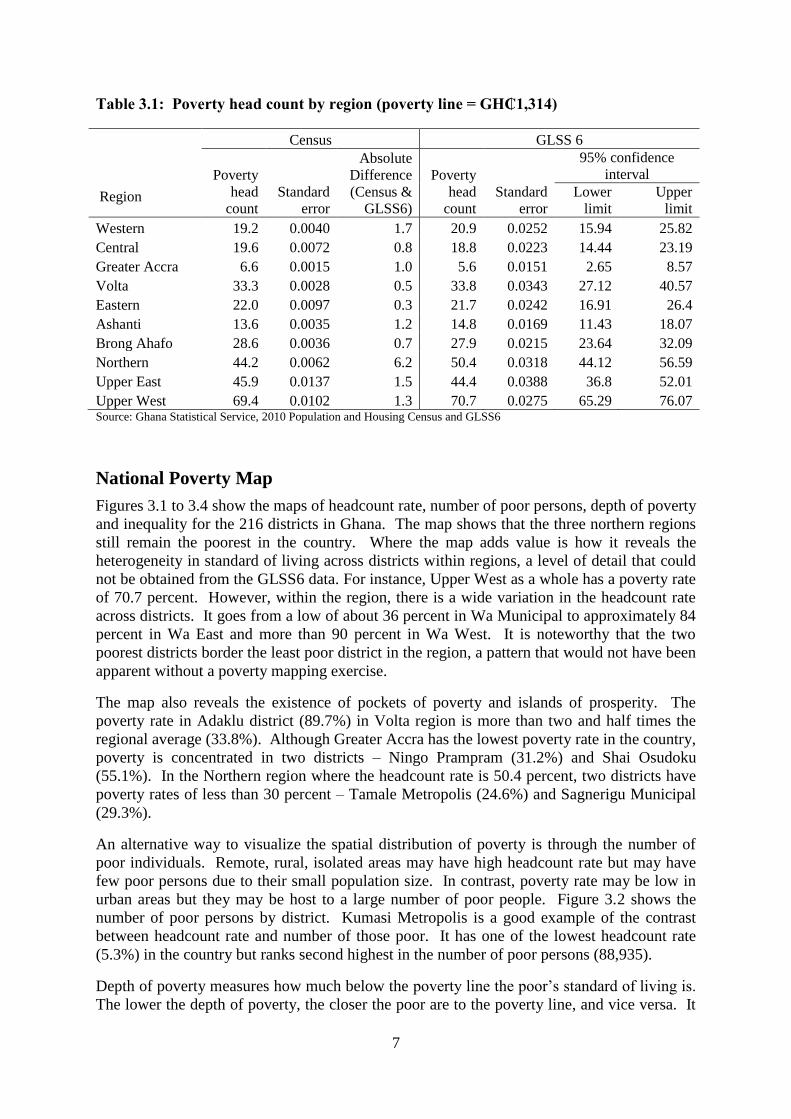
The performance of our models is tested by comparing the poverty prediction with the survey
estimates at the regional level. This comparison is feasible because while the census estimates
are obtained at all levels, GLSS6 is representative at the regional level. As shown in Table 3.1,
predictions of poverty headcount for all the regions fall within 95 percent confidence interval
of the survey means. While this is a common criterion to judge the reliability of the models,
our predictions attained a higher degree of accuracy as the absolute difference between the
survey estimates and census projections are often very small. This robustness check provides a
reasonable level of confidence about the district level predictions of headcount rate and other
measures.
With the exception of the Northern Region where there is an appreciable difference between the
poverty headcount estimated from the GLSS6 and the 2010 PHC (poverty headcount of 50.4%
in GLSS6 and 44.2% in the census), regional poverty headcount from the survey and the census
are quite close (Table 3.1).
7
Table 3.1: Poverty head count by region (poverty line = GH₵1,314)
Source: Ghana Statistical Service, 2010 Population and Housing Census and GLSS6
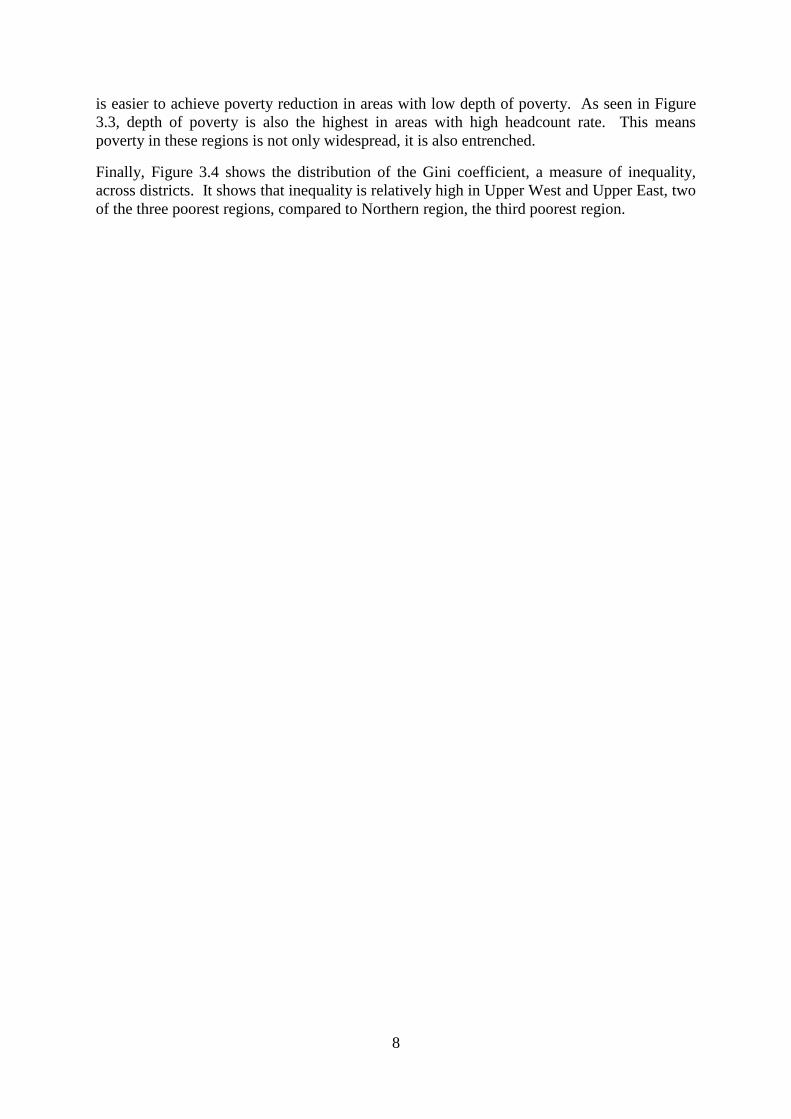
National Poverty Map
Figures 3.1 to 3.4 show the maps of headcount rate, number of poor persons, depth of poverty
and inequality for the 216 districts in Ghana. The map shows that the three northern regions
still remain the poorest in the country. Where the map adds value is how it reveals the
heterogeneity in standard of living across districts within regions, a level of detail that could
not be obtained from the GLSS6 data. For instance, Upper West as a whole has a poverty rate
of 70.7 percent. However, within the region, there is a wide variation in the headcount rate
across districts. It goes from a low of about 36 percent in Wa Municipal to approximately 84
percent in Wa East and more than 90 percent in Wa West. It is noteworthy that the two
poorest districts border the least poor district in the region, a pattern that would not have been
apparent without a poverty mapping exercise.
The map also reveals the existence of pockets of poverty and islands of prosperity. The
poverty rate in Adaklu district (89.7%) in Volta region is more than two and half times the
regional average (33.8%). Although Greater Accra has the lowest poverty rate in the country,
poverty is concentrated in two districts – Ningo Prampram (31.2%) and Shai Osudoku
(55.1%). In the Northern region where the headcount rate is 50.4 percent, two districts have
poverty rates of less than 30 percent – Tamale Metropolis (24.6%) and Sagnerigu Municipal
(29.3%).
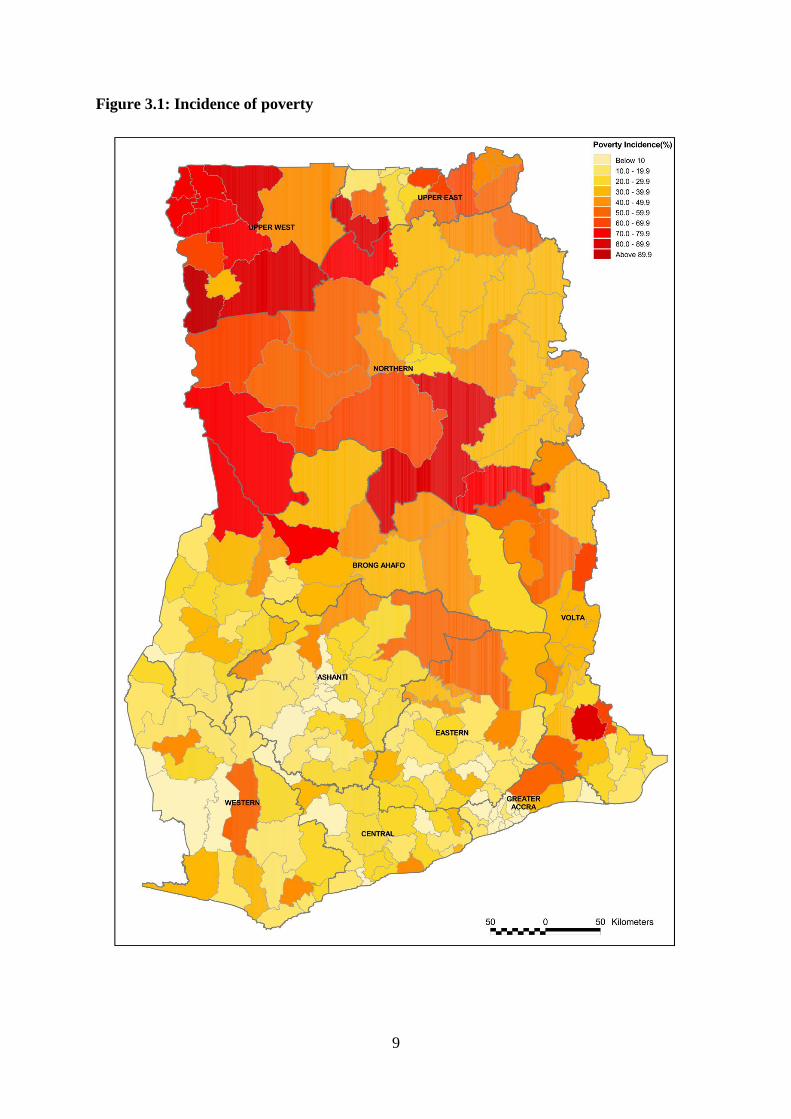
An alternative way to visualize the spatial distribution of poverty is through the number of
poor individuals. Remote, rural, isolated areas may have high headcount rate but may have
few poor persons due to their small population size. In contrast, poverty rate may be low in
urban areas but they may be host to a large number of poor people. Figure 3.2 shows the
number of poor persons by district. Kumasi Metropolis is a good example of the contrast
between headcount rate and number of those poor. It has one of the lowest headcount rate
(5.3%) in the country but ranks second highest in the number of poor persons (88,935).
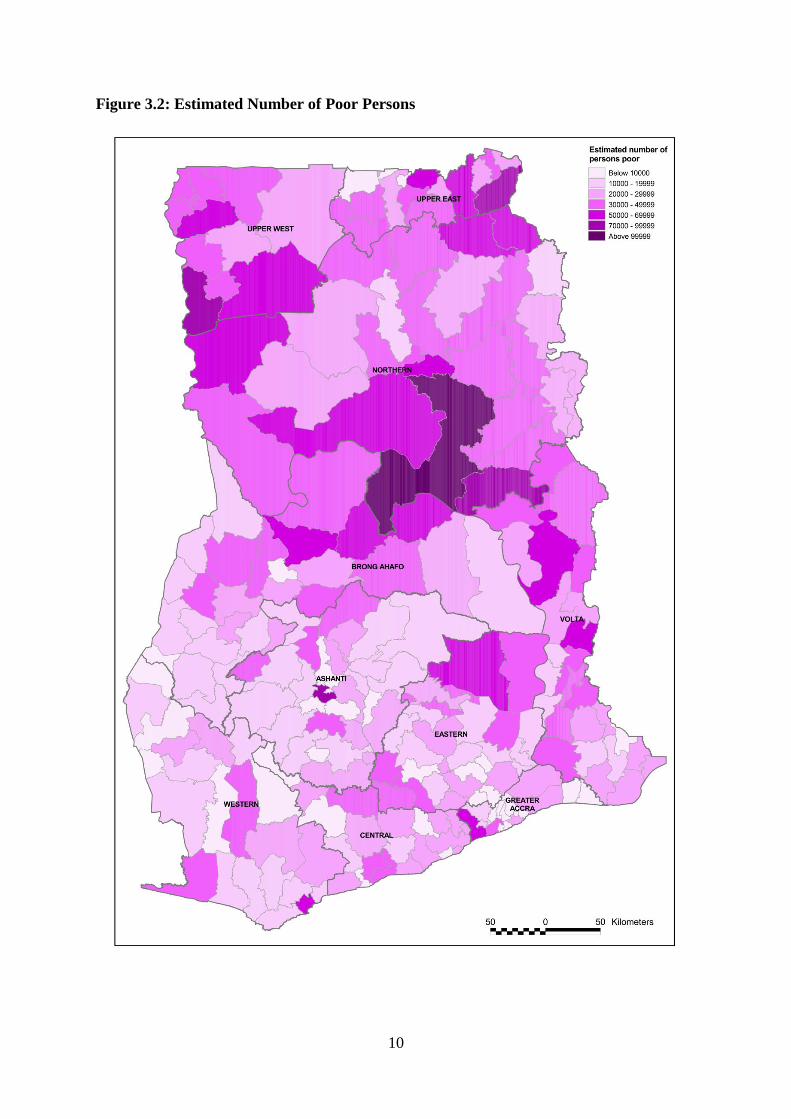
Depth of poverty measures how much below the poverty line the poor’s standard of living is.
The lower the depth of poverty, the closer the poor are to the poverty line, and vice versa. It
Region
Census GLSS 6
Poverty
head
count
Standard
error
Absolute
Difference
(Census &
GLSS6)
Poverty
head
count
Standard
error
95% confidence
interval
Lower
limit
Upper
limit
Western 19.2 0.0040 1.7 20.9 0.0252 15.94 25.82
Central 19.6 0.0072 0.8 18.8 0.0223 14.44 23.19
Greater Accra 6.6 0.0015 1.0 5.6 0.0151 2.65 8.57
Volta 33.3 0.0028 0.5 33.8 0.0343 27.12 40.57
Eastern 22.0 0.0097 0.3 21.7 0.0242 16.91 26.4
Ashanti 13.6 0.0035 1.2 14.8 0.0169 11.43 18.07
Brong Ahafo 28.6 0.0036 0.7 27.9 0.0215 23.64 32.09
Northern 44.2 0.0062 6.2 50.4 0.0318 44.12 56.59
Upper East 45.9 0.0137 1.5 44.4 0.0388 36.8 52.01
Upper West 69.4 0.0102 1.3 70.7 0.0275 65.29 76.07
8
is easier to achieve poverty reduction in areas with low depth of poverty. As seen in Figure
3.3, depth of poverty is also the highest in areas with high headcount rate. This means
poverty in these regions is not only widespread, it is also entrenched.
Finally, Figure 3.4 shows the distribution of the Gini coefficient, a measure of inequality,
across districts. It shows that inequality is relatively high in Upper West and Upper East, two
of the three poorest regions, compared to Northern region, the third poorest region.
9
Figure 3.1: Incidence of poverty
10
Figure 3.2: Estimated Number of Poor Persons
11
Figure 3.3: Depth of Poverty
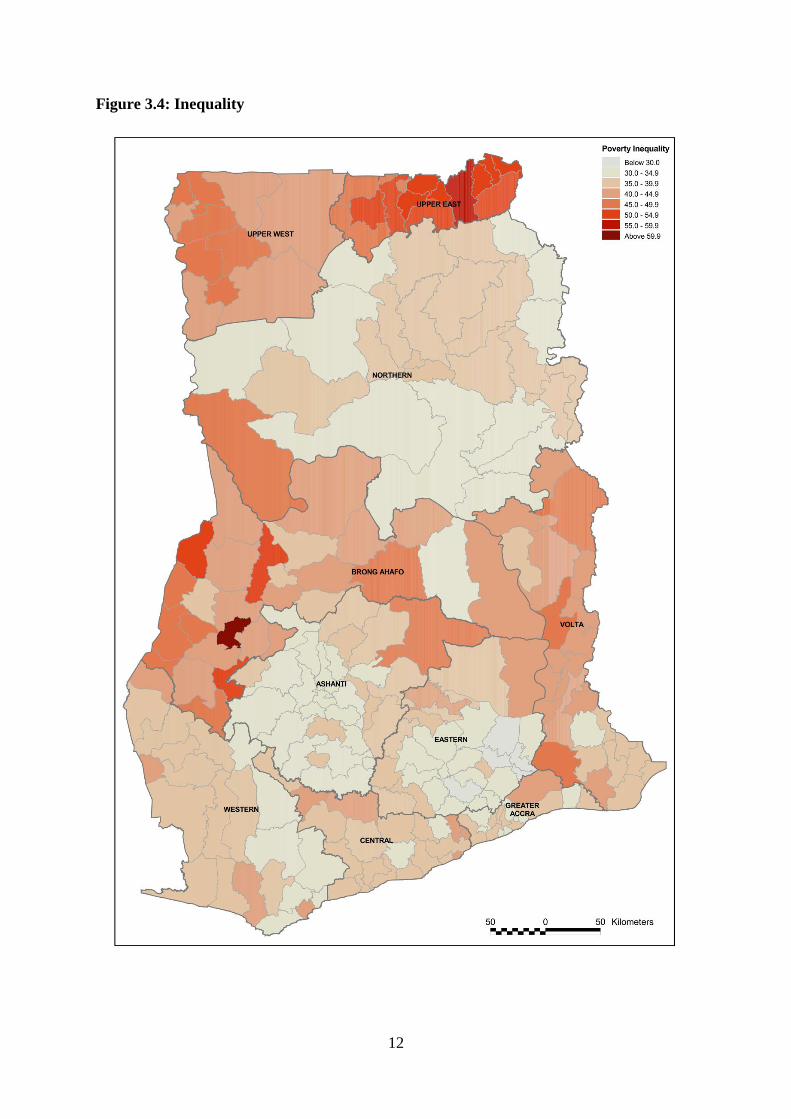
12
Figure 3.4: Inequality
13
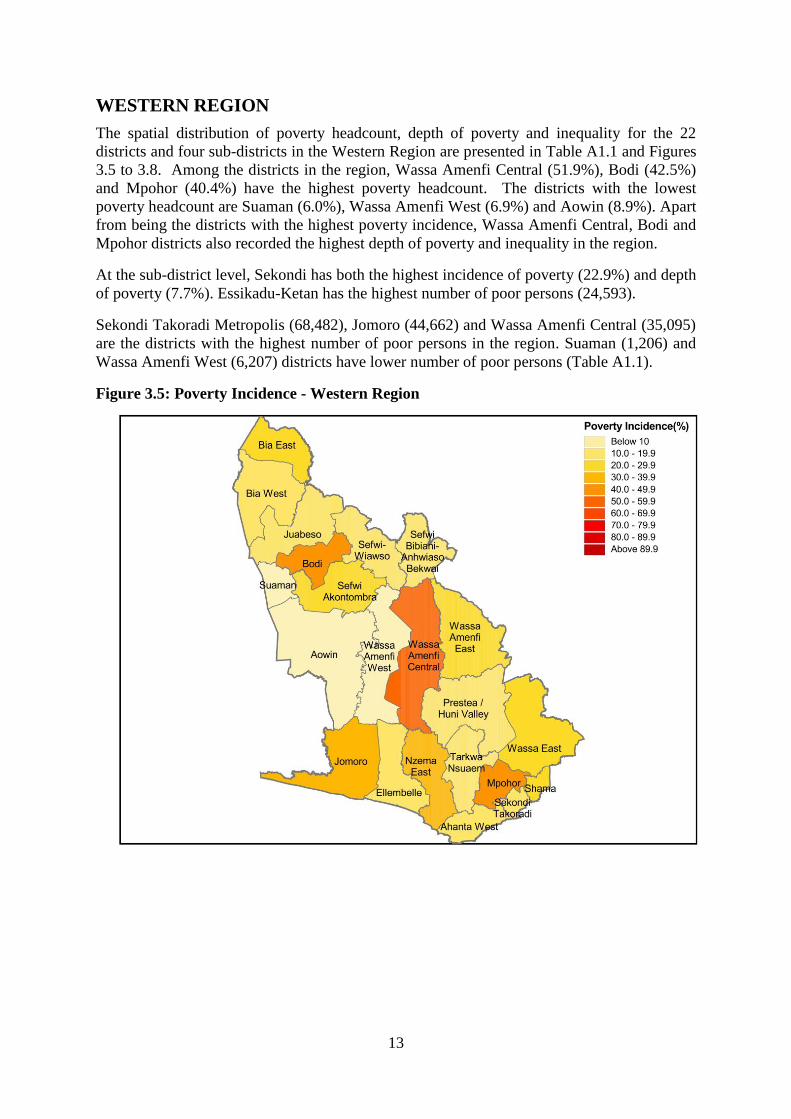
WESTERN REGION
The spatial distribution of poverty headcount, depth of poverty and inequality for the 22
districts and four sub-districts in the Western Region are presented in Table A1.1 and Figures
3.5 to 3.8. Among the districts in the region, Wassa Amenfi Central (51.9%), Bodi (42.5%)
and Mpohor (40.4%) have the highest poverty headcount. The districts with the lowest
poverty headcount are Suaman (6.0%), Wassa Amenfi West (6.9%) and Aowin (8.9%). Apart
from being the districts with the highest poverty incidence, Wassa Amenfi Central, Bodi and
Mpohor districts also recorded the highest depth of poverty and inequality in the region.
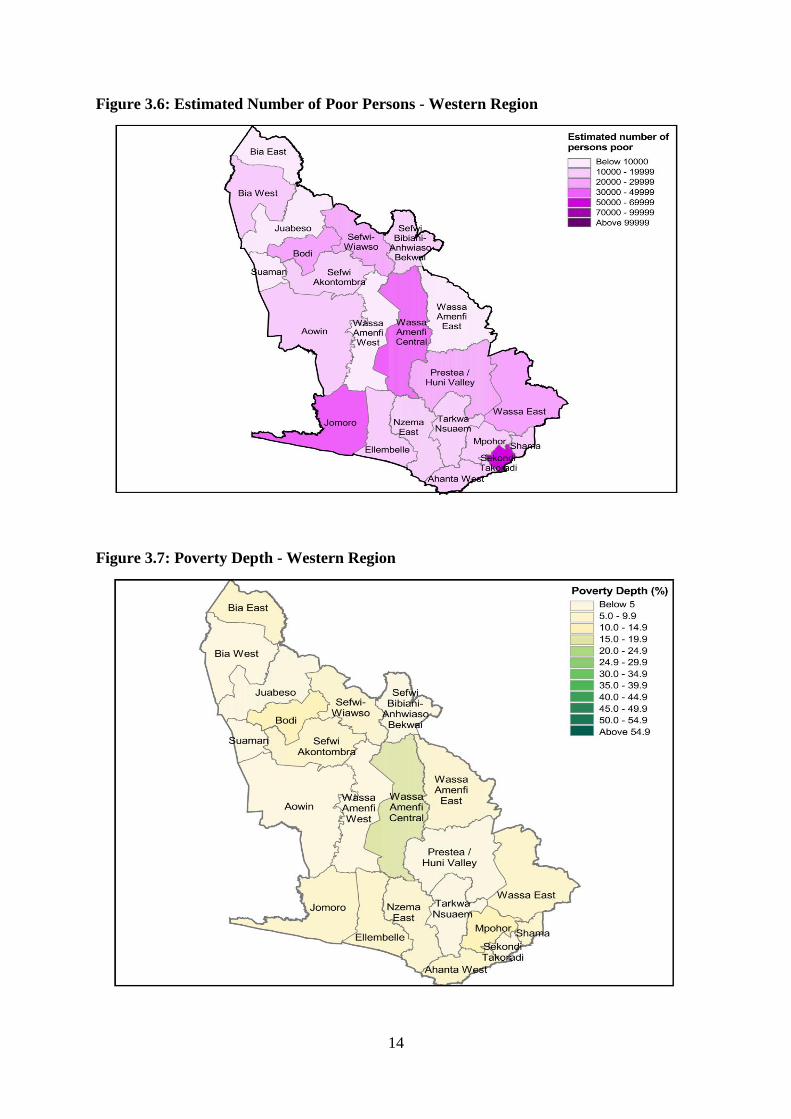
At the sub-district level, Sekondi has both the highest incidence of poverty (22.9%) and depth
of poverty (7.7%). Essikadu-Ketan has the highest number of poor persons (24,593).
Sekondi Takoradi Metropolis (68,482), Jomoro (44,662) and Wassa Amenfi Central (35,095)
are the districts with the highest number of poor persons in the region. Suaman (1,206) and
Wassa Amenfi West (6,207) districts have lower number of poor persons (Table A1.1).
Figure 3.5: Poverty Incidence - Western Region
14
Figure 3.6: Estimated Number of Poor Persons - Western Region
Figure 3.7: Poverty Depth - Western Region
15
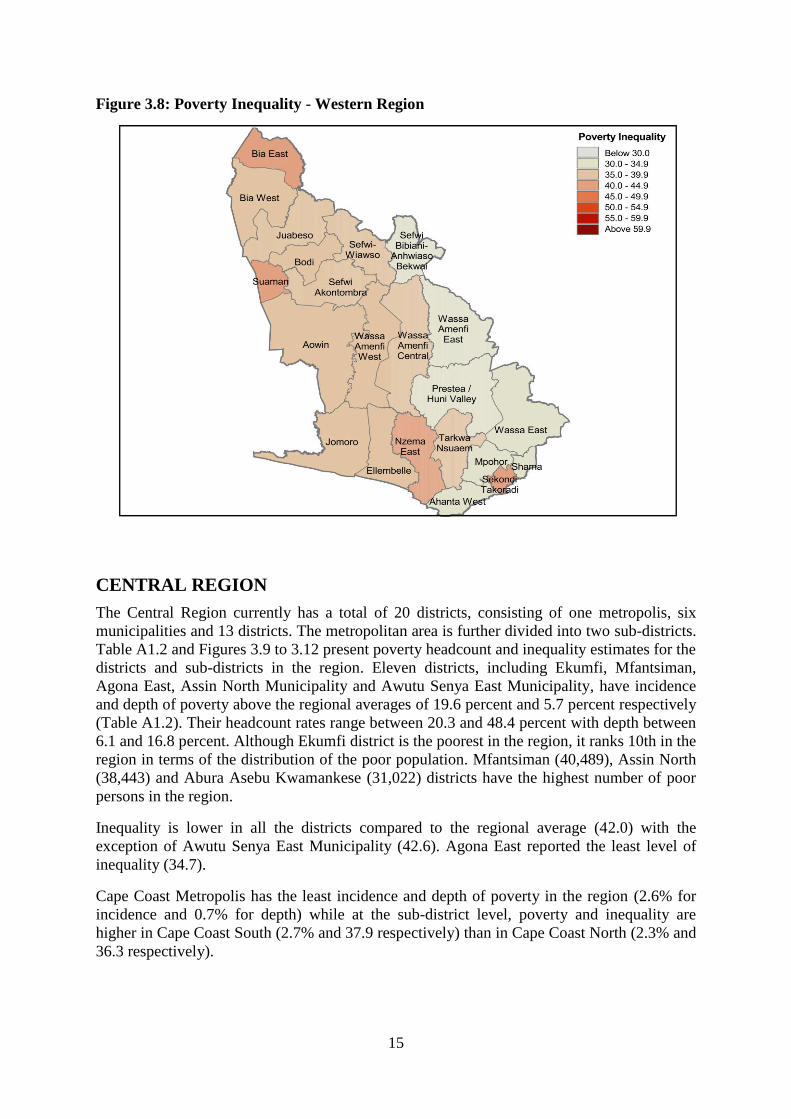
Figure 3.8: Poverty Inequality - Western Region
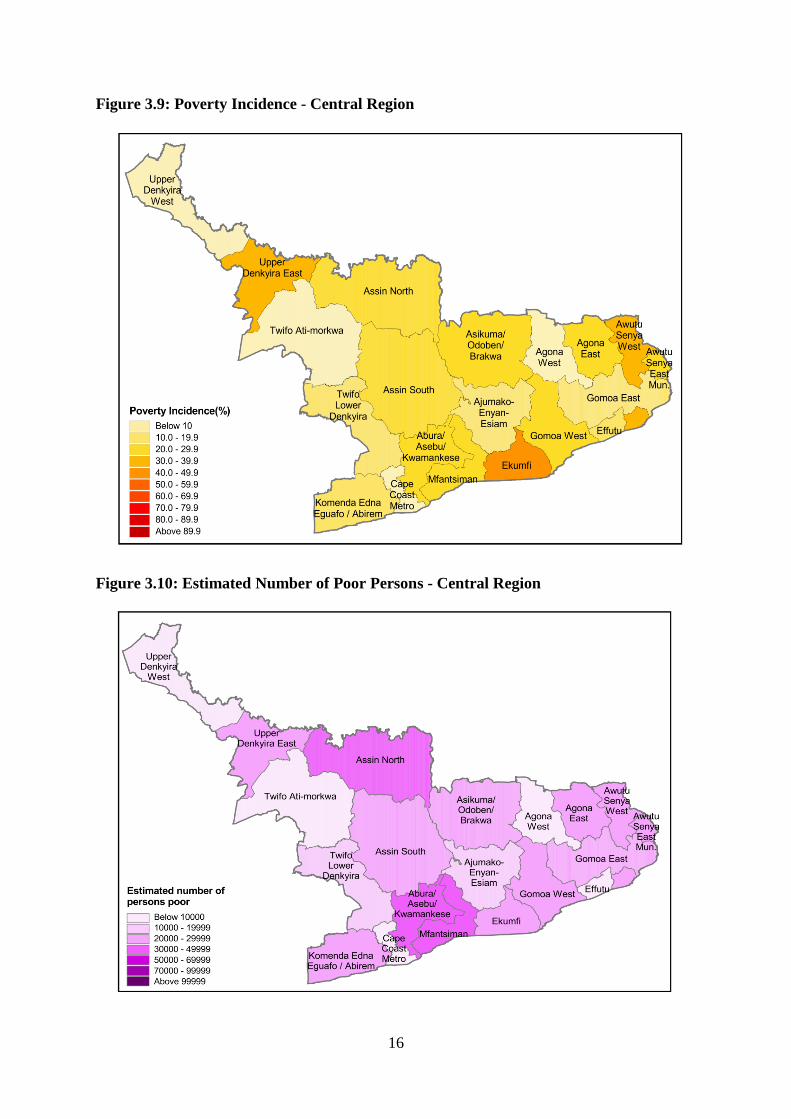
CENTRAL REGION
The Central Region currently has a total of 20 districts, consisting of one metropolis, six
municipalities and 13 districts. The metropolitan area is further divided into two sub-districts.
Table A1.2 and Figures 3.9 to 3.12 present poverty headcount and inequality estimates for the
districts and sub-districts in the region. Eleven districts, including Ekumfi, Mfantsiman,
Agona East, Assin North Municipality and Awutu Senya East Municipality, have incidence
and depth of poverty above the regional averages of 19.6 percent and 5.7 percent respectively
(Table A1.2). Their headcount rates range between 20.3 and 48.4 percent with depth between
6.1 and 16.8 percent. Although Ekumfi district is the poorest in the region, it ranks 10th in the
region in terms of the distribution of the poor population. Mfantsiman (40,489), Assin North
(38,443) and Abura Asebu Kwamankese (31,022) districts have the highest number of poor
persons in the region.
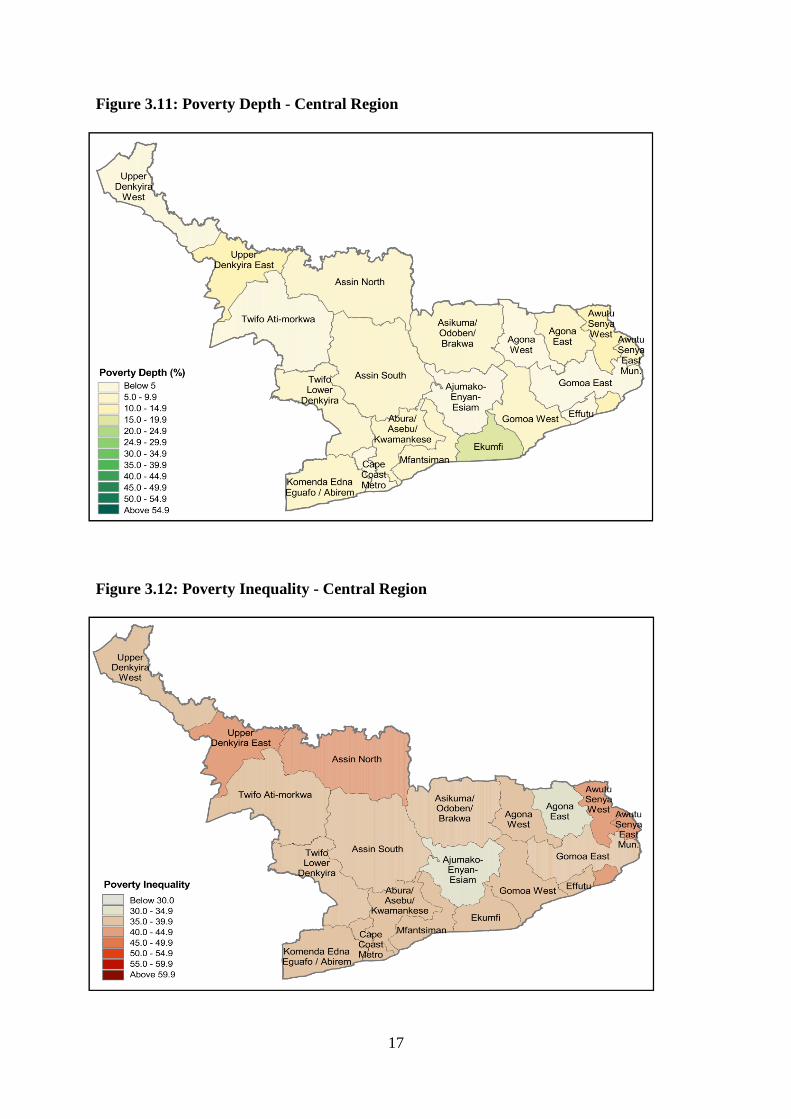
Inequality is lower in all the districts compared to the regional average (42.0) with the
exception of Awutu Senya East Municipality (42.6). Agona East reported the least level of
inequality (34.7).
Cape Coast Metropolis has the least incidence and depth of poverty in the region (2.6% for
incidence and 0.7% for depth) while at the sub-district level, poverty and inequality are
higher in Cape Coast South (2.7% and 37.9 respectively) than in Cape Coast North (2.3% and
36.3 respectively).
16
Figure 3.9: Poverty Incidence - Central Region
Figure 3.10: Estimated Number of Poor Persons - Central Region
17
Figure 3.11: Poverty Depth - Central Region
Figure 3.12: Poverty Inequality - Central Region
18
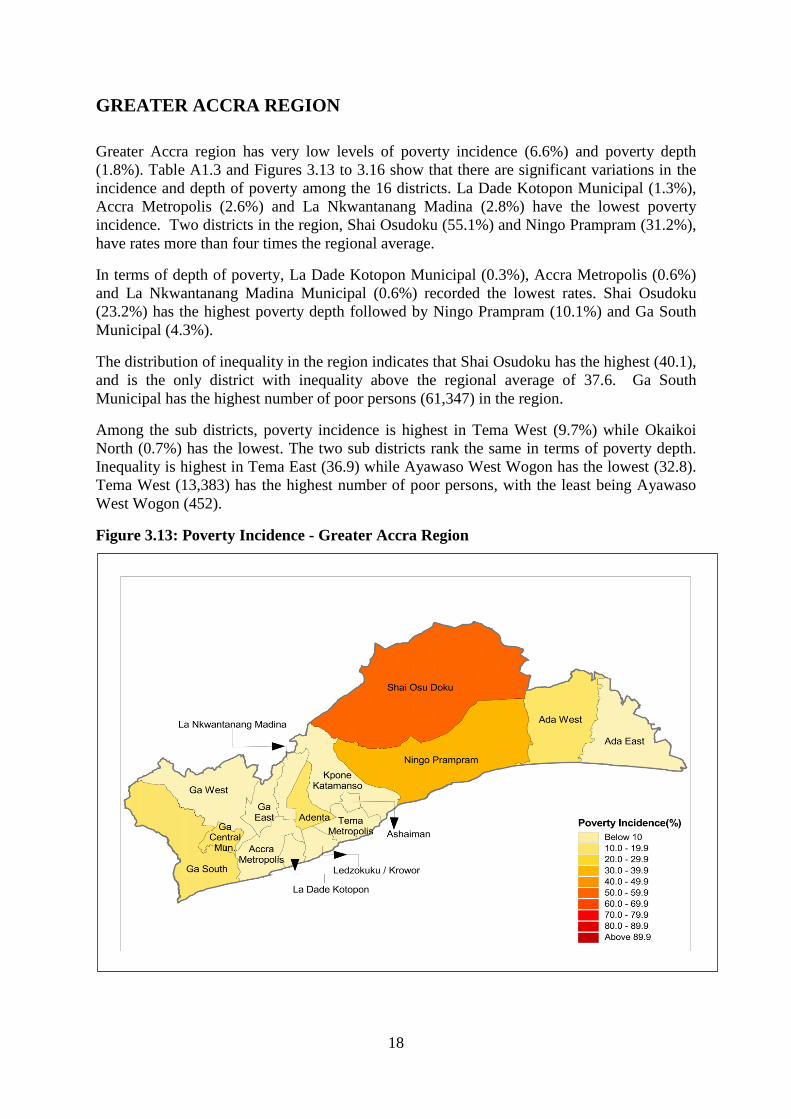
GREATER ACCRA REGION
Greater Accra region has very low levels of poverty incidence (6.6%) and poverty depth
(1.8%). Table A1.3 and Figures 3.13 to 3.16 show that there are significant variations in the
incidence and depth of poverty among the 16 districts. La Dade Kotopon Municipal (1.3%),
Accra Metropolis (2.6%) and La Nkwantanang Madina (2.8%) have the lowest poverty
incidence. Two districts in the region, Shai Osudoku (55.1%) and Ningo Prampram (31.2%),
have rates more than four times the regional average.
In terms of depth of poverty, La Dade Kotopon Municipal (0.3%), Accra Metropolis (0.6%)
and La Nkwantanang Madina Municipal (0.6%) recorded the lowest rates. Shai Osudoku
(23.2%) has the highest poverty depth followed by Ningo Prampram (10.1%) and Ga South
Municipal (4.3%).
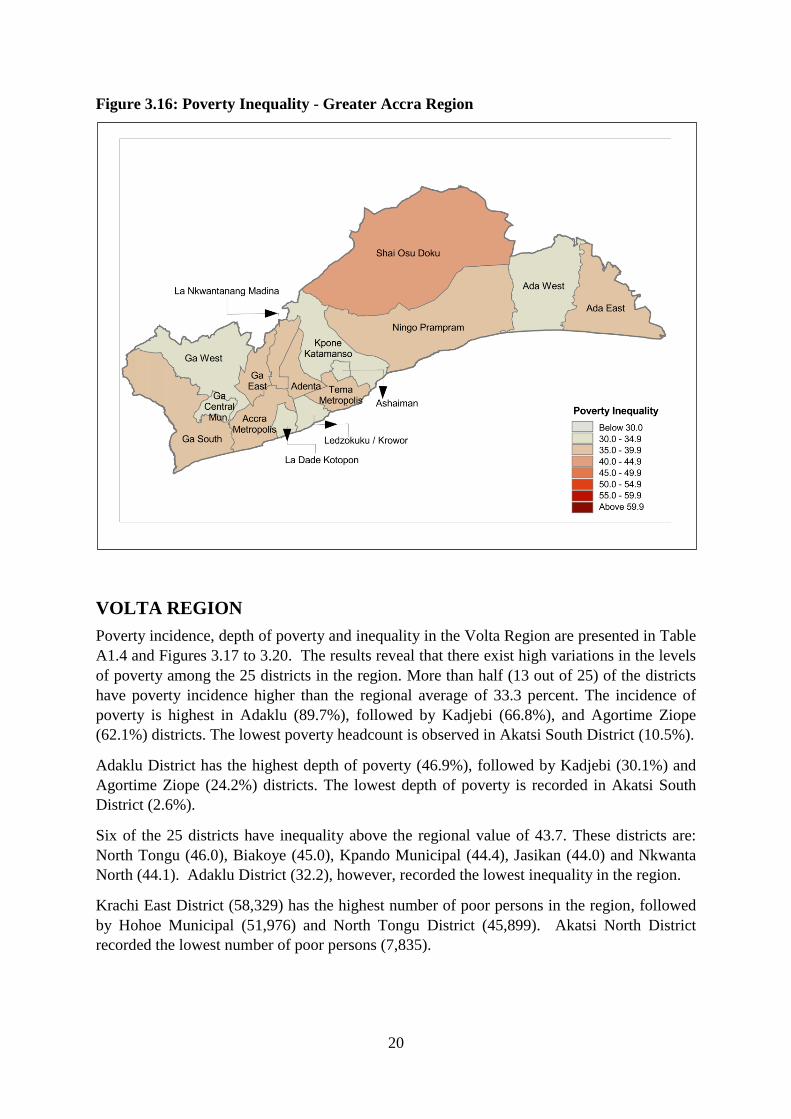
The distribution of inequality in the region indicates that Shai Osudoku has the highest (40.1),
and is the only district with inequality above the regional average of 37.6. Ga South
Municipal has the highest number of poor persons (61,347) in the region.
Among the sub districts, poverty incidence is highest in Tema West (9.7%) while Okaikoi
North (0.7%) has the lowest. The two sub districts rank the same in terms of poverty depth.
Inequality is highest in Tema East (36.9) while Ayawaso West Wogon has the lowest (32.8).
Tema West (13,383) has the highest number of poor persons, with the least being Ayawaso
West Wogon (452).
Figure 3.13: Poverty Incidence - Greater Accra Region

19
Figure 3.14: Estimated Number of Poor Persons - Greater Accra Region
Figure 3.15: Poverty Depth – Greater Accra Region
20
Figure 3.16: Poverty Inequality - Greater Accra Region
VOLTA REGION
Poverty incidence, depth of poverty and inequality in the Volta Region are presented in Table
A1.4 and Figures 3.17 to 3.20. The results reveal that there exist high variations in the levels
of poverty among the 25 districts in the region. More than half (13 out of 25) of the districts
have poverty incidence higher than the regional average of 33.3 percent. The incidence of
poverty is highest in Adaklu (89.7%), followed by Kadjebi (66.8%), and Agortime Ziope
(62.1%) districts. The lowest poverty headcount is observed in Akatsi South District (10.5%).
Adaklu District has the highest depth of poverty (46.9%), followed by Kadjebi (30.1%) and
Agortime Ziope (24.2%) districts. The lowest depth of poverty is recorded in Akatsi South
District (2.6%).
Six of the 25 districts have inequality above the regional value of 43.7. These districts are:
North Tongu (46.0), Biakoye (45.0), Kpando Municipal (44.4), Jasikan (44.0) and Nkwanta
North (44.1). Adaklu District (32.2), however, recorded the lowest inequality in the region.
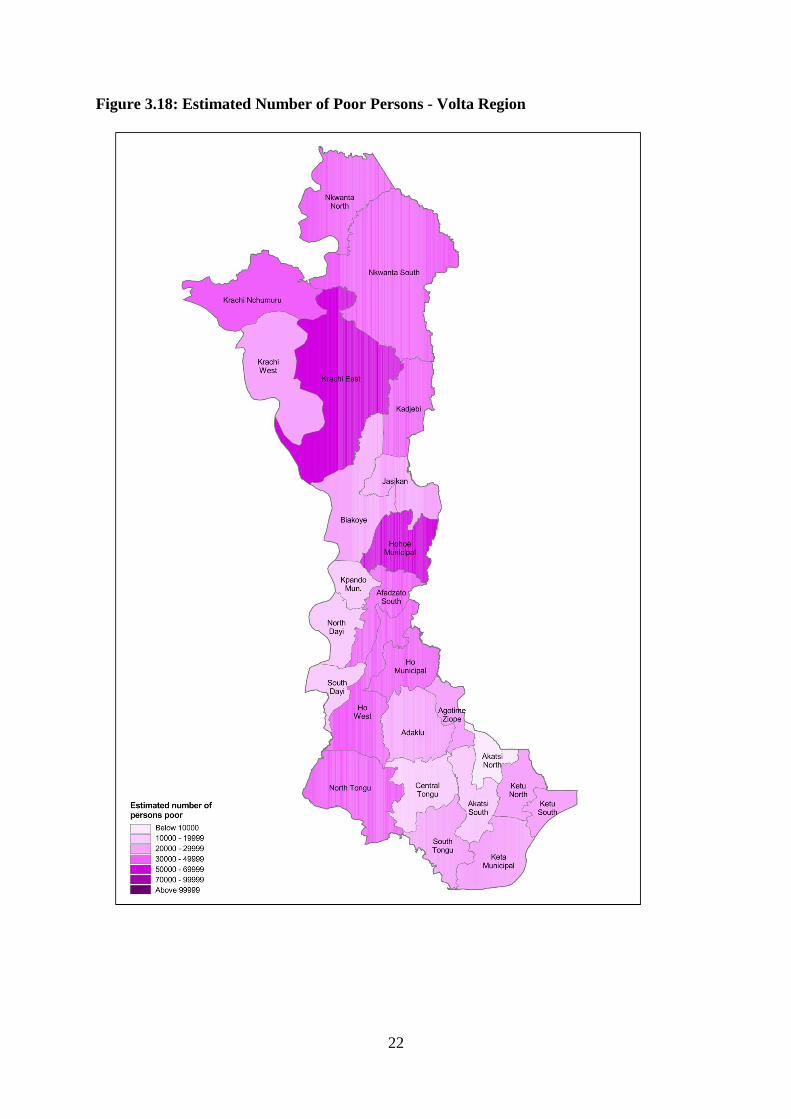
Krachi East District (58,329) has the highest number of poor persons in the region, followed
by Hohoe Municipal (51,976) and North Tongu District (45,899). Akatsi North District
recorded the lowest number of poor persons (7,835).
21
Figure 3.17: Poverty Incidence - Volta Region
22
Figure 3.18: Estimated Number of Poor Persons - Volta Region
23
Figure 3.19: Poverty Depth – Volta Region
24
Figure 3.20: Poverty Inequality - Volta Region
25
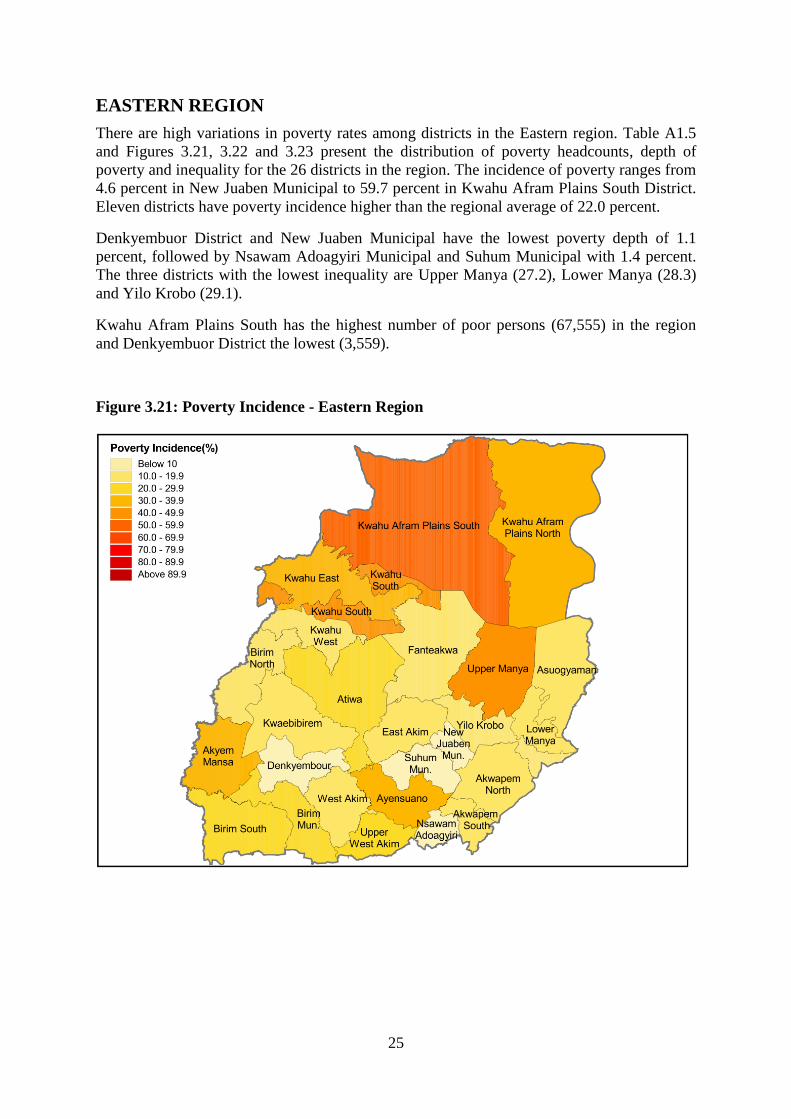
EASTERN REGION
There are high variations in poverty rates among districts in the Eastern region. Table A1.5
and Figures 3.21, 3.22 and 3.23 present the distribution of poverty headcounts, depth of
poverty and inequality for the 26 districts in the region. The incidence of poverty ranges from
4.6 percent in New Juaben Municipal to 59.7 percent in Kwahu Afram Plains South District.
Eleven districts have poverty incidence higher than the regional average of 22.0 percent.
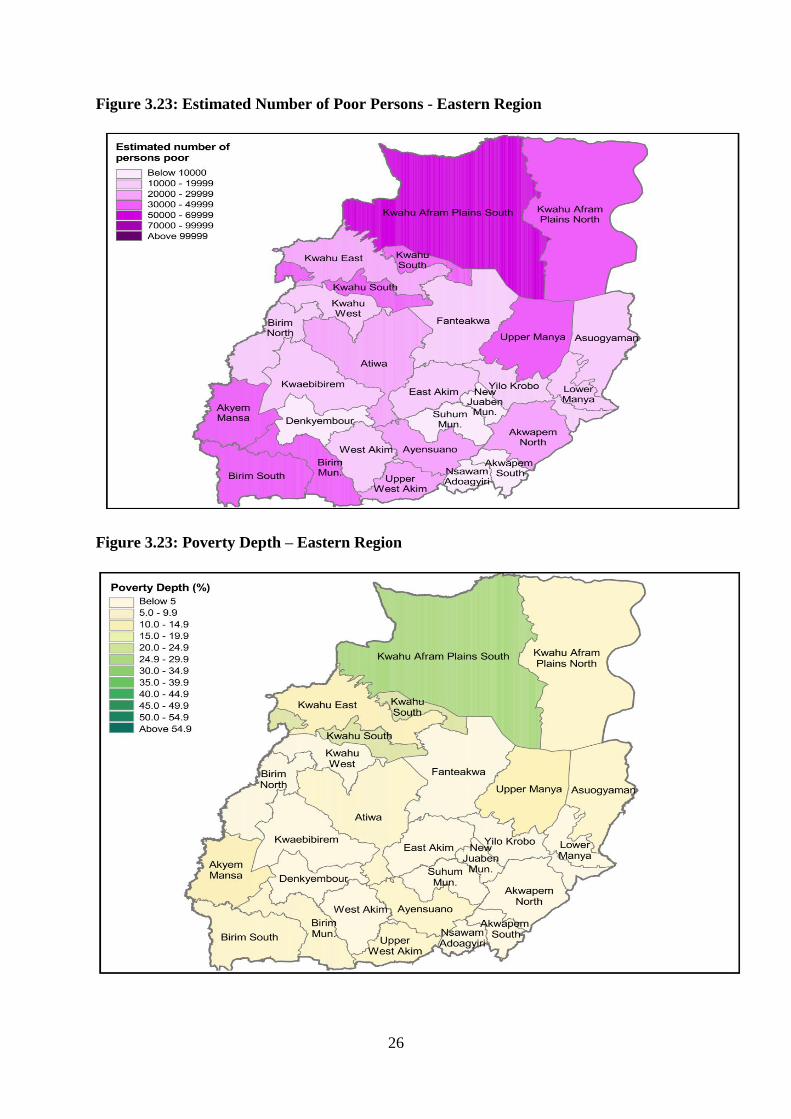
Denkyembuor District and New Juaben Municipal have the lowest poverty depth of 1.1
percent, followed by Nsawam Adoagyiri Municipal and Suhum Municipal with 1.4 percent.
The three districts with the lowest inequality are Upper Manya (27.2), Lower Manya (28.3)
and Yilo Krobo (29.1).
Kwahu Afram Plains South has the highest number of poor persons (67,555) in the region
and Denkyembuor District the lowest (3,559).
Figure 3.21: Poverty Incidence - Eastern Region
26
Figure 3.23: Estimated Number of Poor Persons - Eastern Region
Figure 3.23: Poverty Depth – Eastern Region
27
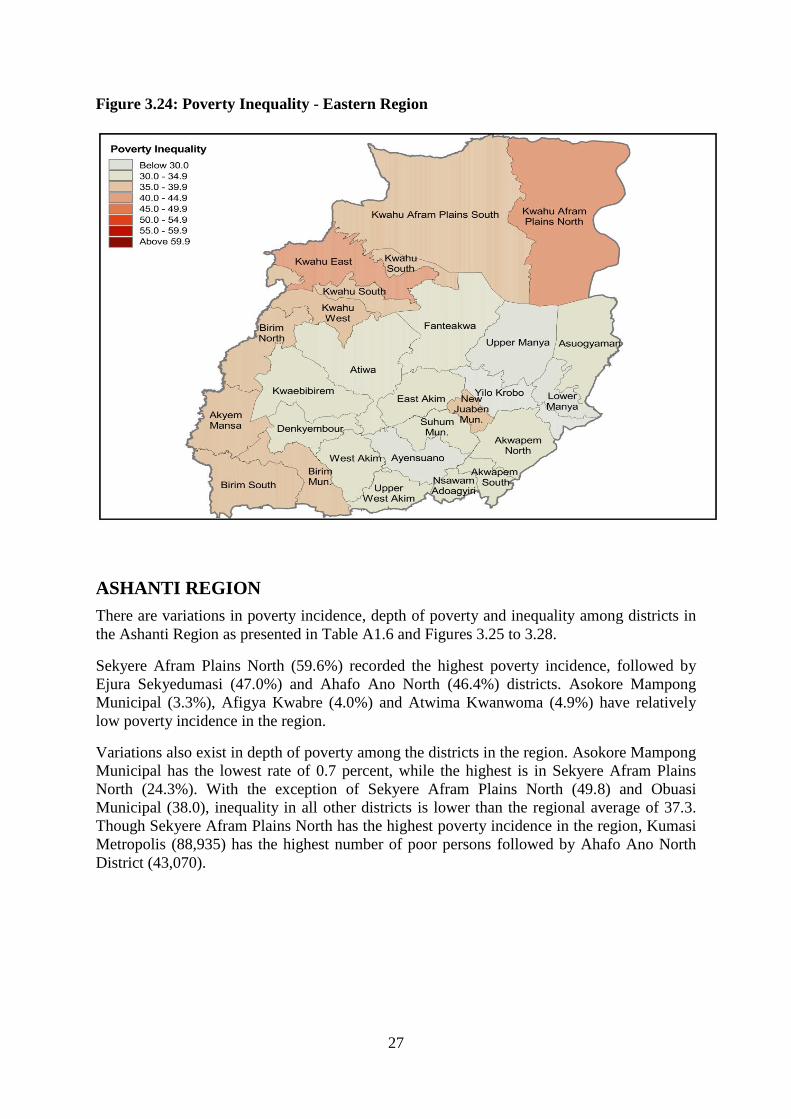
Figure 3.24: Poverty Inequality - Eastern Region
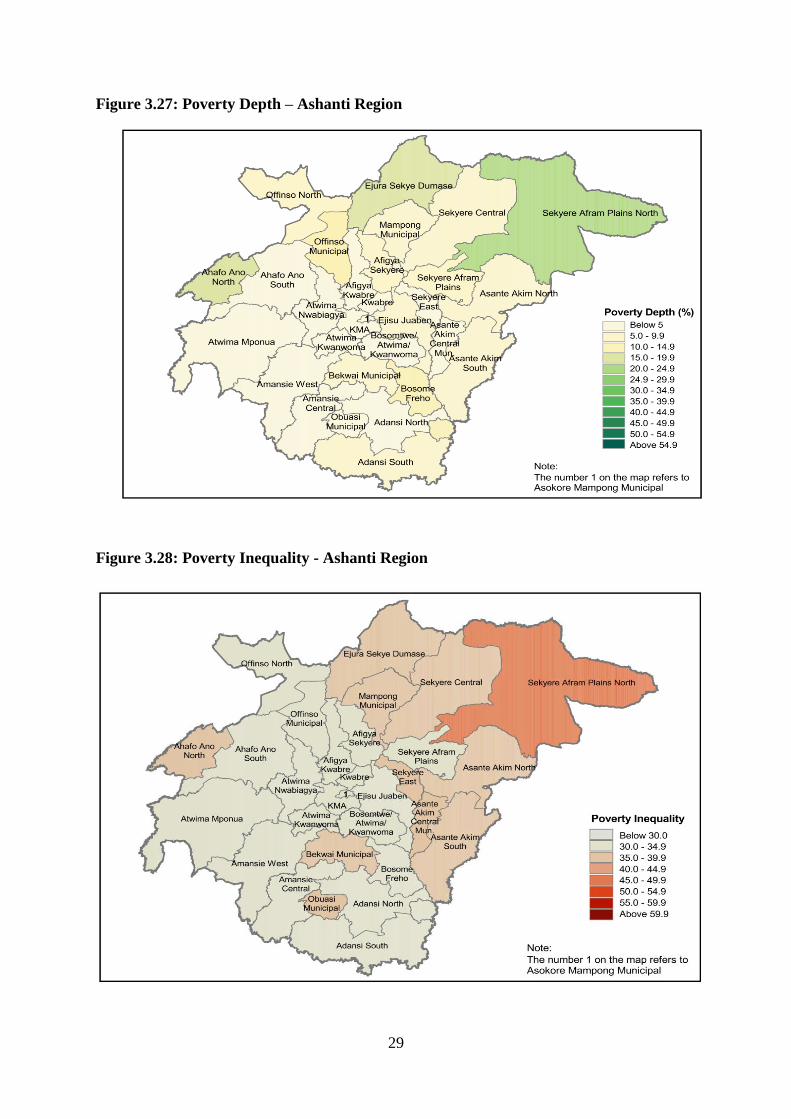
ASHANTI REGION
There are variations in poverty incidence, depth of poverty and inequality among districts in
the Ashanti Region as presented in Table A1.6 and Figures 3.25 to 3.28.
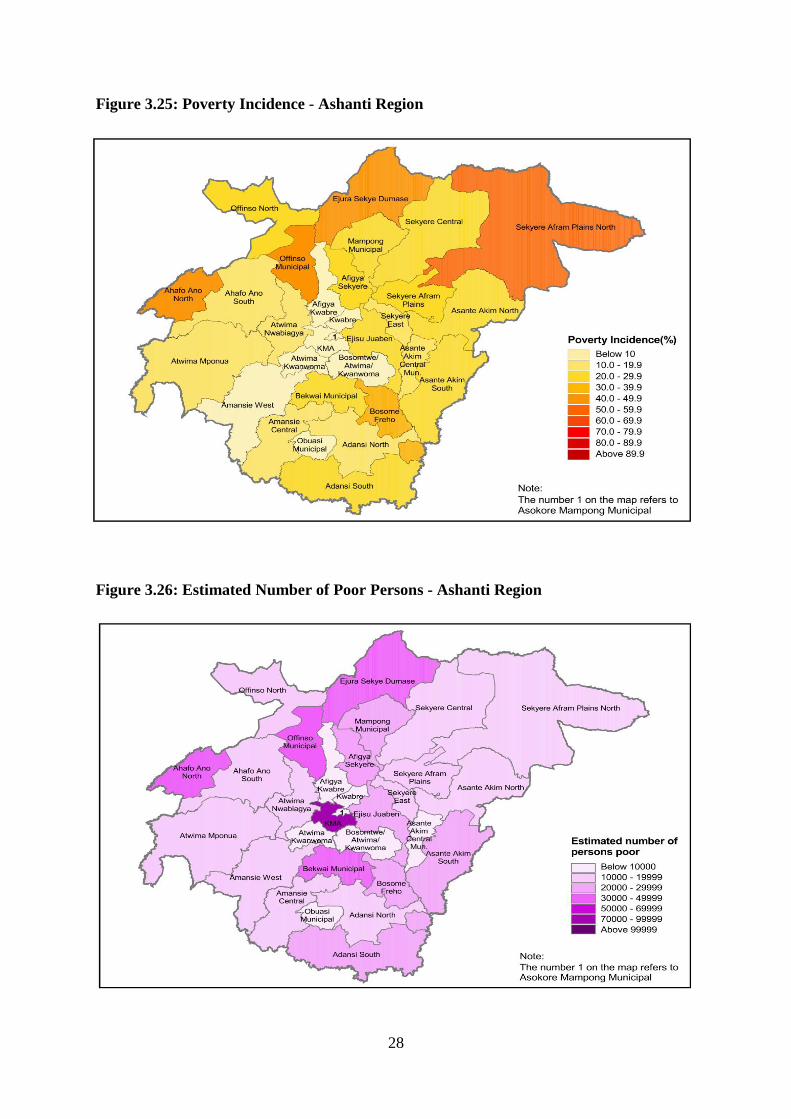
Sekyere Afram Plains North (59.6%) recorded the highest poverty incidence, followed by
Ejura Sekyedumasi (47.0%) and Ahafo Ano North (46.4%) districts. Asokore Mampong
Municipal (3.3%), Afigya Kwabre (4.0%) and Atwima Kwanwoma (4.9%) have relatively
low poverty incidence in the region.
Variations also exist in depth of poverty among the districts in the region. Asokore Mampong
Municipal has the lowest rate of 0.7 percent, while the highest is in Sekyere Afram Plains
North (24.3%). With the exception of Sekyere Afram Plains North (49.8) and Obuasi
Municipal (38.0), inequality in all other districts is lower than the regional average of 37.3.
Though Sekyere Afram Plains North has the highest poverty incidence in the region, Kumasi
Metropolis (88,935) has the highest number of poor persons followed by Ahafo Ano North
District (43,070).
28
Figure 3.25: Poverty Incidence - Ashanti Region
Figure 3.26: Estimated Number of Poor Persons - Ashanti Region
29
Figure 3.27: Poverty Depth – Ashanti Region
Figure 3.28: Poverty Inequality - Ashanti Region
30
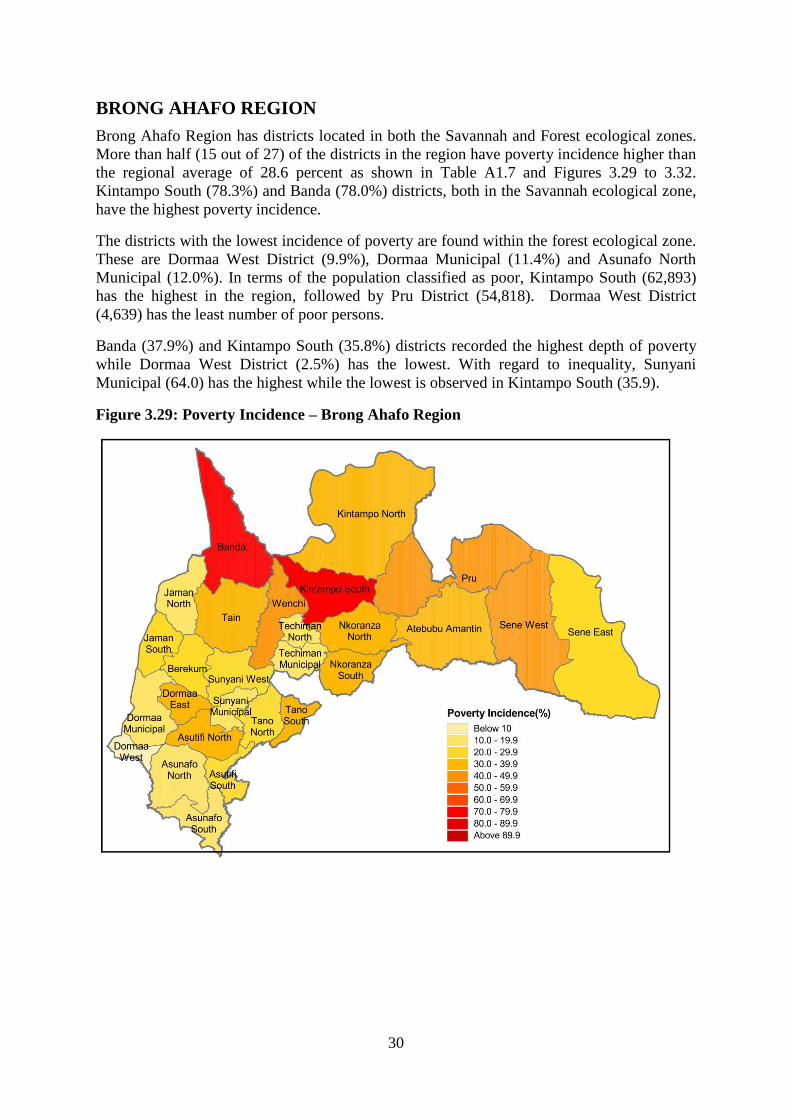
BRONG AHAFO REGION
Brong Ahafo Region has districts located in both the Savannah and Forest ecological zones.
More than half (15 out of 27) of the districts in the region have poverty incidence higher than
the regional average of 28.6 percent as shown in Table A1.7 and Figures 3.29 to 3.32.
Kintampo South (78.3%) and Banda (78.0%) districts, both in the Savannah ecological zone,
have the highest poverty incidence.
The districts with the lowest incidence of poverty are found within the forest ecological zone.
These are Dormaa West District (9.9%), Dormaa Municipal (11.4%) and Asunafo North
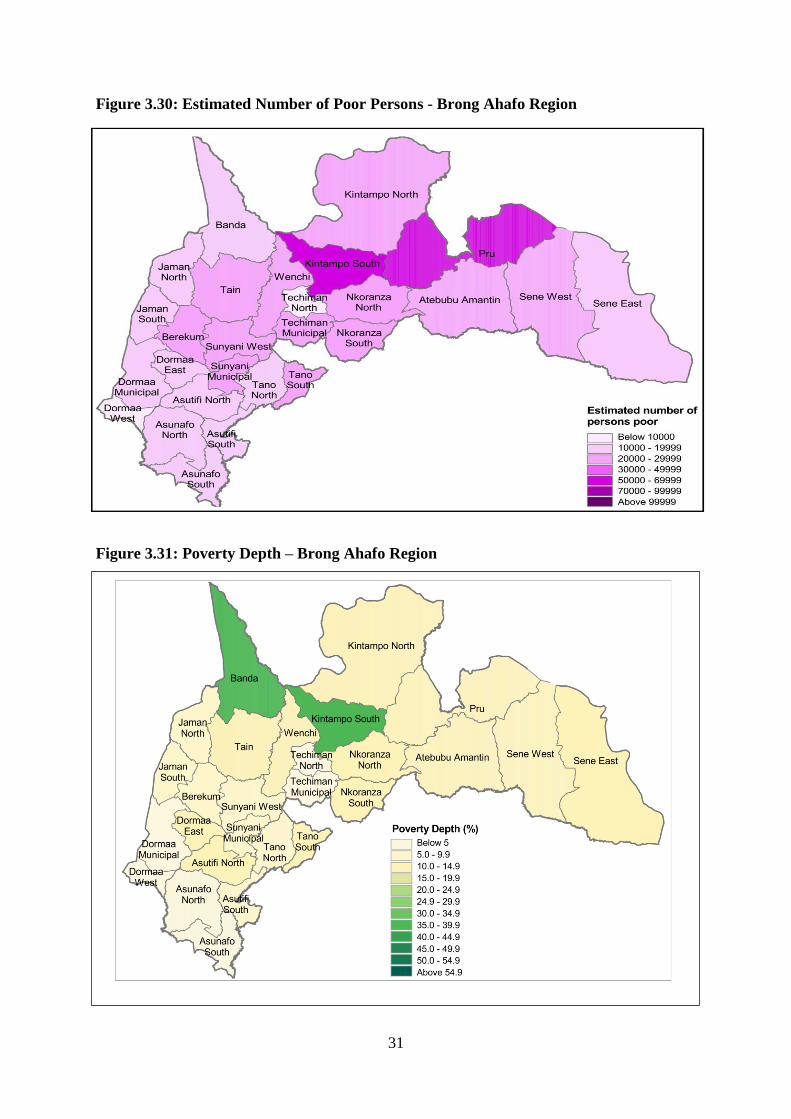
Municipal (12.0%). In terms of the population classified as poor, Kintampo South (62,893)
has the highest in the region, followed by Pru District (54,818). Dormaa West District
(4,639) has the least number of poor persons.
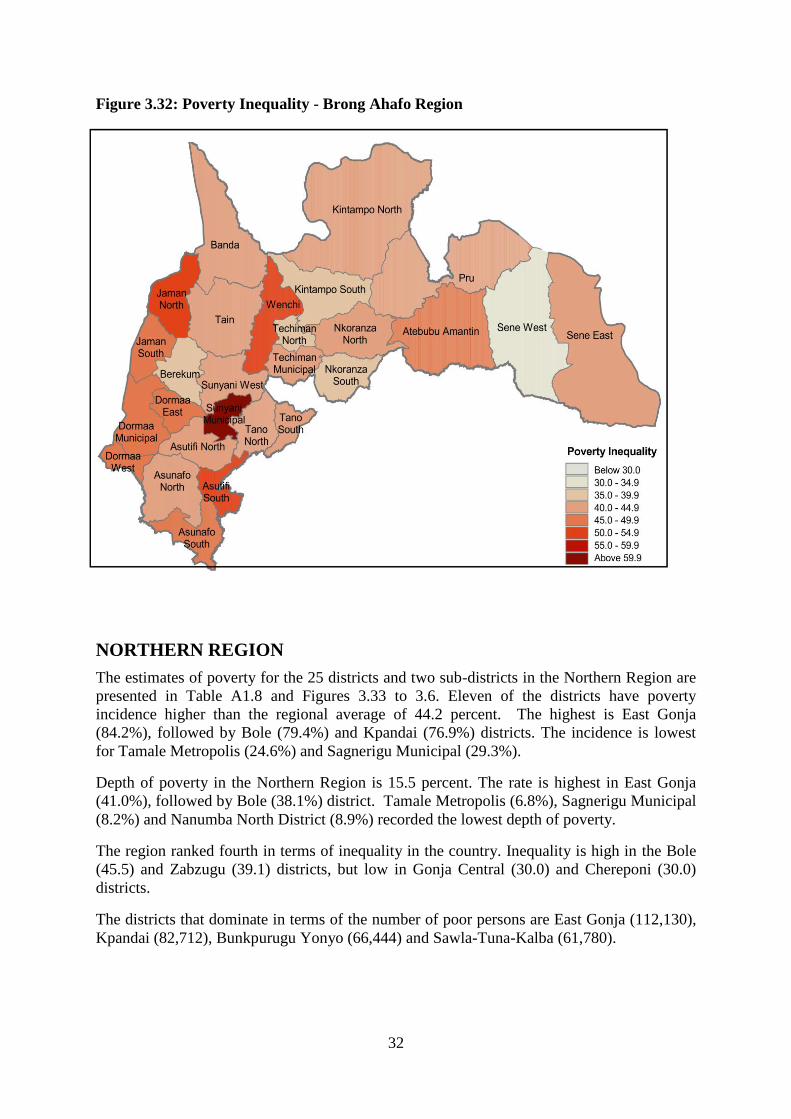
Banda (37.9%) and Kintampo South (35.8%) districts recorded the highest depth of poverty
while Dormaa West District (2.5%) has the lowest. With regard to inequality, Sunyani
Municipal (64.0) has the highest while the lowest is observed in Kintampo South (35.9).
Figure 3.29: Poverty Incidence – Brong Ahafo Region
31
Figure 3.30: Estimated Number of Poor Persons - Brong Ahafo Region
Figure 3.31: Poverty Depth – Brong Ahafo Region
32
Figure 3.32: Poverty Inequality - Brong Ahafo Region
NORTHERN REGION
The estimates of poverty for the 25 districts and two sub-districts in the Northern Region are
presented in Table A1.8 and Figures 3.33 to 3.6. Eleven of the districts have poverty
incidence higher than the regional average of 44.2 percent. The highest is East Gonja
(84.2%), followed by Bole (79.4%) and Kpandai (76.9%) districts. The incidence is lowest
for Tamale Metropolis (24.6%) and Sagnerigu Municipal (29.3%).
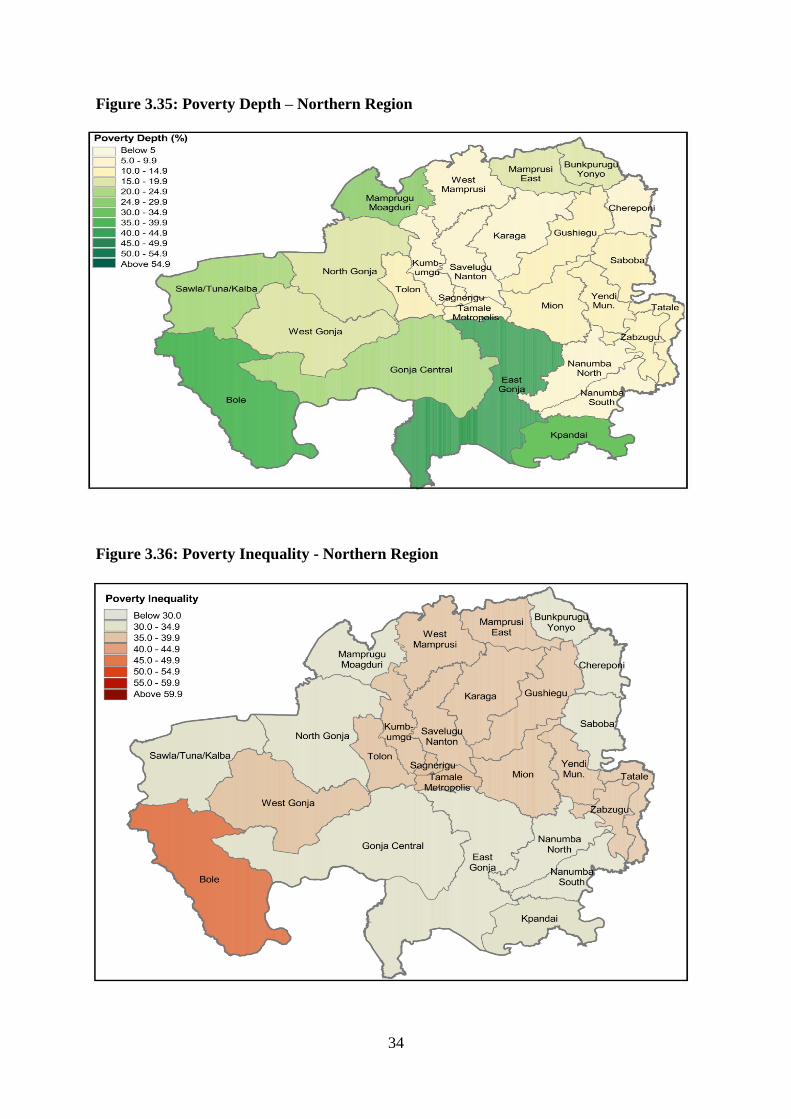
Depth of poverty in the Northern Region is 15.5 percent. The rate is highest in East Gonja
(41.0%), followed by Bole (38.1%) district. Tamale Metropolis (6.8%), Sagnerigu Municipal
(8.2%) and Nanumba North District (8.9%) recorded the lowest depth of poverty.
The region ranked fourth in terms of inequality in the country. Inequality is high in the Bole
(45.5) and Zabzugu (39.1) districts, but low in Gonja Central (30.0) and Chereponi (30.0)
districts.
The districts that dominate in terms of the number of poor persons are East Gonja (112,130),
Kpandai (82,712), Bunkpurugu Yonyo (66,444) and Sawla-Tuna-Kalba (61,780).
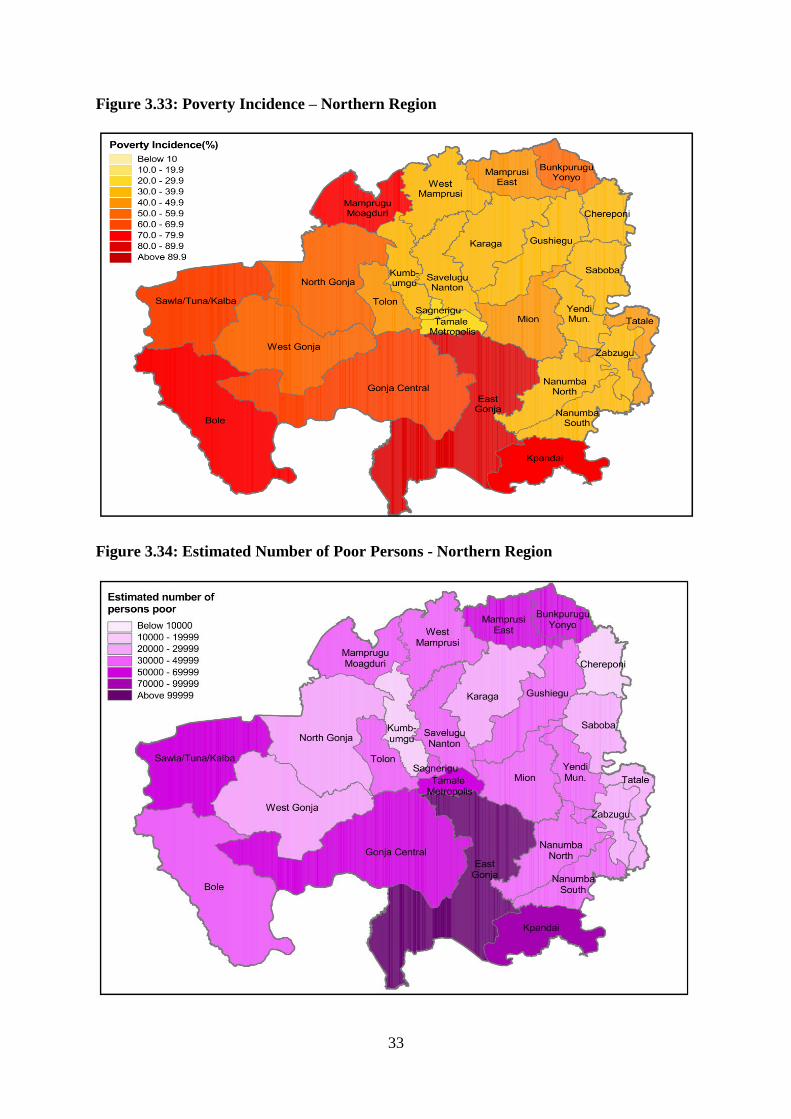
33
Figure 3.33: Poverty Incidence – Northern Region
Figure 3.34: Estimated Number of Poor Persons - Northern Region
34
Figure 3.35: Poverty Depth – Northern Region
Figure 3.36: Poverty Inequality - Northern Region
35
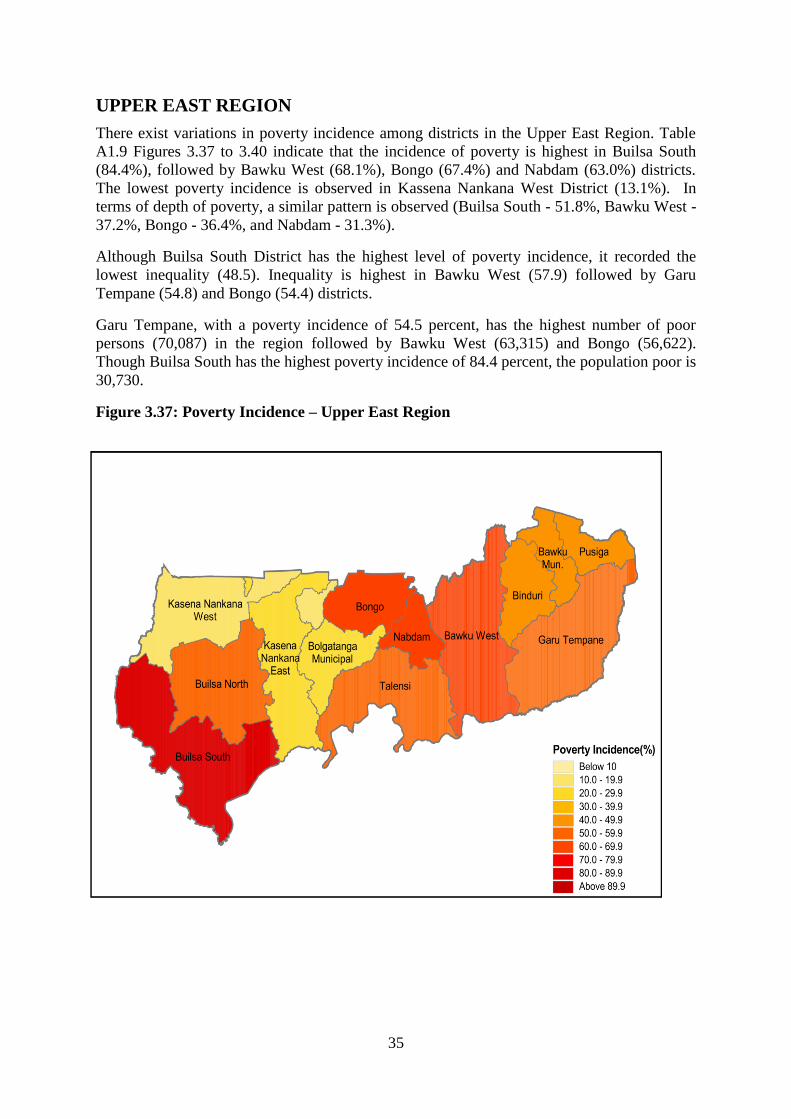
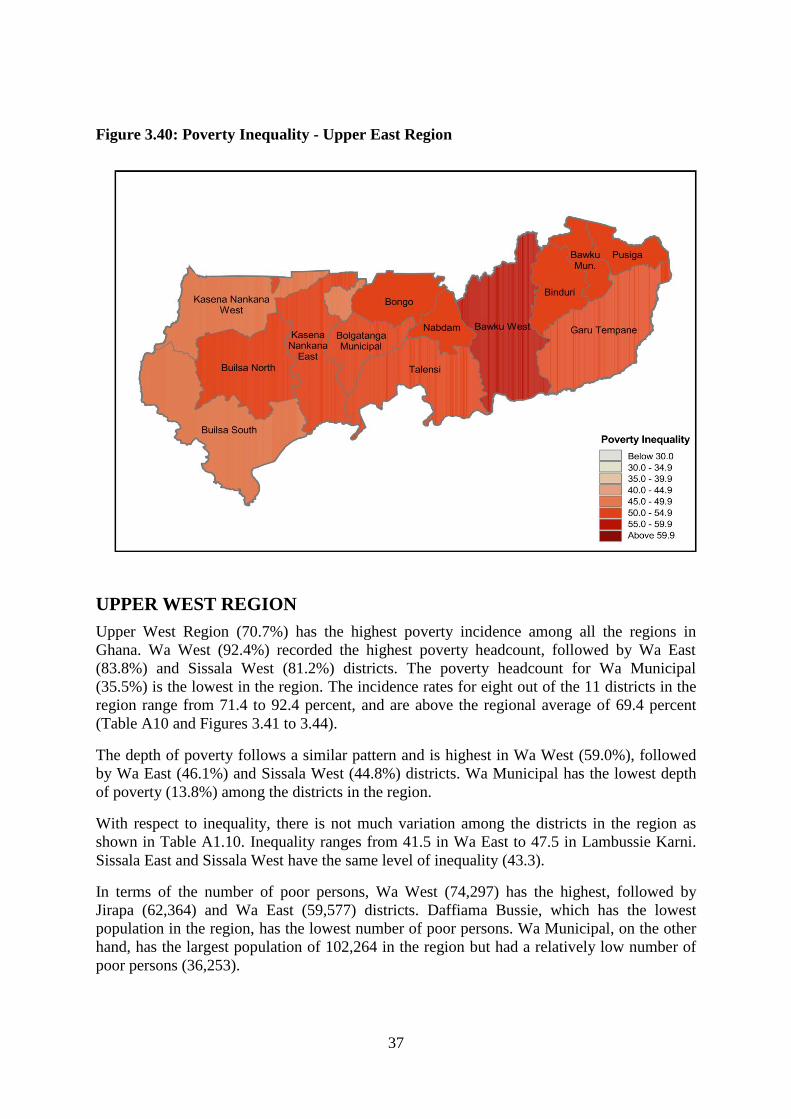
UPPER EAST REGION
There exist variations in poverty incidence among districts in the Upper East Region. Table
A1.9 Figures 3.37 to 3.40 indicate that the incidence of poverty is highest in Builsa South
(84.4%), followed by Bawku West (68.1%), Bongo (67.4%) and Nabdam (63.0%) districts.
The lowest poverty incidence is observed in Kassena Nankana West District (13.1%). In
terms of depth of poverty, a similar pattern is observed (Builsa South - 51.8%, Bawku West -
37.2%, Bongo - 36.4%, and Nabdam - 31.3%).
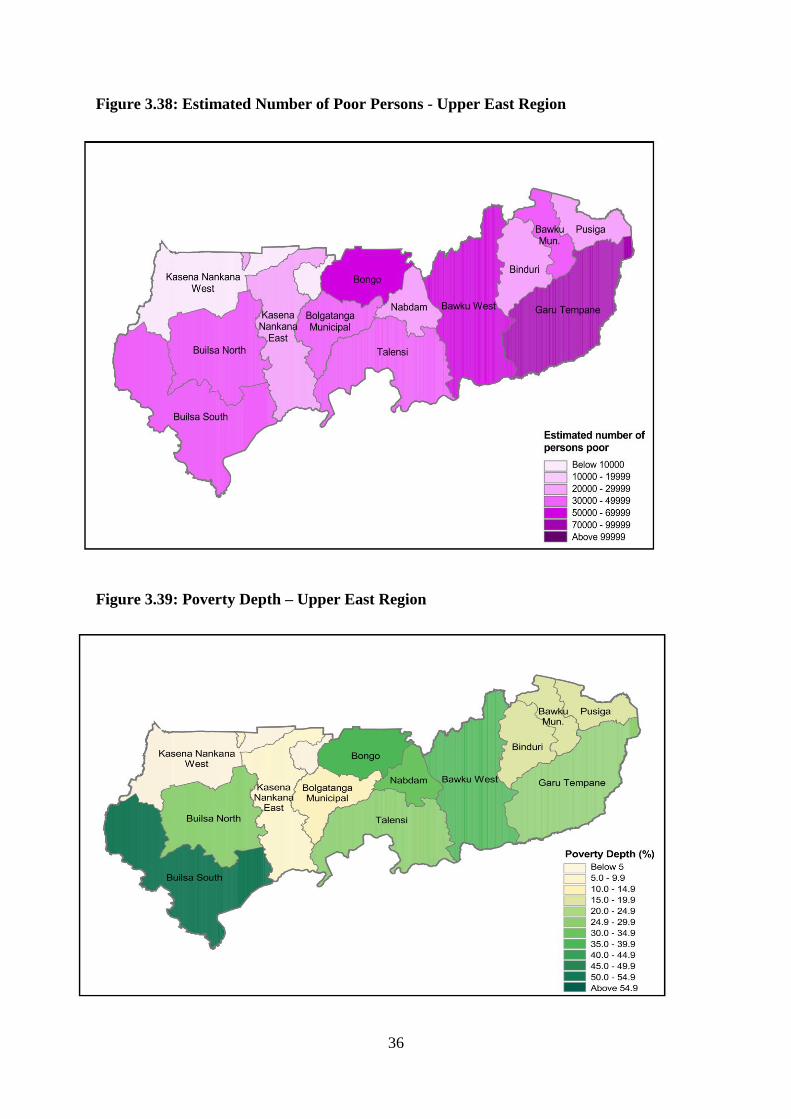
Although Builsa South District has the highest level of poverty incidence, it recorded the
lowest inequality (48.5). Inequality is highest in Bawku West (57.9) followed by Garu
Tempane (54.8) and Bongo (54.4) districts.
Garu Tempane, with a poverty incidence of 54.5 percent, has the highest number of poor
persons (70,087) in the region followed by Bawku West (63,315) and Bongo (56,622).
Though Builsa South has the highest poverty incidence of 84.4 percent, the population poor is
30,730.
Figure 3.37: Poverty Incidence – Upper East Region
36
Figure 3.38: Estimated Number of Poor Persons - Upper East Region
Figure 3.39: Poverty Depth – Upper East Region
37
Figure 3.40: Poverty Inequality - Upper East Region
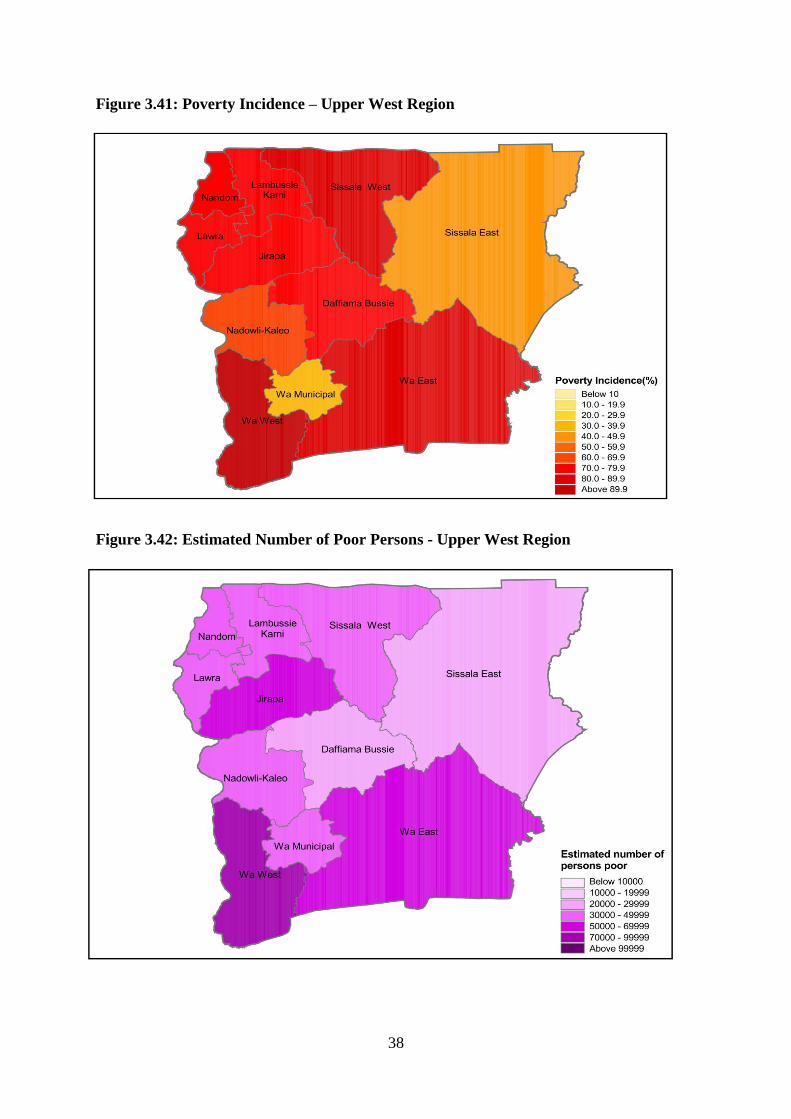
UPPER WEST REGION
Upper West Region (70.7%) has the highest poverty incidence among all the regions in
Ghana. Wa West (92.4%) recorded the highest poverty headcount, followed by Wa East
(83.8%) and Sissala West (81.2%) districts. The poverty headcount for Wa Municipal
(35.5%) is the lowest in the region. The incidence rates for eight out of the 11 districts in the
region range from 71.4 to 92.4 percent, and are above the regional average of 69.4 percent
(Table A10 and Figures 3.41 to 3.44).
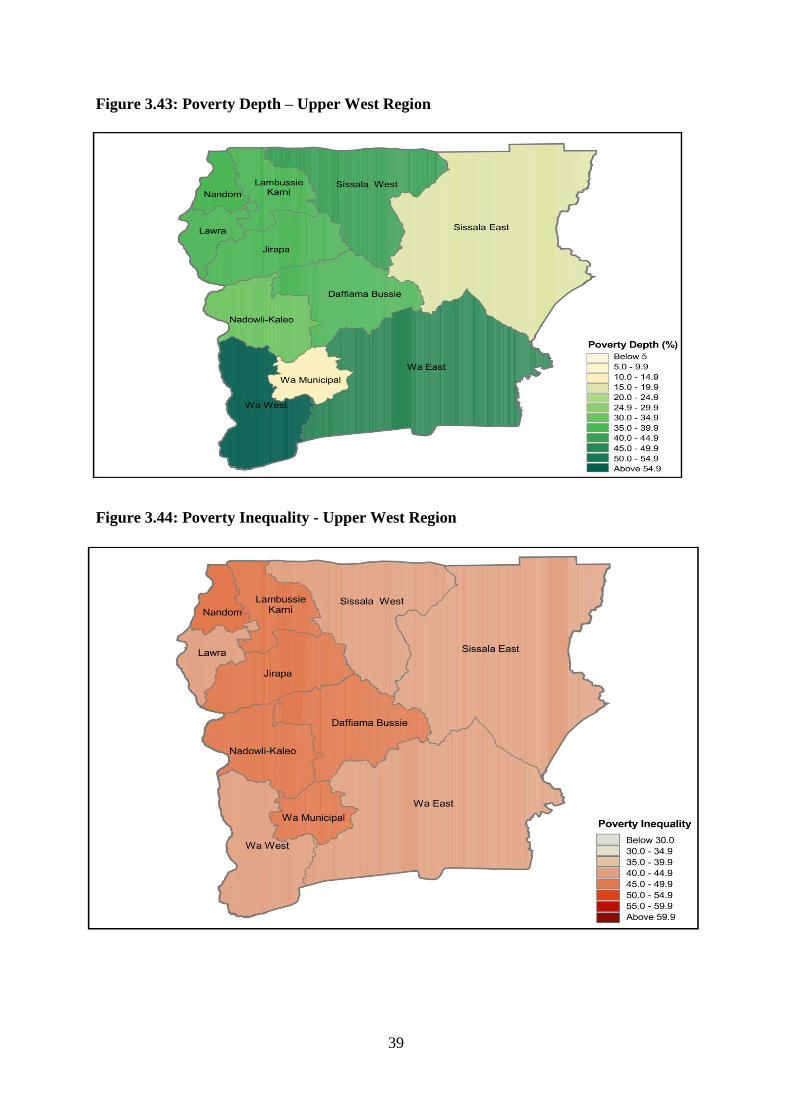
The depth of poverty follows a similar pattern and is highest in Wa West (59.0%), followed
by Wa East (46.1%) and Sissala West (44.8%) districts. Wa Municipal has the lowest depth
of poverty (13.8%) among the districts in the region.
With respect to inequality, there is not much variation among the districts in the region as
shown in Table A1.10. Inequality ranges from 41.5 in Wa East to 47.5 in Lambussie Karni.
Sissala East and Sissala West have the same level of inequality (43.3).
In terms of the number of poor persons, Wa West (74,297) has the highest, followed by
Jirapa (62,364) and Wa East (59,577) districts. Daffiama Bussie, which has the lowest
population in the region, has the lowest number of poor persons. Wa Municipal, on the other
hand, has the largest population of 102,264 in the region but had a relatively low number of
poor persons (36,253).
38
Figure 3.41: Poverty Incidence – Upper West Region
Figure 3.42: Estimated Number of Poor Persons - Upper West Region
39
Figure 3.43: Poverty Depth – Upper West Region
Figure 3.44: Poverty Inequality - Upper West Region
40
CHAPTER FOUR
CONCLUSIONS
The report provides poverty estimates for all the 216 districts and 29 sub-districts in Ghana.
The data from the report are derived from the sixth round of the Ghana Living Standards
Survey (GLSS6) and the 2010 Population and Housing Census (2010 PHC). It is the second
poverty mapping report produced by GSS, having published the first in 2005. The need for
data for planning developmental programmes, monitoring and evaluation at the district level
has necessitated the preparation of this report.
The poverty measures presented in this report are the poverty headcount (P0) and poverty gap
(P1), as well as their standard errors to indicate their level of precision. The Gini coefficient is
used to measure inequality. The computed poverty estimates at the regional level using the
2010 PHC data are comparable with their corresponding estimates obtained from GLSS6.
This provides confidence in the reliability of the models.
The report reveals significant variations in incidence and depth of poverty among the
districts, within and across regions. However, the same cannot be said with respect to
inequality. Wa West in the Upper West region has the highest poverty incidence and depth.
The least incidence rate is recorded in La Dade Kotopon Municipal in the Greater Accra
region. With regard to welfare distribution, Sunyani Municipal in the Brong Ahafo region has
the highest inequality. The least inequality is recorded in Upper Manya in the Eastern region.
East Gonja in the Northern region has more poor persons than any other district in Ghana.
The least number of poor persons is in Suaman District in the Western region.
Poverty maps have become more useful in the context of social safety-net programs. They are
best suited to guide spatial targeting, for instance, identifying areas associated with high
poverty rates. They are useful to rank geographical areas for phased roll-out programs.
However, they are not a substitute for the identification of beneficiaries, which requires
household or individual-level targeting. The poverty estimates presented in this report are
based on consumption expenditure only, and may not adequately capture other attributes of
poverty or vulnerability. These estimates do not explain the causes of poverty. Therefore,
specialized surveys may be required to determine them.
41
REFERENCES
Ghana Statistical Service, (May, 2013), “National Analytical Report” 2010 Population and
Housing Census.
Elbers, C., J.O. Lanjouw, and P. Lanjouw (2002). “Micro-level estimation of welfare,” Policy
Research Working Paper Series no. 2911, The World Bank.
Ghana Statistical Service, (August, 2014),”Poverty Profile in Ghana (2005-2013)” Ghana
Living Standards Survey round six.
Elbers, C., J.O. Lanjouw, and P. Lanjouw (2003). “Micro-level Estimation of Poverty and
Inequality,” Econometrica, 71(1):355–364.
Ghana Statistical Service, (August, 2014),”Ghana Living Standards Survey round six
(GLSS6) main report” Ghana Living Standards Survey round six.
Elbers, C., Lanjouw, J., and Lanjouw, P., (2002), “Micro-Level Estimation of Welfare”,
World Bank Policy Research Working Paper No. WPS 2911.
Ghosh, M. and Rao, J., (1994), “Small Area Estimation: An Appraisal”, Statistical Science,
Vol. 9, pp: 55-93
42
APPENDICES
APPENDIX 1: Table of results by region
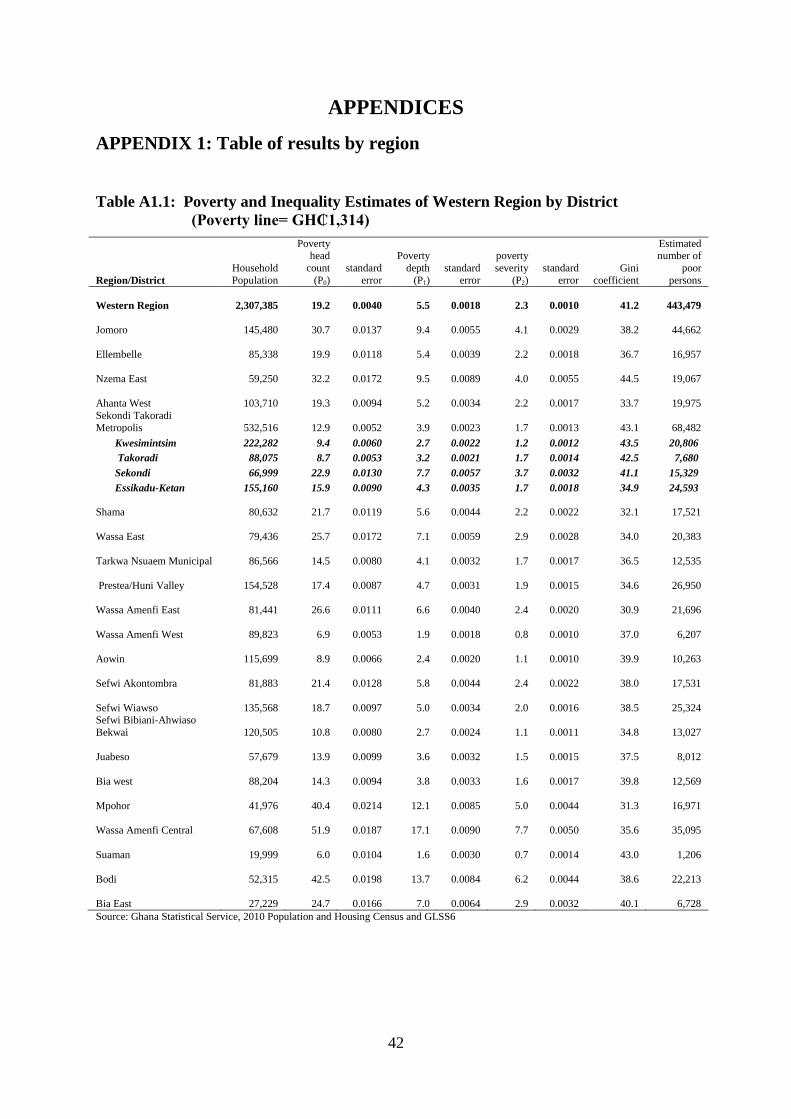
Table A1.1: Poverty and Inequality Estimates of Western Region by District
(Poverty line= GH₵1,314)
Region/District
Household
Population
Poverty head
count
(P0)
standard
error
Poverty
depth
(P1)
standard
error
poverty
severity
(P2)
standard
error
Gini
coefficient
Estimated number of
poor
persons
Western Region 2,307,385 19.2 0.0040
5.5 0.0018
2.3 0.0010 41.2 443,479
Jomoro 145,480 30.7 0.0137
9.4 0.0055
4.1 0.0029 38.2 44,662
Ellembelle 85,338 19.9 0.0118
5.4 0.0039
2.2 0.0018 36.7 16,957
Nzema East 59,250 32.2 0.0172
9.5 0.0089
4.0 0.0055 44.5 19,067
Ahanta West 103,710 19.3 0.0094
5.2 0.0034
2.2 0.0017 33.7 19,975
Sekondi Takoradi
Metropolis 532,516 12.9 0.0052
3.9 0.0023
1.7 0.0013 43.1 68,482
Kwesimintsim 222,282 9.4 0.0060 2.7 0.0022 1.2 0.0012 43.5 20,806
Takoradi 88,075 8.7 0.0053 3.2 0.0021 1.7 0.0014 42.5 7,680
Sekondi 66,999 22.9 0.0130 7.7 0.0057 3.7 0.0032 41.1 15,329
Essikadu-Ketan 155,160 15.9 0.0090 4.3 0.0035 1.7 0.0018 34.9 24,593
Shama 80,632 21.7 0.0119 5.6 0.0044
2.2 0.0022 32.1 17,521
Wassa East 79,436 25.7 0.0172
7.1 0.0059
2.9 0.0028 34.0 20,383
Tarkwa Nsuaem Municipal 86,566 14.5 0.0080
4.1 0.0032
1.7 0.0017 36.5 12,535
Prestea/Huni Valley 154,528 17.4 0.0087
4.7 0.0031
1.9 0.0015 34.6 26,950
Wassa Amenfi East 81,441 26.6 0.0111
6.6 0.0040
2.4 0.0020 30.9 21,696
Wassa Amenfi West 89,823 6.9 0.0053
1.9 0.0018
0.8 0.0010 37.0 6,207
Aowin 115,699 8.9 0.0066
2.4 0.0020
1.1 0.0010 39.9 10,263
Sefwi Akontombra 81,883 21.4 0.0128
5.8 0.0044
2.4 0.0022 38.0 17,531
Sefwi Wiawso 135,568 18.7 0.0097
5.0 0.0034
2.0 0.0016 38.5 25,324 Sefwi Bibiani-Ahwiaso
Bekwai 120,505 10.8 0.0080
2.7 0.0024
1.1 0.0011 34.8 13,027
Juabeso 57,679 13.9 0.0099
3.6 0.0032
1.5 0.0015 37.5 8,012
Bia west 88,204 14.3 0.0094
3.8 0.0033
1.6 0.0017 39.8 12,569
Mpohor 41,976 40.4 0.0214
12.1 0.0085
5.0 0.0044 31.3 16,971
Wassa Amenfi Central 67,608 51.9 0.0187
17.1 0.0090
7.7 0.0050 35.6 35,095
Suaman 19,999 6.0 0.0104
1.6 0.0030
0.7 0.0014 43.0 1,206
Bodi 52,315 42.5 0.0198
13.7 0.0084
6.2 0.0044 38.6 22,213
Bia East 27,229 24.7 0.0166
7.0 0.0064
2.9 0.0032 40.1 6,728
Source: Ghana Statistical Service, 2010 Population and Housing Census and GLSS6
43
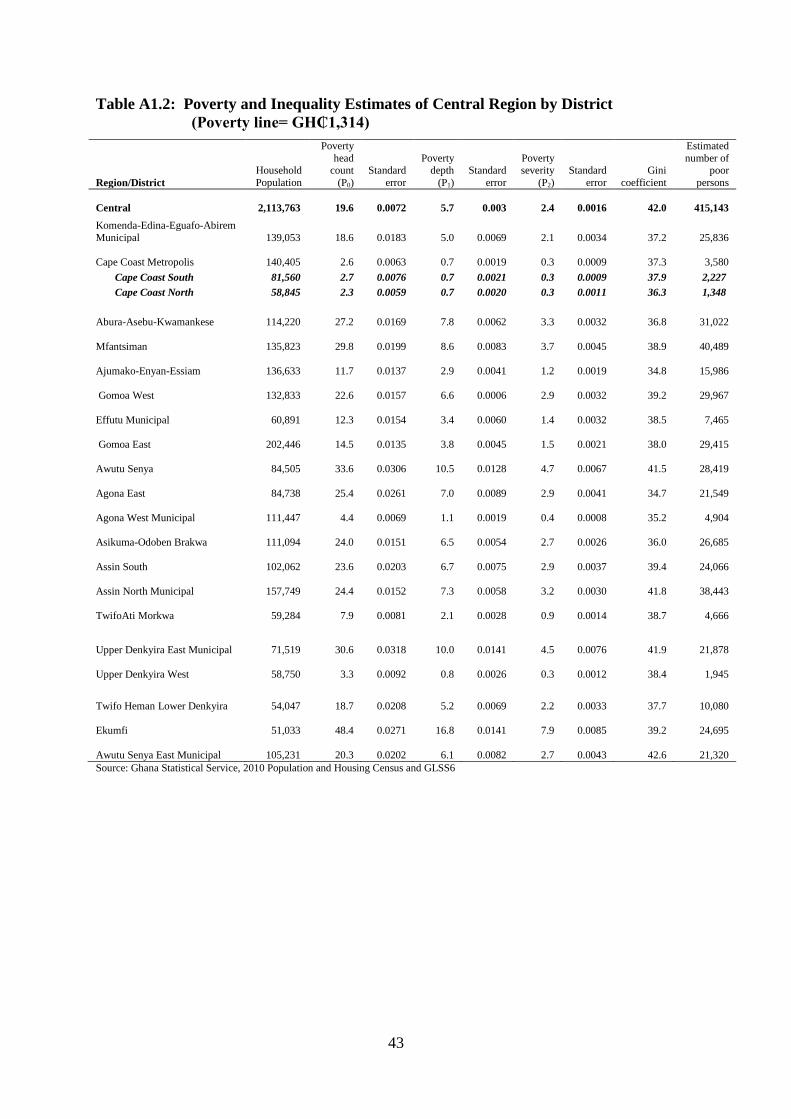
Table A1.2: Poverty and Inequality Estimates of Central Region by District
(Poverty line= GH₵1,314)
Region/District
Household
Population
Poverty
head count
(P0)
Standard
error
Poverty depth
(P1)
Standard
error
Poverty severity
(P2)
Standard
error
Gini
coefficient
Estimated
number of poor
persons
Central 2,113,763 19.6 0.0072
5.7 0.003
2.4 0.0016 42.0 415,143
Komenda-Edina-Eguafo-Abirem
Municipal 139,053 18.6 0.0183
5.0 0.0069
2.1 0.0034 37.2 25,836
Cape Coast Metropolis 140,405 2.6 0.0063
0.7 0.0019
0.3 0.0009 37.3 3,580
Cape Coast South 81,560 2.7 0.0076 0.7 0.0021 0.3 0.0009 37.9 2,227
Cape Coast North 58,845 2.3 0.0059 0.7 0.0020 0.3 0.0011 36.3 1,348
Abura-Asebu-Kwamankese 114,220 27.2 0.0169
7.8 0.0062
3.3 0.0032 36.8 31,022
Mfantsiman 135,823 29.8 0.0199
8.6 0.0083
3.7 0.0045 38.9 40,489
Ajumako-Enyan-Essiam 136,633 11.7 0.0137
2.9 0.0041
1.2 0.0019 34.8 15,986
Gomoa West 132,833 22.6 0.0157
6.6 0.0006
2.9 0.0032 39.2 29,967
Effutu Municipal 60,891 12.3 0.0154
3.4 0.0060
1.4 0.0032 38.5 7,465
Gomoa East 202,446 14.5 0.0135
3.8 0.0045
1.5 0.0021 38.0 29,415
Awutu Senya 84,505 33.6 0.0306
10.5 0.0128
4.7 0.0067 41.5 28,419
Agona East 84,738 25.4 0.0261
7.0 0.0089
2.9 0.0041 34.7 21,549
Agona West Municipal 111,447 4.4 0.0069
1.1 0.0019
0.4 0.0008 35.2 4,904
Asikuma-Odoben Brakwa 111,094 24.0 0.0151
6.5 0.0054
2.7 0.0026 36.0 26,685
Assin South 102,062 23.6 0.0203
6.7 0.0075
2.9 0.0037 39.4 24,066
Assin North Municipal 157,749 24.4 0.0152
7.3 0.0058
3.2 0.0030 41.8 38,443
TwifoAti Morkwa 59,284 7.9 0.0081
2.1 0.0028
0.9 0.0014 38.7 4,666
Upper Denkyira East Municipal 71,519 30.6 0.0318
10.0 0.0141
4.5 0.0076 41.9 21,878
Upper Denkyira West 58,750 3.3 0.0092
0.8 0.0026
0.3 0.0012 38.4 1,945
Twifo Heman Lower Denkyira 54,047 18.7 0.0208
5.2 0.0069
2.2 0.0033 37.7 10,080
Ekumfi 51,033 48.4 0.0271
16.8 0.0141
7.9 0.0085 39.2 24,695
Awutu Senya East Municipal 105,231 20.3 0.0202
6.1 0.0082
2.7 0.0043 42.6 21,320
Source: Ghana Statistical Service, 2010 Population and Housing Census and GLSS6
44
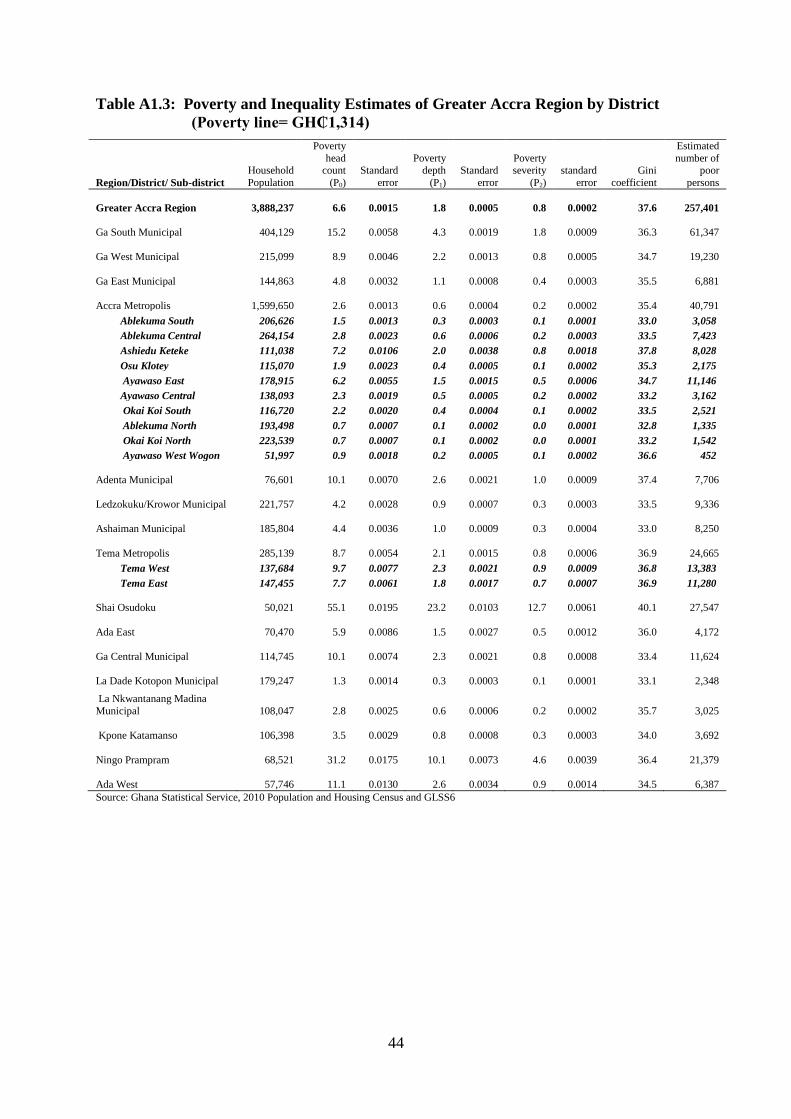
Table A1.3: Poverty and Inequality Estimates of Greater Accra Region by District
(Poverty line= GH₵1,314)
Region/District/ Sub-district
Household
Population
Poverty
head count
(P0)
Standard
error
Poverty depth
(P1)
Standard
error
Poverty severity
(P2)
standard
error
Gini
coefficient
Estimated
number of poor
persons
Greater Accra Region 3,888,237 6.6 0.0015
1.8 0.0005
0.8 0.0002 37.6 257,401
Ga South Municipal 404,129 15.2 0.0058
4.3 0.0019
1.8 0.0009 36.3 61,347
Ga West Municipal 215,099 8.9 0.0046
2.2 0.0013
0.8 0.0005 34.7 19,230
Ga East Municipal 144,863 4.8 0.0032
1.1 0.0008
0.4 0.0003 35.5 6,881
Accra Metropolis 1,599,650 2.6 0.0013
0.6 0.0004
0.2 0.0002 35.4 40,791
Ablekuma South 206,626 1.5 0.0013 0.3 0.0003 0.1 0.0001 33.0 3,058
Ablekuma Central 264,154 2.8 0.0023 0.6 0.0006 0.2 0.0003 33.5 7,423
Ashiedu Keteke 111,038 7.2 0.0106 2.0 0.0038 0.8 0.0018 37.8 8,028
Osu Klotey 115,070 1.9 0.0023 0.4 0.0005 0.1 0.0002 35.3 2,175
Ayawaso East 178,915 6.2 0.0055 1.5 0.0015 0.5 0.0006 34.7 11,146
Ayawaso Central 138,093 2.3 0.0019 0.5 0.0005 0.2 0.0002 33.2 3,162
Okai Koi South 116,720 2.2 0.0020 0.4 0.0004 0.1 0.0002 33.5 2,521
Ablekuma North 193,498 0.7 0.0007 0.1 0.0002 0.0 0.0001 32.8 1,335
Okai Koi North 223,539 0.7 0.0007 0.1 0.0002 0.0 0.0001 33.2 1,542
Ayawaso West Wogon 51,997 0.9 0.0018 0.2 0.0005 0.1 0.0002 36.6 452
Adenta Municipal 76,601 10.1 0.0070
2.6 0.0021
1.0 0.0009 37.4 7,706
Ledzokuku/Krowor Municipal 221,757 4.2 0.0028
0.9 0.0007
0.3 0.0003 33.5 9,336
Ashaiman Municipal 185,804 4.4 0.0036
1.0 0.0009
0.3 0.0004 33.0 8,250
Tema Metropolis 285,139 8.7 0.0054
2.1 0.0015
0.8 0.0006 36.9 24,665
Tema West 137,684 9.7 0.0077 2.3 0.0021 0.9 0.0009 36.8 13,383
Tema East 147,455 7.7 0.0061 1.8 0.0017 0.7 0.0007 36.9 11,280
Shai Osudoku 50,021 55.1 0.0195
23.2 0.0103
12.7 0.0061 40.1 27,547
Ada East 70,470 5.9 0.0086
1.5 0.0027
0.5 0.0012 36.0 4,172
Ga Central Municipal 114,745 10.1 0.0074
2.3 0.0021
0.8 0.0008 33.4 11,624
La Dade Kotopon Municipal 179,247 1.3 0.0014
0.3 0.0003
0.1 0.0001 33.1 2,348
La Nkwantanang Madina
Municipal 108,047 2.8 0.0025
0.6 0.0006
0.2 0.0002 35.7 3,025
Kpone Katamanso 106,398 3.5 0.0029
0.8 0.0008
0.3 0.0003 34.0 3,692
Ningo Prampram 68,521 31.2 0.0175
10.1 0.0073
4.6 0.0039 36.4 21,379
Ada West 57,746 11.1 0.0130
2.6 0.0034
0.9 0.0014 34.5 6,387
Source: Ghana Statistical Service, 2010 Population and Housing Census and GLSS6
45
Table A1.4: Poverty and Inequality Estimates of Volta Region by District
(Poverty line= GH₵1,314)
Region/District
Household
Population
Poverty
head count
(P0)
Standard
error
Poverty depth
(P1)
Standard
error
Poverty severity
(P2)
Standard
error
Gini
coefficient
Estimated
number of poor
persons
Volta Region 2,086,557 33.3 0.0028 11.8 0.0018 5.7 0.0012 43.7 694,615
South Tongu 86,546 25.4 0.0077 7.5 0.0045 3.2 0.0027 41.7 21,957
Keta Municipal 144,747 14.6 0.0075 3.8 0.0032 1.5 0.0017 39.1 21,119
Ketu South 157,223 15.3 0.0067 4.1 0.0026 1.6 0.0013 37.6 24,118
Ketu North 98,571 23.5 0.0085 6.4 0.0044 2.6 0.0025 36.6 23,154
Akatsi South 97,405 10.5 0.0084 2.6 0.0032 1.0 0.0015 37.9 10,257
Central Tongu 58,764 33.4 0.0066 10.2 0.0036 4.4 0.0021 37.5 19,651
Agotime Ziope 27,731 62.1 0.0101 24.2 0.0073 12.1 0.0054 37.4 22,324
Ho Municipal 172,064 21.9 0.0067 6.6 0.0031 2.9 0.0017 42.2 37,613
South Dayi 45,849 27.7 0.0080 8.7 0.0041 3.8 0.0024 42.8 12,686
Kpando Municipal 52,754 32.4 0.0088 11.1 0.0052 5.2 0.0034 44.4 17,113
Hohoe Municipal 164,326 31.6 0.0062 10.6 0.0033 4.9 0.0020 42.8 51,976
Biakoye 65,435 31.6 0.0068 10.8 0.0038 5.1 0.0024 45.0 20,651
Jasikan 58,733 39.1 0.0062 14.6 0.0035 7.3 0.0025 44.0 22,959
Kadjebi 58,273 66.8 0.0085 30.1 0.0043 16.8 0.0028 43.6 38,909
Krachi East 115,251 50.6 0.0049 19.4 0.0035 9.7 0.0027 42.5 58,329
Krachi West 48,839 41.1 0.0074 15.4 0.0037 7.7 0.0024 39.6 20,083
Nkwanta South 116,684 31.7 0.0069 10.6 0.0041 4.9 0.0027 45.2 36,989
Nkwanta North 63,822 49.9 0.0068 19.2 0.0035 9.7 0.0025 44.1 31,854
North Tongu 88,866 51.7 0.0065 20.4 0.0042 10.5 0.0031 46.0 45,899
Akatsi North 29,587 26.5 0.0105 7.1 0.0050 2.8 0.0027 36.6 7,835
Adaklu 35,960 89.7 0.0097 46.9 0.0055 28.2 0.0038 32.2 24,883
Ho West 93,523 39.6 0.0061 13.0 0.0038 5.9 0.0024 41.5 37,054
Afadzato South 94,029 36.9 0.0071 12.6 0.0039 5.8 0.0024 43.4 34,734
North Dayi 39,566 40.6 0.0080 13.8 0.0058 6.4 0.0039 41.7 16,052
Krachi Nchumuru 72,009 52.6 0.0060 20.9 0.0030 10.9 0.0021 41.5 37,855
Source: Ghana Statistical Service, 2010 Population and Housing Census and GLSS6
46
Table A1.5: Poverty and Inequality Estimates of Eastern Region by District
(Poverty line= GH₵1,314)
Region/District
Household
Population
Poverty
head count
(P0)
Standard
error
Poverty depth
(P1)
Standard
error
Poverty severity
(P2)
Standard
error
Gini
coefficient
Estimated
number of poor
persons
Eastern Region 2,574,543 22.0 0.0097
6.1 0.0041
2.5 0.0022 37.9 566,399
Birim South 117,985 27.6 0.0253
8.0 0.0111
3.5 0.0062 39.0 32,505
Birim Municipal 141,800 22.8 0.0247
6.7 0.0103
2.9 0.0056 37.3 32,345
West Akim Municipal 107,093 11.0 0.0163
2.5 0.0045
0.9 0.0018 34.3 11,759
Suhum Municipal 88,381 6.5 0.0098
1.4 0.0023
0.5 0.0009 33.4 5,762
Nsawam Adoagyiri Municipal 79,402 6.3 0.0096
1.4 0.0024
0.5 0.001 34.7 4,963
Akwapem North 134,359 19.3 0.0203
4.6 0.0058
1.7 0.0024 34.5 25,891
New Juaben Municipal 173,653 4.6 0.0071
1.1 0.002
0.5 0.0009 35.9 7,936
Yilo Krobo 86,567 15.9 0.0269
3.3 0.0069
1.1 0.0026 29.1 13,799
Lower Manya 87,649 14.8 0.0188
2.9 0.0053
0.9 0.0021 28.3 12,963
Asuogyaman 96,027 19.9 0.0265
5.0 0.008
1.9 0.0035 33.5 19,100
Upper Manya 71,227 43.6 0.0381
11.2 0.0153
4.1 0.0073 27.2 31,041
Fanteakwa 106,155 18.1 0.0214
4.0 0.006
1.4 0.0024 33.9 19,257
East Akim Municipal 164,561 10.6 0.0113
2.3 0.0031
0.8 0.0014 32.9 17,493
Kwaebibirem 111,525 16.6 0.0159
3.8 0.0043
1.4 0.0018 33.1 18,457
Akyem Mansa 96,378 38.8 0.0266
12.7 0.0143
5.9 0.0089 36.0 37,433
Birim North 77,572 14.3 0.0145
3.7 0.0046
1.5 0.0022 35.5 11,093
Atiwa 109,352 27.1 0.0263
6.4 0.008
2.3 0.0033 30.7 29,634
Kwahu West Municipal 90,131 18.2 0.0215
4.6 0.0068
1.8 0.003 35.2 16,386
Kwahu South 68,182 48.0 0.0373
16.3 0.0184
7.6 0.0103 39.1 32,714
Kwahu East 76,379 36.6 0.0388
12.0 0.0164
5.6 0.0087 41.5 27,970
Kwahu Afram Plains North 100,568 31.7 0.043
9.0 0.0156
3.7 0.0073 40.5 31,920
Upper West Akyem 85,875 25.6 0.0225
6.5 0.0082
2.5 0.0039 32.6 21,975
Akwapim South 36,932 16.5 0.0181
3.8 0.0051
1.4 0.0021 33.6 6,101
Ayensuano 75,843 30.9 0.0219
7.7 0.0075
2.9 0.0034 29.3 23,466
Denkyembuor 77,713 4.6 0.0089
1.1 0.0028
0.4 0.0013 34.7 3,559
Kwahu Afram Plains South 113,234 59.7 0.043
21.2 0.0261
10.0 0.0159 36.6 67,555
Source: Ghana Statistical Service, 2010 Population and Housing Census and GLSS6
47
Table A1.6: Poverty and Inequality Estimates of Ashanti Region by District
(Poverty line= GH₵1,314)
Region/District
Household
Population
Poverty
head count
(P0)
Standard
error
Poverty depth
(P1)
Standard
error
Poverty severity
(P2)
Standard
error
Gini
coefficient
Estimated
number of poor
persons
Ashanti 4,671,948 13.6 0.0035 3.8 0.0015 1.6 0.0008 37.3 636,787
Atwima Mponua 118,040 12.9 0.0127 3.0 0.0040 1.1 0.0018 32.5 15,204
Amansie West 132,443 9.6 0.0136 2.1 0.0040 0.7 0.0016 32.0 12,701
Amansie Central 89,350 19.8 0.0164 4.9 0.0061 1.8 0.0029 33.1 17,727
Adansi South 113,145 21.9 0.0166 5.7 0.0060 2.2 0.0029 33.2 24,733
Obuasi Municipal 165,052 5.3 0.0073 1.3 0.0022 0.5 0.0010 38.0 8,682
Adansi North 105,324 18.4 0.0140 4.8 0.0050 1.9 0.0024 34.9 19,411
Bekwai Municipal 115,445 29.8 0.0125 8.9 0.0055 3.8 0.0030 36.3 34,380
Bosome Freho 59,405 37.6 0.0170 11.6 0.0079 5.0 0.0044 33.6 22,336
Asante Akim South 115,289 22.0 0.0135 6.1 0.0052 2.5 0.0027 36.0 25,398
Asante Akim Central Municipal 70,583 11.5 0.0117 3.0 0.0036 1.2 0.0016 36.1 8,089
Ejisu Juaben Municipal 141,177 20.9 0.0116 5.5 0.0042 2.2 0.0020 33.3 29,520
Bosumtwi 92,253 5.8 0.0078 1.2 0.0023 0.4 0.0010 32.3 5,323
Atwima Kwanwoma 89,249 4.9 0.0065 1.1 0.0019 0.4 0.0009 32.9 4,373
Kumasi Metropolis 1,674,853 5.3 0.0039 1.2 0.0013 0.4 0.0006 33.9 88,935
Kwadaso 241,467 5.2 0.0059 1.2 0.0016 0.4 0.0007 34.7 12,629
Nhyiaeso 132,345 4.3 0.0075 0.9 0.0021 0.3 0.0009 33.3 5,731
Subin 170,580 5.2 0.0057 1.1 0.0018 0.4 0.0008 33.5 8,921
Asokwa 137,071 1.9 0.0031 0.4 0.0008 0.1 0.0003 31.8 2,618
Oforikrom 284,533 11.2 0.0091 2.7 0.0030 1.0 0.0014 33.0 31,811
Manhyia 156,178 4.3 0.0047 0.9 0.0014 0.3 0.0006 35.2 6,653
Old Tafo 143,698 5.2 0.0067 1.1 0.0018 0.4 0.0008 31.9 7,472
Suame 157,623 4.6 0.0070 1.0 0.0018 0.3 0.0007 32.0 7,298
Bantama 251,358 2.4 0.0038 0.5 0.0010 0.2 0.0004 31.5 5,982
Atwima Nwabiagya 146,076 13.3 0.0098 3.4 0.0034 1.3 0.0016 33.5 19,355
Ahafo Ano South 120,320 14.1 0.0126 3.3 0.0040 1.2 0.0017 32.5 16,977
Ahafo Ano North 92,924 46.4 0.0208 16.4 0.0109 7.8 0.0066 37.1 43,070
Offinso Municipal 76,177 40.0 0.0167 12.2 0.0076 5.2 0.0043 32.0 30,494
Afigya Kwabre 133,696 4.0 0.0053 0.9 0.0014 0.3 0.0006 34.3 5,334
Kwabre East 113,350 6.2 0.0067 1.4 0.0020 0.5 0.0009 32.7 7,016
Afigya Sekyere 91,819 25.2 0.0142 7.2 0.0057 3.0 0.0029 33.9 23,111
Mampong Municipal 86,190 29.5 0.0136 8.9 0.0059 3.8 0.0031 35.7 25,417
Sekyere East 61,136 17.4 0.0122 4.8 0.0045 1.9 0.0023 35.0 10,607
Sekyere Afram Plains 64,469 28.9 0.0183 7.9 0.0068 3.1 0.0032 32.4 18,638
Sekyere Central 70,574 22.8 0.0185 6.0 0.0076 2.3 0.0038 35.3 16,119
Ejura Sekye Dumasi 83,939 47.0 0.0189 17.0 0.0097 8.2 0.0059 37.0 39,451
Offinso North 55,814 29.4 0.0250 8.2 0.0097 3.3 0.0048 32.6 16,415
Asokore Mampong Municipal 297,321 3.3 0.0050 0.7 0.0015 0.2 0.0006 32.6 9,663
Asante Akim North 68,423 26.3 0.0129 7.8 0.0056 3.3 0.0030 36.4 17,961
Sekyere Afram Plains North 28,112 59.6 0.0298 24.3 0.0155 12.6 0.0103 49.8 16,763
Source: Ghana Statistical Service, 2010 Population and Housing Census and GLSS6
48
Table A1.7: Poverty and Inequality Estimates of Brong Ahafo Region by District
(Poverty line= GH₵1,314)
Region/District
Household
Population
Poverty
head count
(P0)
Standard
error
Poverty depth
(P1)
Standard
error
Poverty severity
(P2)
Standard
error
Gini
coefficient
Estimated
number of poor
persons
Brong Ahafo 2,265,434 28.6 0.0036
9.5 0.0016
4.4 0.0009 49.4 648,367
Asunafo South 94,603 13.9 0.0092
3.9 0.0036
1.6 0.0018 48.1 13,140
Asunafo North Municipal 123,134 12.0 0.0079
3.0 0.0026
1.1 0.0011 40.4 14,739
Asutifi North 51,524 35.4 0.0105
12.2 0.0053
5.7 0.0033 42.1 18,250
Dormaa Municipal 109,965 11.4 0.0090
2.8 0.0027
1.1 0.0012 45.1 12,492
Dormaa East 50,137 35.3 0.0121
11.2 0.0050
4.9 0.0027 47.5 17,693
Tano South 77,185 38.0 0.0096
12.4 0.0041
5.6 0.0023 40.3 29,315
Tano North 78,784 20.8 0.0080
5.9 0.0032
2.4 0.0016 40.7 16,411
Sunyani Municipal 110,722 19.4 0.0076
6.4 0.0033
3.0 0.0018 64.0 21,524
Sunyani West 84,630 29.5 0.0143
8.7 0.0057
3.7 0.0030 44.5 24,957
Berekum Municipal 125,800 28.0 0.0091
7.8 0.0036
3.1 0.0018 39.8 35,199
Jaman South 90,856 20.5 0.0102
5.5 0.0035
2.2 0.0017 46.5 18,607
Jaman North 82,074 18.8 0.0148
5.5 0.0049
2.3 0.0023 51.1 15,413
Tain 87,245 38.2 0.0142
13.0 0.0067
6.0 0.0038 43.2 33,362
Wenchi Municipal 88,209 41.2 0.0141
14.9 0.0068
7.3 0.0041 51.7 36,307
Techiman Municipal 145,309 14.2 0.0074
3.8 0.0024
1.5 0.0011 40.3 20,576
Nkoranza South 100,268 36.1 0.0102
11.3 0.0045
4.9 0.0024 38.3 36,217
Nkoranza North 65,222 30.9 0.0119
10.0 0.0056
4.5 0.0032 42.9 20,121
Atebubu Amantin 104,244 33.3 0.0091
11.4 0.0041
5.4 0.0024 48.2 34,703
Sene West 57,049 45.8 0.0181
14.5 0.0104
6.5 0.0063 34.0 26,106
Pru 127,069 43.1 0.0100
14.9 0.0058
7.0 0.0036 41.9 54,818
Kintampo South 80,344 78.3 0.0127
35.8 0.0097
19.8 0.0069 35.9 62,893
Kintampo North Municipal 94,479 31.8 0.0115
10.6 0.0045
5.0 0.0023 44.7 30,082
Asutifi South 50,430 21.3 0.0091
6.1 0.0036
2.5 0.0020 53.4 10,742
Dormaa West 46,909 9.9 0.0081
2.5 0.0022
1.1 0.0009 48.1 4,639
Techiman North 58,701 15.7 0.0098
4.2 0.0030
1.7 0.0014 39.0 9,216
Banda 20,171 78.0 0.0134
37.9 0.0104
21.8 0.0077 42.0 15,735
Sene East 60,371 29.3 0.0128
10.5 0.0066
5.2 0.0039 44.4 17,683
Source: Ghana Statistical Service, 2010 Population and Housing Census and GLSS6
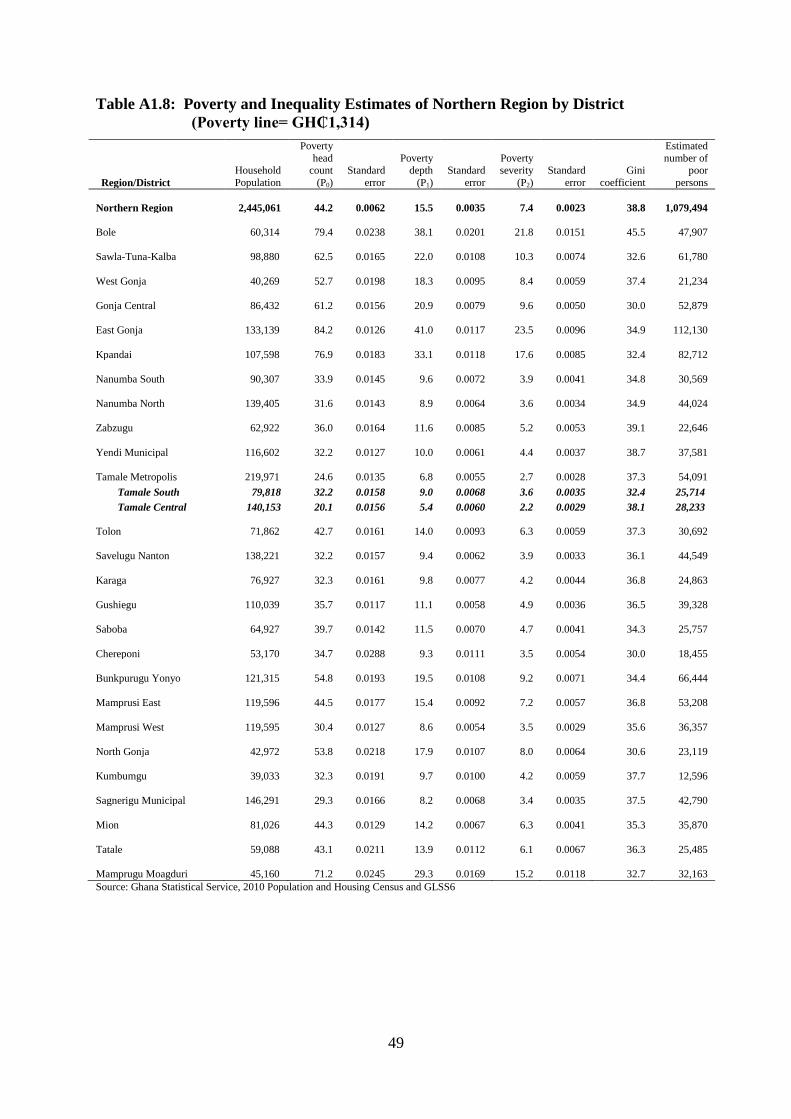
49
Table A1.8: Poverty and Inequality Estimates of Northern Region by District
(Poverty line= GH₵1,314)
Region/District
Household
Population
Poverty
head count
(P0)
Standard
error
Poverty depth
(P1)
Standard
error
Poverty severity
(P2)
Standard
error
Gini
coefficient
Estimated
number of poor
persons
Northern Region 2,445,061 44.2 0.0062
15.5 0.0035
7.4 0.0023 38.8 1,079,494
Bole 60,314 79.4 0.0238
38.1 0.0201
21.8 0.0151 45.5 47,907
Sawla-Tuna-Kalba 98,880 62.5 0.0165
22.0 0.0108
10.3 0.0074 32.6 61,780
West Gonja 40,269 52.7 0.0198
18.3 0.0095
8.4 0.0059 37.4 21,234
Gonja Central 86,432 61.2 0.0156
20.9 0.0079
9.6 0.0050 30.0 52,879
East Gonja 133,139 84.2 0.0126
41.0 0.0117
23.5 0.0096 34.9 112,130
Kpandai 107,598 76.9 0.0183
33.1 0.0118
17.6 0.0085 32.4 82,712
Nanumba South 90,307 33.9 0.0145
9.6 0.0072
3.9 0.0041 34.8 30,569
Nanumba North 139,405 31.6 0.0143
8.9 0.0064
3.6 0.0034 34.9 44,024
Zabzugu 62,922 36.0 0.0164
11.6 0.0085
5.2 0.0053 39.1 22,646
Yendi Municipal 116,602 32.2 0.0127
10.0 0.0061
4.4 0.0037 38.7 37,581
Tamale Metropolis 219,971 24.6 0.0135
6.8 0.0055
2.7 0.0028 37.3 54,091
Tamale South 79,818 32.2 0.0158 9.0 0.0068 3.6 0.0035 32.4 25,714
Tamale Central 140,153 20.1 0.0156 5.4 0.0060 2.2 0.0029 38.1 28,233
Tolon 71,862 42.7 0.0161
14.0 0.0093
6.3 0.0059 37.3 30,692
Savelugu Nanton 138,221 32.2 0.0157
9.4 0.0062
3.9 0.0033 36.1 44,549
Karaga 76,927 32.3 0.0161
9.8 0.0077
4.2 0.0044 36.8 24,863
Gushiegu 110,039 35.7 0.0117
11.1 0.0058
4.9 0.0036 36.5 39,328
Saboba 64,927 39.7 0.0142
11.5 0.0070
4.7 0.0041 34.3 25,757
Chereponi 53,170 34.7 0.0288
9.3 0.0111
3.5 0.0054 30.0 18,455
Bunkpurugu Yonyo 121,315 54.8 0.0193
19.5 0.0108
9.2 0.0071 34.4 66,444
Mamprusi East 119,596 44.5 0.0177
15.4 0.0092
7.2 0.0057 36.8 53,208
Mamprusi West 119,595 30.4 0.0127
8.6 0.0054
3.5 0.0029 35.6 36,357
North Gonja 42,972 53.8 0.0218
17.9 0.0107
8.0 0.0064 30.6 23,119
Kumbumgu 39,033 32.3 0.0191
9.7 0.0100
4.2 0.0059 37.7 12,596
Sagnerigu Municipal 146,291 29.3 0.0166
8.2 0.0068
3.4 0.0035 37.5 42,790
Mion 81,026 44.3 0.0129
14.2 0.0067
6.3 0.0041 35.3 35,870
Tatale 59,088 43.1 0.0211
13.9 0.0112
6.1 0.0067 36.3 25,485
Mamprugu Moagduri 45,160 71.2 0.0245
29.3 0.0169
15.2 0.0118 32.7 32,163
Source: Ghana Statistical Service, 2010 Population and Housing Census and GLSS6
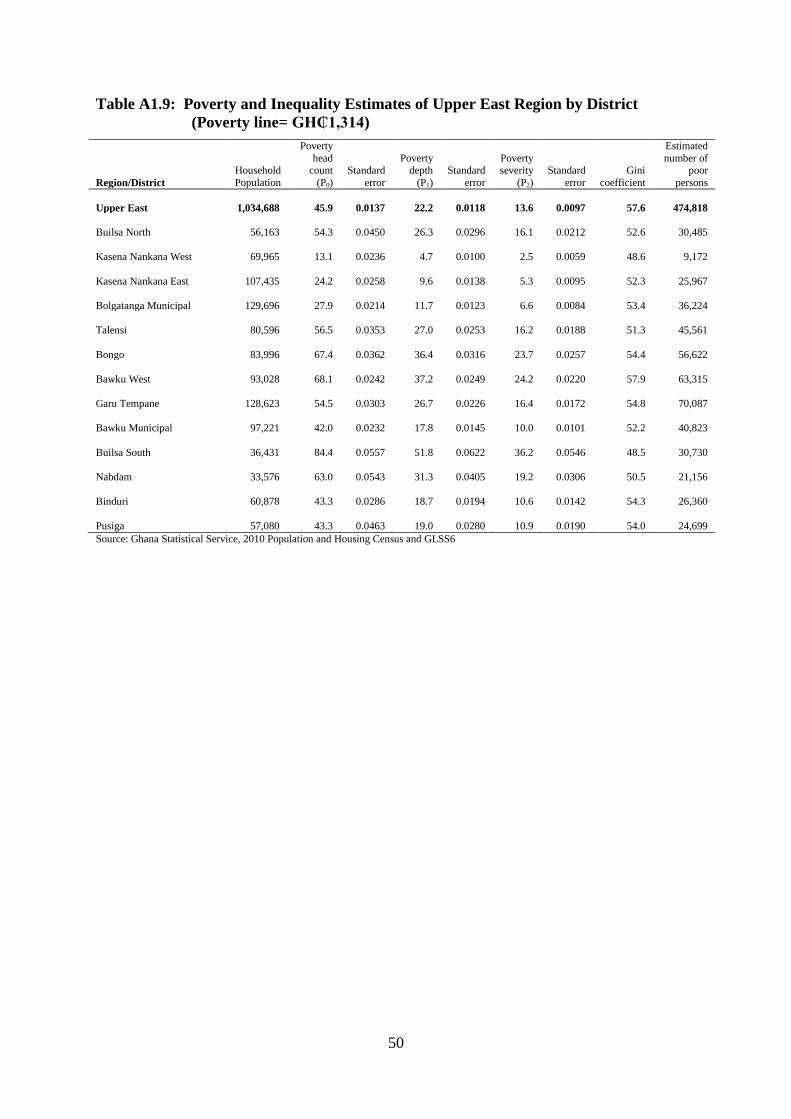
50
Table A1.9: Poverty and Inequality Estimates of Upper East Region by District
(Poverty line= GH₵1,314)
Region/District
Household
Population
Poverty
head count
(P0)
Standard
error
Poverty depth
(P1)
Standard
error
Poverty severity
(P2)
Standard
error
Gini
coefficient
Estimated
number of poor
persons
Upper East 1,034,688 45.9 0.0137
22.2 0.0118
13.6 0.0097 57.6 474,818
Builsa North 56,163 54.3 0.0450
26.3 0.0296
16.1 0.0212 52.6 30,485
Kasena Nankana West 69,965 13.1 0.0236
4.7 0.0100
2.5 0.0059 48.6 9,172
Kasena Nankana East 107,435 24.2 0.0258
9.6 0.0138
5.3 0.0095 52.3 25,967
Bolgatanga Municipal 129,696 27.9 0.0214
11.7 0.0123
6.6 0.0084 53.4 36,224
Talensi 80,596 56.5 0.0353
27.0 0.0253
16.2 0.0188 51.3 45,561
Bongo 83,996 67.4 0.0362
36.4 0.0316
23.7 0.0257 54.4 56,622
Bawku West 93,028 68.1 0.0242
37.2 0.0249
24.2 0.0220 57.9 63,315
Garu Tempane 128,623 54.5 0.0303
26.7 0.0226
16.4 0.0172 54.8 70,087
Bawku Municipal 97,221 42.0 0.0232
17.8 0.0145
10.0 0.0101 52.2 40,823
Builsa South 36,431 84.4 0.0557
51.8 0.0622
36.2 0.0546 48.5 30,730
Nabdam 33,576 63.0 0.0543
31.3 0.0405
19.2 0.0306 50.5 21,156
Binduri 60,878 43.3 0.0286
18.7 0.0194
10.6 0.0142 54.3 26,360
Pusiga 57,080 43.3 0.0463
19.0 0.0280
10.9 0.0190 54.0 24,699
Source: Ghana Statistical Service, 2010 Population and Housing Census and GLSS6
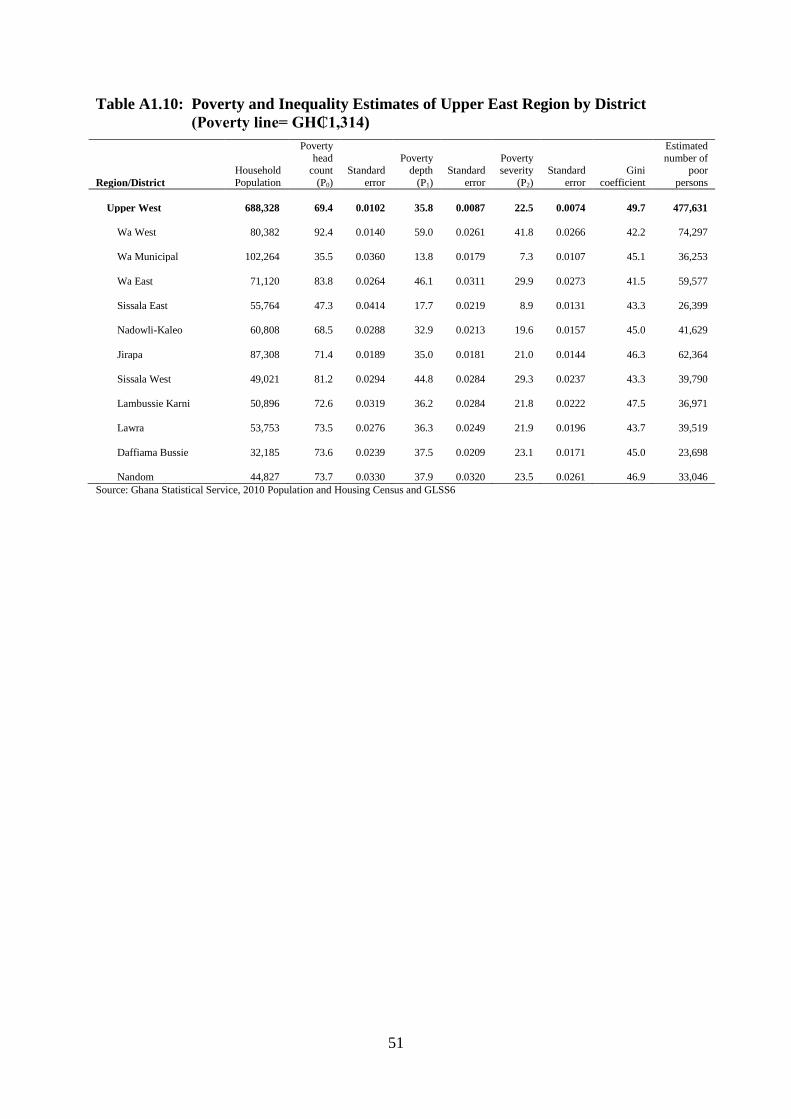
51
Table A1.10: Poverty and Inequality Estimates of Upper East Region by District
(Poverty line= GH₵1,314)
Region/District
Household
Population
Poverty
head count
(P0)
Standard
error
Poverty depth
(P1)
Standard
error
Poverty severity
(P2)
Standard
error
Gini
coefficient
Estimated
number of poor
persons
Upper West 688,328 69.4 0.0102
35.8 0.0087
22.5 0.0074 49.7 477,631
Wa West 80,382 92.4 0.0140
59.0 0.0261
41.8 0.0266 42.2 74,297
Wa Municipal 102,264 35.5 0.0360
13.8 0.0179
7.3 0.0107 45.1 36,253
Wa East 71,120 83.8 0.0264
46.1 0.0311
29.9 0.0273 41.5 59,577
Sissala East 55,764 47.3 0.0414
17.7 0.0219
8.9 0.0131 43.3 26,399
Nadowli-Kaleo 60,808 68.5 0.0288
32.9 0.0213
19.6 0.0157 45.0 41,629
Jirapa 87,308 71.4 0.0189
35.0 0.0181
21.0 0.0144 46.3 62,364
Sissala West 49,021 81.2 0.0294
44.8 0.0284
29.3 0.0237 43.3 39,790
Lambussie Karni 50,896 72.6 0.0319
36.2 0.0284
21.8 0.0222 47.5 36,971
Lawra 53,753 73.5 0.0276
36.3 0.0249
21.9 0.0196 43.7 39,519
Daffiama Bussie 32,185 73.6 0.0239
37.5 0.0209
23.1 0.0171 45.0 23,698
Nandom 44,827 73.7 0.0330
37.9 0.0320
23.5 0.0261 46.9 33,046
Source: Ghana Statistical Service, 2010 Population and Housing Census and GLSS6
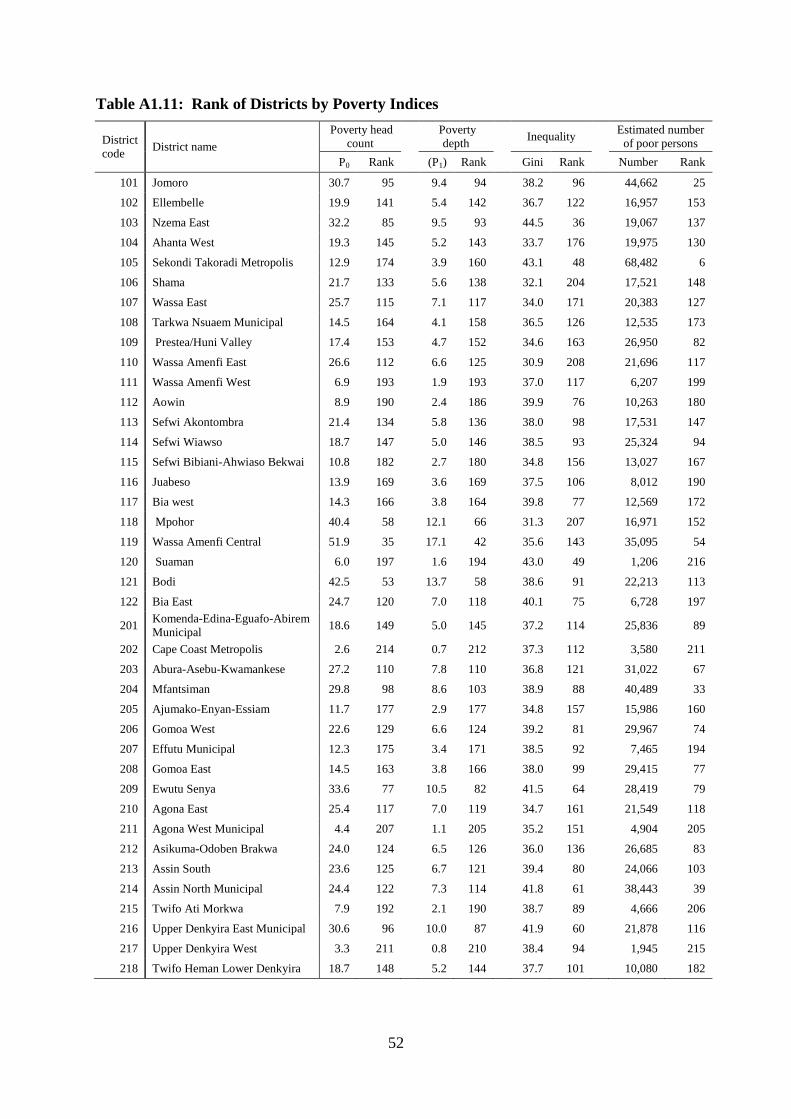
52
Table A1.11: Rank of Districts by Poverty Indices
District
code District name
Poverty head
count
Poverty
depth Inequality
Estimated number
of poor persons
P0 Rank (P1) Rank Gini Rank Number Rank
101 Jomoro 30.7 95
9.4 94
38.2 96
44,662 25
102 Ellembelle 19.9 141
5.4 142
36.7 122
16,957 153
103 Nzema East 32.2 85
9.5 93
44.5 36
19,067 137
104 Ahanta West 19.3 145
5.2 143
33.7 176
19,975 130
105 Sekondi Takoradi Metropolis 12.9 174
3.9 160
43.1 48
68,482 6
106 Shama 21.7 133
5.6 138
32.1 204
17,521 148
107 Wassa East 25.7 115
7.1 117
34.0 171
20,383 127
108 Tarkwa Nsuaem Municipal 14.5 164
4.1 158
36.5 126
12,535 173
109 Prestea/Huni Valley 17.4 153
4.7 152
34.6 163
26,950 82
110 Wassa Amenfi East 26.6 112
6.6 125
30.9 208
21,696 117
111 Wassa Amenfi West 6.9 193
1.9 193
37.0 117
6,207 199
112 Aowin 8.9 190
2.4 186
39.9 76
10,263 180
113 Sefwi Akontombra 21.4 134
5.8 136
38.0 98
17,531 147
114 Sefwi Wiawso 18.7 147
5.0 146
38.5 93
25,324 94
115 Sefwi Bibiani-Ahwiaso Bekwai 10.8 182
2.7 180
34.8 156
13,027 167
116 Juabeso 13.9 169
3.6 169
37.5 106
8,012 190
117 Bia west 14.3 166
3.8 164
39.8 77
12,569 172
118 Mpohor 40.4 58
12.1 66
31.3 207
16,971 152
119 Wassa Amenfi Central 51.9 35
17.1 42
35.6 143
35,095 54
120 Suaman 6.0 197
1.6 194
43.0 49
1,206 216
121 Bodi 42.5 53
13.7 58
38.6 91
22,213 113
122 Bia East 24.7 120
7.0 118
40.1 75
6,728 197
201 Komenda-Edina-Eguafo-Abirem
Municipal 18.6 149
5.0 145
37.2 114
25,836 89
202 Cape Coast Metropolis 2.6 214
0.7 212
37.3 112
3,580 211
203 Abura-Asebu-Kwamankese 27.2 110
7.8 110
36.8 121
31,022 67
204 Mfantsiman 29.8 98
8.6 103
38.9 88
40,489 33
205 Ajumako-Enyan-Essiam 11.7 177
2.9 177
34.8 157
15,986 160
206 Gomoa West 22.6 129
6.6 124
39.2 81
29,967 74
207 Effutu Municipal 12.3 175
3.4 171
38.5 92
7,465 194
208 Gomoa East 14.5 163
3.8 166
38.0 99
29,415 77
209 Ewutu Senya 33.6 77
10.5 82
41.5 64
28,419 79
210 Agona East 25.4 117
7.0 119
34.7 161
21,549 118
211 Agona West Municipal 4.4 207
1.1 205
35.2 151
4,904 205
212 Asikuma-Odoben Brakwa 24.0 124
6.5 126
36.0 136
26,685 83
213 Assin South 23.6 125
6.7 121
39.4 80
24,066 103
214 Assin North Municipal 24.4 122
7.3 114
41.8 61
38,443 39
215 Twifo Ati Morkwa 7.9 192
2.1 190
38.7 89
4,666 206
216 Upper Denkyira East Municipal 30.6 96
10.0 87
41.9 60
21,878 116
217 Upper Denkyira West 3.3 211
0.8 210
38.4 94
1,945 215
218 Twifo Heman Lower Denkyira 18.7 148
5.2 144
37.7 101
10,080 182
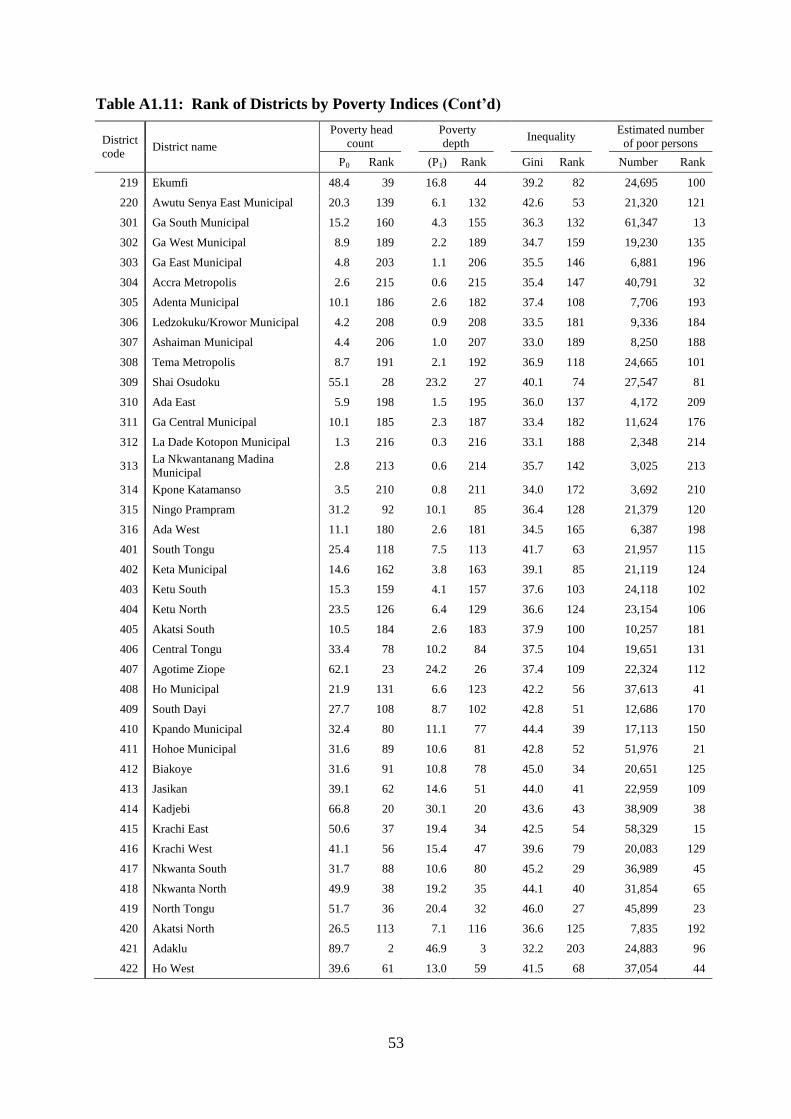
53
Table A1.11: Rank of Districts by Poverty Indices (Cont’d)
District
code District name
Poverty head
count
Poverty
depth Inequality
Estimated number
of poor persons
P0 Rank (P1) Rank Gini Rank Number Rank
219 Ekumfi 48.4 39
16.8 44
39.2 82
24,695 100
220 Awutu Senya East Municipal 20.3 139
6.1 132
42.6 53
21,320 121
301 Ga South Municipal 15.2 160
4.3 155
36.3 132
61,347 13
302 Ga West Municipal 8.9 189
2.2 189
34.7 159
19,230 135
303 Ga East Municipal 4.8 203
1.1 206
35.5 146
6,881 196
304 Accra Metropolis 2.6 215
0.6 215
35.4 147
40,791 32
305 Adenta Municipal 10.1 186
2.6 182
37.4 108
7,706 193
306 Ledzokuku/Krowor Municipal 4.2 208
0.9 208
33.5 181
9,336 184
307 Ashaiman Municipal 4.4 206
1.0 207
33.0 189
8,250 188
308 Tema Metropolis 8.7 191
2.1 192
36.9 118
24,665 101
309 Shai Osudoku 55.1 28
23.2 27
40.1 74
27,547 81
310 Ada East 5.9 198
1.5 195
36.0 137
4,172 209
311 Ga Central Municipal 10.1 185
2.3 187
33.4 182
11,624 176
312 La Dade Kotopon Municipal 1.3 216
0.3 216
33.1 188
2,348 214
313 La Nkwantanang Madina
Municipal 2.8 213
0.6 214
35.7 142
3,025 213
314 Kpone Katamanso 3.5 210
0.8 211
34.0 172
3,692 210
315 Ningo Prampram 31.2 92
10.1 85
36.4 128
21,379 120
316 Ada West 11.1 180
2.6 181
34.5 165
6,387 198
401 South Tongu 25.4 118
7.5 113
41.7 63
21,957 115
402 Keta Municipal 14.6 162
3.8 163
39.1 85
21,119 124
403 Ketu South 15.3 159
4.1 157
37.6 103
24,118 102
404 Ketu North 23.5 126
6.4 129
36.6 124
23,154 106
405 Akatsi South 10.5 184
2.6 183
37.9 100
10,257 181
406 Central Tongu 33.4 78
10.2 84
37.5 104
19,651 131
407 Agotime Ziope 62.1 23
24.2 26
37.4 109
22,324 112
408 Ho Municipal 21.9 131
6.6 123
42.2 56
37,613 41
409 South Dayi 27.7 108
8.7 102
42.8 51
12,686 170
410 Kpando Municipal 32.4 80
11.1 77
44.4 39
17,113 150
411 Hohoe Municipal 31.6 89
10.6 81
42.8 52
51,976 21
412 Biakoye 31.6 91
10.8 78
45.0 34
20,651 125
413 Jasikan 39.1 62
14.6 51
44.0 41
22,959 109
414 Kadjebi 66.8 20
30.1 20
43.6 43
38,909 38
415 Krachi East 50.6 37
19.4 34
42.5 54
58,329 15
416 Krachi West 41.1 56
15.4 47
39.6 79
20,083 129
417 Nkwanta South 31.7 88
10.6 80
45.2 29
36,989 45
418 Nkwanta North 49.9 38
19.2 35
44.1 40
31,854 65
419 North Tongu 51.7 36
20.4 32
46.0 27
45,899 23
420 Akatsi North 26.5 113
7.1 116
36.6 125
7,835 192
421 Adaklu 89.7 2
46.9 3
32.2 203
24,883 96
422 Ho West 39.6 61
13.0 59
41.5 68
37,054 44
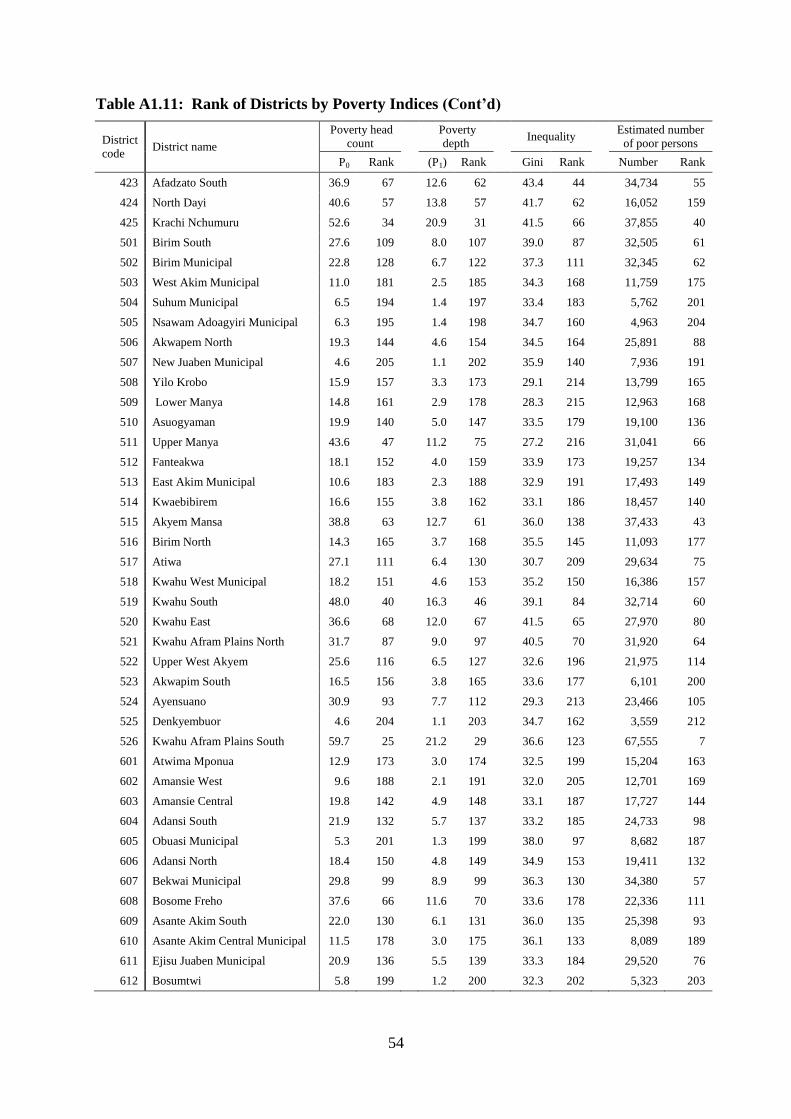
54
Table A1.11: Rank of Districts by Poverty Indices (Cont’d)
District
code District name
Poverty head
count
Poverty
depth Inequality
Estimated number
of poor persons
P0 Rank (P1) Rank Gini Rank Number Rank
423 Afadzato South 36.9 67
12.6 62
43.4 44
34,734 55
424 North Dayi 40.6 57
13.8 57
41.7 62
16,052 159
425 Krachi Nchumuru 52.6 34
20.9 31
41.5 66
37,855 40
501 Birim South 27.6 109
8.0 107
39.0 87
32,505 61
502 Birim Municipal 22.8 128
6.7 122
37.3 111
32,345 62
503 West Akim Municipal 11.0 181
2.5 185
34.3 168
11,759 175
504 Suhum Municipal 6.5 194
1.4 197
33.4 183
5,762 201
505 Nsawam Adoagyiri Municipal 6.3 195
1.4 198
34.7 160
4,963 204
506 Akwapem North 19.3 144
4.6 154
34.5 164
25,891 88
507 New Juaben Municipal 4.6 205
1.1 202
35.9 140
7,936 191
508 Yilo Krobo 15.9 157
3.3 173
29.1 214
13,799 165
509 Lower Manya 14.8 161
2.9 178
28.3 215
12,963 168
510 Asuogyaman 19.9 140
5.0 147
33.5 179
19,100 136
511 Upper Manya 43.6 47
11.2 75
27.2 216
31,041 66
512 Fanteakwa 18.1 152
4.0 159
33.9 173
19,257 134
513 East Akim Municipal 10.6 183
2.3 188
32.9 191
17,493 149
514 Kwaebibirem 16.6 155
3.8 162
33.1 186
18,457 140
515 Akyem Mansa 38.8 63
12.7 61
36.0 138
37,433 43
516 Birim North 14.3 165
3.7 168
35.5 145
11,093 177
517 Atiwa 27.1 111
6.4 130
30.7 209
29,634 75
518 Kwahu West Municipal 18.2 151
4.6 153
35.2 150
16,386 157
519 Kwahu South 48.0 40
16.3 46
39.1 84
32,714 60
520 Kwahu East 36.6 68
12.0 67
41.5 65
27,970 80
521 Kwahu Afram Plains North 31.7 87
9.0 97
40.5 70
31,920 64
522 Upper West Akyem 25.6 116
6.5 127
32.6 196
21,975 114
523 Akwapim South 16.5 156
3.8 165
33.6 177
6,101 200
524 Ayensuano 30.9 93
7.7 112
29.3 213
23,466 105
525 Denkyembuor 4.6 204
1.1 203
34.7 162
3,559 212
526 Kwahu Afram Plains South 59.7 25
21.2 29
36.6 123
67,555 7
601 Atwima Mponua 12.9 173
3.0 174
32.5 199
15,204 163
602 Amansie West 9.6 188
2.1 191
32.0 205
12,701 169
603 Amansie Central 19.8 142
4.9 148
33.1 187
17,727 144
604 Adansi South 21.9 132
5.7 137
33.2 185
24,733 98
605 Obuasi Municipal 5.3 201
1.3 199
38.0 97
8,682 187
606 Adansi North 18.4 150
4.8 149
34.9 153
19,411 132
607 Bekwai Municipal 29.8 99
8.9 99
36.3 130
34,380 57
608 Bosome Freho 37.6 66
11.6 70
33.6 178
22,336 111
609 Asante Akim South 22.0 130
6.1 131
36.0 135
25,398 93
610 Asante Akim Central Municipal 11.5 178
3.0 175
36.1 133
8,089 189
611 Ejisu Juaben Municipal 20.9 136
5.5 139
33.3 184
29,520 76
612 Bosumtwi 5.8 199
1.2 200
32.3 202
5,323 203
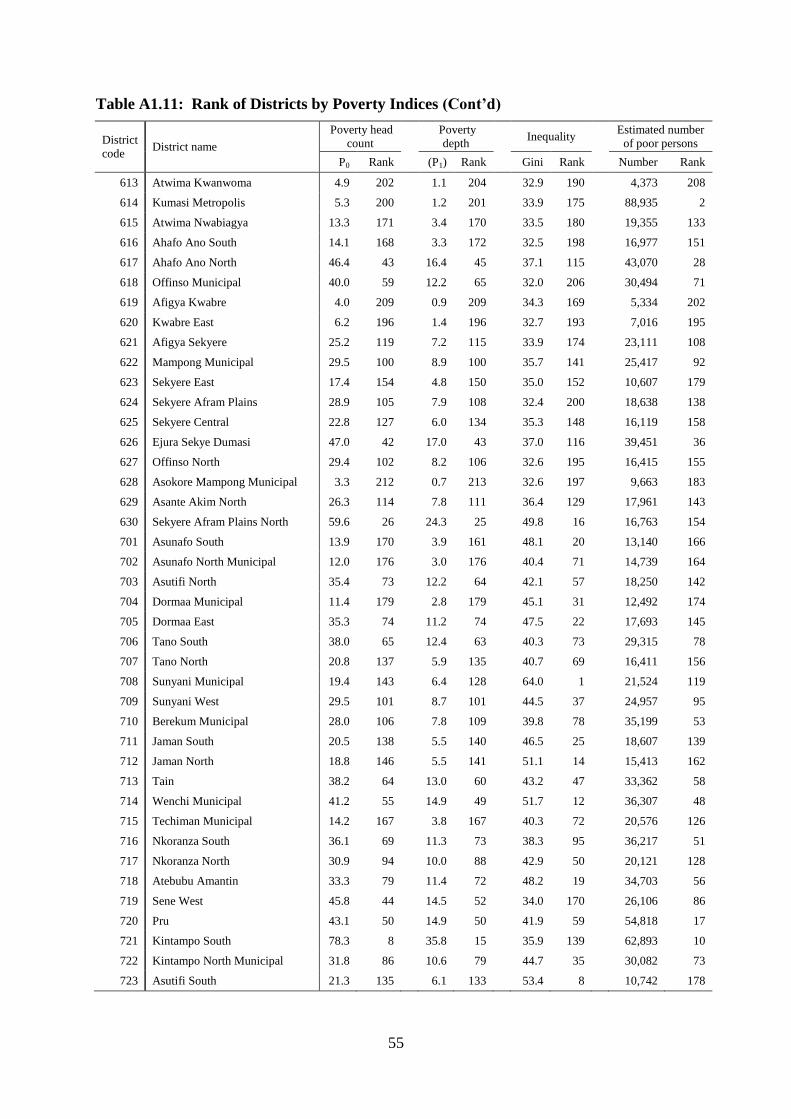
55
Table A1.11: Rank of Districts by Poverty Indices (Cont’d)
District
code District name
Poverty head
count
Poverty
depth Inequality
Estimated number
of poor persons
P0 Rank (P1) Rank Gini Rank Number Rank
613 Atwima Kwanwoma 4.9 202
1.1 204
32.9 190
4,373 208
614 Kumasi Metropolis 5.3 200
1.2 201
33.9 175
88,935 2
615 Atwima Nwabiagya 13.3 171
3.4 170
33.5 180
19,355 133
616 Ahafo Ano South 14.1 168
3.3 172
32.5 198
16,977 151
617 Ahafo Ano North 46.4 43
16.4 45
37.1 115
43,070 28
618 Offinso Municipal 40.0 59
12.2 65
32.0 206
30,494 71
619 Afigya Kwabre 4.0 209
0.9 209
34.3 169
5,334 202
620 Kwabre East 6.2 196
1.4 196
32.7 193
7,016 195
621 Afigya Sekyere 25.2 119
7.2 115
33.9 174
23,111 108
622 Mampong Municipal 29.5 100
8.9 100
35.7 141
25,417 92
623 Sekyere East 17.4 154
4.8 150
35.0 152
10,607 179
624 Sekyere Afram Plains 28.9 105
7.9 108
32.4 200
18,638 138
625 Sekyere Central 22.8 127
6.0 134
35.3 148
16,119 158
626 Ejura Sekye Dumasi 47.0 42
17.0 43
37.0 116
39,451 36
627 Offinso North 29.4 102
8.2 106
32.6 195
16,415 155
628 Asokore Mampong Municipal 3.3 212
0.7 213
32.6 197
9,663 183
629 Asante Akim North 26.3 114
7.8 111
36.4 129
17,961 143
630 Sekyere Afram Plains North 59.6 26
24.3 25
49.8 16
16,763 154
701 Asunafo South 13.9 170
3.9 161
48.1 20
13,140 166
702 Asunafo North Municipal 12.0 176
3.0 176
40.4 71
14,739 164
703 Asutifi North 35.4 73
12.2 64
42.1 57
18,250 142
704 Dormaa Municipal 11.4 179
2.8 179
45.1 31
12,492 174
705 Dormaa East 35.3 74
11.2 74
47.5 22
17,693 145
706 Tano South 38.0 65
12.4 63
40.3 73
29,315 78
707 Tano North 20.8 137
5.9 135
40.7 69
16,411 156
708 Sunyani Municipal 19.4 143
6.4 128
64.0 1
21,524 119
709 Sunyani West 29.5 101
8.7 101
44.5 37
24,957 95
710 Berekum Municipal 28.0 106
7.8 109
39.8 78
35,199 53
711 Jaman South 20.5 138
5.5 140
46.5 25
18,607 139
712 Jaman North 18.8 146
5.5 141
51.1 14
15,413 162
713 Tain 38.2 64
13.0 60
43.2 47
33,362 58
714 Wenchi Municipal 41.2 55
14.9 49
51.7 12
36,307 48
715 Techiman Municipal 14.2 167
3.8 167
40.3 72
20,576 126
716 Nkoranza South 36.1 69
11.3 73
38.3 95
36,217 51
717 Nkoranza North 30.9 94
10.0 88
42.9 50
20,121 128
718 Atebubu Amantin 33.3 79
11.4 72
48.2 19
34,703 56
719 Sene West 45.8 44
14.5 52
34.0 170
26,106 86
720 Pru 43.1 50
14.9 50
41.9 59
54,818 17
721 Kintampo South 78.3 8
35.8 15
35.9 139
62,893 10
722 Kintampo North Municipal 31.8 86
10.6 79
44.7 35
30,082 73
723 Asutifi South 21.3 135
6.1 133
53.4 8
10,742 178
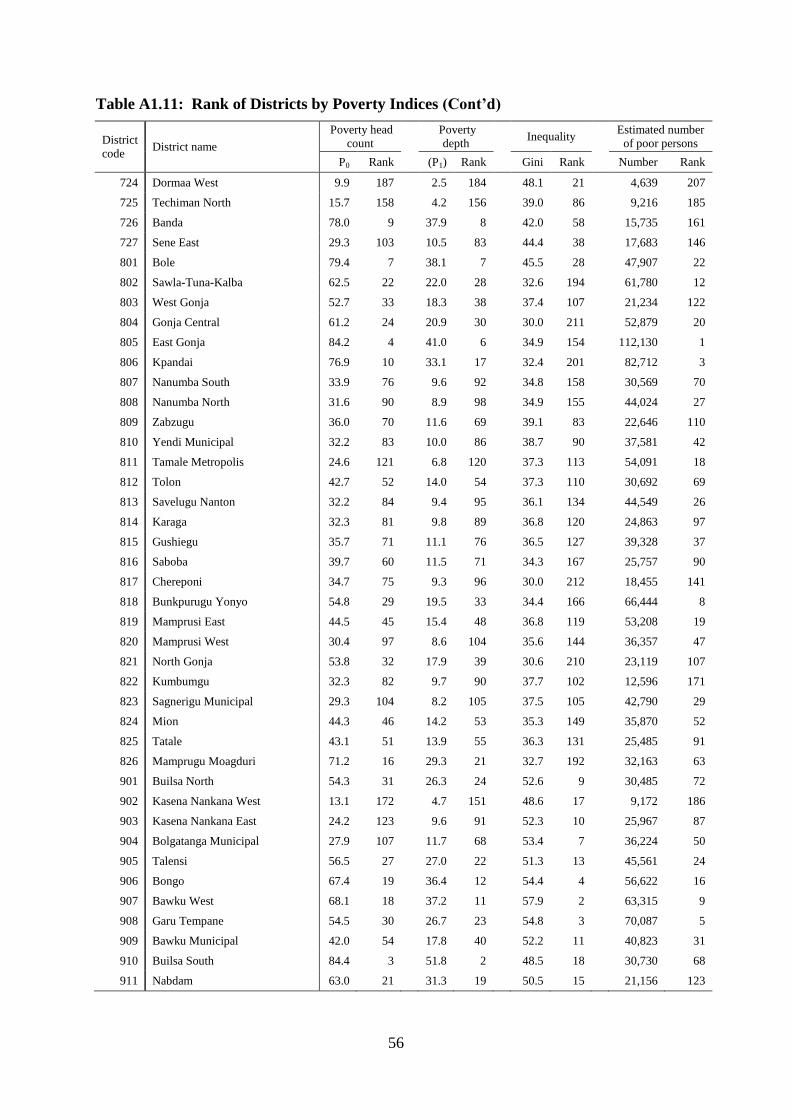
56
Table A1.11: Rank of Districts by Poverty Indices (Cont’d)
District
code District name
Poverty head
count
Poverty
depth Inequality
Estimated number
of poor persons
P0 Rank (P1) Rank Gini Rank Number Rank
724 Dormaa West 9.9 187
2.5 184
48.1 21
4,639 207
725 Techiman North 15.7 158
4.2 156
39.0 86
9,216 185
726 Banda 78.0 9
37.9 8
42.0 58
15,735 161
727 Sene East 29.3 103
10.5 83
44.4 38
17,683 146
801 Bole 79.4 7
38.1 7
45.5 28
47,907 22
802 Sawla-Tuna-Kalba 62.5 22
22.0 28
32.6 194
61,780 12
803 West Gonja 52.7 33
18.3 38
37.4 107
21,234 122
804 Gonja Central 61.2 24
20.9 30
30.0 211
52,879 20
805 East Gonja 84.2 4
41.0 6
34.9 154
112,130 1
806 Kpandai 76.9 10
33.1 17
32.4 201
82,712 3
807 Nanumba South 33.9 76
9.6 92
34.8 158
30,569 70
808 Nanumba North 31.6 90
8.9 98
34.9 155
44,024 27
809 Zabzugu 36.0 70
11.6 69
39.1 83
22,646 110
810 Yendi Municipal 32.2 83
10.0 86
38.7 90
37,581 42
811 Tamale Metropolis 24.6 121
6.8 120
37.3 113
54,091 18
812 Tolon 42.7 52
14.0 54
37.3 110
30,692 69
813 Savelugu Nanton 32.2 84
9.4 95
36.1 134
44,549 26
814 Karaga 32.3 81
9.8 89
36.8 120
24,863 97
815 Gushiegu 35.7 71
11.1 76
36.5 127
39,328 37
816 Saboba 39.7 60
11.5 71
34.3 167
25,757 90
817 Chereponi 34.7 75
9.3 96
30.0 212
18,455 141
818 Bunkpurugu Yonyo 54.8 29
19.5 33
34.4 166
66,444 8
819 Mamprusi East 44.5 45
15.4 48
36.8 119
53,208 19
820 Mamprusi West 30.4 97
8.6 104
35.6 144
36,357 47
821 North Gonja 53.8 32
17.9 39
30.6 210
23,119 107
822 Kumbumgu 32.3 82
9.7 90
37.7 102
12,596 171
823 Sagnerigu Municipal 29.3 104
8.2 105
37.5 105
42,790 29
824 Mion 44.3 46
14.2 53
35.3 149
35,870 52
825 Tatale 43.1 51
13.9 55
36.3 131
25,485 91
826 Mamprugu Moagduri 71.2 16
29.3 21
32.7 192
32,163 63
901 Builsa North 54.3 31
26.3 24
52.6 9
30,485 72
902 Kasena Nankana West 13.1 172
4.7 151
48.6 17
9,172 186
903 Kasena Nankana East 24.2 123
9.6 91
52.3 10
25,967 87
904 Bolgatanga Municipal 27.9 107
11.7 68
53.4 7
36,224 50
905 Talensi 56.5 27
27.0 22
51.3 13
45,561 24
906 Bongo 67.4 19
36.4 12
54.4 4
56,622 16
907 Bawku West 68.1 18
37.2 11
57.9 2
63,315 9
908 Garu Tempane 54.5 30
26.7 23
54.8 3
70,087 5
909 Bawku Municipal 42.0 54
17.8 40
52.2 11
40,823 31
910 Builsa South 84.4 3
51.8 2
48.5 18
30,730 68
911 Nabdam 63.0 21
31.3 19
50.5 15
21,156 123
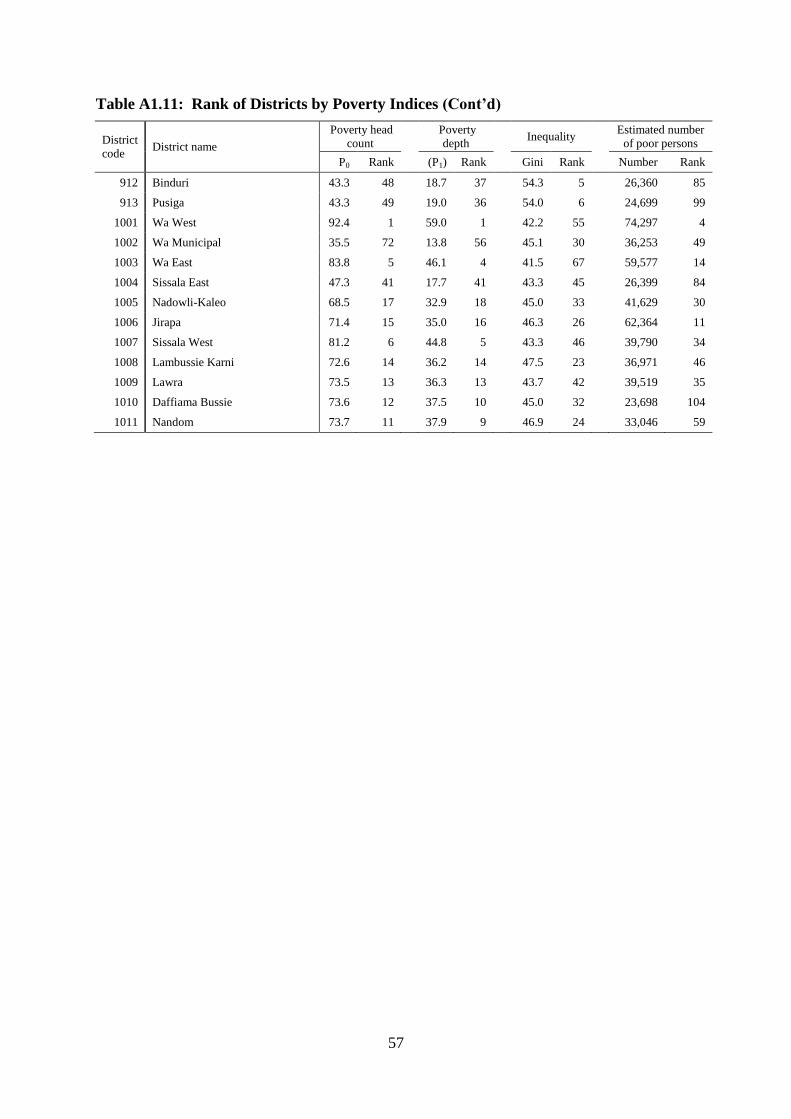
57
Table A1.11: Rank of Districts by Poverty Indices (Cont’d)
District
code District name
Poverty head
count
Poverty
depth Inequality
Estimated number
of poor persons
P0 Rank (P1) Rank Gini Rank Number Rank
912 Binduri 43.3 48
18.7 37
54.3 5
26,360 85
913 Pusiga 43.3 49
19.0 36
54.0 6
24,699 99
1001 Wa West 92.4 1
59.0 1
42.2 55
74,297 4
1002 Wa Municipal 35.5 72
13.8 56
45.1 30
36,253 49
1003 Wa East 83.8 5
46.1 4
41.5 67
59,577 14
1004 Sissala East 47.3 41
17.7 41
43.3 45
26,399 84
1005 Nadowli-Kaleo 68.5 17
32.9 18
45.0 33
41,629 30
1006 Jirapa 71.4 15
35.0 16
46.3 26
62,364 11
1007 Sissala West 81.2 6
44.8 5
43.3 46
39,790 34
1008 Lambussie Karni 72.6 14
36.2 14
47.5 23
36,971 46
1009 Lawra 73.5 13
36.3 13
43.7 42
39,519 35
1010 Daffiama Bussie 73.6 12
37.5 10
45.0 32
23,698 104
1011 Nandom 73.7 11 37.9 9 46.9 24 33,046 59
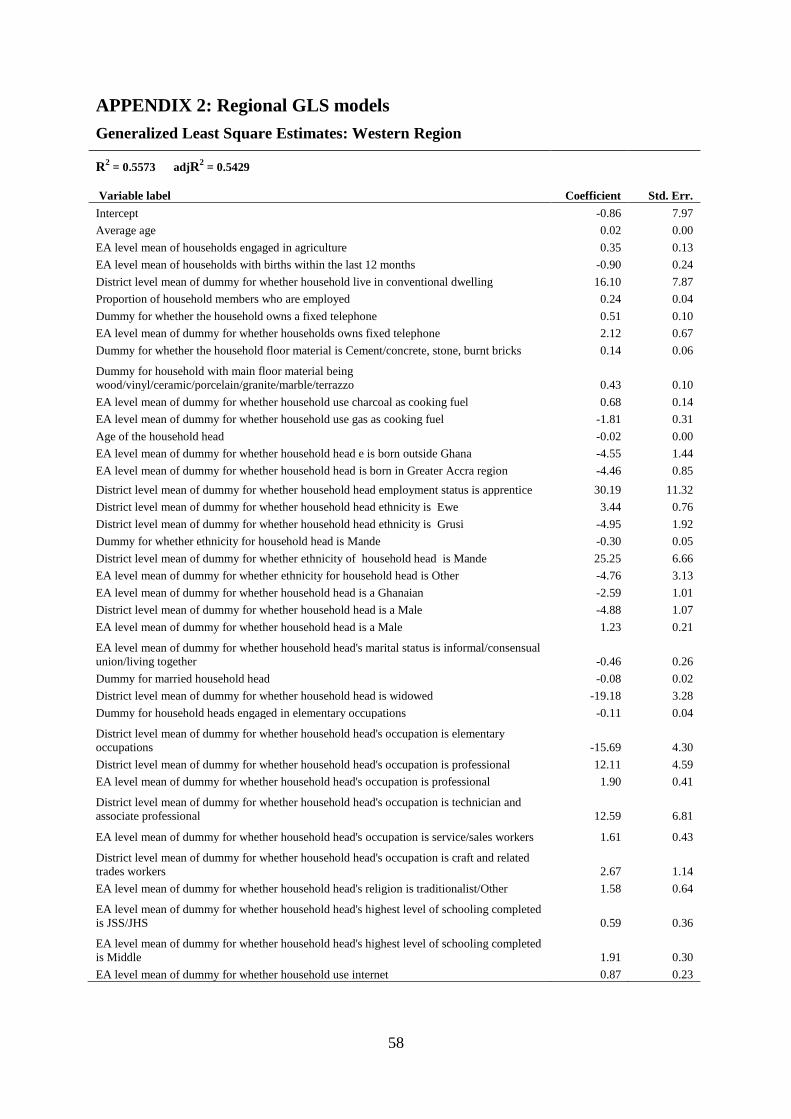
58
APPENDIX 2: Regional GLS models
Generalized Least Square Estimates: Western Region
R2 = 0.5573 adjR
2 = 0.5429
Variable label Coefficient Std. Err.
Intercept -0.86 7.97
Average age 0.02 0.00
EA level mean of households engaged in agriculture 0.35 0.13
EA level mean of households with births within the last 12 months -0.90 0.24
District level mean of dummy for whether household live in conventional dwelling 16.10 7.87
Proportion of household members who are employed 0.24 0.04
Dummy for whether the household owns a fixed telephone 0.51 0.10
EA level mean of dummy for whether households owns fixed telephone 2.12 0.67
Dummy for whether the household floor material is Cement/concrete, stone, burnt bricks 0.14 0.06
Dummy for household with main floor material being
wood/vinyl/ceramic/porcelain/granite/marble/terrazzo 0.43 0.10
EA level mean of dummy for whether household use charcoal as cooking fuel 0.68 0.14
EA level mean of dummy for whether household use gas as cooking fuel -1.81 0.31
Age of the household head -0.02 0.00
EA level mean of dummy for whether household head e is born outside Ghana -4.55 1.44
EA level mean of dummy for whether household head is born in Greater Accra region -4.46 0.85
District level mean of dummy for whether household head employment status is apprentice 30.19 11.32
District level mean of dummy for whether household head ethnicity is Ewe 3.44 0.76
District level mean of dummy for whether household head ethnicity is Grusi -4.95 1.92
Dummy for whether ethnicity for household head is Mande -0.30 0.05
District level mean of dummy for whether ethnicity of household head is Mande 25.25 6.66
EA level mean of dummy for whether ethnicity for household head is Other -4.76 3.13
EA level mean of dummy for whether household head is a Ghanaian -2.59 1.01
District level mean of dummy for whether household head is a Male -4.88 1.07
EA level mean of dummy for whether household head is a Male 1.23 0.21
EA level mean of dummy for whether household head's marital status is informal/consensual
union/living together -0.46 0.26
Dummy for married household head -0.08 0.02
District level mean of dummy for whether household head is widowed -19.18 3.28
Dummy for household heads engaged in elementary occupations -0.11 0.04
District level mean of dummy for whether household head's occupation is elementary
occupations -15.69 4.30
District level mean of dummy for whether household head's occupation is professional 12.11 4.59
EA level mean of dummy for whether household head's occupation is professional 1.90 0.41
District level mean of dummy for whether household head's occupation is technician and
associate professional 12.59 6.81
EA level mean of dummy for whether household head's occupation is service/sales workers 1.61 0.43
District level mean of dummy for whether household head's occupation is craft and related
trades workers 2.67 1.14
EA level mean of dummy for whether household head's religion is traditionalist/Other 1.58 0.64
EA level mean of dummy for whether household head's highest level of schooling completed
is JSS/JHS 0.59 0.36
EA level mean of dummy for whether household head's highest level of schooling completed
is Middle 1.91 0.30
EA level mean of dummy for whether household use internet 0.87 0.23
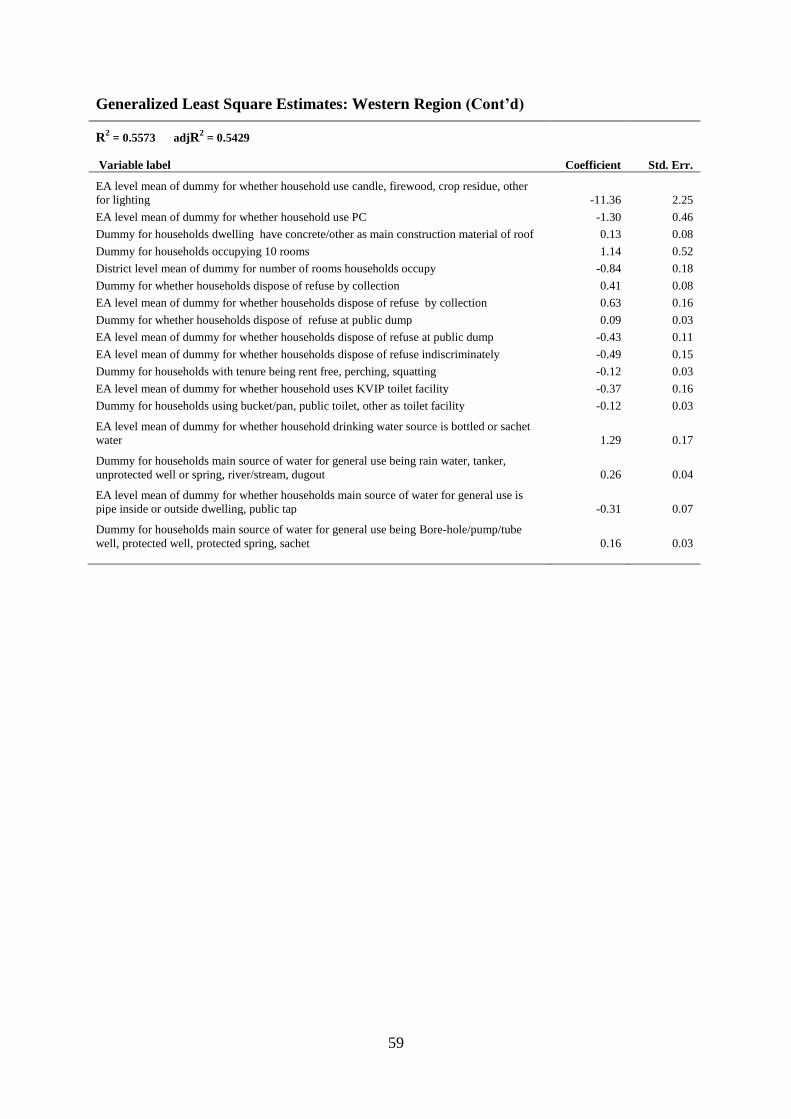
59
Generalized Least Square Estimates: Western Region (Cont’d)
R2 = 0.5573 adjR
2 = 0.5429
Variable label Coefficient Std. Err.
EA level mean of dummy for whether household use candle, firewood, crop residue, other
for lighting -11.36 2.25
EA level mean of dummy for whether household use PC -1.30 0.46
Dummy for households dwelling have concrete/other as main construction material of roof 0.13 0.08
Dummy for households occupying 10 rooms 1.14 0.52
District level mean of dummy for number of rooms households occupy -0.84 0.18
Dummy for whether households dispose of refuse by collection 0.41 0.08
EA level mean of dummy for whether households dispose of refuse by collection 0.63 0.16
Dummy for whether households dispose of refuse at public dump 0.09 0.03
EA level mean of dummy for whether households dispose of refuse at public dump -0.43 0.11
EA level mean of dummy for whether households dispose of refuse indiscriminately -0.49 0.15
Dummy for households with tenure being rent free, perching, squatting -0.12 0.03
EA level mean of dummy for whether household uses KVIP toilet facility -0.37 0.16
Dummy for households using bucket/pan, public toilet, other as toilet facility -0.12 0.03
EA level mean of dummy for whether household drinking water source is bottled or sachet
water 1.29 0.17
Dummy for households main source of water for general use being rain water, tanker,
unprotected well or spring, river/stream, dugout 0.26 0.04
EA level mean of dummy for whether households main source of water for general use is
pipe inside or outside dwelling, public tap -0.31 0.07
Dummy for households main source of water for general use being Bore-hole/pump/tube
well, protected well, protected spring, sachet 0.16 0.03
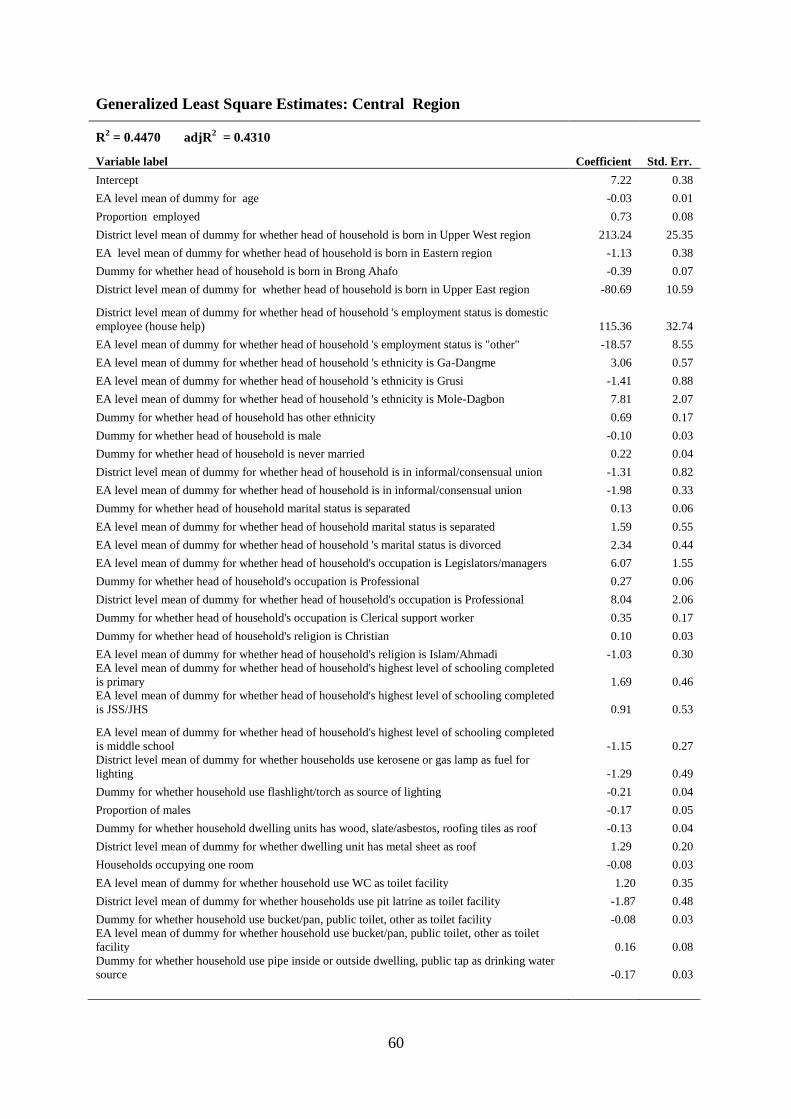
60
Generalized Least Square Estimates: Central Region
R2 = 0.4470 adjR
2 = 0.4310
Variable label Coefficient Std. Err.
Intercept 7.22 0.38
EA level mean of dummy for age -0.03 0.01
Proportion employed 0.73 0.08
District level mean of dummy for whether head of household is born in Upper West region 213.24 25.35
EA level mean of dummy for whether head of household is born in Eastern region -1.13 0.38
Dummy for whether head of household is born in Brong Ahafo -0.39 0.07
District level mean of dummy for whether head of household is born in Upper East region -80.69 10.59
District level mean of dummy for whether head of household 's employment status is domestic
employee (house help) 115.36 32.74
EA level mean of dummy for whether head of household 's employment status is "other" -18.57 8.55
EA level mean of dummy for whether head of household 's ethnicity is Ga-Dangme 3.06 0.57
EA level mean of dummy for whether head of household 's ethnicity is Grusi -1.41 0.88
EA level mean of dummy for whether head of household 's ethnicity is Mole-Dagbon 7.81 2.07
Dummy for whether head of household has other ethnicity 0.69 0.17
Dummy for whether head of household is male -0.10 0.03
Dummy for whether head of household is never married 0.22 0.04
District level mean of dummy for whether head of household is in informal/consensual union -1.31 0.82
EA level mean of dummy for whether head of household is in informal/consensual union -1.98 0.33
Dummy for whether head of household marital status is separated 0.13 0.06
EA level mean of dummy for whether head of household marital status is separated 1.59 0.55
EA level mean of dummy for whether head of household 's marital status is divorced 2.34 0.44
EA level mean of dummy for whether head of household's occupation is Legislators/managers 6.07 1.55
Dummy for whether head of household's occupation is Professional 0.27 0.06
District level mean of dummy for whether head of household's occupation is Professional 8.04 2.06
Dummy for whether head of household's occupation is Clerical support worker 0.35 0.17
Dummy for whether head of household's religion is Christian 0.10 0.03
EA level mean of dummy for whether head of household's religion is Islam/Ahmadi -1.03 0.30
EA level mean of dummy for whether head of household's highest level of schooling completed
is primary 1.69 0.46
EA level mean of dummy for whether head of household's highest level of schooling completed
is JSS/JHS 0.91 0.53
EA level mean of dummy for whether head of household's highest level of schooling completed
is middle school -1.15 0.27
District level mean of dummy for whether households use kerosene or gas lamp as fuel for
lighting -1.29 0.49
Dummy for whether household use flashlight/torch as source of lighting -0.21 0.04
Proportion of males -0.17 0.05
Dummy for whether household dwelling units has wood, slate/asbestos, roofing tiles as roof -0.13 0.04
District level mean of dummy for whether dwelling unit has metal sheet as roof 1.29 0.20
Households occupying one room -0.08 0.03
EA level mean of dummy for whether household use WC as toilet facility 1.20 0.35
District level mean of dummy for whether households use pit latrine as toilet facility -1.87 0.48
Dummy for whether household use bucket/pan, public toilet, other as toilet facility -0.08 0.03
EA level mean of dummy for whether household use bucket/pan, public toilet, other as toilet
facility 0.16 0.08
Dummy for whether household use pipe inside or outside dwelling, public tap as drinking water
source -0.17 0.03
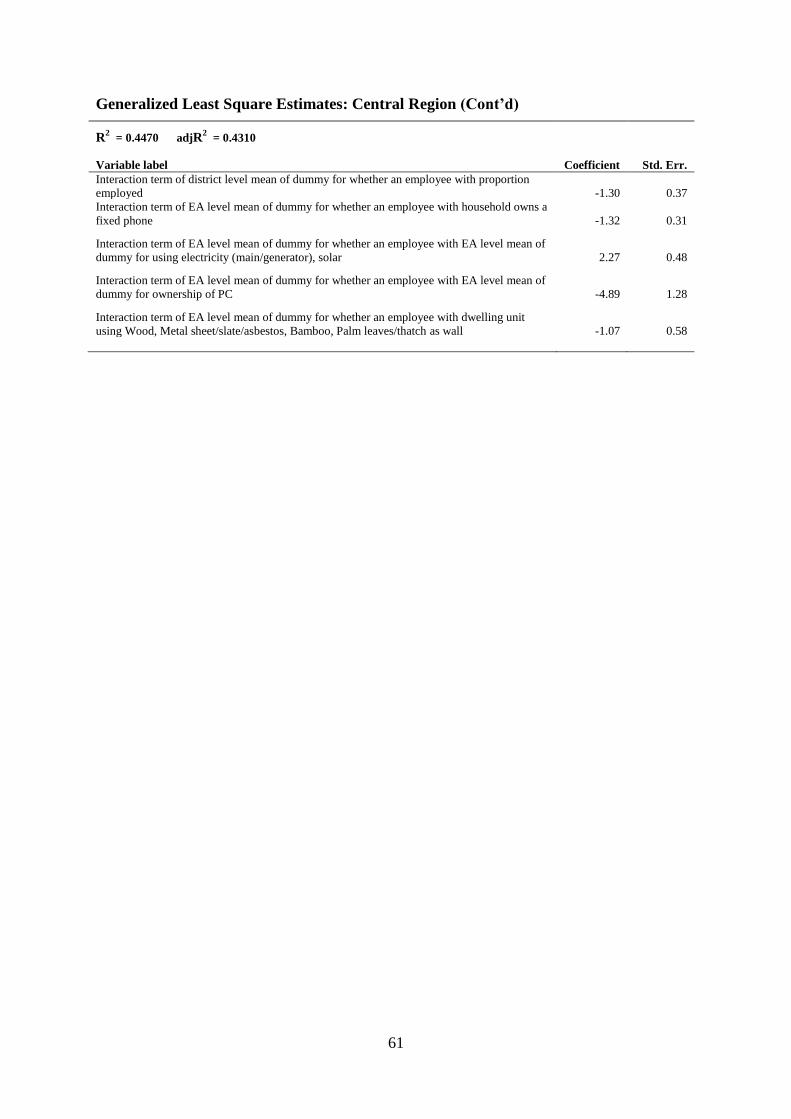
61
Generalized Least Square Estimates: Central Region (Cont’d)
R2 = 0.4470 adjR
2 = 0.4310
Variable label Coefficient Std. Err.
Interaction term of district level mean of dummy for whether an employee with proportion
employed -1.30 0.37
Interaction term of EA level mean of dummy for whether an employee with household owns a
fixed phone -1.32 0.31
Interaction term of EA level mean of dummy for whether an employee with EA level mean of
dummy for using electricity (main/generator), solar 2.27 0.48
Interaction term of EA level mean of dummy for whether an employee with EA level mean of
dummy for ownership of PC -4.89 1.28
Interaction term of EA level mean of dummy for whether an employee with dwelling unit
using Wood, Metal sheet/slate/asbestos, Bamboo, Palm leaves/thatch as wall -1.07 0.58
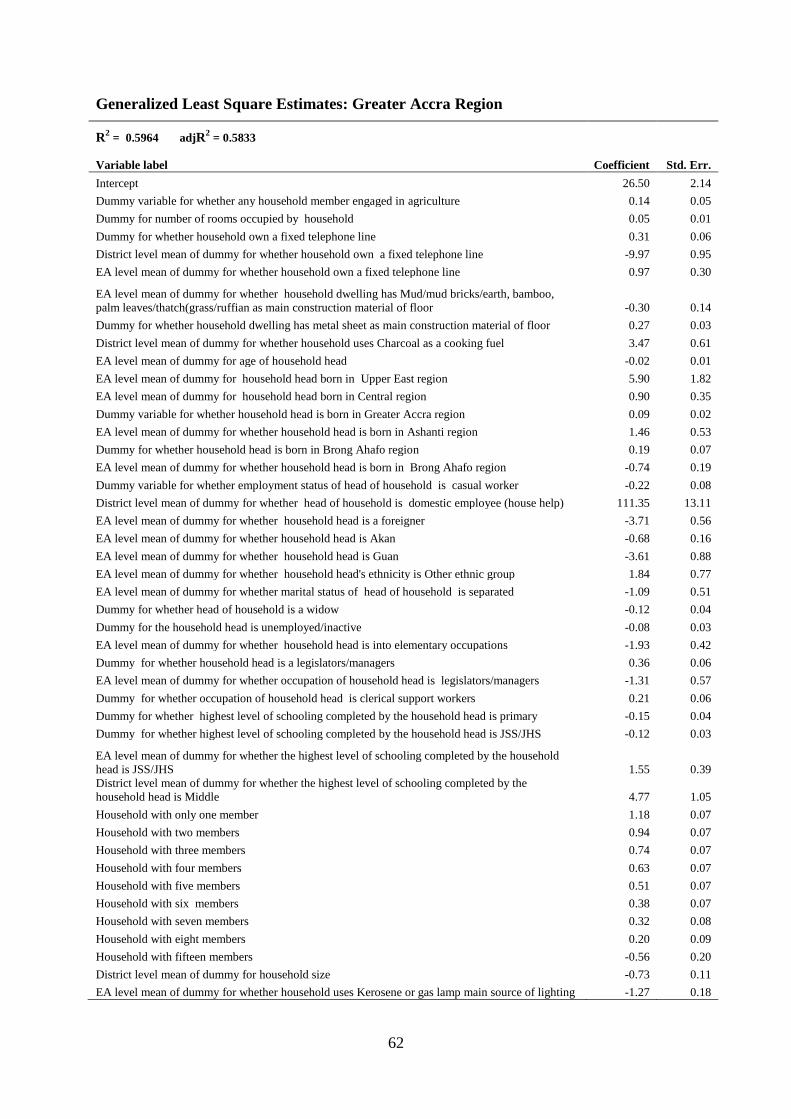
62
Generalized Least Square Estimates: Greater Accra Region
R2 = 0.5964 adjR
2 = 0.5833
Variable label Coefficient Std. Err.
Intercept 26.50 2.14
Dummy variable for whether any household member engaged in agriculture 0.14 0.05
Dummy for number of rooms occupied by household 0.05 0.01
Dummy for whether household own a fixed telephone line 0.31 0.06
District level mean of dummy for whether household own a fixed telephone line -9.97 0.95
EA level mean of dummy for whether household own a fixed telephone line 0.97 0.30
EA level mean of dummy for whether household dwelling has Mud/mud bricks/earth, bamboo,
palm leaves/thatch(grass/ruffian as main construction material of floor -0.30 0.14
Dummy for whether household dwelling has metal sheet as main construction material of floor 0.27 0.03
District level mean of dummy for whether household uses Charcoal as a cooking fuel 3.47 0.61
EA level mean of dummy for age of household head -0.02 0.01
EA level mean of dummy for household head born in Upper East region 5.90 1.82
EA level mean of dummy for household head born in Central region 0.90 0.35
Dummy variable for whether household head is born in Greater Accra region 0.09 0.02
EA level mean of dummy for whether household head is born in Ashanti region 1.46 0.53
Dummy for whether household head is born in Brong Ahafo region 0.19 0.07
EA level mean of dummy for whether household head is born in Brong Ahafo region -0.74 0.19
Dummy variable for whether employment status of head of household is casual worker -0.22 0.08
District level mean of dummy for whether head of household is domestic employee (house help) 111.35 13.11
EA level mean of dummy for whether household head is a foreigner -3.71 0.56
EA level mean of dummy for whether household head is Akan -0.68 0.16
EA level mean of dummy for whether household head is Guan -3.61 0.88
EA level mean of dummy for whether household head's ethnicity is Other ethnic group 1.84 0.77
EA level mean of dummy for whether marital status of head of household is separated -1.09 0.51
Dummy for whether head of household is a widow -0.12 0.04
Dummy for the household head is unemployed/inactive -0.08 0.03
EA level mean of dummy for whether household head is into elementary occupations -1.93 0.42
Dummy for whether household head is a legislators/managers 0.36 0.06
EA level mean of dummy for whether occupation of household head is legislators/managers -1.31 0.57
Dummy for whether occupation of household head is clerical support workers 0.21 0.06
Dummy for whether highest level of schooling completed by the household head is primary -0.15 0.04
Dummy for whether highest level of schooling completed by the household head is JSS/JHS -0.12 0.03
EA level mean of dummy for whether the highest level of schooling completed by the household
head is JSS/JHS 1.55 0.39
District level mean of dummy for whether the highest level of schooling completed by the
household head is Middle 4.77 1.05
Household with only one member 1.18 0.07
Household with two members 0.94 0.07
Household with three members 0.74 0.07
Household with four members 0.63 0.07
Household with five members 0.51 0.07
Household with six members 0.38 0.07
Household with seven members 0.32 0.08
Household with eight members 0.20 0.09
Household with fifteen members -0.56 0.20
District level mean of dummy for household size -0.73 0.11
EA level mean of dummy for whether household uses Kerosene or gas lamp main source of lighting -1.27 0.18
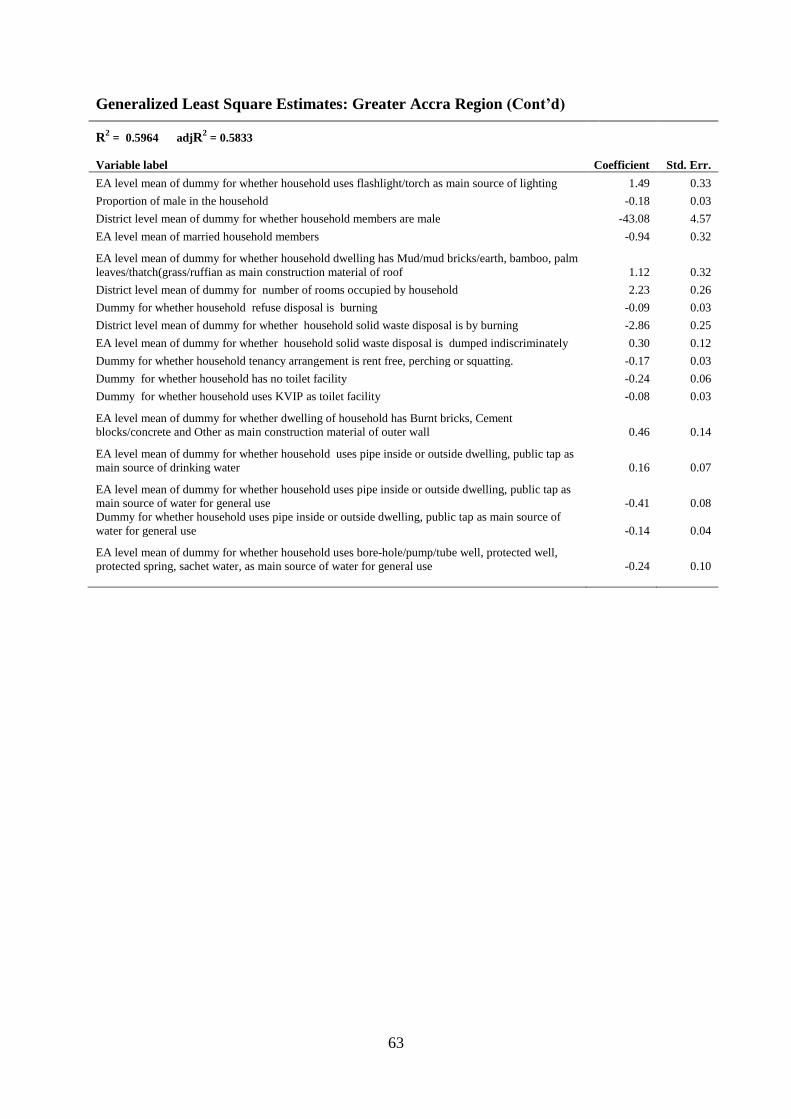
63
Generalized Least Square Estimates: Greater Accra Region (Cont’d)
R2 = 0.5964 adjR
2 = 0.5833
Variable label Coefficient Std. Err.
EA level mean of dummy for whether household uses flashlight/torch as main source of lighting 1.49 0.33
Proportion of male in the household -0.18 0.03
District level mean of dummy for whether household members are male -43.08 4.57
EA level mean of married household members -0.94 0.32
EA level mean of dummy for whether household dwelling has Mud/mud bricks/earth, bamboo, palm
leaves/thatch(grass/ruffian as main construction material of roof 1.12 0.32
District level mean of dummy for number of rooms occupied by household 2.23 0.26
Dummy for whether household refuse disposal is burning -0.09 0.03
District level mean of dummy for whether household solid waste disposal is by burning -2.86 0.25
EA level mean of dummy for whether household solid waste disposal is dumped indiscriminately 0.30 0.12
Dummy for whether household tenancy arrangement is rent free, perching or squatting. -0.17 0.03
Dummy for whether household has no toilet facility -0.24 0.06
Dummy for whether household uses KVIP as toilet facility -0.08 0.03
EA level mean of dummy for whether dwelling of household has Burnt bricks, Cement
blocks/concrete and Other as main construction material of outer wall 0.46 0.14
EA level mean of dummy for whether household uses pipe inside or outside dwelling, public tap as
main source of drinking water 0.16 0.07
EA level mean of dummy for whether household uses pipe inside or outside dwelling, public tap as
main source of water for general use -0.41 0.08
Dummy for whether household uses pipe inside or outside dwelling, public tap as main source of
water for general use -0.14 0.04
EA level mean of dummy for whether household uses bore-hole/pump/tube well, protected well,
protected spring, sachet water, as main source of water for general use -0.24 0.10
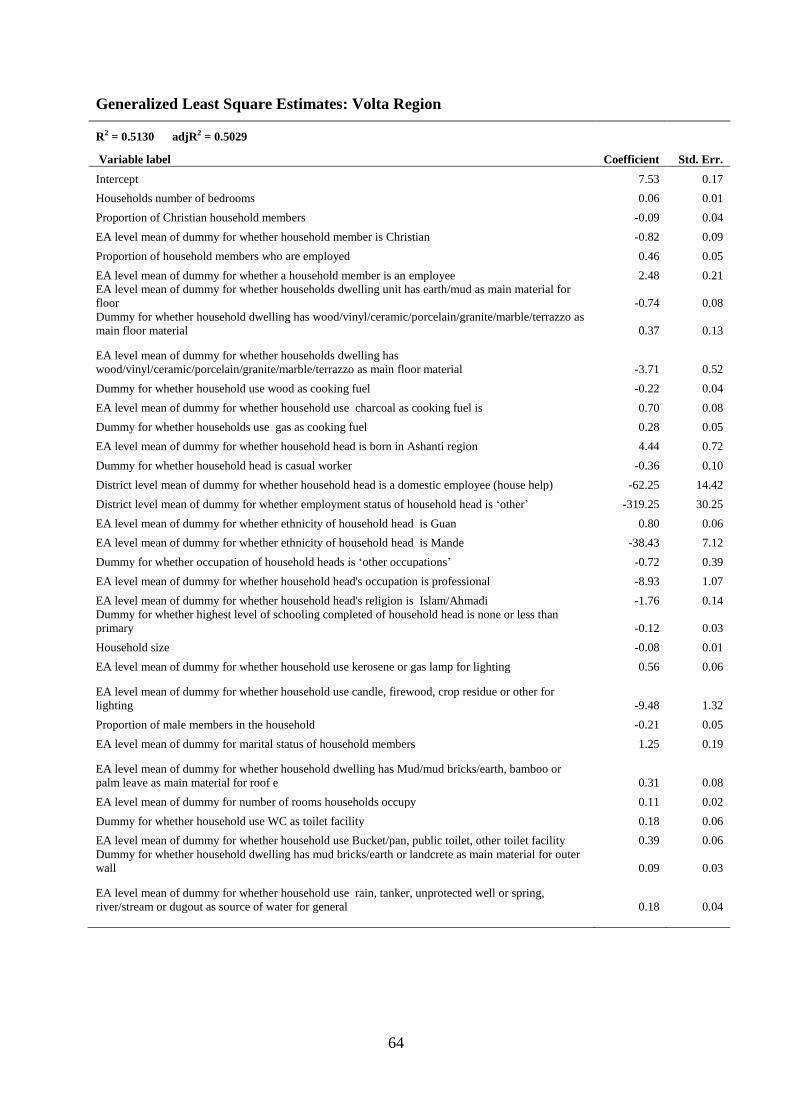
64
Generalized Least Square Estimates: Volta Region
R2 = 0.5130 adjR2 = 0.5029
Variable label Coefficient Std. Err.
Intercept 7.53 0.17
Households number of bedrooms 0.06 0.01
Proportion of Christian household members -0.09 0.04
EA level mean of dummy for whether household member is Christian -0.82 0.09
Proportion of household members who are employed 0.46 0.05
EA level mean of dummy for whether a household member is an employee 2.48 0.21
EA level mean of dummy for whether households dwelling unit has earth/mud as main material for
floor -0.74 0.08
Dummy for whether household dwelling has wood/vinyl/ceramic/porcelain/granite/marble/terrazzo as
main floor material 0.37 0.13
EA level mean of dummy for whether households dwelling has
wood/vinyl/ceramic/porcelain/granite/marble/terrazzo as main floor material -3.71 0.52
Dummy for whether household use wood as cooking fuel -0.22 0.04
EA level mean of dummy for whether household use charcoal as cooking fuel is 0.70 0.08
Dummy for whether households use gas as cooking fuel 0.28 0.05
EA level mean of dummy for whether household head is born in Ashanti region 4.44 0.72
Dummy for whether household head is casual worker -0.36 0.10
District level mean of dummy for whether household head is a domestic employee (house help) -62.25 14.42
District level mean of dummy for whether employment status of household head is ‘other’ -319.25 30.25
EA level mean of dummy for whether ethnicity of household head is Guan 0.80 0.06
EA level mean of dummy for whether ethnicity of household head is Mande -38.43 7.12
Dummy for whether occupation of household heads is ‘other occupations’ -0.72 0.39
EA level mean of dummy for whether household head's occupation is professional -8.93 1.07
EA level mean of dummy for whether household head's religion is Islam/Ahmadi -1.76 0.14
Dummy for whether highest level of schooling completed of household head is none or less than
primary -0.12 0.03
Household size -0.08 0.01
EA level mean of dummy for whether household use kerosene or gas lamp for lighting 0.56 0.06
EA level mean of dummy for whether household use candle, firewood, crop residue or other for
lighting -9.48 1.32
Proportion of male members in the household -0.21 0.05
EA level mean of dummy for marital status of household members 1.25 0.19
EA level mean of dummy for whether household dwelling has Mud/mud bricks/earth, bamboo or
palm leave as main material for roof e 0.31 0.08
EA level mean of dummy for number of rooms households occupy 0.11 0.02
Dummy for whether household use WC as toilet facility 0.18 0.06
EA level mean of dummy for whether household use Bucket/pan, public toilet, other toilet facility 0.39 0.06
Dummy for whether household dwelling has mud bricks/earth or landcrete as main material for outer
wall 0.09 0.03
EA level mean of dummy for whether household use rain, tanker, unprotected well or spring,
river/stream or dugout as source of water for general 0.18 0.04
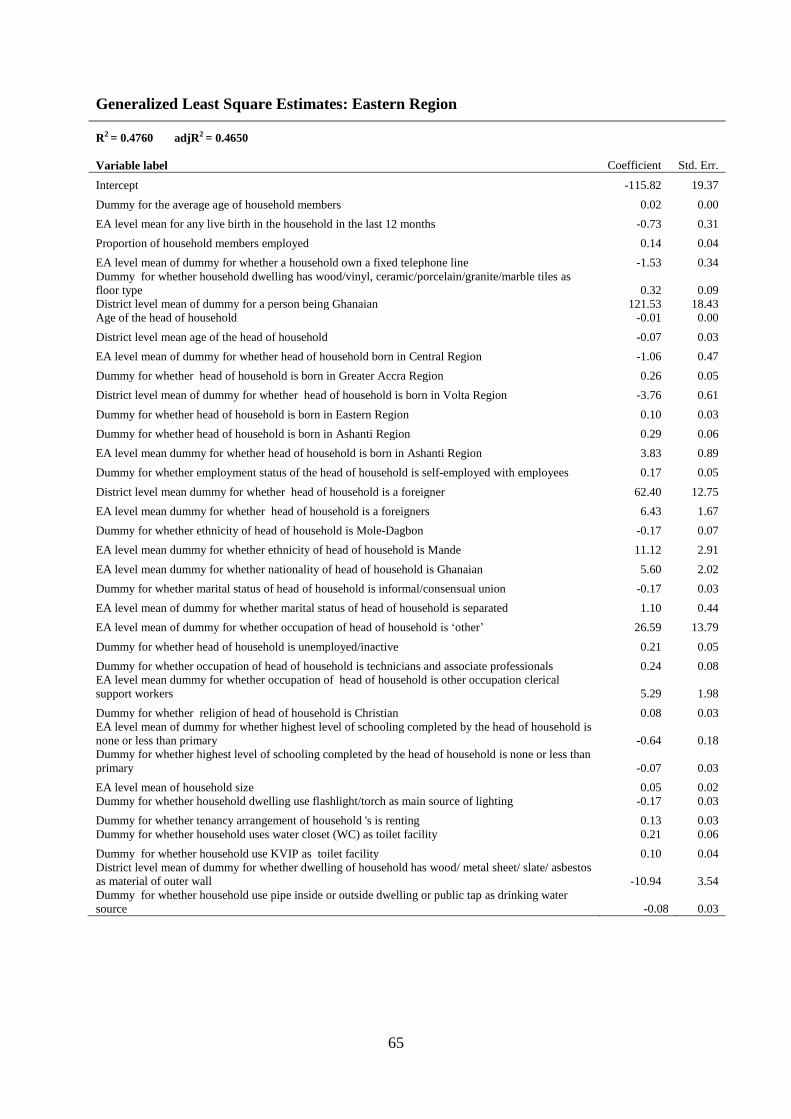
65
Generalized Least Square Estimates: Eastern Region
R2 = 0.4760 adjR2 = 0.4650
Variable label Coefficient Std. Err.
Intercept -115.82 19.37
Dummy for the average age of household members 0.02 0.00
EA level mean for any live birth in the household in the last 12 months -0.73 0.31
Proportion of household members employed 0.14 0.04
EA level mean of dummy for whether a household own a fixed telephone line -1.53 0.34
Dummy for whether household dwelling has wood/vinyl, ceramic/porcelain/granite/marble tiles as
floor type 0.32 0.09
District level mean of dummy for a person being Ghanaian 121.53 18.43
Age of the head of household -0.01 0.00
District level mean age of the head of household -0.07 0.03
EA level mean of dummy for whether head of household born in Central Region -1.06 0.47
Dummy for whether head of household is born in Greater Accra Region 0.26 0.05
District level mean of dummy for whether head of household is born in Volta Region -3.76 0.61
Dummy for whether head of household is born in Eastern Region 0.10 0.03
Dummy for whether head of household is born in Ashanti Region 0.29 0.06
EA level mean dummy for whether head of household is born in Ashanti Region 3.83 0.89
Dummy for whether employment status of the head of household is self-employed with employees 0.17 0.05
District level mean dummy for whether head of household is a foreigner 62.40 12.75
EA level mean dummy for whether head of household is a foreigners 6.43 1.67
Dummy for whether ethnicity of head of household is Mole-Dagbon -0.17 0.07
EA level mean dummy for whether ethnicity of head of household is Mande 11.12 2.91
EA level mean dummy for whether nationality of head of household is Ghanaian 5.60 2.02
Dummy for whether marital status of head of household is informal/consensual union -0.17 0.03
EA level mean of dummy for whether marital status of head of household is separated 1.10 0.44
EA level mean of dummy for whether occupation of head of household is ‘other’ 26.59 13.79
Dummy for whether head of household is unemployed/inactive 0.21 0.05
Dummy for whether occupation of head of household is technicians and associate professionals 0.24 0.08
EA level mean dummy for whether occupation of head of household is other occupation clerical
support workers 5.29 1.98
Dummy for whether religion of head of household is Christian 0.08 0.03
EA level mean of dummy for whether highest level of schooling completed by the head of household is
none or less than primary -0.64 0.18
Dummy for whether highest level of schooling completed by the head of household is none or less than
primary -0.07 0.03
EA level mean of household size 0.05 0.02
Dummy for whether household dwelling use flashlight/torch as main source of lighting -0.17 0.03
Dummy for whether tenancy arrangement of household 's is renting 0.13 0.03
Dummy for whether household uses water closet (WC) as toilet facility 0.21 0.06
Dummy for whether household use KVIP as toilet facility 0.10 0.04
District level mean of dummy for whether dwelling of household has wood/ metal sheet/ slate/ asbestos
as material of outer wall -10.94 3.54
Dummy for whether household use pipe inside or outside dwelling or public tap as drinking water
source -0.08 0.03
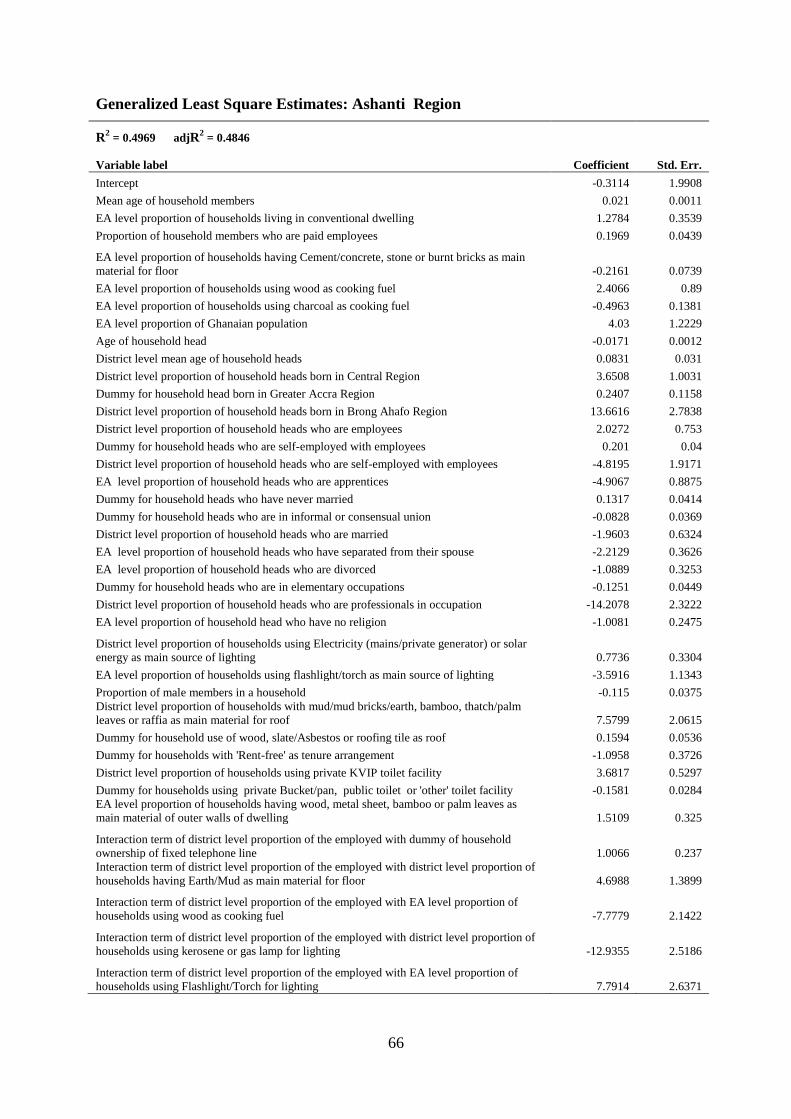
66
Generalized Least Square Estimates: Ashanti Region
R2 = 0.4969 adjR
2 = 0.4846
Variable label Coefficient Std. Err.
Intercept -0.3114 1.9908
Mean age of household members 0.021 0.0011
EA level proportion of households living in conventional dwelling 1.2784 0.3539
Proportion of household members who are paid employees 0.1969 0.0439
EA level proportion of households having Cement/concrete, stone or burnt bricks as main
material for floor -0.2161 0.0739
EA level proportion of households using wood as cooking fuel 2.4066 0.89
EA level proportion of households using charcoal as cooking fuel -0.4963 0.1381
EA level proportion of Ghanaian population 4.03 1.2229
Age of household head -0.0171 0.0012
District level mean age of household heads 0.0831 0.031
District level proportion of household heads born in Central Region 3.6508 1.0031
Dummy for household head born in Greater Accra Region 0.2407 0.1158
District level proportion of household heads born in Brong Ahafo Region 13.6616 2.7838
District level proportion of household heads who are employees 2.0272 0.753
Dummy for household heads who are self-employed with employees 0.201 0.04
District level proportion of household heads who are self-employed with employees -4.8195 1.9171
EA level proportion of household heads who are apprentices -4.9067 0.8875
Dummy for household heads who have never married 0.1317 0.0414
Dummy for household heads who are in informal or consensual union -0.0828 0.0369
District level proportion of household heads who are married -1.9603 0.6324
EA level proportion of household heads who have separated from their spouse -2.2129 0.3626
EA level proportion of household heads who are divorced -1.0889 0.3253
Dummy for household heads who are in elementary occupations -0.1251 0.0449
District level proportion of household heads who are professionals in occupation -14.2078 2.3222
EA level proportion of household head who have no religion -1.0081 0.2475
District level proportion of households using Electricity (mains/private generator) or solar
energy as main source of lighting 0.7736 0.3304
EA level proportion of households using flashlight/torch as main source of lighting -3.5916 1.1343
Proportion of male members in a household -0.115 0.0375
District level proportion of households with mud/mud bricks/earth, bamboo, thatch/palm
leaves or raffia as main material for roof 7.5799 2.0615
Dummy for household use of wood, slate/Asbestos or roofing tile as roof 0.1594 0.0536
Dummy for households with 'Rent-free' as tenure arrangement -1.0958 0.3726
District level proportion of households using private KVIP toilet facility 3.6817 0.5297
Dummy for households using private Bucket/pan, public toilet or 'other' toilet facility -0.1581 0.0284
EA level proportion of households having wood, metal sheet, bamboo or palm leaves as
main material of outer walls of dwelling 1.5109 0.325
Interaction term of district level proportion of the employed with dummy of household
ownership of fixed telephone line 1.0066 0.237
Interaction term of district level proportion of the employed with district level proportion of
households having Earth/Mud as main material for floor 4.6988 1.3899
Interaction term of district level proportion of the employed with EA level proportion of
households using wood as cooking fuel -7.7779 2.1422
Interaction term of district level proportion of the employed with district level proportion of
households using kerosene or gas lamp for lighting -12.9355 2.5186
Interaction term of district level proportion of the employed with EA level proportion of
households using Flashlight/Torch for lighting 7.7914 2.6371
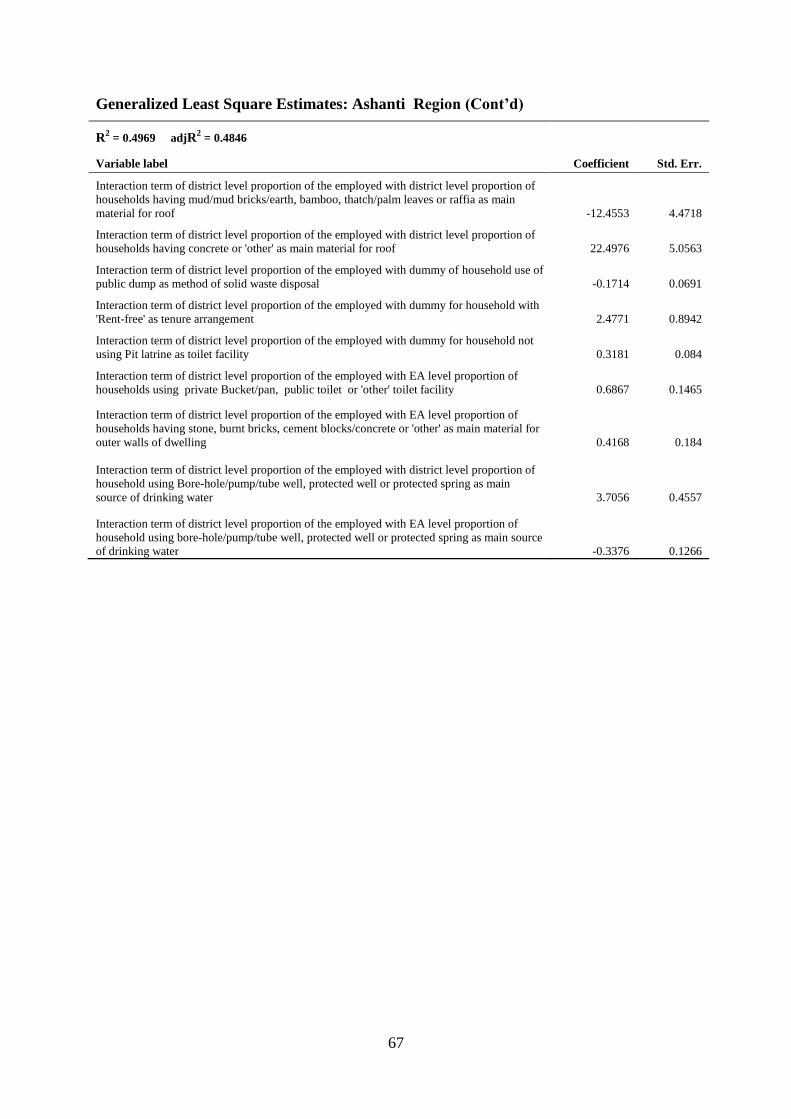
67
Generalized Least Square Estimates: Ashanti Region (Cont’d)
R2 = 0.4969 adjR
2 = 0.4846
Variable label Coefficient Std. Err.
Interaction term of district level proportion of the employed with district level proportion of
households having mud/mud bricks/earth, bamboo, thatch/palm leaves or raffia as main
material for roof -12.4553 4.4718
Interaction term of district level proportion of the employed with district level proportion of
households having concrete or 'other' as main material for roof 22.4976 5.0563
Interaction term of district level proportion of the employed with dummy of household use of
public dump as method of solid waste disposal -0.1714 0.0691
Interaction term of district level proportion of the employed with dummy for household with
'Rent-free' as tenure arrangement 2.4771 0.8942
Interaction term of district level proportion of the employed with dummy for household not
using Pit latrine as toilet facility 0.3181 0.084
Interaction term of district level proportion of the employed with EA level proportion of
households using private Bucket/pan, public toilet or 'other' toilet facility 0.6867 0.1465
Interaction term of district level proportion of the employed with EA level proportion of
households having stone, burnt bricks, cement blocks/concrete or 'other' as main material for
outer walls of dwelling 0.4168 0.184
Interaction term of district level proportion of the employed with district level proportion of
household using Bore-hole/pump/tube well, protected well or protected spring as main
source of drinking water 3.7056 0.4557
Interaction term of district level proportion of the employed with EA level proportion of
household using bore-hole/pump/tube well, protected well or protected spring as main source
of drinking water -0.3376 0.1266
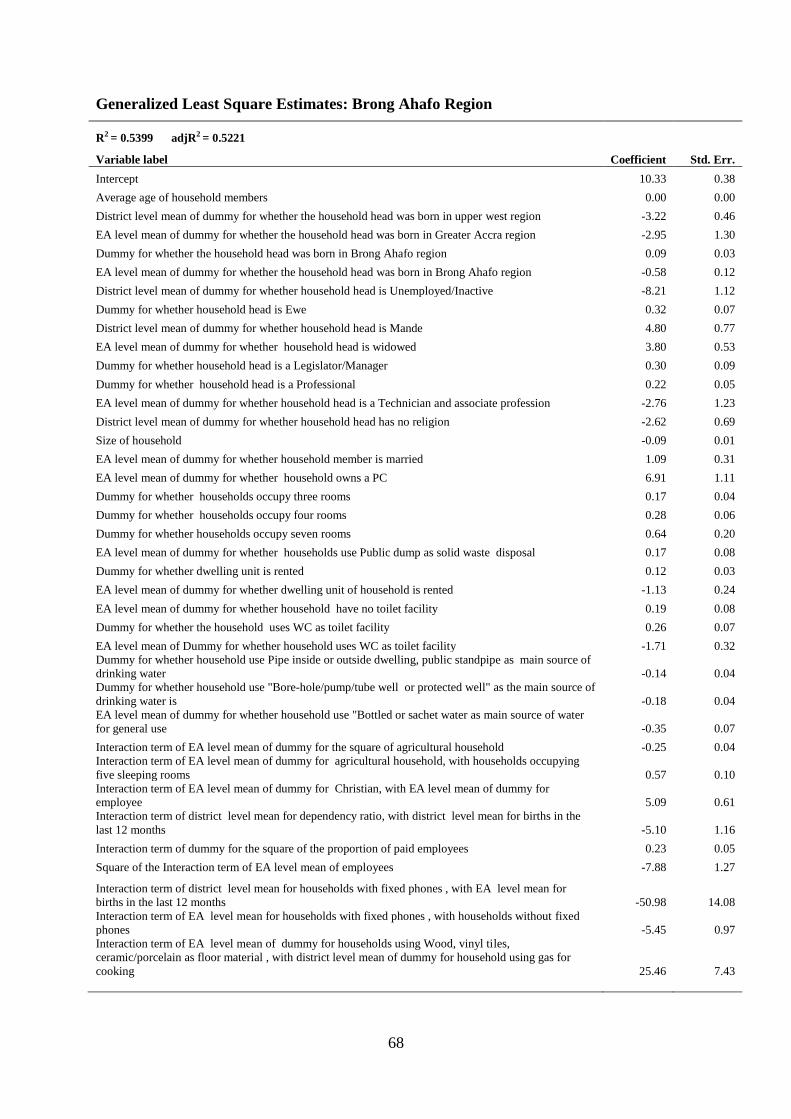
68
Generalized Least Square Estimates: Brong Ahafo Region
R2 = 0.5399 adjR2 = 0.5221
Variable label Coefficient Std. Err.
Intercept 10.33 0.38
Average age of household members 0.00 0.00
District level mean of dummy for whether the household head was born in upper west region -3.22 0.46
EA level mean of dummy for whether the household head was born in Greater Accra region -2.95 1.30
Dummy for whether the household head was born in Brong Ahafo region 0.09 0.03
EA level mean of dummy for whether the household head was born in Brong Ahafo region -0.58 0.12
District level mean of dummy for whether household head is Unemployed/Inactive -8.21 1.12
Dummy for whether household head is Ewe 0.32 0.07
District level mean of dummy for whether household head is Mande 4.80 0.77
EA level mean of dummy for whether household head is widowed 3.80 0.53
Dummy for whether household head is a Legislator/Manager 0.30 0.09
Dummy for whether household head is a Professional 0.22 0.05
EA level mean of dummy for whether household head is a Technician and associate profession -2.76 1.23
District level mean of dummy for whether household head has no religion -2.62 0.69
Size of household -0.09 0.01
EA level mean of dummy for whether household member is married 1.09 0.31
EA level mean of dummy for whether household owns a PC 6.91 1.11
Dummy for whether households occupy three rooms 0.17 0.04
Dummy for whether households occupy four rooms 0.28 0.06
Dummy for whether households occupy seven rooms 0.64 0.20
EA level mean of dummy for whether households use Public dump as solid waste disposal 0.17 0.08
Dummy for whether dwelling unit is rented 0.12 0.03
EA level mean of dummy for whether dwelling unit of household is rented -1.13 0.24
EA level mean of dummy for whether household have no toilet facility 0.19 0.08
Dummy for whether the household uses WC as toilet facility 0.26 0.07
EA level mean of Dummy for whether household uses WC as toilet facility -1.71 0.32
Dummy for whether household use Pipe inside or outside dwelling, public standpipe as main source of
drinking water -0.14 0.04
Dummy for whether household use "Bore-hole/pump/tube well or protected well" as the main source of
drinking water is -0.18 0.04
EA level mean of dummy for whether household use "Bottled or sachet water as main source of water
for general use -0.35 0.07
Interaction term of EA level mean of dummy for the square of agricultural household -0.25 0.04
Interaction term of EA level mean of dummy for agricultural household, with households occupying
five sleeping rooms 0.57 0.10
Interaction term of EA level mean of dummy for Christian, with EA level mean of dummy for
employee 5.09 0.61
Interaction term of district level mean for dependency ratio, with district level mean for births in the
last 12 months -5.10 1.16
Interaction term of dummy for the square of the proportion of paid employees 0.23 0.05
Square of the Interaction term of EA level mean of employees -7.88 1.27
Interaction term of district level mean for households with fixed phones , with EA level mean for
births in the last 12 months -50.98 14.08
Interaction term of EA level mean for households with fixed phones , with households without fixed
phones -5.45 0.97
Interaction term of EA level mean of dummy for households using Wood, vinyl tiles,
ceramic/porcelain as floor material , with district level mean of dummy for household using gas for
cooking 25.46 7.43
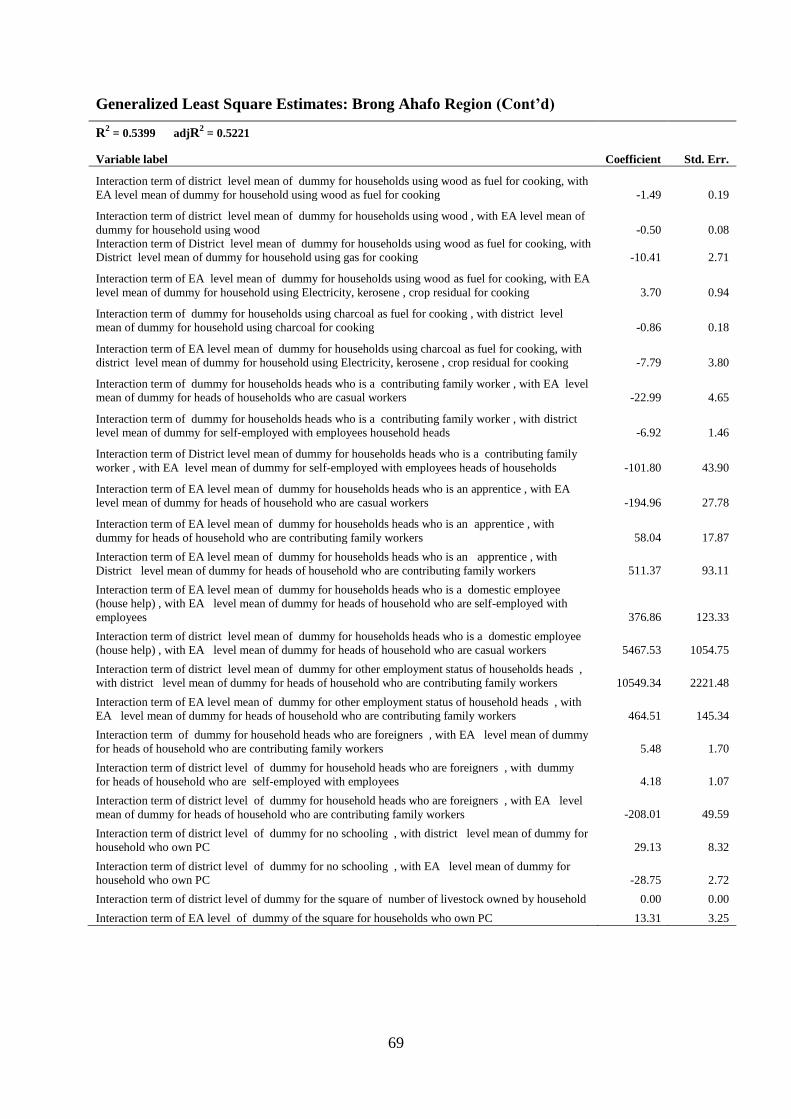
69
Generalized Least Square Estimates: Brong Ahafo Region (Cont’d)
R2 = 0.5399 adjR
2 = 0.5221
Variable label Coefficient Std. Err.
Interaction term of district level mean of dummy for households using wood as fuel for cooking, with
EA level mean of dummy for household using wood as fuel for cooking -1.49 0.19
Interaction term of district level mean of dummy for households using wood , with EA level mean of
dummy for household using wood -0.50 0.08
Interaction term of District level mean of dummy for households using wood as fuel for cooking, with
District level mean of dummy for household using gas for cooking -10.41 2.71
Interaction term of EA level mean of dummy for households using wood as fuel for cooking, with EA
level mean of dummy for household using Electricity, kerosene , crop residual for cooking 3.70 0.94
Interaction term of dummy for households using charcoal as fuel for cooking , with district level
mean of dummy for household using charcoal for cooking -0.86 0.18
Interaction term of EA level mean of dummy for households using charcoal as fuel for cooking, with
district level mean of dummy for household using Electricity, kerosene , crop residual for cooking -7.79 3.80
Interaction term of dummy for households heads who is a contributing family worker , with EA level
mean of dummy for heads of households who are casual workers -22.99 4.65
Interaction term of dummy for households heads who is a contributing family worker , with district
level mean of dummy for self-employed with employees household heads -6.92 1.46
Interaction term of District level mean of dummy for households heads who is a contributing family
worker , with EA level mean of dummy for self-employed with employees heads of households -101.80 43.90
Interaction term of EA level mean of dummy for households heads who is an apprentice , with EA
level mean of dummy for heads of household who are casual workers -194.96 27.78
Interaction term of EA level mean of dummy for households heads who is an apprentice , with
dummy for heads of household who are contributing family workers 58.04 17.87
Interaction term of EA level mean of dummy for households heads who is an apprentice , with
District level mean of dummy for heads of household who are contributing family workers 511.37 93.11
Interaction term of EA level mean of dummy for households heads who is a domestic employee
(house help) , with EA level mean of dummy for heads of household who are self-employed with
employees 376.86 123.33
Interaction term of district level mean of dummy for households heads who is a domestic employee
(house help) , with EA level mean of dummy for heads of household who are casual workers 5467.53 1054.75
Interaction term of district level mean of dummy for other employment status of households heads ,
with district level mean of dummy for heads of household who are contributing family workers 10549.34 2221.48
Interaction term of EA level mean of dummy for other employment status of household heads , with
EA level mean of dummy for heads of household who are contributing family workers 464.51 145.34
Interaction term of dummy for household heads who are foreigners , with EA level mean of dummy
for heads of household who are contributing family workers 5.48 1.70
Interaction term of district level of dummy for household heads who are foreigners , with dummy
for heads of household who are self-employed with employees 4.18 1.07
Interaction term of district level of dummy for household heads who are foreigners , with EA level
mean of dummy for heads of household who are contributing family workers -208.01 49.59
Interaction term of district level of dummy for no schooling , with district level mean of dummy for
household who own PC 29.13 8.32
Interaction term of district level of dummy for no schooling , with EA level mean of dummy for
household who own PC -28.75 2.72
Interaction term of district level of dummy for the square of number of livestock owned by household 0.00 0.00
Interaction term of EA level of dummy of the square for households who own PC 13.31 3.25
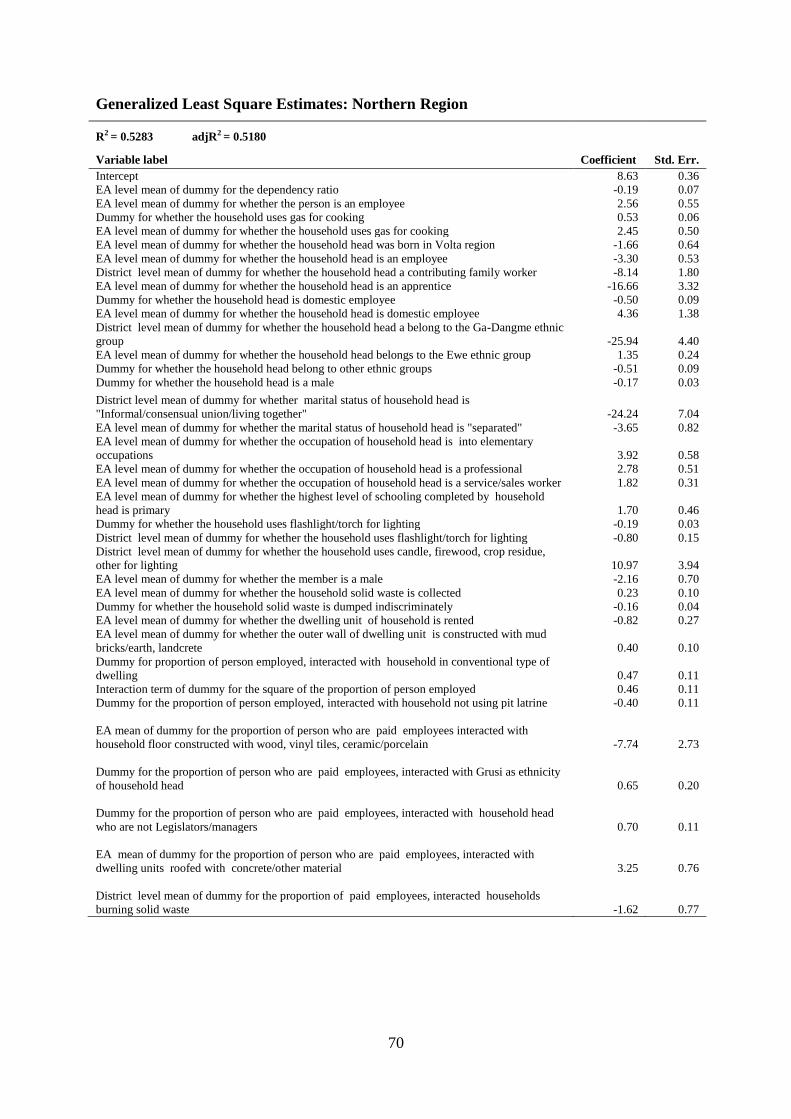
70
Generalized Least Square Estimates: Northern Region
R2 = 0.5283 adjR2 = 0.5180
Variable label Coefficient Std. Err.
Intercept 8.63 0.36
EA level mean of dummy for the dependency ratio -0.19 0.07
EA level mean of dummy for whether the person is an employee 2.56 0.55
Dummy for whether the household uses gas for cooking 0.53 0.06
EA level mean of dummy for whether the household uses gas for cooking 2.45 0.50
EA level mean of dummy for whether the household head was born in Volta region -1.66 0.64
EA level mean of dummy for whether the household head is an employee -3.30 0.53
District level mean of dummy for whether the household head a contributing family worker -8.14 1.80
EA level mean of dummy for whether the household head is an apprentice -16.66 3.32
Dummy for whether the household head is domestic employee -0.50 0.09
EA level mean of dummy for whether the household head is domestic employee 4.36 1.38
District level mean of dummy for whether the household head a belong to the Ga-Dangme ethnic
group -25.94 4.40
EA level mean of dummy for whether the household head belongs to the Ewe ethnic group 1.35 0.24
Dummy for whether the household head belong to other ethnic groups -0.51 0.09
Dummy for whether the household head is a male -0.17 0.03
District level mean of dummy for whether marital status of household head is
"Informal/consensual union/living together" -24.24 7.04
EA level mean of dummy for whether the marital status of household head is "separated" -3.65 0.82
EA level mean of dummy for whether the occupation of household head is into elementary
occupations 3.92 0.58
EA level mean of dummy for whether the occupation of household head is a professional 2.78 0.51
EA level mean of dummy for whether the occupation of household head is a service/sales worker 1.82 0.31
EA level mean of dummy for whether the highest level of schooling completed by household
head is primary 1.70 0.46
Dummy for whether the household uses flashlight/torch for lighting -0.19 0.03
District level mean of dummy for whether the household uses flashlight/torch for lighting -0.80 0.15
District level mean of dummy for whether the household uses candle, firewood, crop residue,
other for lighting 10.97 3.94
EA level mean of dummy for whether the member is a male -2.16 0.70
EA level mean of dummy for whether the household solid waste is collected 0.23 0.10
Dummy for whether the household solid waste is dumped indiscriminately -0.16 0.04
EA level mean of dummy for whether the dwelling unit of household is rented -0.82 0.27
EA level mean of dummy for whether the outer wall of dwelling unit is constructed with mud
bricks/earth, landcrete 0.40 0.10
Dummy for proportion of person employed, interacted with household in conventional type of
dwelling 0.47 0.11
Interaction term of dummy for the square of the proportion of person employed 0.46 0.11
Dummy for the proportion of person employed, interacted with household not using pit latrine -0.40 0.11
EA mean of dummy for the proportion of person who are paid employees interacted with
household floor constructed with wood, vinyl tiles, ceramic/porcelain -7.74 2.73
Dummy for the proportion of person who are paid employees, interacted with Grusi as ethnicity
of household head 0.65 0.20
Dummy for the proportion of person who are paid employees, interacted with household head
who are not Legislators/managers 0.70 0.11
EA mean of dummy for the proportion of person who are paid employees, interacted with
dwelling units roofed with concrete/other material 3.25 0.76
District level mean of dummy for the proportion of paid employees, interacted households
burning solid waste -1.62 0.77
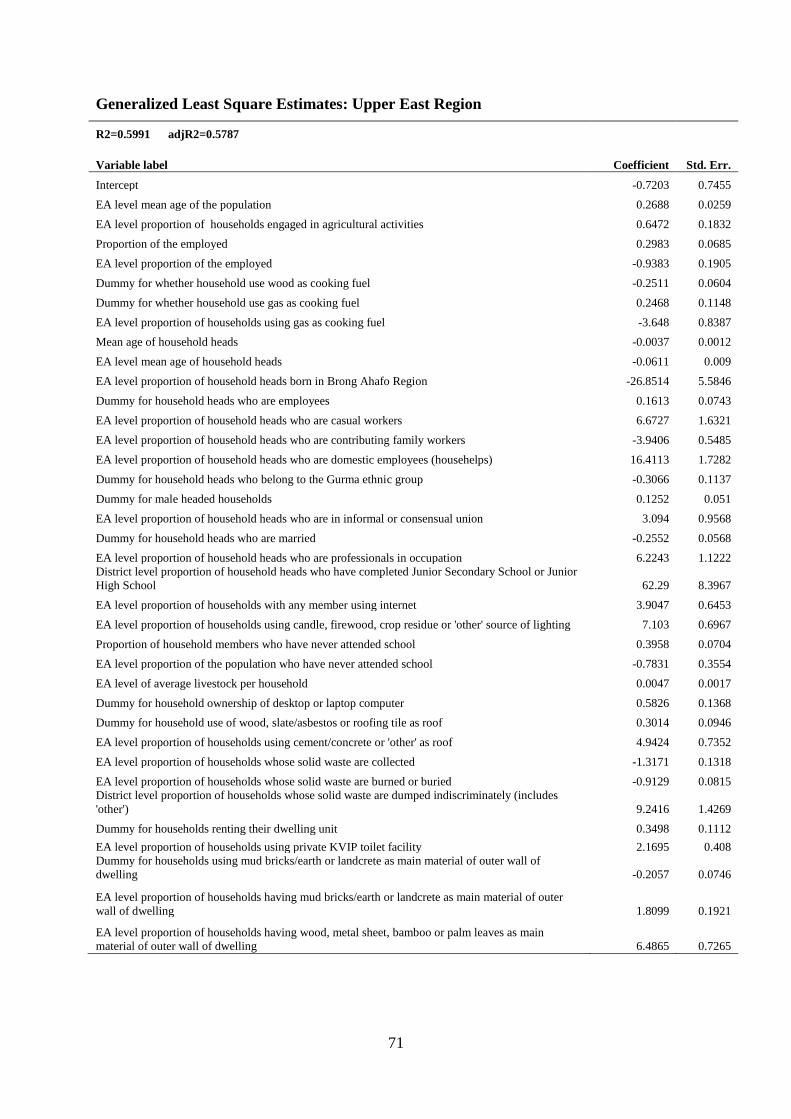
71
Generalized Least Square Estimates: Upper East Region
R2=0.5991 adjR2=0.5787
Variable label Coefficient Std. Err.
Intercept -0.7203 0.7455
EA level mean age of the population 0.2688 0.0259
EA level proportion of households engaged in agricultural activities 0.6472 0.1832
Proportion of the employed 0.2983 0.0685
EA level proportion of the employed -0.9383 0.1905
Dummy for whether household use wood as cooking fuel -0.2511 0.0604
Dummy for whether household use gas as cooking fuel 0.2468 0.1148
EA level proportion of households using gas as cooking fuel -3.648 0.8387
Mean age of household heads -0.0037 0.0012
EA level mean age of household heads -0.0611 0.009
EA level proportion of household heads born in Brong Ahafo Region -26.8514 5.5846
Dummy for household heads who are employees 0.1613 0.0743
EA level proportion of household heads who are casual workers 6.6727 1.6321
EA level proportion of household heads who are contributing family workers -3.9406 0.5485
EA level proportion of household heads who are domestic employees (househelps) 16.4113 1.7282
Dummy for household heads who belong to the Gurma ethnic group -0.3066 0.1137
Dummy for male headed households 0.1252 0.051
EA level proportion of household heads who are in informal or consensual union 3.094 0.9568
Dummy for household heads who are married -0.2552 0.0568
EA level proportion of household heads who are professionals in occupation 6.2243 1.1222
District level proportion of household heads who have completed Junior Secondary School or Junior
High School 62.29 8.3967
EA level proportion of households with any member using internet 3.9047 0.6453
EA level proportion of households using candle, firewood, crop residue or 'other' source of lighting 7.103 0.6967
Proportion of household members who have never attended school 0.3958 0.0704
EA level proportion of the population who have never attended school -0.7831 0.3554
EA level of average livestock per household 0.0047 0.0017
Dummy for household ownership of desktop or laptop computer 0.5826 0.1368
Dummy for household use of wood, slate/asbestos or roofing tile as roof 0.3014 0.0946
EA level proportion of households using cement/concrete or 'other' as roof 4.9424 0.7352
EA level proportion of households whose solid waste are collected -1.3171 0.1318
EA level proportion of households whose solid waste are burned or buried -0.9129 0.0815
District level proportion of households whose solid waste are dumped indiscriminately (includes
'other') 9.2416 1.4269
Dummy for households renting their dwelling unit 0.3498 0.1112
EA level proportion of households using private KVIP toilet facility 2.1695 0.408
Dummy for households using mud bricks/earth or landcrete as main material of outer wall of
dwelling -0.2057 0.0746
EA level proportion of households having mud bricks/earth or landcrete as main material of outer
wall of dwelling 1.8099 0.1921
EA level proportion of households having wood, metal sheet, bamboo or palm leaves as main
material of outer wall of dwelling 6.4865 0.7265
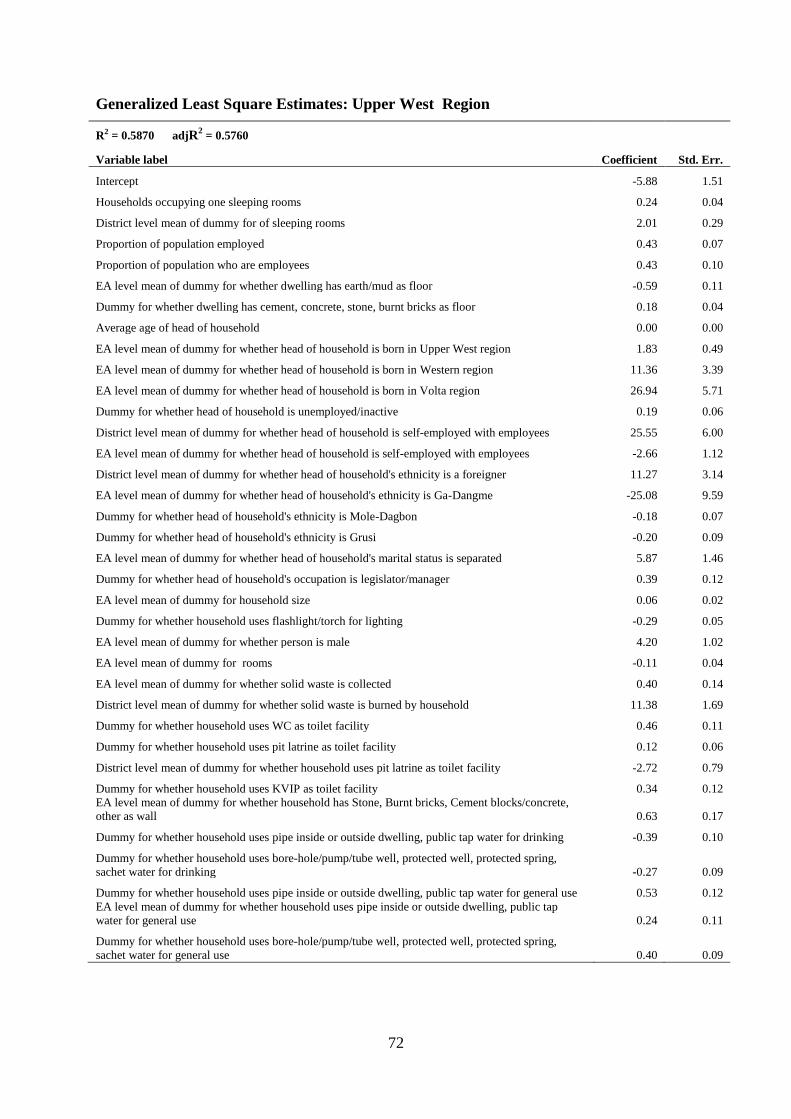
72
Generalized Least Square Estimates: Upper West Region
R2 = 0.5870 adjR2 = 0.5760
Variable label Coefficient Std. Err.
Intercept -5.88 1.51
Households occupying one sleeping rooms 0.24 0.04
District level mean of dummy for of sleeping rooms 2.01 0.29
Proportion of population employed 0.43 0.07
Proportion of population who are employees 0.43 0.10
EA level mean of dummy for whether dwelling has earth/mud as floor -0.59 0.11
Dummy for whether dwelling has cement, concrete, stone, burnt bricks as floor 0.18 0.04
Average age of head of household 0.00 0.00
EA level mean of dummy for whether head of household is born in Upper West region 1.83 0.49
EA level mean of dummy for whether head of household is born in Western region 11.36 3.39
EA level mean of dummy for whether head of household is born in Volta region 26.94 5.71
Dummy for whether head of household is unemployed/inactive 0.19 0.06
District level mean of dummy for whether head of household is self-employed with employees 25.55 6.00
EA level mean of dummy for whether head of household is self-employed with employees -2.66 1.12
District level mean of dummy for whether head of household's ethnicity is a foreigner 11.27 3.14
EA level mean of dummy for whether head of household's ethnicity is Ga-Dangme -25.08 9.59
Dummy for whether head of household's ethnicity is Mole-Dagbon -0.18 0.07
Dummy for whether head of household's ethnicity is Grusi -0.20 0.09
EA level mean of dummy for whether head of household's marital status is separated 5.87 1.46
Dummy for whether head of household's occupation is legislator/manager 0.39 0.12
EA level mean of dummy for household size 0.06 0.02
Dummy for whether household uses flashlight/torch for lighting -0.29 0.05
EA level mean of dummy for whether person is male 4.20 1.02
EA level mean of dummy for rooms -0.11 0.04
EA level mean of dummy for whether solid waste is collected 0.40 0.14
District level mean of dummy for whether solid waste is burned by household 11.38 1.69
Dummy for whether household uses WC as toilet facility 0.46 0.11
Dummy for whether household uses pit latrine as toilet facility 0.12 0.06
District level mean of dummy for whether household uses pit latrine as toilet facility -2.72 0.79
Dummy for whether household uses KVIP as toilet facility 0.34 0.12
EA level mean of dummy for whether household has Stone, Burnt bricks, Cement blocks/concrete,
other as wall 0.63 0.17
Dummy for whether household uses pipe inside or outside dwelling, public tap water for drinking -0.39 0.10
Dummy for whether household uses bore-hole/pump/tube well, protected well, protected spring,
sachet water for drinking -0.27 0.09
Dummy for whether household uses pipe inside or outside dwelling, public tap water for general use 0.53 0.12
EA level mean of dummy for whether household uses pipe inside or outside dwelling, public tap
water for general use 0.24 0.11
Dummy for whether household uses bore-hole/pump/tube well, protected well, protected spring,
sachet water for general use 0.40 0.09
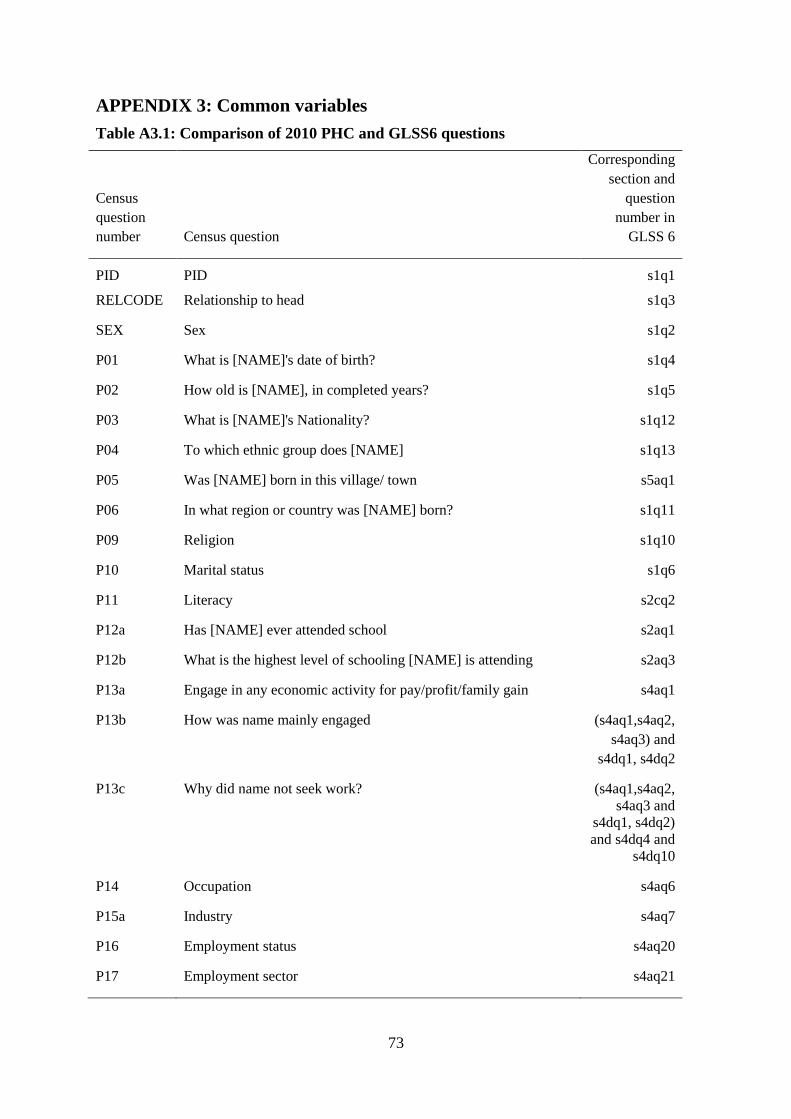
73
APPENDIX 3: Common variables
Table A3.1: Comparison of 2010 PHC and GLSS6 questions
Census
question
number Census question
Corresponding
section and
question
number in
GLSS 6
PID PID s1q1
RELCODE Relationship to head s1q3
SEX Sex s1q2
P01 What is [NAME]'s date of birth? s1q4
P02 How old is [NAME], in completed years? s1q5
P03 What is [NAME]'s Nationality? s1q12
P04 To which ethnic group does [NAME] s1q13
P05 Was [NAME] born in this village/ town s5aq1
P06 In what region or country was [NAME] born? s1q11
P09 Religion s1q10
P10 Marital status s1q6
P11 Literacy s2cq2
P12a Has [NAME] ever attended school s2aq1
P12b What is the highest level of schooling [NAME] is attending s2aq3
P13a Engage in any economic activity for pay/profit/family gain s4aq1
P13b How was name mainly engaged (s4aq1,s4aq2,
s4aq3) and
s4dq1, s4dq2
P13c Why did name not seek work? (s4aq1,s4aq2,
s4aq3 and
s4dq1, s4dq2)
and s4dq4 and
s4dq10
P14 Occupation s4aq6
P15a Industry s4aq7
P16 Employment status s4aq20
P17 Employment sector s4aq21
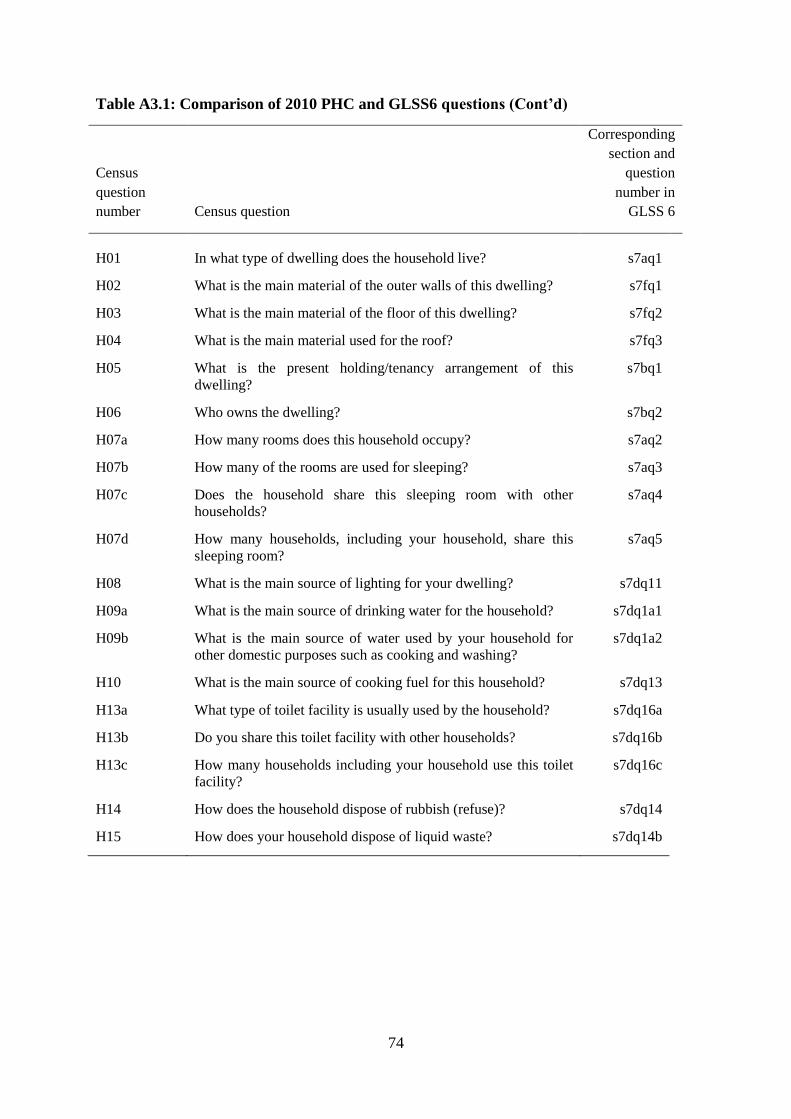
74
Table A3.1: Comparison of 2010 PHC and GLSS6 questions (Cont’d)
Census
question
number Census question
Corresponding
section and
question
number in
GLSS 6
H01 In what type of dwelling does the household live? s7aq1
H02 What is the main material of the outer walls of this dwelling? s7fq1
H03 What is the main material of the floor of this dwelling? s7fq2
H04 What is the main material used for the roof? s7fq3
H05 What is the present holding/tenancy arrangement of this
dwelling?
s7bq1
H06 Who owns the dwelling? s7bq2
H07a How many rooms does this household occupy? s7aq2
H07b How many of the rooms are used for sleeping? s7aq3
H07c Does the household share this sleeping room with other
households?
s7aq4
H07d How many households, including your household, share this
sleeping room?
s7aq5
H08 What is the main source of lighting for your dwelling? s7dq11
H09a What is the main source of drinking water for the household? s7dq1a1
H09b What is the main source of water used by your household for
other domestic purposes such as cooking and washing?
s7dq1a2
H10 What is the main source of cooking fuel for this household? s7dq13
H13a What type of toilet facility is usually used by the household? s7dq16a
H13b Do you share this toilet facility with other households? s7dq16b
H13c How many households including your household use this toilet
facility?
s7dq16c
H14 How does the household dispose of rubbish (refuse)? s7dq14
H15 How does your household dispose of liquid waste? s7dq14b
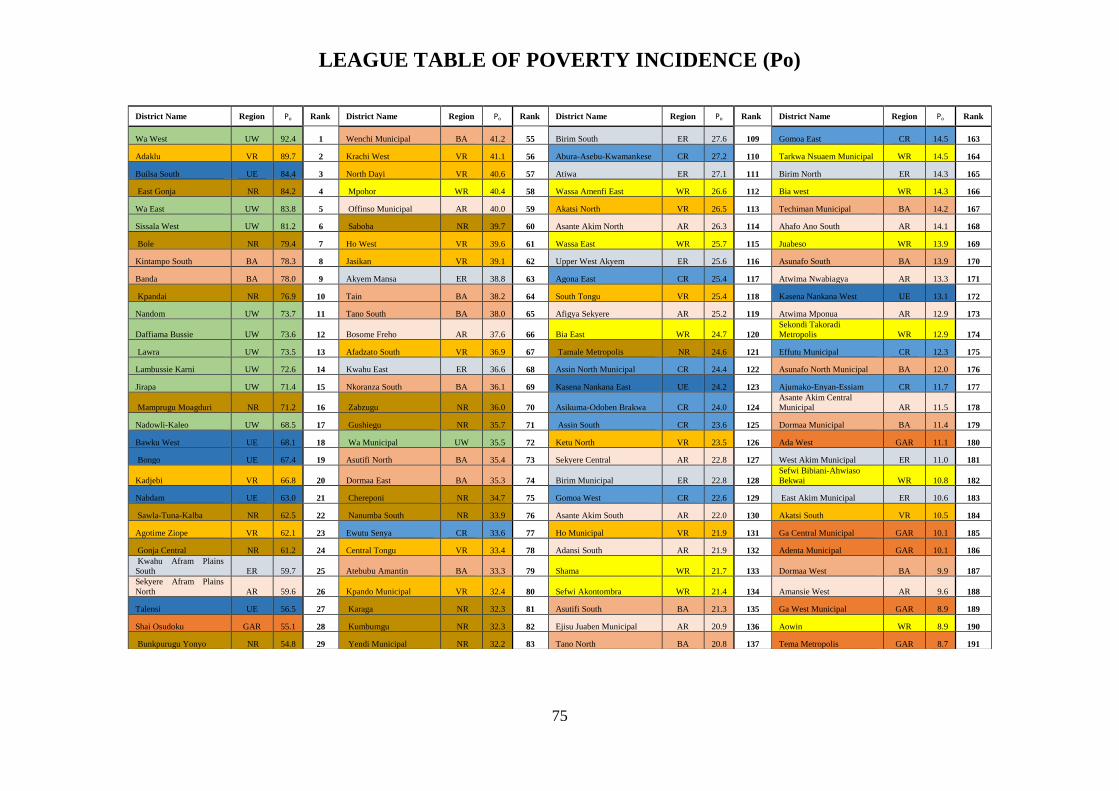
75
LEAGUE TABLE OF POVERTY INCIDENCE (Po)
District Name Region Po Rank District Name Region Po Rank District Name Region Po Rank District Name Region Po Rank
Wa West UW 92.4 1 Wenchi Municipal BA 41.2 55 Birim South ER 27.6 109 Gomoa East CR 14.5 163
Adaklu VR 89.7 2 Krachi West VR 41.1 56 Abura-Asebu-Kwamankese CR 27.2 110 Tarkwa Nsuaem Municipal WR 14.5 164
Builsa South UE 84.4 3 North Dayi VR 40.6 57 Atiwa ER 27.1 111 Birim North ER 14.3 165
East Gonja NR 84.2 4 Mpohor WR 40.4 58 Wassa Amenfi East WR 26.6 112 Bia west WR 14.3 166
Wa East UW 83.8 5 Offinso Municipal AR 40.0 59 Akatsi North VR 26.5 113 Techiman Municipal BA 14.2 167
Sissala West UW 81.2 6 Saboba NR 39.7 60 Asante Akim North AR 26.3 114 Ahafo Ano South AR 14.1 168
Bole NR 79.4 7 Ho West VR 39.6 61 Wassa East WR 25.7 115 Juabeso WR 13.9 169
Kintampo South BA 78.3 8 Jasikan VR 39.1 62 Upper West Akyem ER 25.6 116 Asunafo South BA 13.9 170
Banda BA 78.0 9 Akyem Mansa ER 38.8 63 Agona East CR 25.4 117 Atwima Nwabiagya AR 13.3 171
Kpandai NR 76.9 10 Tain BA 38.2 64 South Tongu VR 25.4 118 Kasena Nankana West UE 13.1 172
Nandom UW 73.7 11 Tano South BA 38.0 65 Afigya Sekyere AR 25.2 119 Atwima Mponua AR 12.9 173
Daffiama Bussie UW 73.6 12 Bosome Freho AR 37.6 66 Bia East WR 24.7 120
Sekondi Takoradi
Metropolis WR 12.9 174
Lawra UW 73.5 13 Afadzato South VR 36.9 67 Tamale Metropolis NR 24.6 121 Effutu Municipal CR 12.3 175
Lambussie Karni UW 72.6 14 Kwahu East ER 36.6 68 Assin North Municipal CR 24.4 122 Asunafo North Municipal BA 12.0 176
Jirapa UW 71.4 15 Nkoranza South BA 36.1 69 Kasena Nankana East UE 24.2 123 Ajumako-Enyan-Essiam CR 11.7 177
Mamprugu Moagduri NR 71.2 16 Zabzugu NR 36.0 70 Asikuma-Odoben Brakwa CR 24.0 124
Asante Akim Central
Municipal AR 11.5 178
Nadowli-Kaleo UW 68.5 17 Gushiegu NR 35.7 71 Assin South CR 23.6 125 Dormaa Municipal BA 11.4 179
Bawku West UE 68.1 18 Wa Municipal UW 35.5 72 Ketu North VR 23.5 126 Ada West GAR 11.1 180
Bongo UE 67.4 19 Asutifi North BA 35.4 73 Sekyere Central AR 22.8 127 West Akim Municipal ER 11.0 181
Kadjebi VR 66.8 20 Dormaa East BA 35.3 74 Birim Municipal ER 22.8 128
Sefwi Bibiani-Ahwiaso
Bekwai WR 10.8 182
Nabdam UE 63.0 21 Chereponi NR 34.7 75 Gomoa West CR 22.6 129 East Akim Municipal ER 10.6 183
Sawla-Tuna-Kalba NR 62.5 22 Nanumba South NR 33.9 76 Asante Akim South AR 22.0 130 Akatsi South VR 10.5 184
Agotime Ziope VR 62.1 23 Ewutu Senya CR 33.6 77 Ho Municipal VR 21.9 131 Ga Central Municipal GAR 10.1 185
Gonja Central NR 61.2 24 Central Tongu VR 33.4 78 Adansi South AR 21.9 132 Adenta Municipal GAR 10.1 186
Kwahu Afram Plains
South ER 59.7 25 Atebubu Amantin BA 33.3 79 Shama WR 21.7 133 Dormaa West BA 9.9 187
Sekyere Afram Plains
North AR 59.6 26 Kpando Municipal VR 32.4 80 Sefwi Akontombra WR 21.4 134 Amansie West AR 9.6 188
Talensi UE 56.5 27 Karaga NR 32.3 81 Asutifi South BA 21.3 135 Ga West Municipal GAR 8.9 189
Shai Osudoku GAR 55.1 28 Kumbumgu NR 32.3 82 Ejisu Juaben Municipal AR 20.9 136 Aowin WR 8.9 190
Bunkpurugu Yonyo NR 54.8 29 Yendi Municipal NR 32.2 83 Tano North BA 20.8 137 Tema Metropolis GAR 8.7 191
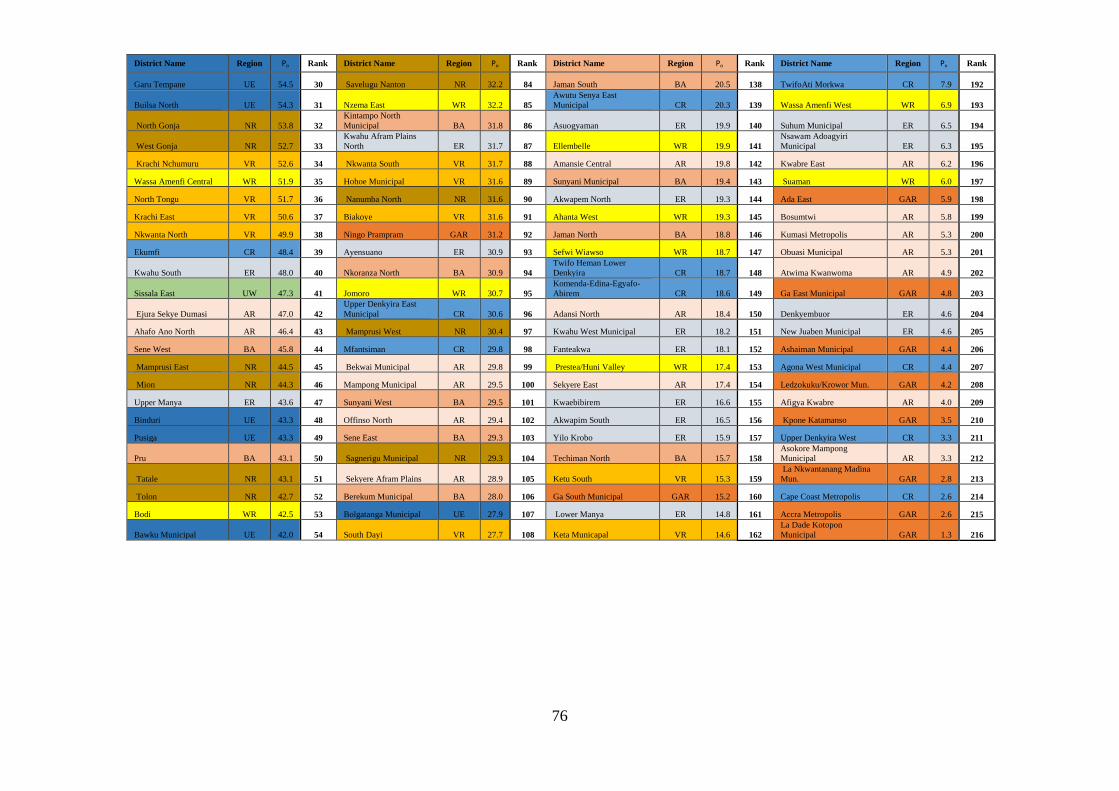
76
District Name Region Po Rank District Name Region Po Rank District Name Region Po Rank District Name Region Po Rank
Garu Tempane UE 54.5 30 Savelugu Nanton NR 32.2 84 Jaman South BA 20.5 138 TwifoAti Morkwa CR 7.9 192
Builsa North UE 54.3 31 Nzema East WR 32.2 85
Awutu Senya East
Municipal CR 20.3 139 Wassa Amenfi West WR 6.9 193
North Gonja NR 53.8 32
Kintampo North
Municipal BA 31.8 86 Asuogyaman ER 19.9 140 Suhum Municipal ER 6.5 194
West Gonja NR 52.7 33
Kwahu Afram Plains
North ER 31.7 87 Ellembelle WR 19.9 141
Nsawam Adoagyiri
Municipal ER 6.3 195
Krachi Nchumuru VR 52.6 34 Nkwanta South VR 31.7 88 Amansie Central AR 19.8 142 Kwabre East AR 6.2 196
Wassa Amenfi Central WR 51.9 35 Hohoe Municipal VR 31.6 89 Sunyani Municipal BA 19.4 143 Suaman WR 6.0 197
North Tongu VR 51.7 36 Nanumba North NR 31.6 90 Akwapem North ER 19.3 144 Ada East GAR 5.9 198
Krachi East VR 50.6 37 Biakoye VR 31.6 91 Ahanta West WR 19.3 145 Bosumtwi AR 5.8 199
Nkwanta North VR 49.9 38 Ningo Prampram GAR 31.2 92 Jaman North BA 18.8 146 Kumasi Metropolis AR 5.3 200
Ekumfi CR 48.4 39 Ayensuano ER 30.9 93 Sefwi Wiawso WR 18.7 147 Obuasi Municipal AR 5.3 201
Kwahu South ER 48.0 40 Nkoranza North BA 30.9 94
Twifo Heman Lower
Denkyira CR 18.7 148 Atwima Kwanwoma AR 4.9 202
Sissala East UW 47.3 41 Jomoro WR 30.7 95
Komenda-Edina-Egyafo-
Abirem CR 18.6 149 Ga East Municipal GAR 4.8 203
Ejura Sekye Dumasi AR 47.0 42
Upper Denkyira East
Municipal CR 30.6 96 Adansi North AR 18.4 150 Denkyembuor ER 4.6 204
Ahafo Ano North AR 46.4 43 Mamprusi West NR 30.4 97 Kwahu West Municipal ER 18.2 151 New Juaben Municipal ER 4.6 205
Sene West BA 45.8 44 Mfantsiman CR 29.8 98 Fanteakwa ER 18.1 152 Ashaiman Municipal GAR 4.4 206
Mamprusi East NR 44.5 45 Bekwai Municipal AR 29.8 99 Prestea/Huni Valley WR 17.4 153 Agona West Municipal CR 4.4 207
Mion NR 44.3 46 Mampong Municipal AR 29.5 100 Sekyere East AR 17.4 154 Ledzokuku/Krowor Mun. GAR 4.2 208
Upper Manya ER 43.6 47 Sunyani West BA 29.5 101 Kwaebibirem ER 16.6 155 Afigya Kwabre AR 4.0 209
Binduri UE 43.3 48 Offinso North AR 29.4 102 Akwapim South ER 16.5 156 Kpone Katamanso GAR 3.5 210
Pusiga UE 43.3 49 Sene East BA 29.3 103 Yilo Krobo ER 15.9 157 Upper Denkyira West CR 3.3 211
Pru BA 43.1 50 Sagnerigu Municipal NR 29.3 104 Techiman North BA 15.7 158
Asokore Mampong
Municipal AR 3.3 212
Tatale NR 43.1 51 Sekyere Afram Plains AR 28.9 105 Ketu South VR 15.3 159
La Nkwantanang Madina
Mun. GAR 2.8 213
Tolon NR 42.7 52 Berekum Municipal BA 28.0 106 Ga South Municipal GAR 15.2 160 Cape Coast Metropolis CR 2.6 214
Bodi WR 42.5 53 Bolgatanga Municipal UE 27.9 107 Lower Manya ER 14.8 161 Accra Metropolis GAR 2.6 215
Bawku Municipal UE 42.0 54 South Dayi VR 27.7 108 Keta Municapal VR 14.6 162
La Dade Kotopon
Municipal GAR 1.3 216
77